Abstract
Liposomes are emerging therapeutic formulations for site-specific delivery of chemotherapeutic drugs. The efficiency and selectivity of drug delivery by these carriers largely rely on their surface properties, shape, and size. There is a growing demand for analytical approaches that can be used for structural and morphological characterization of liposomes at the single-vesicle level. AFM-IR is a modern optical nanoscopic technique that combines the advantages of scanning probe microscopy and infrared spectroscopy. Our findings show that AFM-IR can be used to probe conformational changes in phospholipids that take place upon their assembly into liposomes. Such conclusions can be made based on the corresponding changes in intensities of the lipid vibrational bands as the molecules transition from a solid state into large unilamellar vesicles (LUVs). This spectroscopic analysis of LUV formation together with density functional theory calculations also reveals the extent to which the molecular conformation and local environment of the functional groups alter the AFM-IR spectra of phospholipids. Using melittin as a test protein, we also examined the extent to which LUVs can be used for protein internalization. We found that melittin enters LUVs nearly instantaneously, which protects it from possible structural modifications that are caused by a changing environment. This foundational work empowers AFM-IR analysis of liposomes and opens new avenues for determination of the molecular mechanisms of liposome—drug interactions.
Graphical Abstract
INTRODUCTION
Lipids are amphiphilic molecules with hydrophobic tails and polar heads. In aqueous solvents, lipids self-assemble into liposomes with one (unilamellar vesicles) or several (multilayer vesicles) lipid bilayers. Depending on the size of the vesicles, unilamellar vesicles are divided into small (<100 nm), large (100–500 nm), and giant (>5 μm) liposomes.1,2 Large unilamellar vesicles (LUVs) demonstrate substantial stability at neutral pH while simultaneously possessing sufficient volume so that they can be occupied by physiologically active hydrophilic molecules.3,4 Furthermore, LUVs’ lipid composition can be easily customized, whereas their surface can be modified with a variety of ligands, including antibodies and carbohydrates.5,6 This allows the utilization of LUVs as a site-specific therapeutic formulation for therapeutic delivery.7 For instance, liposome-delivered cytarabine has recently been approved by the U.S. Food and Drug Administration for treatment of lymphomatous meningitis.8 This formulation enables site-specific cytarabine delivery, lowering the side effects of drug administration.
The efficiency of such formulations directly depends on the lipid composition, uniformity, size, and shape of LUVs. Dynamic light scattering, high-pressure liquid chromatography, nuclear magnetic resonance, and capillary electrophoresis are commonly used to determine these important physical parameters of LUVs.2,9–11 However, these techniques probe the bulk volume of liposomes. The use of flow cytometry and the corresponding fluorescent dyes offer single-vesicle level of LUV analysis.12,13 However, flow cytometry can provide very little—if any—information about the structure and composition of LUVs. These limitations can be overcome by the use of atomic force microscopy coupled to infrared (AFM-IR) spectroscopy.7,14 In AFM-IR, a metalized scanning probe is positioned above the sample of interest, which is illuminated by a pulsed tunable IR laser.15,16 The light causes thermal expansions in the specimens that are recorded by the scanning probe.17,18 A growing body of evidence suggests that AFM-IR can be used to reveal the lipid structure and composition on the level of individual liposomes.7,19 Furthermore, AFM-IR can be used to determine the localization and concentration of molecules of interest in liposomes.19 These findings suggest that AFM-IR can be utilized as a high-throughput screening tool of liposome-based formulations.
A growing body of evidence suggests that AFM-IR could be used to investigate the interactions between lipids and proteins.20–24 Specifically, Dou and co-workers discovered that lipids uniquely altered the secondary structure of α-synuclein oligomers formed at the early and late stages of protein aggregation.24,25 AFM-IR analysis of these aggregates revealed the presence of lipids in their structure. Similar findings were recently reported by Rizevsky and co-workers for insulin oligomers that were formed in the presence of phospholipids.23 In particular, it was found that lipids could not only alter the secondary structure of insulin aggregates but also change their toxicity.23
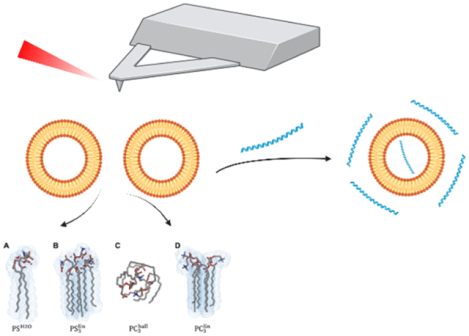
The question to ask is whether AFM-IR can be used to monitor liposome assembly and probe conformation transitions that take place in lipids upon their assembly into LUVs. In this study, we analyzed infrared spectra of solid phosphatidylcholine (PC) and phosphatidylserine (PS) together with the corresponding spectra of these phospholipids in the LUVs. We observed drastic changes in intensities of the vibrational bands of the lipid in these two physical states. Density functional theory (DFT) and semiempirical calculations allowed linking these spectral changes to conformational rearrangements of lipid molecules, while intermolecular interactions with the aqueous environment as well as the lipid’s tendency to self-assemble were assessed using a semiempirical tight-binding approach. The synergy of these findings suggests that AFM-IR can be used to monitor the self-assembly of phospholipids in LUVs. Furthermore, our results also help us to understand the underlying molecular nature of lipid interactions with physiologically active molecules.
EXPERIMENTAL SECTION
Materials.
1,2-Dimyristoyl-sn-glycero-3-phosphocholine (DMPC or PC) and 1,2-dimyristoyl-sn-glycero-3-phosphoserine (DMPS or PS) were purchased from Avanti (Alabaster, AL, USA). Melittin and YAP–TEAD peptides were purchased from Sigma-Aldrich Inc. (St. Louis, MO) and Fisher Scientific Inc. (Hampton, NH), respectively. For LUV preparation, 0.6 mg PC and PS were dissolved in 2.6 mL of phosphate buffered saline (PBS), pH 7.4. Next, the suspensions of PC and PS were heated to ~50 °C in a water bath for 30 min and then cooled in liquid nitrogen for 3–5 min26 This procedure was repeated 10 times. After this, PC and PS suspensions were passed 15 times through a 100 nm membrane that was placed into the extruder (Avanti, Alabaster, AL, USA).
Peptide and Liposome Interaction.
The peptide samples were incubated in the DMPS liposome for 2, 5, and 10 min. 2 μL aliquots of the samples were loaded on a silicon substrate, dried at room temperature for 10 min, rinsed with DI water, and then dried in N2 flow to avoid the crowding observed in AFM. The samples were sonicated for 5–10 s before deposition. For deuterium labeling, the aliquots of samples were diluted 10 times in deuterium oxide (D2O) and kept in D2O for 15 min at 37 °C and shaken at 500 rpm.
AFM Imaging.
AFM imaging was performed using silicon AFM probes, with related parameters of force constant of 2.7 N/m and resonance frequency of 50–80 kHz, purchased from AppNano (Mountain View, CA, USA) on the AIST-NT-HORIBA system (Edison, NJ). The analysis of collected images was performed using AIST-NT software (Edison, NJ, USA).
AFM-IR Imaging.
AFM-IR imaging was conducted using a Nano-IR3 system (Bruker, Santa Barbara, CA, USA). The IR source was a QCL laser. Contact-mode AFM tips (ContGB-G AFM probe, NanoAndMore, Watsonville, CA, USA) were used to obtain all spectra and chemical maps. Treatment and analysis of collected spectra were performed in MATLAB (The Mathworks, Inc. Natick, Massachusetts, USA). Three spectra were collected for each particle. Each spectrum is co-averaged from five measurements. Spectra were smoothed using Savitzky–Golay with a polynomial of second order, and then the area was normalized using MATLAB R2020b add-on PLS_Toolbox 8.6.2 (Eigenvector Research Inc.).
Dynamic Light Scattering.
DLS measurements were performed on the DynaPro NanoStar Wyatt (Woburn, MA) system. For each measurement, a sample aliquot was placed into a glass cell. Three measurements were made for each sample.
Quantum Chemical Simulations.
Fully optimized equilibrium structures of PS and PC were obtained at the DFT level of theory. Explicit and implicit solvent stabilization were assessed for PS, denoted . Vibrational spectra were simulated at the same level of theory. Intermolecular interactions among the lipids (PS and PC) were evaluated based on trimeric structures, that is, a ball-like conformer (PC3ball) as well as stretched conformers (PC3lin and PS3lin). Trimer structures and vibrational spectra were obtained using GFN2-xTB.27 See the Supporting Information for more details regarding the computational protocol.
RESULTS AND DISCUSSION
Dynamic light scattering (DLS) analysis of PC and PS suspensions shows the presence of monodispersed vesicles with an average diameter of ~100 nm, Figure 1A,B. AFM and AFM-IR imaging of these vesicles revealed spherical liposomes that are ~2–5 nm in height and ~100 nm in diameter, Figure 1C–F.
Figure 1.
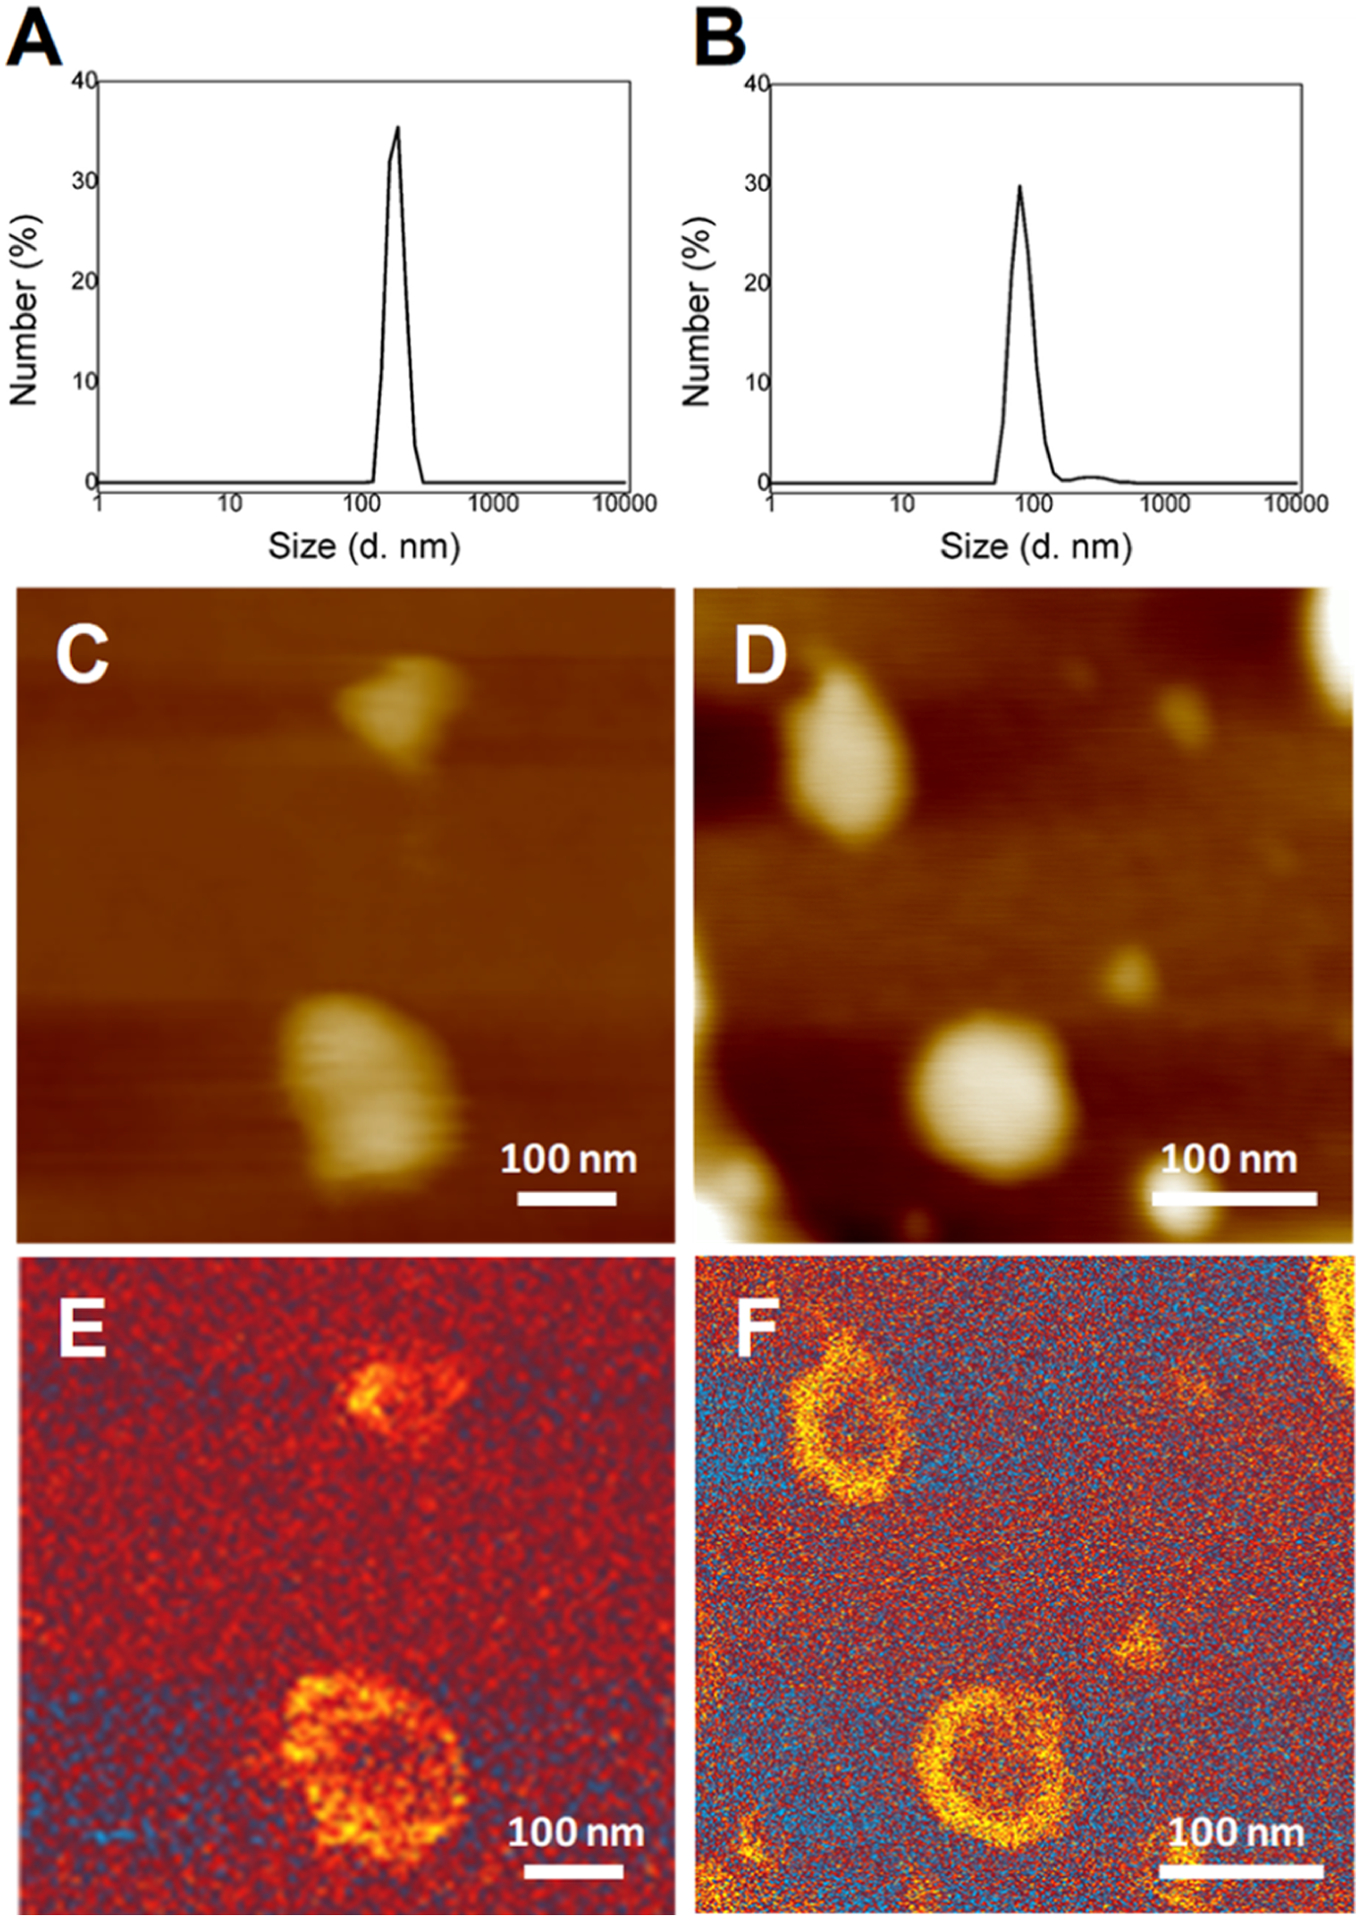
Biophysical characterization of PC and PS LUVs. DLS spectra of PC (A) and PS (B) suspensions; AFM and AFM-IR images of PC [(C,E) respectively] and PS LUVs [(D,F), respectively].
Spectroscopic analysis of PC LUVs reveals vibrations that can be assigned to carbonyl (1732 cm−1), CH2 scissoring, wagging, and rocking modes, as well as P–O–C, PO4, and NMe3 vibrations of PC’s polar heads, Figure 2 and Table 1. It should be noted that intensities of these vibrational bands are different in the corresponding spectrum of solid PC. Specifically, we have found that carbonyl (1736 cm−1) vibrations, as well as νPO + δ NMe3 vibrations, were found to be more intense in the spectrum of solid PC, whereas intensities of P–O–C vibrations around 1000–1100 cm−1 were stronger in the spectrum of PC LUVs than in the solid state of PC.
Figure 2.
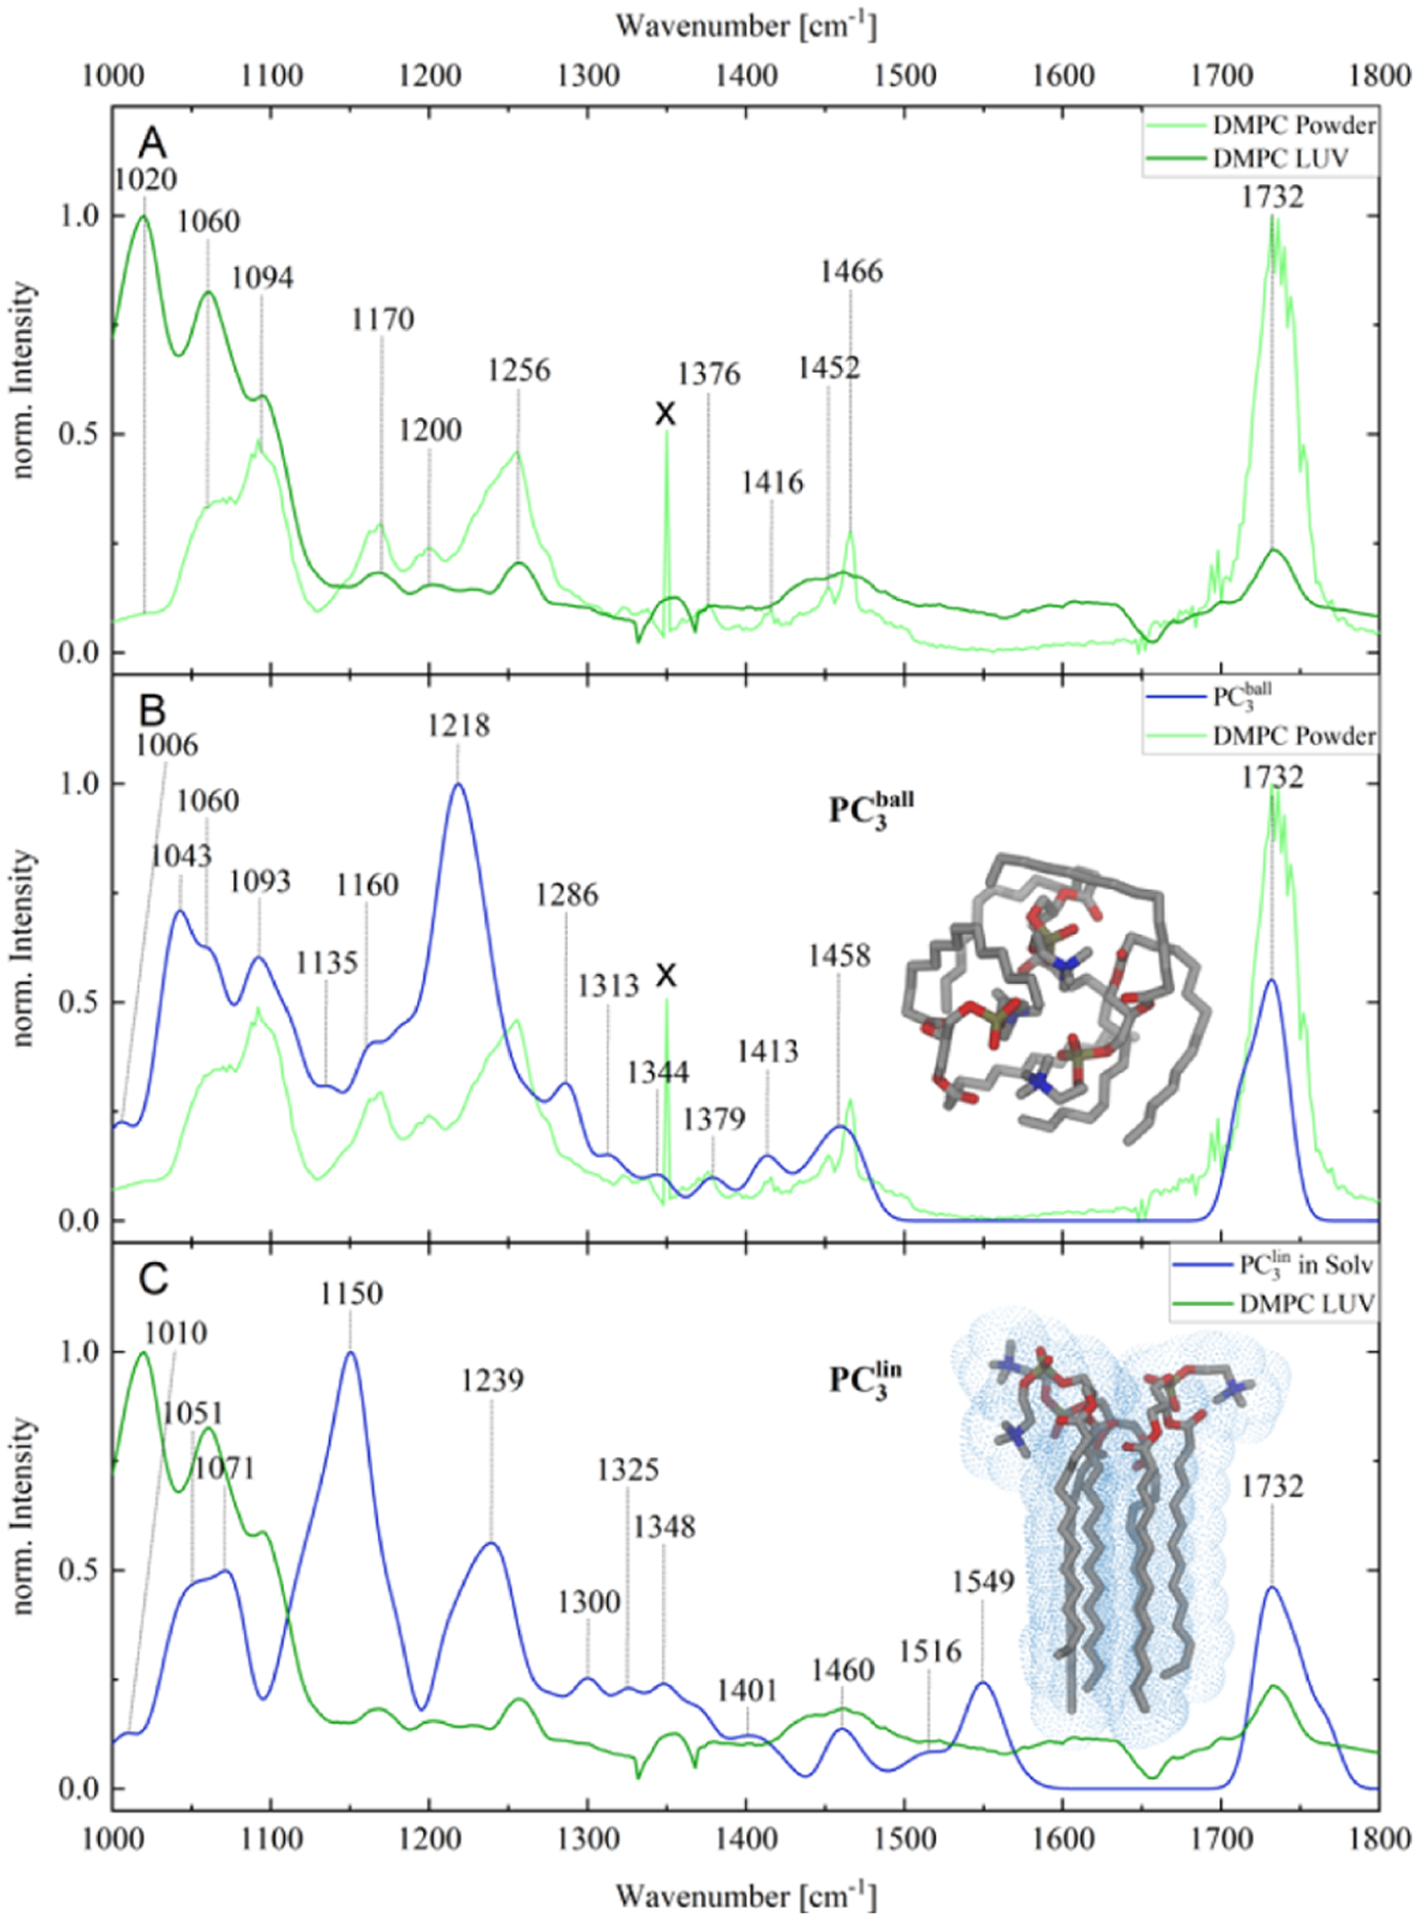
(A) AFM-IR spectroscopic characterization of solid (powder) and LUVs of PC; spectral artifact is marked by “x”. (B,C) Comparison and assignment of AFM-IR and simulated IR spectra for the ball-like conformer (PC3ball; intramolecular interactions) and stretched conformer (PC3lin). Fully optimized equilibrium structures are depicted as insets.
Table 1.
Simulated Prominent Vibrational Bands of the Two PC Structures, That Is, PC3ball and PC3lin Scaled by Factors of 0.977 and 1.036, Respectivelya
| PC (powder) | PC3ball | |
|---|---|---|
| exp. frequency [cm−1] | calc. frequency [cm−1] | character |
| 1732 | 1732 | νCO |
| 1466 | 1458 | δCH2 |
| 1416 | 1413 | δCH2–[PO4] |
| 1379 | 1379 | δCH3 |
| 1338 | 1344 | χ[NMe3]–CH2–CH2–[PO4] |
| 1313 | χCH2–[PO4] | |
| 1276 | 1286 | χ[O]–CH2–[O] |
| 1256 | 1218 | νasPO2[(OCH2)2] + δNMe3 |
| 1070 | 1160 | νCC[OO] + τCH2–[COO/CO] |
| 1135 | νCO[=O] + τCH2 | |
| 1094 | 1093 | νCC[O] + χCH3–[N] |
| 1060 | 1059 | χCH2 (whole lipid) |
| 1043 | χCH2 + νPO4 | |
| 1020 | 1006 | νasNMe3 + νCC |
| PC (LUV) | PC3lin | |
| exp. frequency [cm−1] | calc. frequency [cm−1] | character |
| 1732 | 1732 | vCO |
| 1549 | δCH2 | |
| 1516 | δCH3 | |
| 1460 | δCH2–[COO/O/N] | |
| 1401 | χCH2 | |
| 1356 | 1348 | χCH2 |
| 1326 | χCH2 | |
| 1300 | χCH2 | |
| 1256 | 1239 | νasPO2[(OCH2)2 + ρCH2 |
| 1170 | 1149 | νasOC[=O]C + νCOC + χCH |
| 1094 | 1071 | νsPO2[(OCH2)2] + δNMe3 + τCH2 |
| 1060 | 1050 | νsPO2[(OCH2)2] + δNMe3 + τCH2 |
| 1020 | 1011 | νCC[OO] + τCH2 |
Atoms in brackets indicate the localization of the mode.
AFM-IR analysis of PS LUVs and solid PS revealed similar changes in their infrared spectra (Figure 2 and Table 2). Specifically, we observed a decrease in the intensity of carbonyl as the lipid assembled into LUVs as well as a drastic increase in the intensity of P–O–C and PO vibrations.
Table 2.
Simulated Prominent Vibrational Bands of the Two PS Structures, That Is, PS3lin and Scaled by Factors of 1.033 and 0.944, Respectivelya
| DMPS (LUV) | PS3lin | |
|---|---|---|
| exp. frequency [cm−1] | calc. frequency [cm −1] | character |
| 1732 | 1806 | νCO |
| 1766 | νCO | |
| 1732 | νCO | |
| 1608 | 1602 | δCH2–[OP] |
| 1570 | 1575 | δNH2 |
| 1545 | δCH2 | |
| 1480 | δCH2–[O] | |
| 1462 | δCH2–[COO] + δCH3 | |
| 1395 | χCH2–[OP] | |
| 1369 | χCH2–[COO/O] | |
| 1306 | 1324 | νCO[=O][H] + τCH2 |
| 1307 | νPO[Na] + τCH2 | |
| 1248 | 1268 | ρCH2 |
| 1248 | νasOPO[Na] + τCH2 | |
| 1188 | 1187 | νCOC + ρCH2 |
| 1139 | νCC | |
| 1100 | 1111 | νPO + νCC + νC–O |
| 1042 | 1068 | νsOPO[Na] + χNH2 |
| 1010 | νCC/χCH2 + νC–O | |
| DMPS (LUV) | ||
| exp. Frequency [cm−1] | simulated frequency [cm−1] | vibration |
| 1732 | 1751 | νCO |
| 1732 | νCO | |
| 1540 | δH2O | |
| 1518 | 1520 | δNH2 |
| 1378 | 1387 | δHOC[O] + δCH2–[PO4/NH2/COOH] |
| 1306 | 1333 | δHOC[O] + χCH2–[PO4/NH2/COOH] |
| 1282 | χCH2 | |
| 1248 | 1254 | χCH2 + τCH2 |
| 1220 | 1226 | νasPO4 + τCH2 |
| 1188 | 1182 | χCH2 + τCH2–[O] |
| 1100 | 1093 | νasOCCN |
| 1042 | 1061 | νCO[PO] + χCH2 |
| 1040 | νsPO4 + νCC | |
Atoms in brackets indicate the localization of the mode.
To further evaluate the structure–property relationship, as well as to elucidate the nature of vibrational modes underlying the respective IR absorption bands, we performed quantum chemical simulations on a series of conformers of PC and PS (Figures 2 and 3). To this aim, the impact of intermolecular interactions between the lipids, for example, by virtue of the stretched conformer (PC3lin and PS3lin), as well as between the PS and the aqueous environment (), was evaluated with respect to intramolecular interactions and formation of the ball-like conformer scenario (PC3ball).
Figure 3.
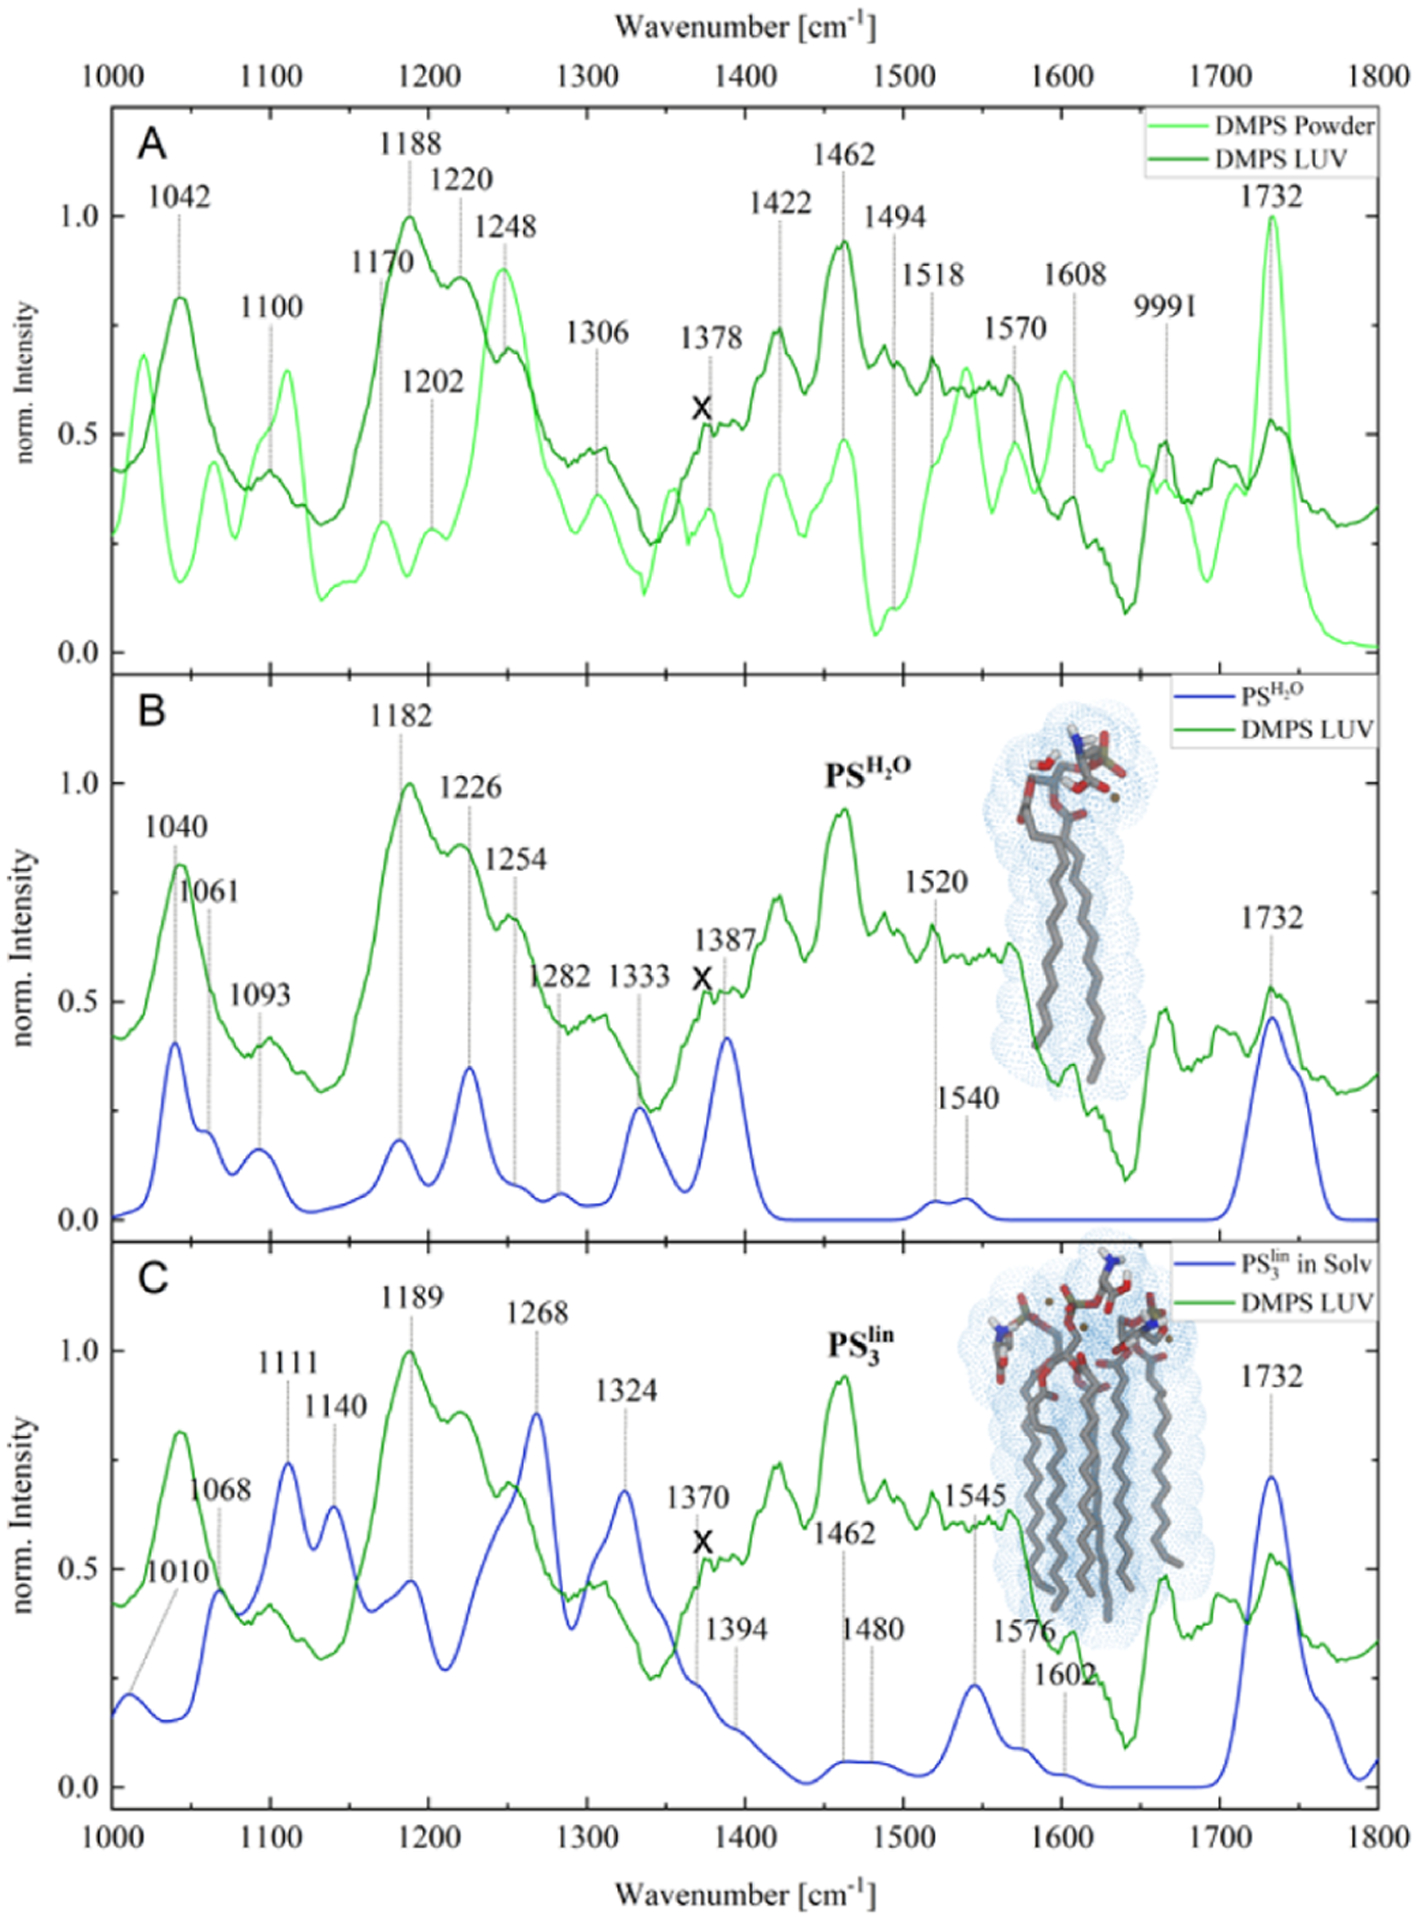
(A) AFM-IR spectroscopic characterization of solid (powder) and LUVs of PS; spectral artifact is marked by “x”. (B,C) Comparison and assignment of AFM-IR and simulated IR spectra for the solvated () and stretched conformer (PS3lin). Fully optimized equilibrium structures are depicted as insets.
In the case of PC powder, the simulated spectral signature, as given by the ball-like model PC3ball, is in good agreement with the experimental reference data. However, the overlap of the experimental reference data with the predicted IR pattern of PC3lin is considerably less prominent, see Figure 2B,C. Furthermore, PC3ball is predicted to be substantially more stable by approximately 370 kJ/mol (3.82 eV) than the linear conformer PC3lin. This suggests that the powder of PC is dominated by ball-like conformers. Such highly disordered structures can be described sufficiently by our computational model system (PC3ball). In a similar fashion, spectroscopic changes that take place upon formation of the LUVs were investigated by a linear conformer scenario of PC that comprises three lipid molecules (PC3lin). At first glance, our simulations do not allow unambiguous assignment of lipid conformations in such micelle-like structures (Figure 2C). This suggests that intermolecular interactions of the lipid tail within a micelle are not fully addressed at the given computational level. At this moment, an extension of the molecular structure and/or of the applied level of theory is computationally unfeasible. A further explanation of the minor spectral overlap in case of the LUV might be the impact of pre-orientation, which would lead to a scenario where the AFM-IR spectra are dominated by one component of the derivative of the dipole moment (μi) with respect to the lth normal mode (∂μ/∂Rl). However, this merely alters the intensity pattern of normal modes obtained for the investigated model systems, yet the absence of vibrational modes in the frequency region between 1300 and 1700 cm−1 can only be overcome by an enlarged model system and the description of further intermolecular interactions among the lipids, see Figure S2.
In a similar fashion, we analyzed spectral changes that are associated with the formation of LUVs by PS. For this, the spectrum of PS was calculated under aqueous conditions by placing a single water molecule in the vicinity of −COOH and −NH2 moieties of the previously optimized PS molecule. Additionally, implicit solvent effects were incorporated. The simulated IR pattern, as obtained by this model system, denoted as , as well as based on the stretched trimeric structure (PS3lin), yields merely a reasonable agreement with the experimental LUV data for PS. Therefore, this decorrelation further suggests that three lipid molecules cannot mimic the complex intermolecular interactions within a micelle sufficiently. In a similar fashion, as shown for PC, orientational effects were considered for the PS3lin model system, see Figure S3. However, the modulation of IR intensities does not enhance the overlap of the computational spectra with respect to the LUV data.
The performed quantum chemical simulations allow the assignment of vibrational normal modes underlying the experimental AFM-IR bands, see Tables 1 and 2 for PS and PC, respectively. In general, a reasonable agreement between the experimental and computational data is obtained within the frequency range of 1000–1200 cm−1, while deviations are within 26 cm−1. However, the assignment of the vibrational bands within the frequency window of 1300–1700 cm−1 to specific vibrational modes of PS3lin, PC3lin, and is less accurate. This is expected because vibrational bands present in this frequency range originate from CH2-deformations, which, in turn, originate from fatty acid tails. As was discussed above, the current level of computation simulations is not sufficient for highly accurate predictions of the interactions among the aliphatic tails of various lipids in LUVs.
Expanding upon these findings, we examined whether such LUVs internalize peptides present in solution, as well as the extent to which such internalization minimizes the effects of the changing environment around the LUVs. To answer these questions, we mixed PS LUVs with melittin, an α-helical protein that can permeabilize cell membranes.28 Right after the peptide and LUVs were mixed, we observed LUV crowding occurring in the presence of melittin, Figure 6. The sonicated sample aliquot was deposited onto the Si surface and analyzed by AFM-IR, Figure 4. We found that all acquired spectra exhibit the above-described lipid vibrations, as well as strong amide I (1600–1700 cm−1) and amide II (1500–1600 cm−1) vibrations. This indicates that melittin is present in the LUVs.
Figure 6.
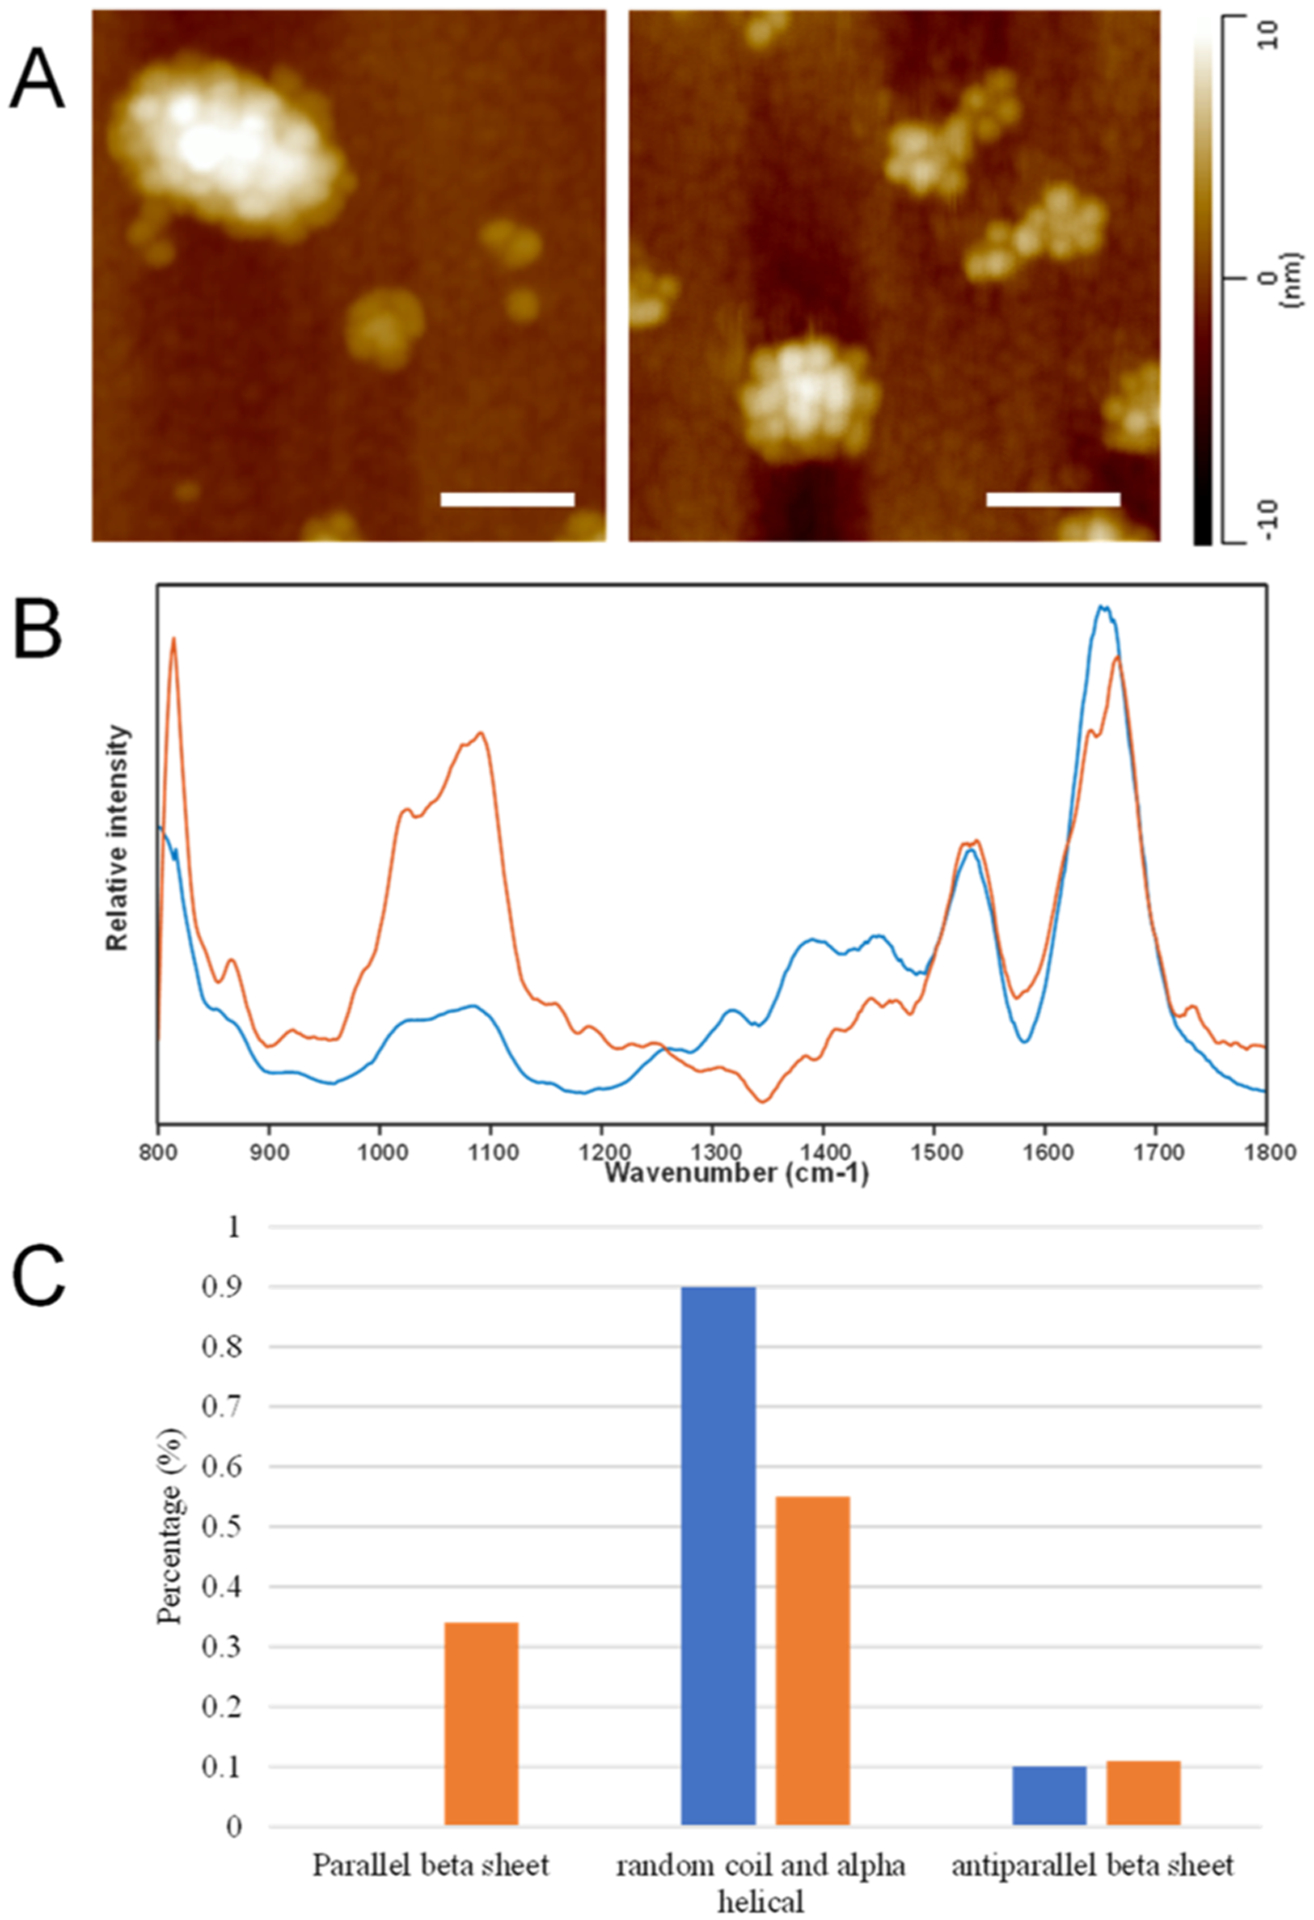
AFM images of crowded LUVs formed in the presence of melittin (A) and AFM-IR spectra collected from individual LUVs (blue) and LUV conglomerates (orange) (B). Histogram of changes in the protein secondary structure of melittin present in individual LUVs and LUV conglomerates (C). Scale bar is 200 nm.
Figure 4.
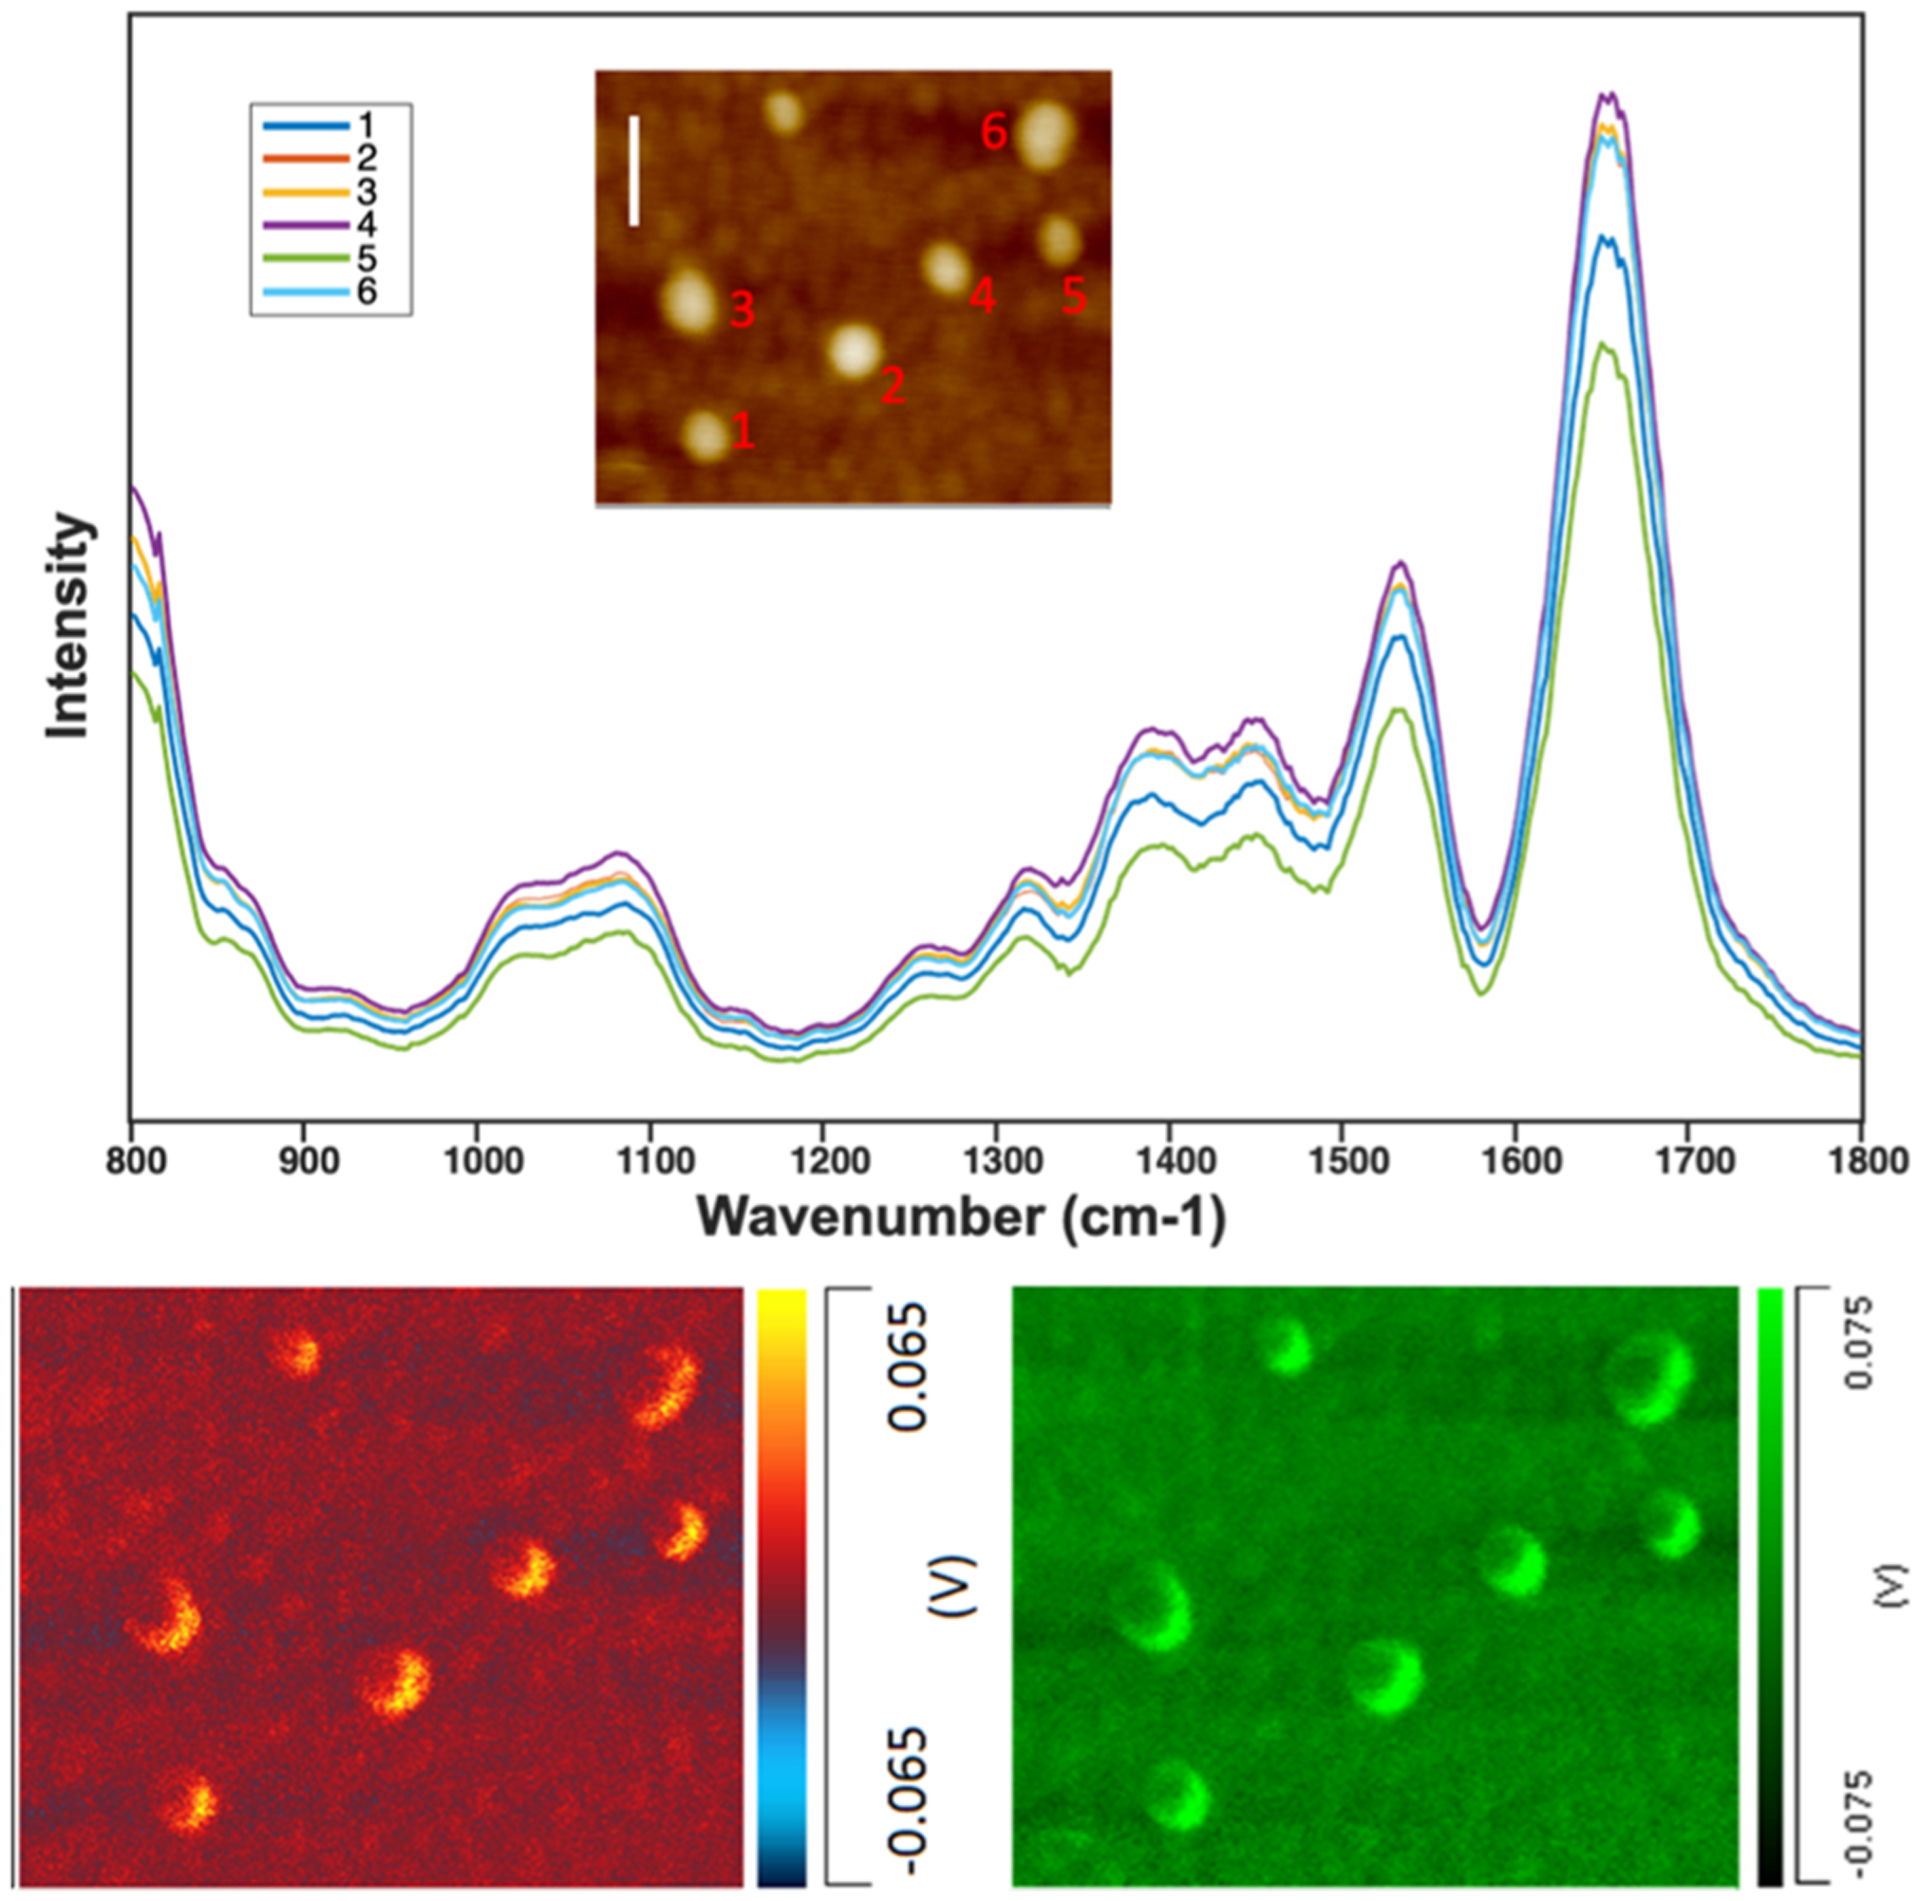
AFM-IR spectra (top) acquired from individual melittin-containing PC LUVs and the corresponding AFM-IR images (bottom) of these LUVs acquired at 1100 cm−1 (red) and 1660 cm−1 (green) that demonstrate the presence of lipids and protein in the LUVs, respectively. Scale bar is 200 nm.
Next, we exposed the solution of pre-mixed melittin and LUVs to deuterium oxide (D2O) to determine whether the internalized protein can undergo hydrogen–deuterium exchange (HDX). HDX is a well-established technique for studying protein higher-order structures in solution.29 It was previously demonstrated by MALDI-HDX-MS that the liposome membrane protects melittin from hydrogen–deuterium exchange upon melittin internalization into the liposome.28 We observed no changes in the AFM-IR spectra of melittin-loaded LUVs that could be indicative of the peptide HDX, Figure 5. These results suggest that LUVs strongly protect the internalized protein from the altered exterior environment.
Figure 5.
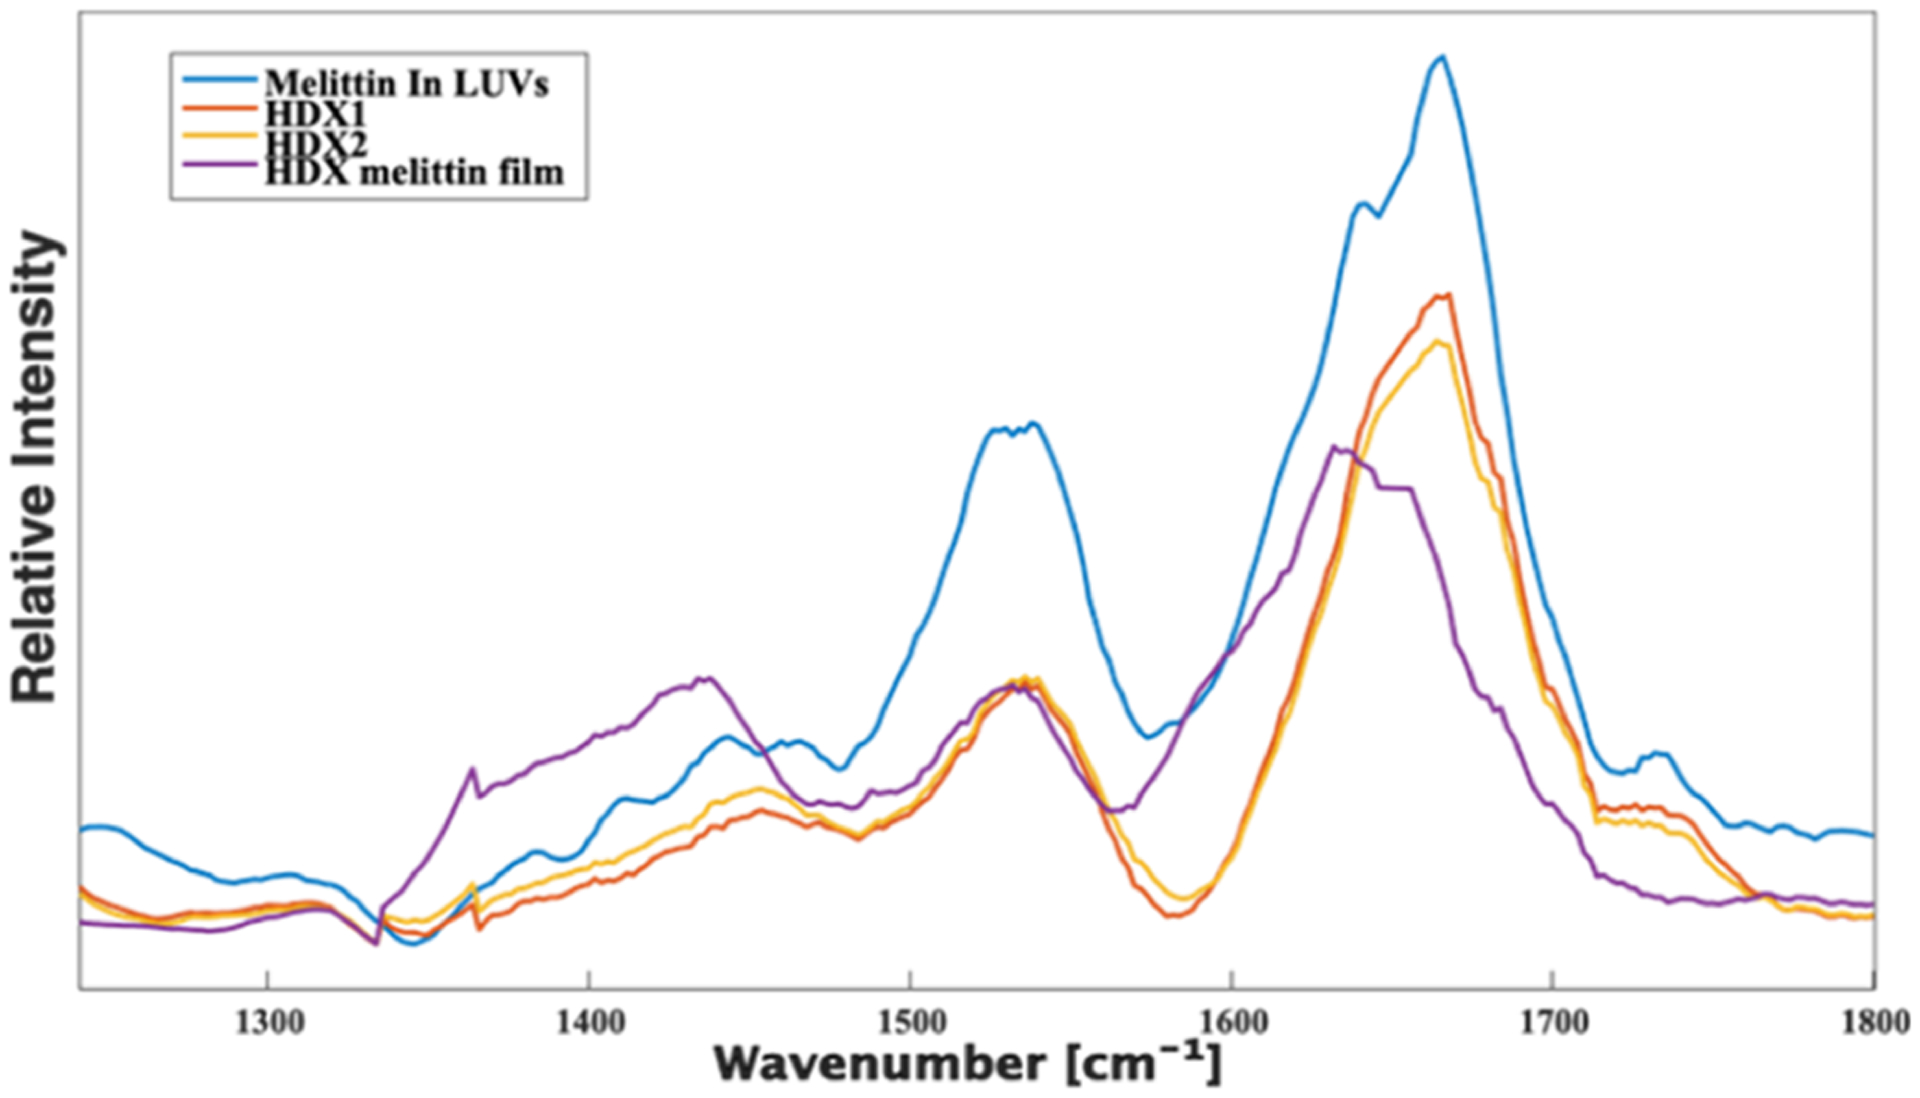
AFM-IR spectra collected from intact melittin-loaded LUVs (blue), LUVs after HDX (red and yellow), as well as melittin after HDX (purple).
Finally, we investigated the extent to which LUV-induced crowding can alter the conformation of melittin. For this, we analyzed conglomerates of LUVs that were formed in the presence of melittin, Figure 6A. Unlike melittin, another peptide, YAP–TEAD-IN-1, has not been previously reported to have passive membrane permeability. We did not observe the crowding appear in the DMPC-YAP–TEAD peptide mixture, Figures S5 and 6. Our results show that LUV-induced crowding alters the secondary structure of melittin, Figure 6B,C, as well as Figure S4. Specifically, we observed major changes in the amide I band that indicate a reduction in the α-helix/unordered protein secondary structure content and an increase in the amount of parallel β-sheets. These results are in good agreement with previously reported conformational analysis of melittin.30,31 Based on these results, one can conclude that LUV conglomeration can trigger conformational changes in the loaded proteins.
These findings are in good agreement with the results that were reported recently by the Kurouski group.24,25 Specifically, Dou and co-workers previously demonstrated that PC and PS uniquely altered the secondary structure of α-synuclein aggregates,24,25 whereas Rizevsky and co-workers found that the presence of these lipids upon insulin aggregation results in the formation of structurally and morphologically different fibrils.21–23 Furthermore, such fibrils exerted significantly lower cell toxicity compared to the insulin aggregates grown in the lipid-free environment.32,33
CONCLUSIONS
In summary, our results revealed spectroscopic changes that take place upon the assembly of phospholipids into LUVs. We showed major changes in the intensities of carbonyl, P–O–C, PO4, and NMe3 vibrations. Specifically, the intensity of the carbonyl vibration decreased, whereas the intensities of P–O–C, PO4, and NMe3 increased. Our computational simulations showed that these changes are associated with transformations in the phospholipid conformation. Specifically, the lipids transition from a ball-like structure that dominates in the powder to the linear structure that the lipid occupies in the LUVs. We also expect that the performed detailed assignment of the vibrational bands can be used as a reference by other researchers that utilize vibrational spectroscopy to reveal the structural organization of lipids and LUVs, as well as the dynamics of solids to LUV transitions. We also demonstrated the potential of PC LUVs in protein internalization as well as strong protection of the internalized melittin against HDX. These findings suggest that LUVs can be utilized as potential carriers of large-molecular-weight drugs.
Supplementary Material
ACKNOWLEDGMENTS
We are grateful to the National Institute of Health for financial support (R35GM142869).
Footnotes
Supporting Information
The Supporting Information is available free of charge at https://pubs.acs.org/doi/10.1021/acs.analchem.2c03061.
Detailed description of calculation approaches; fully optimized relaxed structures of the previously optimized lipids PS and PC; AFM-IR spectroscopic characterization of PC in LUV conformer; AFM-IR spectroscopic characterization of PS in LUV conformer; fitted amide I regions of AFM-IR spectra of melittin-loaded PC LUVs; AFM image of DMPC LUVs in the presence of YAP-tead-IN-1 protein; and AFM-IR spectra collected from YAP film and isolated DMPC LUVs (PDF)
Complete contact information is available at: https://pubs.acs.org/10.1021/acs.analchem.2c03061
The authors declare no competing financial interest.
Contributor Information
Tianyi Dou, Department of Biochemistry and Biophysics, Texas A&M University, College Station, Texas 77843, United States.
Clara Zens, Institute of Physical Chemistry, Friedrich Schiller University Jena, 07743 Jena, Germany.
Katrin Schröder, Institute of Physical Chemistry, Friedrich Schiller University Jena, 07743 Jena, Germany.
Yuan Jiang, Merck & Company Inc., MRL, Analytical Research & Development, Boston, Massachusetts 02115, United States;.
Alexey A. Makarov, Merck & Company Inc., MRL, Analytical Research & Development, Boston, Massachusetts 02115, United States;
Stephan Kupfer, Institute of Physical Chemistry, Friedrich Schiller University Jena, 07743 Jena, Germany;.
Dmitry Kurouski, Department of Biochemistry and Biophysics, Texas A&M University, College Station, Texas 77843, United States; Department of Biomedical Engineering, Texas A&M University, College Station, Texas 77843, United States;.
REFERENCES
- (1).Kreutzberger MA; Tejada E; Wang Y; Almeida PF Biophys. J 2015, 108, 2619–2622. [DOI] [PMC free article] [PubMed] [Google Scholar]
- (2).Bulbake U; Doppalapudi S; Kommineni N; Khan W Pharmaceutics 2017, 9, 12. [DOI] [PMC free article] [PubMed] [Google Scholar]
- (3).Tamba Y; Tanaka T; Yahagi T; Yamashita Y; Yamazaki M Biochim. Biophys. Acta 2004, 1667, 1–6. [DOI] [PubMed] [Google Scholar]
- (4).Wu IY; SŠkalko-Basnet N; di Cagno M. Colloids Surf., B 2017, 157, 65–71. [DOI] [PubMed] [Google Scholar]
- (5).Zong W; Li Q; Zhang X; Han X Colloids Surf., B 2018, 172, 459–463. [DOI] [PubMed] [Google Scholar]
- (6).Zong W; Shao X; Chai Y; Wang X; Han S; Chu H; Zhu C; Zhang X Biophys. Chem 2022, 281, 106728. [DOI] [PubMed] [Google Scholar]
- (7).Wieland K; Ramer G; Weiss VU; Allmaier G; Lendl B; Centrone A Nano Res. 2019, 12, 197–203. [DOI] [PMC free article] [PubMed] [Google Scholar]
- (8).Pillai G SOJ Pharm. Pharm. Sci 2014, 1, 13. [DOI] [PMC free article] [PubMed] [Google Scholar]
- (9).Ohnishi N; Yamamoto E; Tomida H; Hyodo K; Ishihara H; Kikuchi H; Tahara K; Takeuchi H Int. J. Pharm 2013, 441, 67–74. [DOI] [PubMed] [Google Scholar]
- (10).Zhang XM; Patel AB; de Graaf RA; Behar KL Chem. Phys. Lipids 2004, 127, 113–120. [DOI] [PubMed] [Google Scholar]
- (11).Franzen U; Nguyen TT; Vermehren C; Gammelgaard B; Østergaard JJ Pharm. Biomed. Anal 2011, 55, 16–22. [DOI] [PubMed] [Google Scholar]
- (12).Chen CX; Zhu SB; Wang S; Zhang WQ; Cheng Y; Yan XM ACS Appl. Mater. Interfaces 2017, 9, 13913–13919. [DOI] [PubMed] [Google Scholar]
- (13).Jesorka A; Orwar O Annu. Rev. Anal. Chem 2008, 1, 801–832. [DOI] [PubMed] [Google Scholar]
- (14).Dazzi A; Prater CB Chem. Rev 2017, 117, 5146–5173. [DOI] [PubMed] [Google Scholar]
- (15).Centrone A Annu. Rev. Anal. Chem 2015, 8, 101–126. [DOI] [PubMed] [Google Scholar]
- (16).Ramer G; Aksyuk VA; Centrone A Anal. Chem 2017, 89, 13524–13531. [DOI] [PMC free article] [PubMed] [Google Scholar]
- (17).Kurouski D; Dazzi A; Zenobi R; Centrone A Chem. Soc. Rev 2020, 49, 3315–3347. [DOI] [PMC free article] [PubMed] [Google Scholar]
- (18).Dazzi A; Glotin F; Carminati RJ Appl. Phys 2010, 107, 124519. [Google Scholar]
- (19).Khanal D; Khatib I; Ruan J; Cipolla D; Dayton F; Blanchard JD; Chan HK; Chrzanowski W Anal. Chem 2020, 92, 9922–9931. [DOI] [PubMed] [Google Scholar]
- (20).Rizevsky S; Zhaliazka M; Dou T; Matveyenka M; Kurouski DJ Phys. Chem. C 2022, 126, 4157–4162. [DOI] [PMC free article] [PubMed] [Google Scholar]
- (21).Matveyenka M; Rizevsky S; Kurouski DJ Phys. Chem. Lett 2022, 13, 4563–4569. [DOI] [PMC free article] [PubMed] [Google Scholar]
- (22).Matveyenka M; Rizevsky S; Kurouski D FEBS Lett. 2022, 596, 1424–1433. [DOI] [PMC free article] [PubMed] [Google Scholar]
- (23).Rizevsky S; Matveyenka M; Kurouski DJ Phys. Chem. Lett 2022, 13, 2467–2473. [DOI] [PMC free article] [PubMed] [Google Scholar]
- (24).Dou T; Kurouski D ACS Chem. Neurosci 2022, 13, 2380–2385. [DOI] [PMC free article] [PubMed] [Google Scholar]
- (25).Dou T; Zhou L; Kurouski DJ Phys. Chem. Lett 2021, 12, 4407–4414. [DOI] [PubMed] [Google Scholar]
- (26).Galvagnion C; Buell AK; Meisl G; Michaels TCT; Vendruscolo M; Knowles TPJ; Dobson CM Nat. Chem. Biol 2015, 11, 229–234. [DOI] [PMC free article] [PubMed] [Google Scholar]
- (27).Bannwarth C; Ehlert S; Grimme SJ Chem. Theory Comput 2019, 15, 1652–1671. [DOI] [PubMed] [Google Scholar]
- (28).Makarov AA; Pirrone GF; Shchurik V; Regalado EL; Mangion I Anal. Chim. Acta 2020, 1099, 111–118. [DOI] [PubMed] [Google Scholar]
- (29).Makarov AA; Helmy RJ Chromatogr., A 2016, 1431, 224–230. [DOI] [PubMed] [Google Scholar]
- (30).Liao C; Esai Selvan M; Zhao J; Slimovitch JL; Schneebeli ST; Shelley M; Shelley JC; Li JJ Phys. Chem. B 2015, 119, 10390–10398. [DOI] [PubMed] [Google Scholar]
- (31).Klocek G; Schulthess T; Shai Y; Seelig J Biochemistry 2009, 48, 2586–2596. [DOI] [PubMed] [Google Scholar]
- (32).Matveyenka M; Rizevsky S; Kurouski D Biochim. Biophys. Acta, Mol. Basis Dis 2022, 1868, 166485. [DOI] [PMC free article] [PubMed] [Google Scholar]
- (33).Rizevsky S; Zhaliazka K; Matveyenka M; Quinn K; Kurouski D FEBS J. 2022, DOI: 10.1111/febs.16564. [DOI] [PubMed] [Google Scholar]
Associated Data
This section collects any data citations, data availability statements, or supplementary materials included in this article.


