

Abstract
Although alterations in cellular mitochondrial DNA (mtDNA) content have been linked to various pathological conditions, the mechanisms that govern mtDNA copy number (mtCN) control remain poorly understood. Moreover, techniques for mtDNA quantification do not allow for direct comparisons of absolute mtCNs between labs. Here we report the development of a direct droplet digital PCR technique for the determination of mtCNs in whole-cell lysates. Using this technique, we demonstrate that cellular mtDNA content can fluctuate in culture by as much as 50% and provide evidence for both cell proliferation-coupled and uncoupled mtDNA replication.
Keywords: Mitochondrial DNA, Cell proliferation, mtDNA replication, mtDNA copy number, Cell cycle, X-ray
1. Introduction
In most mammalian cells, mitochondria generate the bulk of ATP required to sustain diverse cellular processes while also playing important roles in intracellular calcium signaling (Blackstone, 2015), apoptosis (Elkholi et al., 2014), reactive oxygen species (ROS) production (Zorov et al., 2014), and biosynthesis of heme and iron-sulfur clusters (Shah et al., 2012; Lill et al., 2014). They also house mitochondrial DNA (mtDNA)—the only extranuclear DNA in mammalian cells. Either directly or indirectly, mtDNA affects all mitochondrial processes, and the loss of mtDNA in multicellular organisms is not compatible with life.
mtDNA is maintained at variable copy numbers per cell in different tissues. At the low end of this spectrum are the mammalian erythrocytes that have no mtDNA, and human sperm that normally contain 5–10 copies of mtDNA per nuclear genome (Gabriel et al., 2012). Conversely, human oocytes may contain as many as 500,000 copies of mtDNA (Reynier et al., 2001). The mechanism(s) that govern tissue-specific mtDNA copy number control remain poorly understood. Moreover, mtDNA copy number in different tissues is not a set number but appears to vary, so that population studies may report a 2–10 fold variation in mtDNA copy number in a given tissue between individuals (Stringer et al., 2013). This fact is reflected in the clinical range for the “normal” mtDNA content, which is 40–150% of the average for a given population (Nakano et al., 2011).
Changes in mtDNA content were associated with a number of pathologies most notably with congenital mtDNA depletion syndromes in which mtDNA content may drop to as low as 2% of normal (Lee et al., 2013). Even though the extreme reduction in mtDNA content is incompatible with life, humans can survive with as little as 10–25% residual mtDNA at least in some instances (Vu et al., 1998; Finsterer, 2013).
Alterations in mtDNA copy number have been associated with aging, although the directionality of these changes remains controversial (Zhang and Singh, 2014; Lopez et al., 2012; Lee et al., 2015). Cancer is another condition linked to changes in cellular mtDNA content. There, too, the directionality of changes in mtDNA content is often specific to tumor type. mtDNA depletion was reported in breast tumors (Fan et al., 2009; Mambo et al., 2005; Tseng et al., 2006; Yu et al., 2007; Guha et al., 2018; McMahon and LaFramboise, 2014; Ebrahimi et al., 2018), osteosarcoma (Kurt et al., 2013; Yu et al., 2013), and colorectal tumors (Wang et al., 2016); it appears elevated in the blood of patients with early-stage renal cell carcinoma (Elsayed et al., 2017), in colorectal tumors with 4977 bp common deletion (Chen et al., 2011), and in children with acute lymphoblastic anemia (Egan et al., 2010). Moreover, hepatocellular carcinoma patients with reduced mtDNA content in peripheral leucocytes had reduced overall time of survival (Bao et al., 2016). Also, high tumor mtDNA content is associated with better survival in adrenocortical carcinoma, chromophobe renal cell carcinoma, and low-grade glioma. However, the opposite trend of poor survival in patients with high tumor mtDNA was observed in clear-cell renal cell carcinoma and melanoma (Chen et al., 2011). Finally, the directionality of changes in mtDNA content within the same tumor type may vary among patients (Lee et al., 2005).
Given the diagnostic and prognostic interest in mtDNA content in various conditions, there is considerable interest in its accurate determination. Typically, mtDNA content is established by determining the number of copies of nDNA and mtDNA genes in a given sample by qPCR. However, this technique relies on amplifying nuclear and mitochondrial targets with equal efficiency, which is difficult to control. In support of this notion, a large international multicenter study has concluded that absolute mtDNA/nDNA ratio values cannot be readily compared between laboratories (Cote et al., 2011). In part due to these experimental difficulties, little is known about horizontal fluctuations in cellular mtDNA content, and it is frequently assumed that this content at baseline is stable enough to be used as a reference for the evaluation of changes observed under various experimental and (patho)physiological conditions. However, to our knowledge, this assumption has not yet been rigorously tested.
Recently, digital PCR (dPCR) and, specifically, droplet digital PCR (ddPCR) emerged as a superior technique for the accurate quantification of DNA targets. Being endpoint assays, these techniques do not rely as heavily on the efficiency of amplification. Therefore, in this study, we present the development and validation of a new direct droplet digital PCR (dddPCR) assay for the determination of mtDNA content and use this assay to evaluate the stability of mtDNA content in cultured cells under baseline culture conditions and in response to agents that inhibit cell cycle progression.
2. Materials and methods
2.1. Cell growth and treatment
In this study, we used human osteosarcoma 143B cells (ATCC CRL-8303), HeLa (human cervical carcinoma, ATCC CCL-2), and HT1080 (human fibrosarcoma, Cell culture collection of the University of California, Berkeley). All cell lines were authenticated by STR profiling (Genetica, Burlington, NC). All cell lines were propagated in Dulbecco’s Modified Eagle Medium (DMEM) containing 10% Fetal Bovine Serum, 50 μg/ml gentamycin, 50 μg/ml uridine, and 1 mM sodium pyruvate in a humidified atmosphere containing 5% CO2 at 37 °C, which is permissive for growth of cells devoid of mtDNA (ρ° cells; +UP medium). As per experimental needs, cells were treated with either mitomycin C (10 ϻg/ml, 2 h), irradiated with 100 Gy on a Kimtron IC-320 irratiator or continuously treated with 1 mM hydroxyurea (HU), 200 ϻM L-mimosine, 2 ϻM nocodazole, 20 ϻM lovastatin, 20 ϻM 2-[[3-(2,3-dichlorophenoxy)propyl]amino]ethanol hydrochloride (DCPE), or 10 ϻM Ro-3306.
2.2. Total cellular DNA isolation
DNA was isolated from cultured cells using either commercial kits (DNeasy Blood and Tissue kit (Qiagen, Valencia, CA) or EZNA Tissue DNA kit (Omega Bio-Tek, Norcross, GA)) or by chloroform extraction as described earlier (Shokolenko et al., 2009). Briefly, up to 106 cells were lyzed in 400 ϻl of the buffer containing 10 mM Tris-HCl pH 8.0, 1 mM EDTA, 0.5% SDS, and 200 ϻg/ml proteinase K). The lysate was incubated overnight at 37 °C, after which it was adjusted to 1 M NaCl using a 5 M stock solution. The resulting mix was extracted three times with a chloroform: isoamyl alcohol mix (24:1), precipitated with two volumes of 100% ethanol, and finally dissolved in 200 ϻl of water.
2.3. Preparation of crude cell extracts. Seven protocols were evaluated for their suitability to generate crude extracts for ddPCR
NAOH1: 10 ϻl of cells were mixed with 40 ϻl of 0.2 M NaOH, incubated for 5 min at 75 °C, neutralized by addition of 360 ϻl of 40 mMTris-HCl, pH = 7.5, and adjusted to the final volume of 510 ϻl with H2O.
NAOH2: 10 ϻl of cells were mixed with 40 ϻl of 0.2 M NaOH, incubated for 5 min at room temperature, neutralized by addition of 360 ϻl of 40 mM Tris-HCl, pH = 7.5, and adjusted to the final volume of 510 ϻl with H2O.
NAOH3: 10 ϻl of cells were mixed with 40 ϻl of 0.2 M NaOH, incubated for 5 min at 75 °C, neutralized by addition of 360 ϻl of 40 mMTris-HCl, pH = 5, and adjusted to a final volume of 510 ϻl with H2O.
NAOH2: 10 ϻl of cells were mixed with 40 ϻl of 0.2 M NaOH, incubated for 5 min at room temperature, neutralized by addition of 360 ϻl of 40 mM Tris-HCl (pH = 5), and adjusted to final volume of 510 ϻl with H2O.
HotSHOT: 10 ϻl of cells were mixed with 50 ϻl of 25 mM NaOH, 0.2 mM EDTA, incubated for 5 min at 95 °C, neutralized by addition of 50 ϻl of 40 mM Tris-HCl, pH = 5, and adjusted to the final volume of 510 ϻl with H2O.
QuickExtract (LGC, Bioserch Technologies/Lucigen, Madison, WI) procedure was performed according to the manufacturer’s recommendations. Briefly, 10 ϻl of cells were mixed with 500 ϻl of QuickExtract reagent and incubated at 65 °C for 6 min followed by 2 min at 98 °C.
Direct PCR (Viagen Biotech, Los Angeles, CA) procedure was performed as follows: 10 ϻl of cells were mixed with 50 ϻl of DirectPCR cells reagent containing 0.5 ϻg/ml proteinase K. The lysate was incubated for 30 min at 50 °C followed by 30 min at 95 °C after which the final volume was adjusted with H2O to 510ϻl.
In subsequent assays, trypsinized cells were counted with Coulter Counter Z1, pelleted, and stored at −80 °C. Pelleted cells were resuspended in PBS to 10,000–20,000 cells/ϻl, and 10 ul of this suspension was mixed with a solution containing 40 ϻl H2O, 50 ϻl DirectPCR reagent and 0.5 ϻg/ml Proteinase K (final concentration), and processed as described above.
2.4. Primers and probes
For ddPCR, commercial hRPP30 CNV and MT-ND1 assays were used: nuclear and mitochondrial genes, Bio-Rad (Hercules, CA) cat. #10031243 and cat. #10031252, respectively. The ddPCR primers and probes were designed using an online PrimerQuest tool (https://www.idtdna.com/PrimerQuest/Home/Index) against target regions specified in the technical documentation to the above commercial assays. The primer sequences were hRPP30F: AACTTGTAAGTGGTAGTGCATAGA; hRPP30R: GTAGGAGGACATTTGAGGAGTG; hRPP30Probe: TCAGGCAGACTGACACTAGAGTTCACA; hND1F: CTGATCAGGGTGAGCATCAAA; hND1R: GAATGATGGCTAGGGTGACTTC; hND1probe: TGCGAGCAGTAGCCCAAACAATCT. Primers and probes were synthesized by Integrated DNA Technologies (Coralville, IA) or Eurofins Genomics (Louisville, KY). We saw no significant differences in the performance of the primers and probes produced by these two companies. Probes were labeled with either FAM or Hex and quenched with BHQ1.
2.5. ddPCR
ddPCR was performed using the Bio-Rad QX200 instrument. Reactions were assembled using 2x ddPCR Supermix for Probes (no dUTP). They contained variable amounts of the total DNA (measured spectrophotometrically by NanoDrop One or fluorometrically using Qubit 2), 10 units (0.5 ϻl) of the EcoRI HF restriction endonuclease (New England Biolabs, Ipswich, MA), as well as primers at 0.9 ϻM and probes at 0.25 ϻM. The cycling parameters were 10 min at 95 °C initial denaturation followed by 40 cycles of 30 sec at 94 °C and 1 min at 60 °C followed by “baking” for 10 min at 98 °C with a final hold at 4 °C. All ramping rates were 2 °C/sec.
mtDNA copy number calculation. mtDNA copy number (mtCN) for duplex reactions were determined using the following formula:
mtCN = 2*[mtDNA]/[nDNA] where [mtDNA] and [nDNA] are concentrations of the mitochondrial and nuclear targets, respectively.
For simplex reactions, concentrations of nDNA and mtDNA targets in each DNA sample were determined in two or three separate reactions for each genome. For mtDNA reactions, the nDNA sample was diluted 1:500 (dilution factor, DF, or as appropriate) to account for the higher concentration of mtDNA targets). This generated four or six values (two or three for each nuclear and mitochondrial target). The mtCN was then calculated for each of the four or nine possible combinations of nDNA and mtDNA target concentrations using the following formula:
mtCN = 2*DF*[mtDNA]/[nDNA] where [mtDNA] and [nDNA] are concentrations of the mitochondrial and nuclear targets, respectively.
2.6. Statistical analysis
Pairwise comparisons were assessed using a 2-tailed t-test assuming unequal variance. Comparisons in groups were made using 1-way analysis of variance (ANOVA) with a post-hoc Tukey test.
3. Results and discussion
3.1. ddPCR assay for the determination of mtDNA copy number and its validation
The cost of equipment and consumables is a considerable limitation for the widespread application of ddPCR, which relies heavily on the quality of primers and probes used in amplification. When purchased from the vendor, the primer/probe mix adds as much as $1 per reaction. To mitigate this cost, we designed primer/probe combinations for nuclear DNA (nDNA) and mtDNA targets.
Quadruplicate reactions with the same DNA samples were set up to evaluate the performance of homemade vs. commercial primers and probes. We did not detect differences in the performance of our primers and probes vs. commercial assays (Fig. 1). Therefore, the homemade assay provides uncompromised performance at about 2% of the primer/probe cost.
Fig. 1.
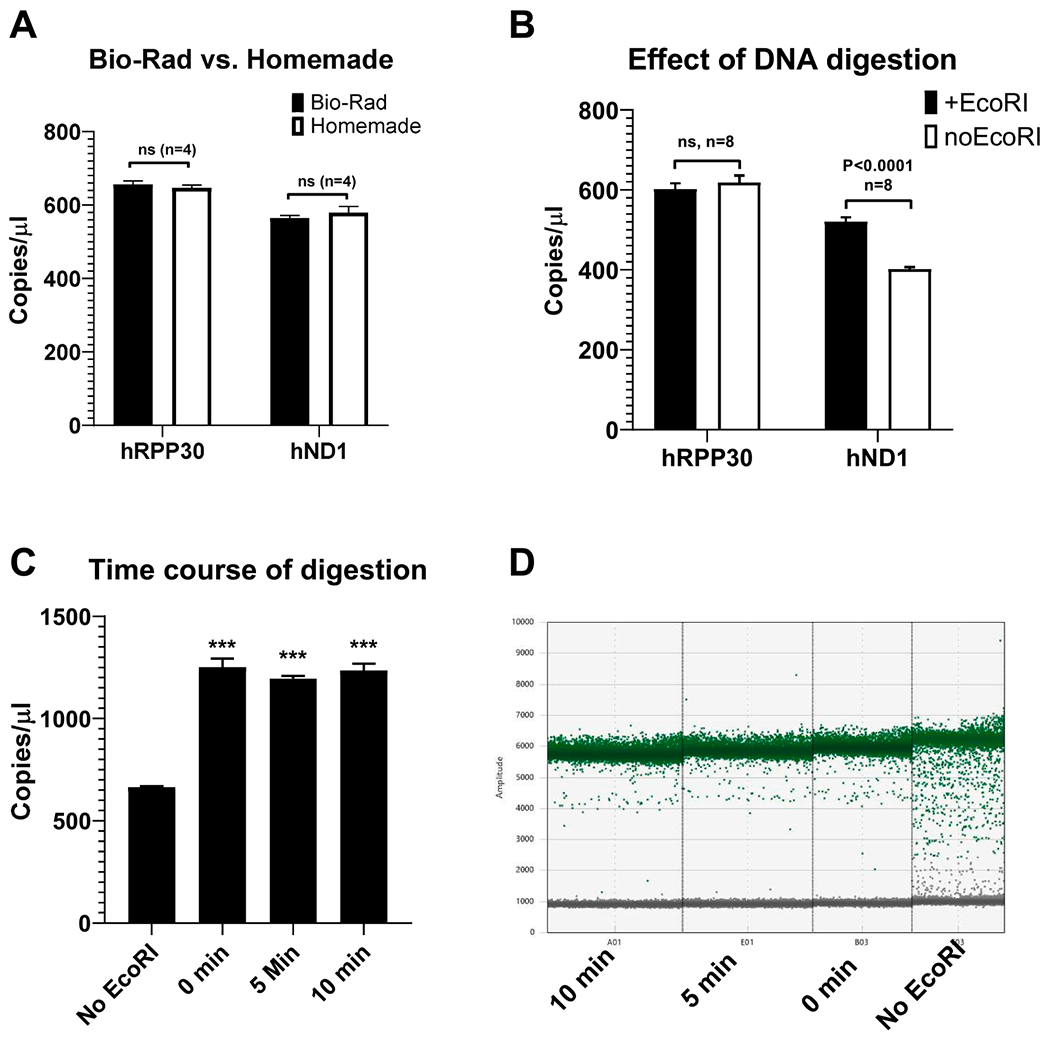
Performance of the commercial vs. homemade ddPCR assays for nuclear and mitochondrial targets and the effect of EcoRI digestion. A, commercial and homemade ddPCR assays perform equally well on both nuclear and mitochondrial targets. B, EcoRI digestion improves amplification of mtDNA C, D, a dedicated DNA digestion step is not required to improve mtDNA amplification, n = 4. ***, P < 0.001. D, undigested mtDNA generates “rain” due to inefficient amplification.
3.2. Effect of DNA digestion on ddPCR
Bio-Rad suggests that DNA digestion prior to PCR may increase reproducibility and accuracy in the quantification of tandem genes and when using greater than 100 ng of DNA per reaction (DNA digestion breaks the linkage between tandem genes and reduces sample viscosity thus promoting more even partition of gene copies into droplets). Moreover, in qPCR, the Cts of circular plasmids can be up to 4 cycles higher compared to their linearized forms suggesting inefficiency of the first amplification cycle(s) (Hou et al., 2010; Lin et al., 2011). This phenomenon may also affect ddPCR even though it is an endpoint technique through the “rain” effect. Therefore, we examined the effect of DNA digestion with EcoRI restriction endonuclease. The digestion had no effect on the amplification of nDNA. However, it significantly improved the amplification of mtDNA, which is a circular molecule. Importantly, mtDNA amplification was completely derepressed during sample preparation for PCR and did not require a dedicated period of incubation with enzyme (Fig. 1).
3.3. DNA quantification
Currently, the two most popular techniques for the quantification of purified DNA are spectrophotometry (“Nanodrop-like”) and fluorometry (“Qubit-like”). In our experience, these two techniques produced very similar results when measuring purified plasmid DNA. However, measurements with column-purified genomic DNA typically vary with spectrophotometric measurements reporting higher values. Therefore, we used ddPCR to evaluate these two approaches. Four samples of total DNA were isolated from 143B cells using Qiagen’s DNeasy Blood and Tissue kit. The DNA concentration in these samples was determined by Nanodrop and Qubit, and the number of copies of nuclear RPP30 gene in 3 ϻl of total DNA determined by ddPCR was compared with those derived from DNA concentrations reported by Qubit and Nanodrop. In contrast to Nanodrop, the DNA concentrations determined by Qubit in all four experiments aligned very closely with the number of copies determined by ddPCR (Fig. 2).
Fig. 2.
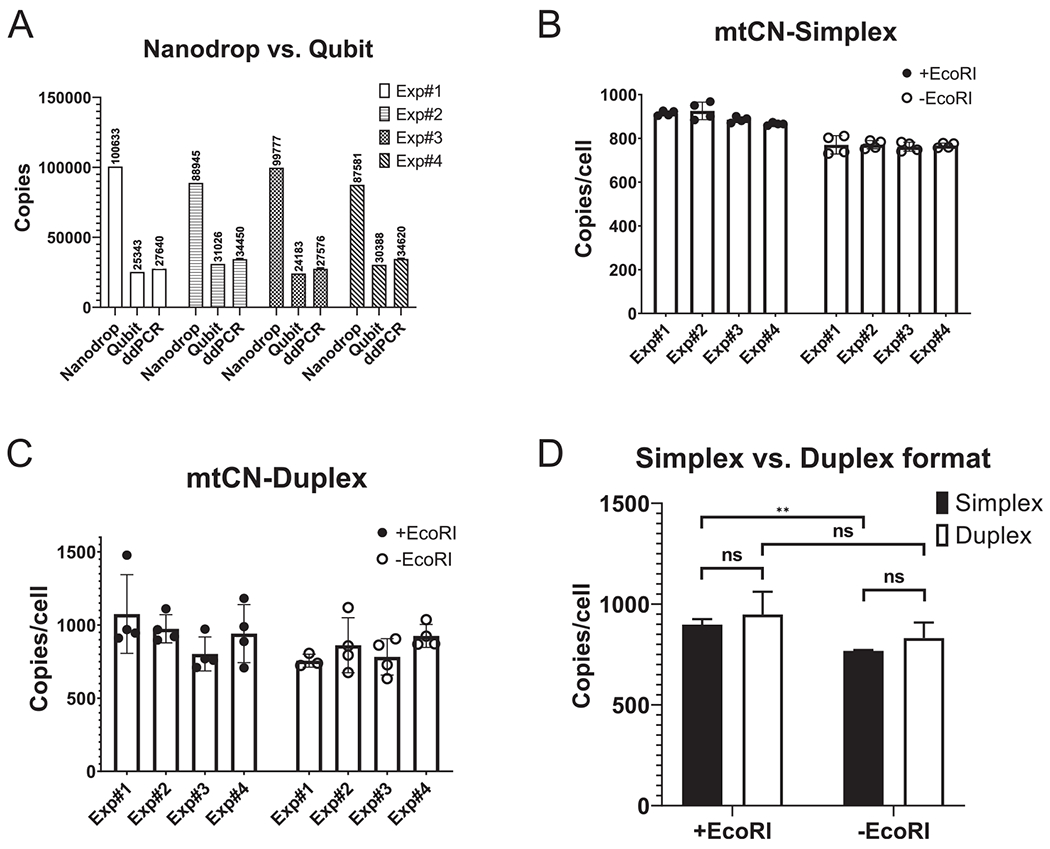
Optimization of the DNA quantification and sample format. A, fluorometric quantification of purified DNA is in better agreement with ddPCR measurements than spectrophotometric quantification. B, C, the simplex format produces more precise measurements of mtCNs than duplex format. D, simplex and duplex formats report similar mtCNs. **, P < 0.01, ns-not statistically significant, two-tailed unpaired t-test assuming unequal variance.
3.4. Simplex vs. duplex ddPCR
Determining the mtCN by either qPCR or ddPCR can be performed in either simplex (one target per reaction) or duplex (two targets per reaction) formats. However, the molar excess of mitochondrial templates imposes unique limitations on measuring mtCN in duplex format by each approach. In duplex qPCR, care must be taken to avoid exhaustion of the dNTP pool by amplification of more copious mtDNA prior to amplification of nDNA reaching its Ct. This is commonly achieved by limiting the supply of mtDNA primers in the reaction. However, this leads to the imbalance of nDNA and mtDNA primers in the reaction, which can negatively affect the accuracy of the measurements.
ddPCR does not have this limitation because nDNA and mtDNA templates are independently partitioned into droplets. Under these conditions, a typical droplet contains no more than two copies of DNA target (either nuclear or mitochondrial). However, having too few or too many positive droplets in reaction leads to an exponential increase in the coefficient of variation (CV, a measure of precision and repeatability). In practical terms, this can make measurements of mtCN in cells with high mtDNA content by duplex ddPCR impractical because it is likely to result in either too few nDNA-positive droplets, too many mtDNA-positive droplets, or both.
To determine the optimal ddPCR format for our most commonly used cell line, human osteosarcoma 143B, we performed simplex and duplex assays on the same total DNA sample (isolated with Qiagen columns) and compared their CVs.
In the simplex setup, a sample of total DNA was diluted 4 times to 20 ng/ul (Qubit) generating 4 samples for nDNA determination. Each of these nDNA samples was diluted 1:500 generating matching samples for mtDNA determination. Finally, ddPCR reactions were performed in duplicates on each nDNA and mtDNA sample producing 4 mtCN values for each sample. In the duplex setup, four samples were generated by diluting the total DNA to 0.07 ng/ϻl, and quadruplicate technical replicates were performed on each sample using 0.21 ng of total DNA per reaction to avoid saturation with mtDNA templates.
In the simplex setup, nDNA measurements produced average CVs 0.7% (range 0.2%-1.3%) and 2.2% (range 0.7%-3.2%) for EcoRI-digested and undigested DNA, respectively. Average CVs for mtDNA measurements in this setup were 2.2% (range 0.6%-5.1%) and 2% (range 0.2%-6.6%) for EcoRI-digested and undigested DNA, respectively. In the duplex setup, corresponding CVs were considerably higher at 16.9% (range 10.4%-22.3%) and 13.1% (range 5%-20.7%) for nDNA for EcoRI-digested and undigested samples, respectively; these same values were 3.8% (range 1.9%-5.8%) and 1.5% (range 1%-2.4%) for mtDNA. The average CVs for mtCNs generated by the simplex setup were 1.9% (range 0.7%-4.3%) and 3% (1.4%-5.5%). In the duplex setup, these averages were 17.6% (range 9.8%-25%) and 13% (range 5.8%-21.8%) for EcoRI-digested and undigested DNA, respectively. Therefore, the simplex format produced more precise measurements with purified DNA from 143B cells. The relative imprecision of duplex assays was driven primarily by the imprecision of quantifying nDNA copies, which were low at this input (~61 copy/reaction). Overall, in both assay formats, undigested DNA produced lower mtCNs. However, these differences were not statistically significant in the duplex format because of the high variance. Duplex reactions produced slightly higher mtCNs. However, these differences were not statistically significant because of the high variance (Fig. 2).
3.5. The DNA isolation technique affects the reported mtCN
Typically, the determination of mtDNA copy number relies on purified samples of total cellular DNA. Since nuclear and mitochondrial genomes are located in different cellular compartments and have different topologies (predominantly linear nDNA vs. mostly relaxed and supercoiled circular mtDNA), it is important to be cognizant of the bias (if any) introduced by the chosen DNA isolation technique. Previously, silica columns have been used in many commercial kits and have been shown to bias against mtDNA leading to lower mtCN reported by qPCR (Guo et al., 2009).
143B human osteosarcoma cells were grown in two 150-mm dishes. Cells were collected by trypsinization, mixed, and split into 12 identical aliquots (~106 cells per aliquot). Aliquots were then pelleted, and cells were stored at −80 °C until DNA extraction. Three DNA isolation methods were tested (four aliquots per method): commercial silica columns from Qiagen and Omega Bio-Tek as well as an in-house chloroform extraction technique (Shokolenko et al., 2009). In our experience, Omega Bio-Tek columns are more economical, whereas Qiagen columns provide higher DNA recovery. Column purification methods generated very similar mtCNs, which were ~ two-fold lower than those obtained with chloroform-purified DNA (Fig. 3).
Fig. 3.
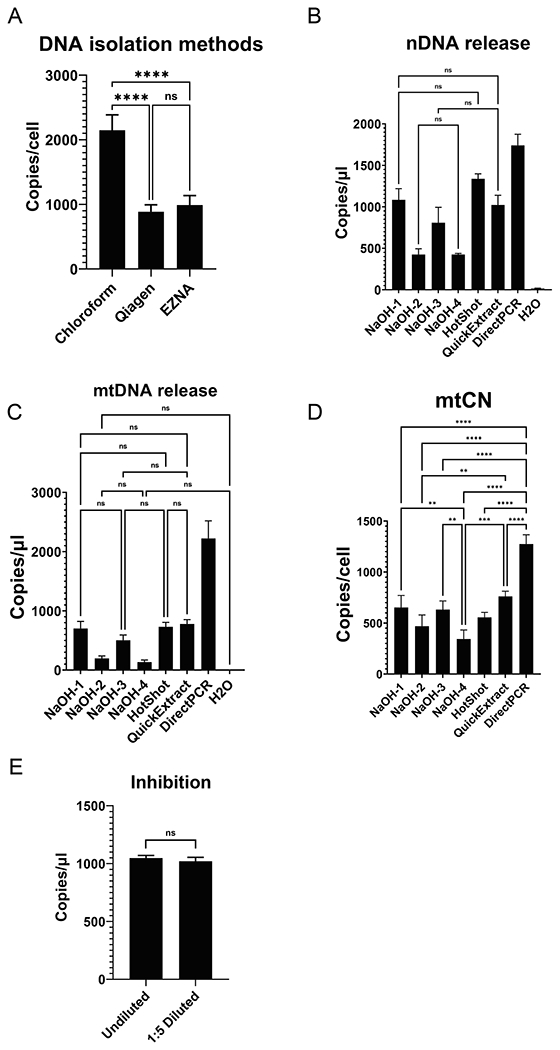
Optimization of the DNA release and the effect of potential inhibitors. A, mtCNs reported by the chloroform isolation techniques are higher than those with column-purified DNA. B-D, Relative efficiency of seven protocols at nDNA and mtDNA release from cells (B,C) and reported mtCNs (D). Only statistically not significant comparissons are shown in B and C. Only statistically significant comparisons are shown in D. E, Impurities do not substantially affect dddPCR. After adjusting for dilution, reported number of targets is statistically indistinguishable in undiluted and 1:5 diluted samples.
3.6. mtCN determination using crude cell extracts
The discrepancy between mtCNs determined using column- and chloroform-purified DNA raised a question of which (if any) DNA purification method reports accurate mtCN. mtDNA can be preferentially lost during column purification (Guo et al., 2009). Conversely, nDNA is more tightly associated with proteins. Therefore, it is conceivable that it may be preferentially lost with incompletely dissociated nucleoprotein complexes at the interphase during isolation by our chloroform purification method (as well as by conceptually similar phenol- and phenol/chloroform isolation methods) thus resulting in inflated mtCNs. Therefore, mtCN determination in cell lysates may prove superior to methods based on DNA purification (Longchamps et al., 2020; Nacheva et al., 2017).
The key requirements for an optimal cell lysis method for a ddPCR-based technique of mtCN determination are an efficient release of amplifiable cellular DNA and minimal interference with downstream ddPCR. Therefore, we evaluated several techniques for their liberation of amplifiable nDNA. These techniques included four variations of the NaOH lysis technique (Rudbeck and Dissing, 1998), a related HotSHOT technique (Truett et al., 2000), as well as two commercially available cell lysis protocols: QuickExtract (Lucigen, Madison, WI) and DirectPCR (Viagen Biotech, Los Angeles, CA).
To facilitate the comparison, 143B cells were trypsinized and neutralized with a complete DMEM medium; a batch of identical 10 ϻl aliquots of cell suspension was then generated. Four aliquots were processed with each protocol as described in the Materials and Methods, and 3 ul of the lysate were used in ddPCR reaction with hRPP30 (nuclear) primers. After diluting the lysates 25-fold with H2O, 3 ϻl were used in a ddPCR reaction with hND1 (mitochondrial) primers.
Cell solubilization protocols based on the alkaline lysis at elevated temperatures (NaOH1, NaOH3, and HotSHOT) were at least as effective in releasing amplifiable nDNA as the commercial QuickExtract procedure, which produced superior results in the previous study (Longchamps et al., 2020). However, alkali cell lysis at room temperature was not efficient. DirectPCR reagent released amplifiable nDNA most efficiently. The efficiency of mtDNA release paralleled that of nDNA. Finally, the mtCNs determined using NaOH1, NaOH3, HotSHOT, and QuickExtract procedures were statistically indistinguishable, whereas mtCNs determined using DirectPCR reagent were significantly higher versus the six other methods (Fig. 3). The latter finding indicated that DirectPCR reagent was disproportionally more efficient at releasing mtDNA versus nDNA. This is not altogether surprising considering that five of the remaining techniques involve alkali and that mtDNA contains alkalilabile ribonucleotides (Wanrooij et al., 2017).
To evaluate the potential PCR inhibitory effects of the DirectPCR lysis solution, we determined and back-calculated the number of hRPP30 targets in undiluted and in 1:5 diluted lysate. The expectation was that any inhibitory effect would manifest itself as a disproportional increase in the back-calculated number of copies in diluted samples versus undiluted samples. However, the differences were not statistically significant (Fig. 3).
3.7. Pipetting is a major contributor to dddPCR assay variability
To assess the reproducibility of direct droplet digital PCR (dddPCR) assay, we generated eight 143B cells pellets of approximately 1 mln cells each and froze them at −80 °C. For the assay, pellets were thawed, resuspended in 100 ϻl PBS, and 10 ϻl of each suspension was mixed with 90 ϻl of the solution consisting of 40 ϻl H2O, 50 ϻl of DirectPCR reagent and 0.56 ϻg/ml Proteinase K; this sample was processed as above. Unexpectedly, mtCNs were significantly different (Fig. 4A) in 13 of 28 pairwise comparisons (one-way ANOVA with post hoc Tukey test). The CV was 4.9%. The 95% confidence interval was 1110 to 1350, and the range between these values was (1350–1110)/1110*100%= 22% of the lower value. This imprecision may have been caused by the nonuniformity of DNA release from cells, pipetting errors, or both.
Fig. 4.
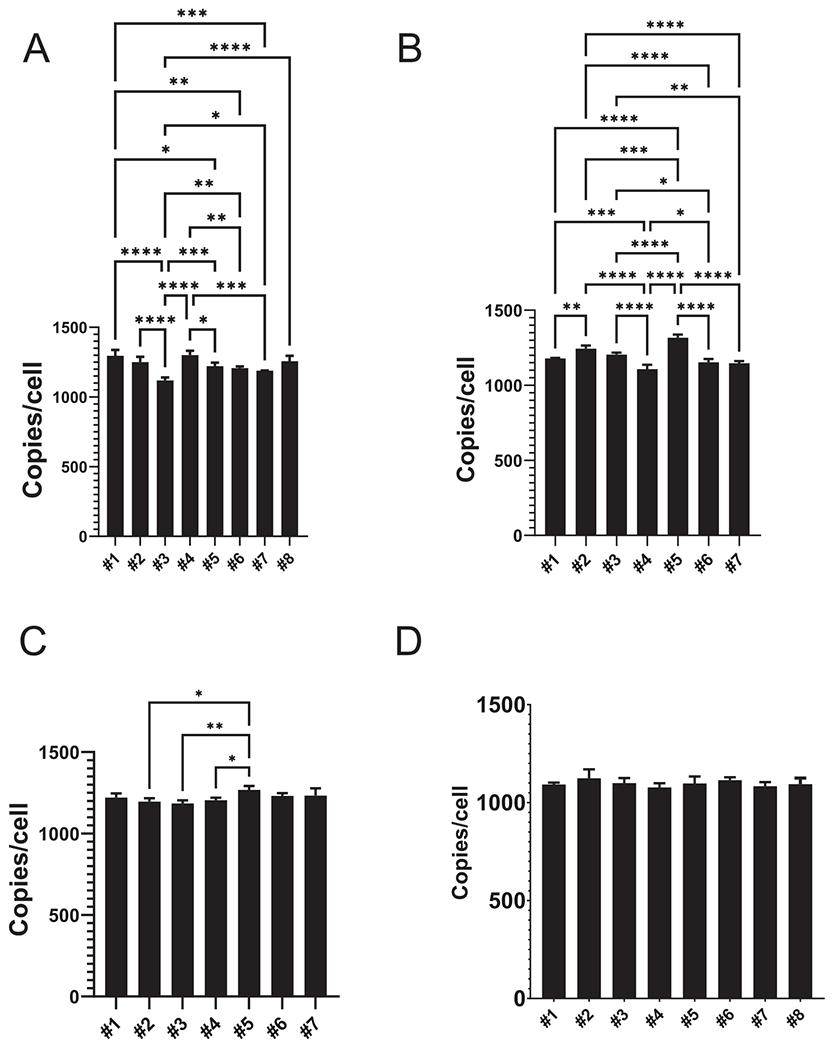
Identification of the major source of variability in dddPCR. A, Variability in mtCN determined in eight identical cell aliquots processed in parallel. 13 of 28 pairwise comparisons show statistically significant differences. B, The nonuniformity of DNA release and variability associated with post-treatment lysate dilution to 500ϻl are not major contributors to assay reproducibility. C, Eliminating errors associated with pipetting during dilution of mtDNA templates dramatically reduces variability. D, None of the pairwise comparisons obtained with mastermixes show statistically significant differences. One-way ANOVA with post-hoc Tukey test. *, P < 0.05; **, P < 0.01; ***, P < 0.001; ****, p < 0.0001. In each panel, only statistically significant pairwise comparisons are shown.
To exclude nonuniformity of DNA release and variability associated with post-treatment lysate dilution, we selected one fully processed sample and made seven 1:500 dilutions for mtDNA determination. We then set up 14 reactions with nDNA primers as well as two reactions for each of the mtDNA dilutions. nDNA measurements were randomized and grouped with mtDNA measurements (2 + 2, seven groups). Calculations of the resulting mtCNs and their analysis (one-way ANOVA with post hoc Tukey test) revealed that eliminating the potential variability associated with nonuniform DNA release did not reduce variability (the differences were significant in 15 of 21 comparisons); the range was 19% of the lowest mtCN value (Fig. 4B). To eliminate the variability associated with diluting lysates for mtDNA reactions, we pipetted the same nDNA template into 14 wells (3 ϻl/well). We did the same with the mtDNA template. The nDNA and mtDNA values were randomized, and seven groups were established, each consisting of two nDNA and two mtDNA reactions. Within each group, each nDNA value was combined with each mtDNA value to generate four mtCNs metrics. Eliminating pipetting errors during dilution of mtDNA templates while retaining those associated with template addition to wells dramatically improved precision. Only 3 of 21 pairwise comparisons were significantly different (one-way ANOVA with post hoc Tukey test), and the range was reduced to 7% of the lowest mtCN value (Fig. 4C).
Finally, to eliminate any contribution of pipetting errors, we set up 16 nDNA and 16 mtDNA reactions by dispensing corresponding reaction master mixes, which contained all the components. Eight groups—each consisting of two nDNA and two mtDNA reactions—were set up after randomization to calculate mtCNs. In this case, none of the 28 pairwise mtCN comparisons were significantly different, and the range was further reduced to 4.4% of the lowest mtCN value (Fig. 4D). These results indicate that the variability of the dddPCR assay is driven primarily by pipetting errors; errors during dilution of mtDNA templates are the main contributor.
To evaluate sensitivity and accuracy of the dddPCR technique, we generated, by mixing lysates from wt and rho-0 143B cells standards containing 100–50% of wt mtDNA in 10% increments. These standards were assessed in four independent experiments: The mtCNs were calculated and compared using one-way ANOVA with post-hoc Tukey test. In four experiments, only two comparisons were not statistically significant: 50% vs. 60% in exp.1 and 70% vs. 80% in exp. 4 (20% and 14% of the lower value, respectively). All differences ≥ 25% were statistically significant (Fig. 5), which compares favorably with the sensitivity of 33% previously reported for purified DNA samples (O’Hara et al., 2019).
Fig. 5.
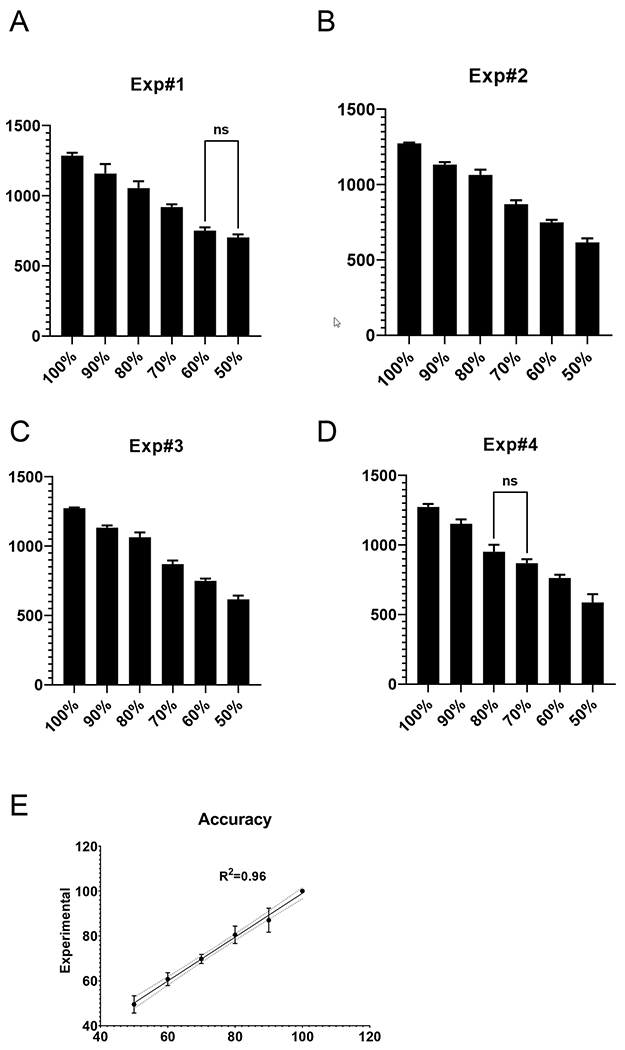
Sensitivity and accuracy of the dddPCR. A-D, mtCNs was determined in six standards generated by mixing lysates of wt and Rho-0 143B cells in four independent experiments. E, Accuracy of dddPCR in experiments A-D. Dotted line, 95% confidence interval of the linear regression. One-way ANOVA with post-hoc Tukey test. In each panel, only statistically not significant pairwise comparisons are shown.
3.8. Horizontal stability of mtCNs in cultured cells
Little is currently known about the stability of mtDNA content either in vivo or in cultured cells. Therefore, to expand our knowledge in this area, we assessed the stability of mtCNs in 143B, HeLa, and HT1080 cells over six days in culture in three or more independent experiments each. In HeLa and 143B cells, the maximum within-experiment spreads (CVs) were 35.4% (12.9%) and 34.9% (12.3%), respectively (Fig. 6 and Table 1). These values are close to the 33% discrimination limit for mtCN determination by ddPCR previously determined with purified amplicons (O’Hara et al., 2019) to the 25% determined in this study. Therefore, it is difficult to establish with confidence whether mtCN varies significantly in HeLa and 143B cells in culture. However, the within-experiment mtCN spread in HT1080 cells exceeded 50% in two out of four experiments suggesting that the mtCN in this cell line is unstable and fluctuates.
Fig. 6.
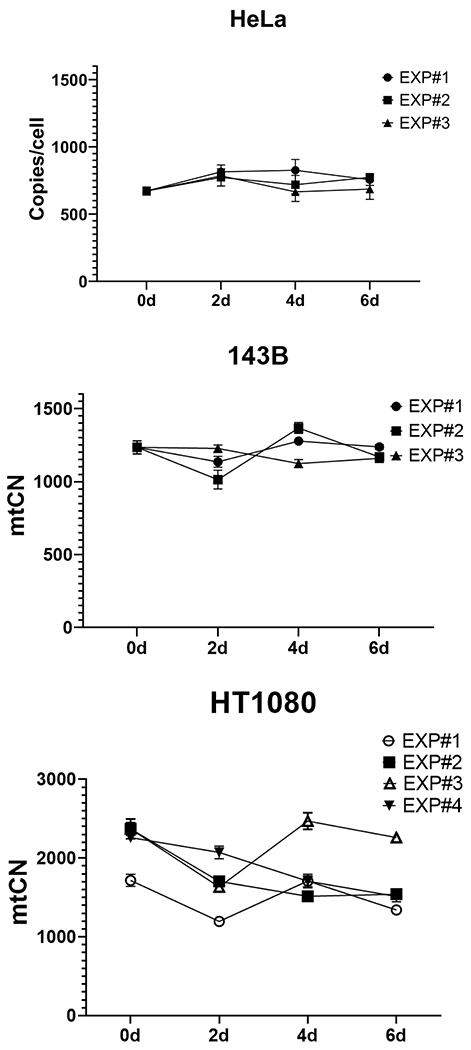
Horizontal stability of mtDNA in HeLa, 143B and HT1080 cells. Cells were cultivated for 6 days, and harvested for analysis on days 0, 2, 4, and 6.
Table 1.
Horizontal instability of mtCNs in cultured cells.
| Experiment 1 |
Experiment 2 |
Experiment 3 |
Experiment 4 |
|||||
|---|---|---|---|---|---|---|---|---|
| CV* | Spread* | CV | Spread | CV | Spread | CV | Spread | |
| HeLa | 12.90% | 35.40% | 4.20% | 7.80% | 3.50% | 7.10% | – | – |
| 143B | 5% | 12.50% | 12.30% | 34.90% | 4.50% | 9.80% | – | – |
| HT1080 | 17.7% | 43.5% | 22.5% | 56.4% | 17.2% | 51.2% | 16.1% | 36.9% |
Across four time points.
3.9. Variable mtCN responses to impediments of cell cycle progression
mtDNA replication is not linked to the cell cycle, and mtDNA molecules are chosen for replication randomly throughout the cell cycle (Bogenhagen and Clayton, 1977). More recently, this view was modified to incorporate coordination of nDNA and mtDNA synthesis (Chatre and Ricchetti, 2013). However, it remains unclear how tight this coordination of mtDNA replication and the cell cycle might be or how mtDNA replication is coordinated with cell proliferation to maintain a (relatively) constant mtDNA content. If the coordination is tight, then it would be expected that blocking cell proliferation would also halt mtDNA replication. Conversely, the minimal coordination scenario would predict a runaway mtDNA replication in response to cell division arrest leading to an increase in mtCN. To discriminate between these two possibilities, we slowed the cell cycle progression in HeLa and 143B cells using various inhibitors and determined the mtCNs values.
Unexpectedly, mtCN responses to the impediment of cell cycle progression were nonuniform and provided support for both alternative models. These responses can be subdivided into four classes. The first class of responses includes X-irradiation (induces single- and double-strand breaks in nDNA and activates multiple checkpoints), mitomycin C (induces DNA inter-strand crosslinks and prevents replication), and Ro-3306 (selective CDK1 inhibitor). These treatments abrogated cell proliferation and resulted in a more than twofold increase in mtCN (Fig. 7). Collectively, the outcomes of these two treatments provided evidence for uncoupling of mtDNA replication from cell proliferation and runaway replication of mtDNA. However, doubling times of HeLa and 143B cells determined over various time intervals and cell seeding densities were 16–24 h. This means that under the normal conditions, mtDNA at least doubles over the 24 h period. However, the mtDNA content over the 24 h period increased only by 20%-50%, which suggests that the uncoupling of mtDNA replication from cell proliferation may be incomplete.
Fig. 7.
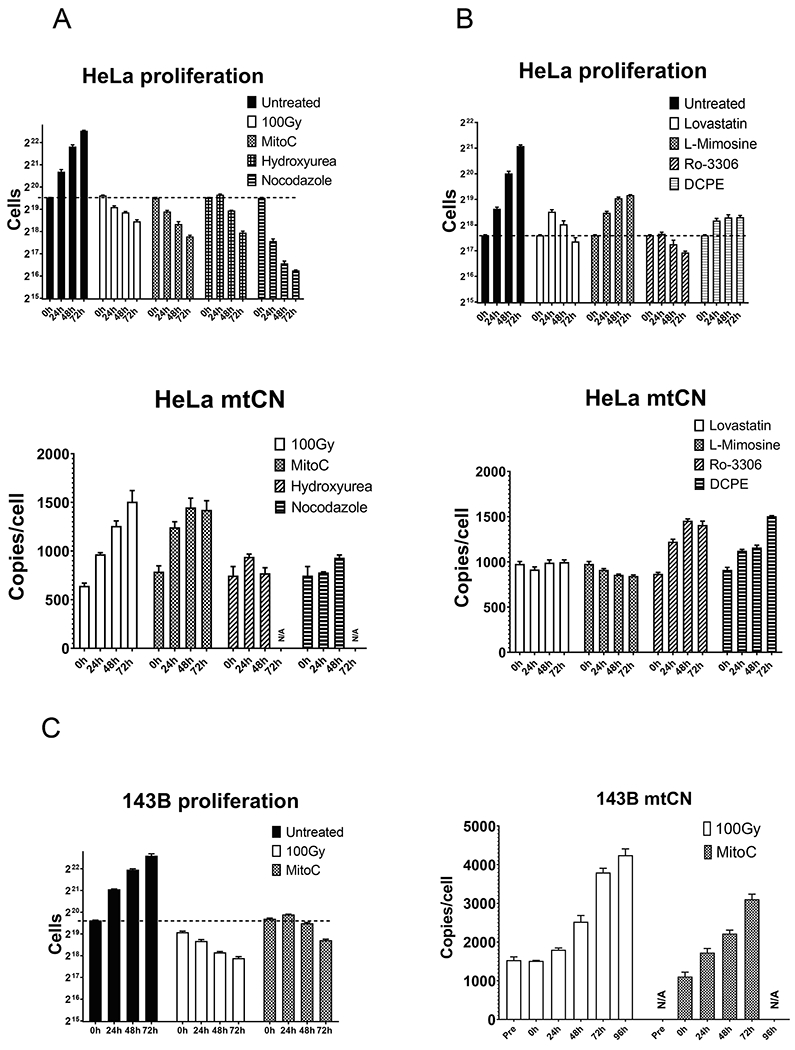
Effect of cell cycle progression on mtCN. Cells were treated as described in the Materials and Methods, and then their proliferation and mtCN were followed for indicated periods of time. A and B, Hela cells. C, 143B cells. N/A-not assayed. MitoC, mitomycin C; 100 Gy, X-irradiation, 100 Gy.
The second class comprises treatments with hydroxyurea (ribonucleotide reductase inhibitor) and nocodazole (microtubule depolymerization agent). These treatments also immediately arrested cell proliferation. However, they did not result in a consistent increase in mtCN. The failure of hydroxyurea to induce an increase in mtCN is not altogether surprising because it inhibits the synthesis of dNTPs required for the replication of both nDNA and mtDNA. On the other hand, the effects of nocodazole may suggest that an intact microtubule cytoskeleton is required for mtDNA replication. This notion is consistent with the involvement of microtubule motors in nucleoid segregation (Qin et al., 2020) and with the important role played by microtubules in supplying mitochondria with purine nucleotides (Chan et al., 2018). However, the outcomes of these treatments are difficult to interpret in terms of the coupling of mtDNA replication to cell proliferation.
The third class of responses includes lovastatin (HMG-CoA reductase inhibitor) and L-mimosine—a non-protein amino acid that blocks cell cycle progression by inhibiting protein synthesis by various mechanisms (Dong and Zhang, 2003; Hanauske-Abel et al., 1994). These treatments did not immediately stop cell division and had either no or a mildly negative effect on mtCN. These outcomes are consistent with coordination between mtDNA replication and cell division.
The final class comprises a single compound: DCPE (blocks cell cycle progression by activating the ATM/ATR-Chk1-Cdc25A signaling pathway (Bai et al., 2020). Like lovastatin and L-mimosine, this compound had a delayed effect on cell proliferation. However, unlike these compounds, DCPE induced a modest increase in mtCN, which is also consistent with the uncoupling of mtDNA replication from cell division.
4. Conclusions
Accurate determination of mtCN remains challenging. New technologies like dPCR offer new opportunities and pose new challenges. Here, we describe a novel dddPCR assay for mtCN determination in cultured cells. We demonstrate that very “tight” data afforded by ddPCR could be misleading in suggesting statistical significance where there should be none (false positives). These false positives are driven by pipetting errors unavoidable when assaying nDNA and mtDNA in different dilutions. Therefore, mtCN determinations in cells with a high mtDNA content may benefit from the development of duplex mtCN determination assays using multicopy nuclear genes (such as rRNA genes) as reference.
Based on this and the previous study (O’Hara et al., 2019), we suggest extra scrutiny in the interpretation of mtCNs, which differ by<25–30%. Our assay has been optimized for the total DNA release and is relatively insensitive to impurities present in crude lysates.
In this study, we were unable to conclusively resolve between cell-proliferation-coupled and uncoupled models for mtDNA replication. The outcomes of different experiments support different models. More studies are needed to uncover the biochemical basis for this apparent inconsistency.
Finally, we observed a greater than 50% variability in mtDNA content during the cultivation of HT1080 cells. While this range varied in different experiments, it suggests that the baseline instability of mtDNA content is a natural phenomenon that should be considered in experiments that aim to establish alterations in mtDNA content in response to treatments.
Funding
This work was supported by the National Institutes of Health grants OD010944, S10OD025089 and HL66299 and by the Office of the Assistant Secretary of Defense for Health Affairs under Award Nos W81XWH2110161 and W81XWH2110669. Opinions, interpretations, conclusions, and recommendations are those of the authors and are not necessarily endorsed by the Department of Defense.
Footnotes
Declaration of Competing Interest
The authors declare that they have no known competing financial interests or personal relationships that could have appeared to influence the work reported in this paper.
References
- Bai B, Shan L, Wang J, Hu J, Zheng W, Lv Y, Chen K, Xu D, Zhu H, 2020. Small molecule 2,3-DCPE induces S phase arrest by activating the ATM/ATR-Chk1-Cdc25A signaling pathway in DLD-1 colon cancer cells. Oncol Lett. [DOI] [PMC free article] [PubMed] [Google Scholar]
- Bao D, Ba Y, Zhou F, Zhao J, Yang Q, Ge N, Guo X, Wu Z, Zhang H, Yang H, Wan S, Xing J, 2016. Alterations of telomere length and mtDNA copy number are associated with overall survival in hepatocellular carcinoma patients treated with transarterial chemoembolization. Cancer Chemother. Pharmacol [DOI] [PubMed] [Google Scholar]
- Blackstone NW, 2015. The impact of mitochondrial endosymbiosis on the evolution of calcium signaling. Cell Calcium. [DOI] [PubMed] [Google Scholar]
- Bogenhagen D, Clayton DA, 1977. Mouse L cell mitochondrial DNA molecules are selected randomly for replication throughout the cell cycle. Cell. [DOI] [PubMed] [Google Scholar]
- Chan CY, Pedley AM, Kim D, Xia C, Zhuang X, Benkovic SJ, 2018. Microtubule-directed transport of purine metabolons drives their cytosolic transit to mitochondria. Proc. Natl. Acad. Sci. USA. [DOI] [PMC free article] [PubMed] [Google Scholar]
- Chatre L, Ricchetti M, 2013. Prevalent coordination of mitochondrial DNA transcription and initiation of replication with the cell cycle. Nucleic Acids Res. [DOI] [PMC free article] [PubMed] [Google Scholar]
- Chen T, He J, Shen L, Fang H, Nie H, Jin T, Wei X, Xin Y, Jiang Y, Li H, Chen G, Lu J, Bai Y, 2011. The mitochondrial DNA 4,977-bp deletion and its implication in copy number alteration in colorectal cancer. BMC Med Genet. [DOI] [PMC free article] [PubMed] [Google Scholar]
- Cote HC, Gerschenson M, Walker UA, Miro O, Garrabou G, Hammond E, Villarroya J, Giralt M, Villarroya F, Cinque P, Garcia-Arumi E, Andreu AL, Pinti M, Cossarizza A, 2011. Quality assessment of human mitochondrial DNA quantification: MITONAUTS, an international multicentre survey. Mitochondrion. [DOI] [PMC free article] [PubMed] [Google Scholar]
- Dong Z, Zhang JT, 2003. EIF3 p170, a mediator of mimosine effect on protein synthesis and cell cycle progression. Mol. Biol. Cell [DOI] [PMC free article] [PubMed] [Google Scholar]
- Ebrahimi E, Almasi-Hashiani A, Ghaffari K, Shirkoohi R, 2018. Mitochondrial DNA copy number instability in ERBB2-amplified breast cancer tumors. EXCLI J. [DOI] [PMC free article] [PubMed] [Google Scholar]
- Egan K, Kusao I, Troelstrup D, Agsalda M, Shiramizu B, 2010. Mitochondrial DNA in residual leukemia cells in cerebrospinal fluid in children with acute lymphoblastic leukemia. J. Clin. Med. Res [DOI] [PMC free article] [PubMed] [Google Scholar]
- Elkholi R, Renault TT, Serasinghe MN, Chipuk JE, 2014. Putting the pieces together: How is the mitochondrial pathway of apoptosis regulated in cancer and chemotherapy? CancerMetab. [DOI] [PMC free article] [PubMed] [Google Scholar]
- Elsayed ET, Hashad MM, Elgohary IE, 2017. Mitochondrial DNA copy number variation as a potential predictor of renal cell carcinoma. Int. J. Biol. Markers [DOI] [PubMed] [Google Scholar]
- Fan AX, Radpour R, Haghighi MM, Kohler C, Xia P, Hahn S, Holzgreve W, Zhong XY, 2009. Mitochondrial DNA content in paired normal and cancerous breast tissue samples from patients with breast cancer. J. Cancer Res. Clin. Oncol [DOI] [PubMed] [Google Scholar]
- Finsterer J, GK G, Ahting U, 2013. Adult mitochondrial DNA depletion syndrome with mild manifestations. Neurol. Int [DOI] [PMC free article] [PubMed] [Google Scholar]
- Gabriel MS, Chan SW, Alhathal N, Chen JZ, Zini A, 2012. Influence of microsurgical varicocelectomy on human sperm mitochondrial DNA copy number: a pilot study. J. Assist. Reprod. Genet [DOI] [PMC free article] [PubMed] [Google Scholar]
- Guha M, Srinivasan S, Raman P, Jiang Y, Kaufman BA, Taylor D, Dong D, Chakrabarti R, Picard M, Carstens RP, Kijima Y, Feldman M, Avadhani NG, 2018. Aggressive triple negative breast cancers have unique molecular signature on the basis of mitochondrial genetic and functional defects. Biochim. Biophys. Acta, Rev. Cancer [DOI] [PMC free article] [PubMed] [Google Scholar]
- Guo W, Jiang L, Bhasin S, Khan SM, Swerdlow RH, 2009. DNA extraction procedures meaningfully influence qPCR-based mtDNA copy number determination. Mitochondrion. [DOI] [PMC free article] [PubMed] [Google Scholar]
- Hanauske-Abel HM, Park MH, Hanauske AR, Popowicz AM, Lalande M, Folk JE, 1994. Inhibition of the G1-S transition of the cell cycle by inhibitors of deoxyhypusine hydroxylation. Biochim. Biophys. Acta, Rev. Cancer [DOI] [PubMed] [Google Scholar]
- Hou Y, Zhang H, Miranda L, Lin S, 2010. Serious overestimation in quantitative PCR by circular (supercoiled) plasmid standard: microalgal pcna as the model gene. PLoS ONE. [DOI] [PMC free article] [PubMed] [Google Scholar]
- Kurt B, Gulcan-Kurt Y, Cayci T, Akgul EO, 2013. Mitochondrial DNA depletion may also have a role in pathogenesis of osteosarcoma. Int. J. Exp. Pathol [DOI] [PubMed] [Google Scholar]
- Lee W, Johnson J, Gough DJ, Donoghue J, Cagnone GL, Vaghjiani V, Brown KA, Johns TG, St John JC, 2015. Mitochondrial DNA copy number is regulated by DNA methylation and demethylation of POLGA in stem and cancer cells and their differentiated progeny. Cell Death Dis. [DOI] [PMC free article] [PubMed] [Google Scholar]
- Lee IC, Lee NC, Lu JJ, Su PH, 2013. Mitochondrial depletion causes neonatal-onset leigh syndrome, myopathy, and renal tubulopathy. J. Child Neurol [DOI] [PubMed] [Google Scholar]
- Lee HC, Yin PH, Lin JC, Wu CC, Chen CY, Wu CW, Chi CW, Tam TN, Wei YH, 2005. Mitochondrial genome instability and mtDNA depletion in human cancers. Ann. N. Y. Acad. Sci [DOI] [PubMed] [Google Scholar]
- Lill R, Srinivasan V, Muhlenhoff U, 2014. The role of mitochondria in cytosolic-nuclear iron-sulfur protein biogenesis and in cellular iron regulation. Curr. Opin. Microbiol [DOI] [PubMed] [Google Scholar]
- Lin CH, Chen YC, Pan TM, 2011. Quantification bias caused by plasmid DNA conformation in quantitative real-time PCR assay. PLoS ONE. [DOI] [PMC free article] [PubMed] [Google Scholar]
- Longchamps RJ, Castellani CA, Yang SY, Newcomb CE, Sumpter JA, Lane J, Grove ML, Guallar E, Pankratz N, Taylor KD, Rotter JI, Boerwinkle E, Arking DE, 2020. Evaluation of mitochondrial DNA copy number estimation techniques. PLoS ONE. [DOI] [PMC free article] [PubMed] [Google Scholar]
- Lopez S, Buil A, Souto JC, Casademont J, Blangero J, Martinez-Perez A, Fontcuberta J, Lathrop M, Almasy L, Soria JM, 2012. Sex-specific regulation of mitochondrial DNA levels: genome-wide linkage analysis to identify quantitative trait Loci. PLoS One. [DOI] [PMC free article] [PubMed] [Google Scholar]
- Mambo E, Chatterjee A, Xing M, Tallini G, Haugen BR, Yeung SC, Sukumar S, Sidransky D, 2005. Tumor-specific changes in mtDNA content in human cancer. Int. J. Cancer [DOI] [PubMed] [Google Scholar]
- McMahon S, LaFramboise T, 2014. Mutational patterns in the breast cancer mitochondrial genome, with clinical correlates. Carcinogenesis. [DOI] [PMC free article] [PubMed] [Google Scholar]
- Nacheva E, Mokretar K, Soenmez A, Pittman AM, Grace C, Valli R, Ejaz A, Vattathil S, Maserati E, Houlden H, Taanman JW, Schapira AH, Proukakis C, 2017. DNA isolation protocol effects on nuclear DNA analysis by microarrays, droplet digital PCR, and whole genome sequencing, and on mitochondrial DNA copy number estimation. PLoS ONE. [DOI] [PMC free article] [PubMed] [Google Scholar]
- Nakano Y, Murayama K, Tsuruoka T, Aizawa M, Nagasaka H, Horie H, Ohtake A, Saitou K, 2011. Fatal case of mitochondrial DNA depletion with severe asphyxia in a newborn. Pediatr. Int [DOI] [PubMed] [Google Scholar]
- O’Hara R, Tedone E, Ludlow A, Huang E, Arosio B, Mari D, Shay JW, 2019. Quantitative mitochondrial DNA copy number determination using droplet digital PCR with single-cell resolution. Genome Res. [DOI] [PMC free article] [PubMed] [Google Scholar]
- Qin J, Guo Y, Xue B, Shi P, Chen Y, Su QP, Hao H, Zhao S, Wu C, Yu L, Li D, Sun Y, 2020. ER-mitochondria contacts promote mtDNA nucleoids active transportation via mitochondrial dynamic tubulation. Nat. Commun [DOI] [PMC free article] [PubMed] [Google Scholar]
- Reynier P, May-Panloup P, Chretien MF, Morgan CJ, Jean M, Savagner F, Barriere P, Malthiery Y, 2001. Mitochondrial DNA content affects the fertilizability of human oocytes. Mol. Hum. Reprod [DOI] [PubMed] [Google Scholar]
- Rudbeck L, Dissing J, 1998. Rapid, simple alkaline extraction of human genomic DNA from whole blood, buccal epithelial cells, semen and forensic stains for PCR. Biotechniques. [DOI] [PubMed] [Google Scholar]
- Shah DI, Takahashi-Makise N, Cooney JD, Li L, Schultz IJ, Pierce EL, Narla A, Seguin A, Hattangadi SM, Medlock AE, Langer NB, Dailey TA, Hurst SN, Faccenda D, Wiwczar JM, Heggers SK, Vogin G, Chen W, Chen C, Campagna DR, Brugnara C, Zhou Y, Ebert BL, Danial NN, Fleming MD, Ward DM, Campanella M, Dailey HA, Kaplan J, Paw BH, 2012. Mitochondrial Atpif1 regulates haem synthesis in developing erythroblasts. Nature. [DOI] [PMC free article] [PubMed] [Google Scholar]
- Shokolenko I, Venediktova N, Bochkareva A, Wilson GL, Alexeyev MF, 2009. Oxidative stress induces degradation of mitochondrial DNA. Nucleic Acids Res. [DOI] [PMC free article] [PubMed] [Google Scholar]
- Stringer HA, Sohi GK, Maguire JA, Cote HC, 2013. Decreased skeletal muscle mitochondrial DNA in patients with statin-induced myopathy. J. Neurol. Sci [DOI] [PubMed] [Google Scholar]
- Truett GE, Heeger P, Mynatt RL, Truett AA, Walker JA, Warman ML, 2000. Preparation of PCR-quality mouse genomic DNA with hot sodium hydroxide and tris (HotSHOT). Biotechniques. [DOI] [PubMed] [Google Scholar]
- Tseng LM, Yin PH, Chi CW, Hsu CY, Wu CW, Lee LM, Wei YH, Lee HC, 2006. Mitochondrial DNA mutations and mitochondrial DNA depletion in breast cancer. Genes Chromosom. Cancer. [DOI] [PubMed] [Google Scholar]
- Vu TH, Tanji K, Valsamis H, DiMauro S, Bonilla E, 1998. Mitochondrial DNA depletion in a patient with long survival. Neurology. [DOI] [PubMed] [Google Scholar]
- Wang Y, He S, Zhu X, Qiao W, Zhang J, 2016. High copy number of mitochondrial DNA predicts poor prognosis in patients with advanced stage colon cancer. Int. J. Biol. Markers [DOI] [PubMed] [Google Scholar]
- Wanrooij PH, Engqvist MKM, Forslund JME, Navarrete C, Nilsson AK, Sedman J, Wanrooij S, Clausen AR, Chabes A, 2017. Ribonucleotides incorporated by the yeast mitochondrial DNA polymerase are not repaired. Proc. Natl. Acad. Sci. USA [DOI] [PMC free article] [PubMed] [Google Scholar]
- Yu M, Zhou Y, Shi Y, Ning L, Yang Y, Wei X, Zhang N, Hao X, Niu R, 2007. Reduced mitochondrial DNA copy number is correlated with tumor progression and prognosis in Chinese breast cancer patients. IUBMB Life. [DOI] [PubMed] [Google Scholar]
- Yu M, Wan Y, Zou Q, 2013. Reduced mitochondrial DNA copy number in Chinese patients with osteosarcoma. Transl. Res [DOI] [PubMed] [Google Scholar]
- Zhang H, Singh KK, 2014. Global genetic determinants of mitochondrial DNA copy number. PLoS ONE. [DOI] [PMC free article] [PubMed] [Google Scholar]
- Zorov DB, Juhaszova M, Sollott SJ, 2014. Mitochondrial reactive oxygen species (ROS) and ROS-induced ROS release. Physiol. Rev [DOI] [PMC free article] [PubMed] [Google Scholar]