Abstract
The heart, the first organ to develop in the embryo, undergoes complex morphogenesis that when defective results in congenital heart disease (CHD). With current therapies, more than 90% of patients with CHD survive into adulthood, but many suffer premature death from heart failure and non-cardiac causes1. Here, to gain insight into this disease progression, we performed single-nucleus RNA sequencing on 157,273 nuclei from control hearts and hearts from patients with CHD, including those with hypoplastic left heart syndrome (HLHS) and tetralogy of Fallot, two common forms of cyanotic CHD lesions, as well as dilated and hypertrophic cardiomyopathies. We observed CHD-specific cell states in cardiomyocytes, which showed evidence of insulin resistance and increased expression of genes associated with FOXO signalling and CRIM1. Cardiac fibroblasts in HLHS were enriched in a low-Hippo and high-YAP cell state characteristic of activated cardiac fibroblasts. Imaging mass cytometry uncovered a spatially resolved perivascular microenvironment consistent with an immunodeficient state in CHD. Peripheral immune cell profiling suggested deficient monocytic immunity in CHD, in agreement with the predilection in CHD to infection and cancer2. Our comprehensive phenotyping of CHD provides a roadmap towards future personalized treatments for CHD.
CHD includes a spectrum of lesions, often involving oligogenic inheritance, that commonly leads to paediatric heart failur—the leading cause of death in infants, children and adolescents. CHD affects an estimated 12,000 to 35,000 children under 19 years of age in the United States each year3. Improved supportive medical therapies has increased the number of paediatric patients with CHD who survive into adulthood; however, those patients have an increased risk of severe sequelae, including heart failure and non-cardiac mortality such as cancer and infection through poorly understood mechanisms2,4–6. Tetralogy of Fallot (TOF), the most common cyanotic CHD and a right-sided defect characterized by pulmonary stenosis, ventricular septal defect, overriding aorta and right ventricular hypertrophy, is repaired surgically during infancy. Despite definitive surgical correction and good survival, long-term morbidity is common in patients with TOF1. HLHS, the most severe cyanotic CHD, is a left-sided defect with poorly developed left ventricles, mitral valve, aortic valve and ascending aorta, and requires staged surgical palliations culminating in unique single-ventricle physiology, often described as Fontan circulation7. Ten-year survival for HLHS after surgical palliation1 is 53%. Long-term complications of HLHS are severe and include systemic right ventricule failure, Fontan-associated liver disease, plastic bronchitis and arrhythmias. HLHS is multigenic and genetically heterogenous, making it difficult to model2,8. Thus, there is a need to better understand the molecular nature of CHD to better formulate individualized therapies.
Transcriptomic analysis of CHD
Although paediatric tissue samples are rare and exceedingly difficult to obtain9, we procured enough samples to perform single-nucleus RNA sequencing (snRNA-seq) on nine paediatric CHD heart samples and four donated control paediatric hearts (Fig. 1a and Supplementary Table 1 and 2). We combined our control data with available RNA-sequencing (RNA-seq) data from control hearts of different ages to account for the different ages of our samples10 (3 weeks, 10 weeks, 2 years and 4 years). Collection of TOF and neonatal HLHS (Neo-HLHS) cardiac samples occurred at the time of surgical repair, whereas dilated cardiomyopathy (DCM), hypertrophic cardiomyopathy (HCM) and failing HLHS (HF-HLHS) samples were collected at the time of ventricular assist device placement or heart transplant in patients with acute heart failure (Supplementary Table 2). HLHS and TOF samples were derived from the right ventricule, whereas the other samples were from the left ventricle. Adult human cardiac single-cell data indicate that right and left ventricules have similar transcriptional profiles11,12.
Fig. 1 |. Profiling of tissues from paediatric controls and patients with CHD or heart failure.
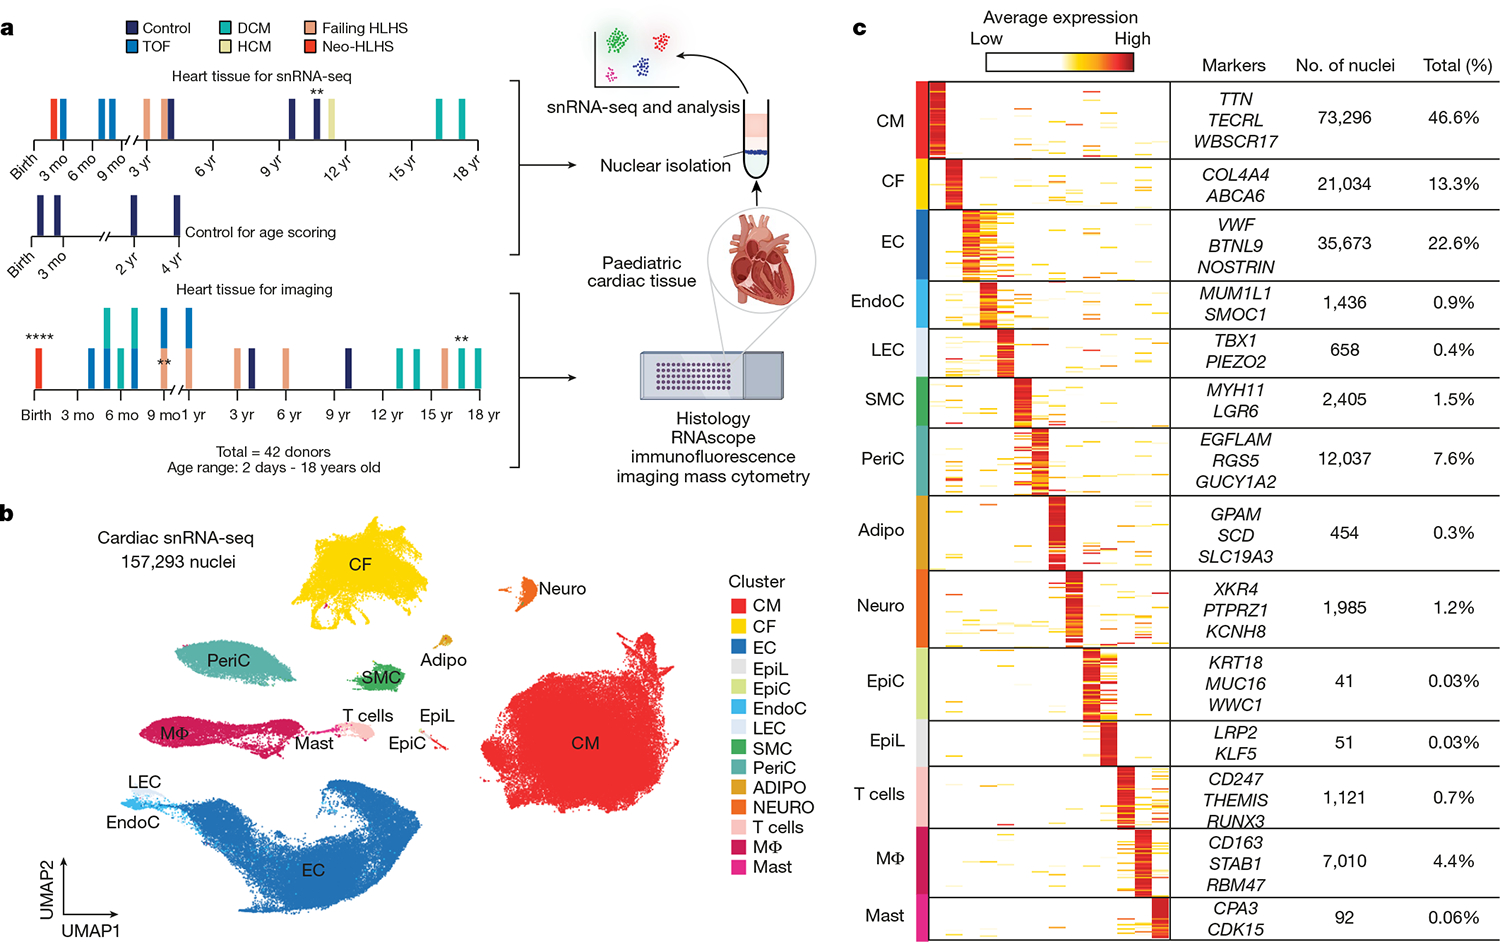
a, Overview of the tissue profiling strategy and the use of available datasets for age scoring. Cardiac tissues collected from paediatric patients were flash-frozen or fixed in formalin. Control data were from Sim et al. (2021)10. Formalin-fixed tissue sections were used for histology and imaging. **n = 2, ****n = 4; mo, month. b, Uniform manifold approximation and projection (UMAP) embedding of 157,293 paediatric cardiac nuclei. CM, cardiomyocyte; CF, cardiac fibroblast; EC, endothelial cell; EpiL, epithelial-like; EpiC, epicardial cell; EndoC, endocardial cell; LEC, lymphatic endothelial cell; PeriC, pericyte; Adipo, adipocyte; Neuro, neuron; MΦ, macrophage. c, Heat map displaying DEGs for each cluster. Clusters are coloured according to Fig. 1b. The signal indicates the average expression for each cluster. Representative genes are displayed on the right. WBSCR17 is also known as GALNT17; MUM1L1 is also known as PWWP3B.
We generated 157,293 single-nuclei transcriptomes from ventricular tissue and identified 14 cell clusters after batch correction and doublet removal (Fig. 1b,c and Extended Data Fig. 1a,b). All the major cardiac cell types were recovered, including cardiomyocytes, cardiac fibroblasts, endothelial cells, vascular smooth muscle cells (SMCs) and macrophages. Rare cell types, including epicardial and mast cells, were also identified (Extended Data Fig. 1c). Pseudo-bulk RNA-seq analysis of the individual libraries revealed global transcriptional distinctions between control heart tissue and those from patients with CHD (Extended Data Fig. 1d). Although principal component analysis (PCA) of pseudo-bulk RNA-seq revealed the influence of age on gene expression, primarily in PC2, this age influence was less prominent in the snRNA-seq data. Cell annotation was based on the differential expression of known marker genes (Fig. 1c, Extended Data Fig. 1e and Supplementary Table 3).
Variation in cardiomyocyte gene expression
Unbiased graph-based iterative clustering on cardiomyocytes from the complete cardiac tissue snRNA-seq dataset uncovered three cardiomyocyte clusters (Fig. 2a). Each cardiomyocyte cluster contained nuclei from multiple samples (Extended Data Fig. 2a,b). We performed differential abundance analysis using a k-nearest neighbour statistical approach13 (Fig. 2b and Methods). The CM1 cluster was primarily derived from control heart (Fig. 2c). Notably, one donor contributed cardiomyocytes from the left and right venricles, which clustered together, consistent with previous data showing few transcriptional differences between the left and right ventricles in adults10–12. CM2 also contained cardiomyocytes from control hearts, as well as cardiomyocytes from all the CHD categories. By contrast, CM3, the most stressed cardiomyocyte category, did not include any cardiomyocytes from the control hearts, and was enriched in TOF, DCM, HCM, Neo-HLHS and HF-HLHS cardiomyocytes (Fig. 2b,c and Extended Data Fig. 2c). Notably, TOF and DCM cardiomyocytes were primarily sorted to CM3 (Fig. 2c and Extended Data Fig. 2a,b). Thus, despite differences in age and biopsy site, DCM and TOF cardiomyocytes clustered together, supporting the conclusion that the main determinant of CM3 cell state was CHD diagnosis.
Fig. 2 |. snRNA-seq showing the unique transcriptional signature of cardiomyocytes in paediatric patients with CHD.
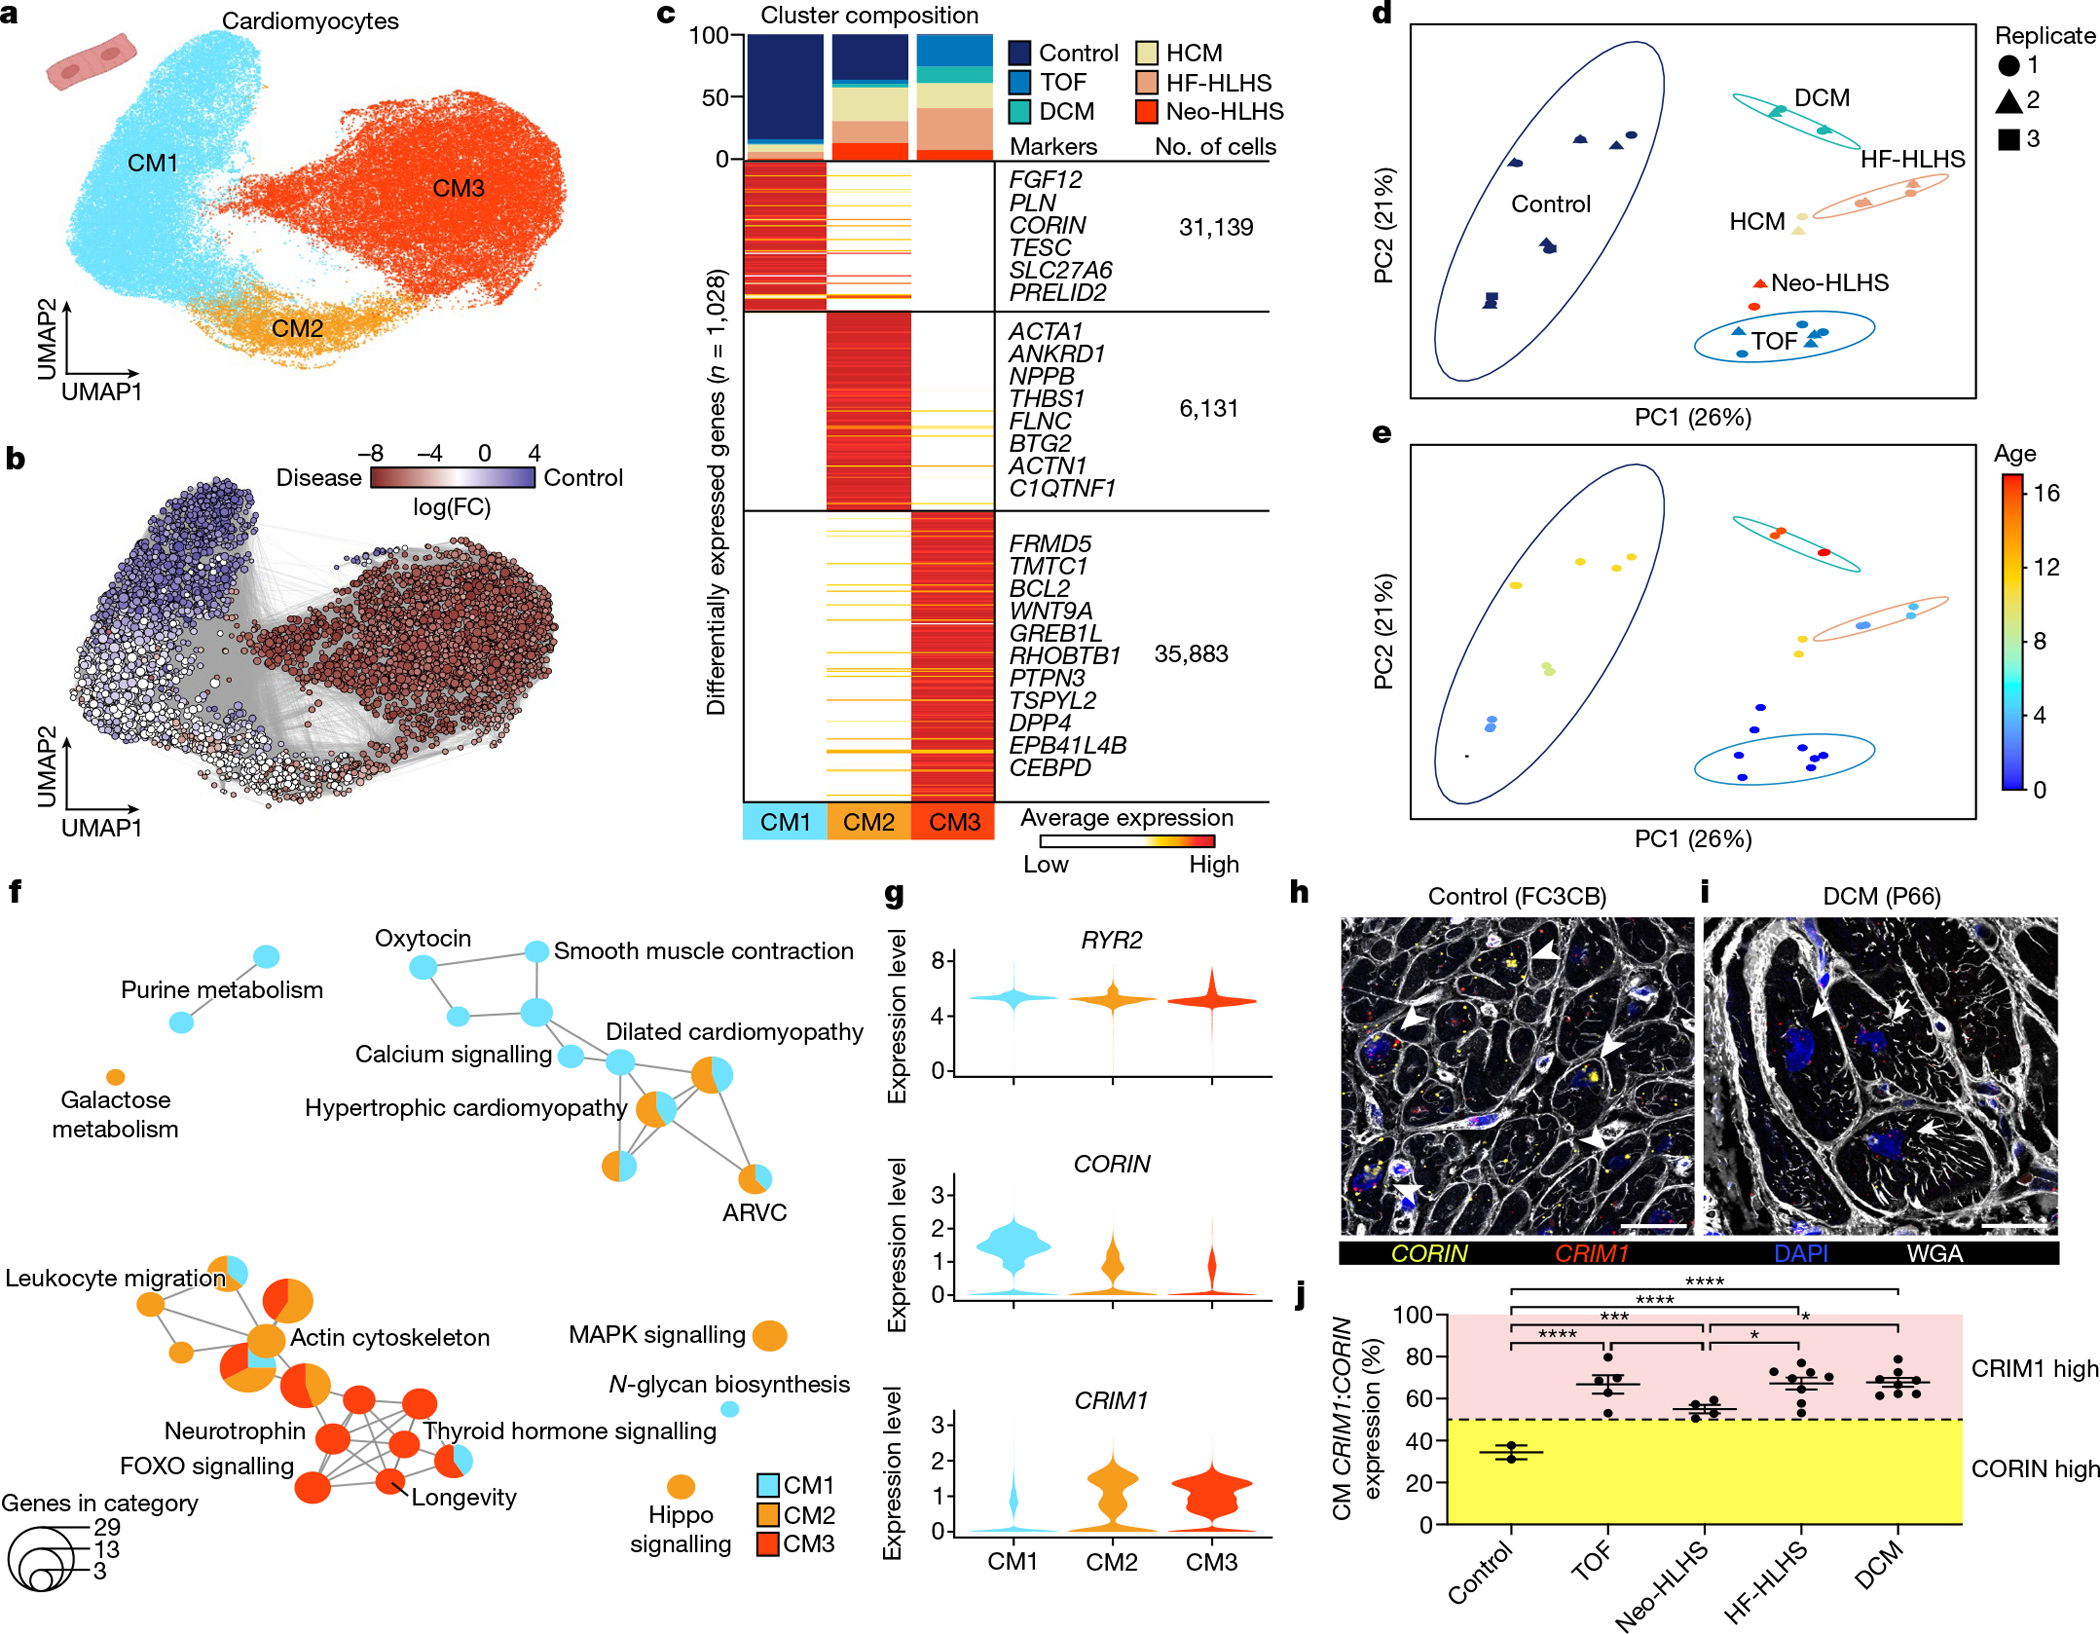
a, UMAP embedding of reiterative clustering of cardiomyocytes. b, Embedding the Milo k-nearest neighbour differential abundance testing results for cardiomyocytes. All nodes represent neighbourhoods, coloured by log fold changes for CHD versus control samples. Neighbourhoods with insignificant log fold changes (false discovery rate (FDR) < 10%) are shown in white. The layout of nodes is determined by UMAP embedding, as shown in a. c, Top, cluster composition plot indicating the percentage of cells from each diagnosis that contribute to each cluster. Bottom, average expression heat map with representative genes shown on the right. d, PCA plot for pseudo-bulk RNA-seq analysis of all cardiomyocytes by diagnosis. Plots are coloured by diagnosis as in c. Ellipses indicate the 95% confidence interval. Replicates (libraries) from each sample indicated by a different shape. e, PCA plot for pseudo-bulk RNA-seq analysis of all cardiomyocytes from d, coloured by donor age. The colours highlight the gross pattern of age progression from youngest to oldest. Ellipses indicate the 95% confidence interval. f, Cluster enrichment map displaying the proportional KEGG pathways analysis for all cardiomyocyte clusters. The size of each node indicates the number of genes within each KEGG category. g, Violin plots showing expression levels for each cardiomyocyte cluster, coloured according to the cluster designations in a. h,i, RNA fluorescence in situ hybridization for CRIM1 and CORIN, co-stained with DAPI and wheat germ agglutinin (WGA). Arrowheads show cardiomyocytes with high CORIN expression and arrows show cardiomyocytes with high CRIM1 expression. j, CRIM1:CORIN expression ratio (n = 672) across 27 individuals (2 control, 5 TOF, 4 Neo-HLHS, 8 HF-HLHS and 8 DCM), each data point is the average relative expression in a sample from one individual. *P < 0.05, ***P < 0.001, ****P < 0.0001 with mixed-effect model. Data are mean values ± s.e.m.
We investigated the sources of variation responsible for cardiomyocyte heterogeneity in greater depth. Although biopsy location is a potential source of confounding variation, our analysis revealed that right and left ventricular control cardiomyocytes clustered together in CM1. In addition, CM3 contained cardiomyocytes from divergent biopsy sites, such as right ventricules from TOF and left ventricules from DCM, indicating that biopsy location was a minor source of cardiomyocyte heterogeneity. Accordingly, we focused our analysis on the influence of age and diagnosis on cardiomyocyte transcriptional heterogeneity.
To determine categorical transcriptional distinctions between different CHD diagnoses, we performed pseudo-bulk RNA-seq on cardiomyocytes and evaluated sample source variation using PCA (Fig. 2d,e). PC1 was associated most significantly with CHD diagnosis and explained the greatest proportion of cardiomyocyte variation (Fig. 2d,e and Extended Data Fig. 2d,e). CHD diagnosis also contributed to the correlation with PC2, although to a lesser degree than age (Fig. 2d,e and Extended Data Fig. 2d,e). We determined genes that were correlated with age and CHD diagnosis (adjusted P-value < 0.01). Individual CHD categories displayed overlapping gene signatures with other CHD categories but also had unique gene signatures (Extended Data Fig. 2f and Supplementary Table 4). Of note, there were fewer genes uniquely associated with age (n = 70) than with CHD diagnosis (n = 862) (Extended Data Fig. 2g). Thus although age-related gene-expression signatures were detectable, the largest driver of variation in gene-expression signatures was CHD diagnosis.
Paediatric cardiomyocyte maturation
To identify genes that regulate human cardiomyocyte maturation independently of CHD diagnosis, we used available bulk RNA-seq data from human cardiomyocyte nuclei isolated from young donors (3 weeks old, 10 weeks old, 2 years old and 4 years old) and adults10. We extracted genes enriched in young cardiomyocytes (n = 131) and genes enriched in adult cardiomyocytes (n = 132) and constructed a gene-expression score for the modules, which we refer to as ‘Adult’ or ‘Young’ modules, to score individual cardiomyocytes (Extended Data Fig. 2h). We also generated a CM2 module score, using highly expressed CM2 markers, as a gene-expression module control (Methods). Positive gene-expression module scores indicate increased expression of a gene set over randomly selected genes, and negative values indicate decreased expression below randomly selected genes.
We observed an enrichment of the Young gene-expression module in our cardiomyocyte dataset compared the Adult module. We compared Young and Adult scores for each donor (Extended Data Fig. 2i). The Young score decreased with donor age, whereas the Adult score increased with age, supporting our gene-expression module scoring approach to interrogate cardiomyocyte maturation. Overall, no one age signature dominated our cardiomyocyte dataset, supporting the conclusion that cardiomyocyte age was not the main driver of cardiomyocyte heterogeneity.
To further demonstrate the validity of the aging gene-expression module score, we scored independent snRNA-seq data from fetal, juvenile and adult donors10 that were not used to construct our gene-expression modules. We found that cardiomyocytes scored as predicted, with the fetal cardiomyocytes being most enriched, the young cardiomyocytes being intermediate, and adult cardiomyocytes being least enriched for the Young gene-expression module. The Adult gene-expression module also gradually increased with age of the donor (Extended Data Fig. 2j).
To uncover genes regulating human cardiomyocyte maturation that are also associated with the Young versus Adult distinction in our large cardiomyocyte dataset, we interrogated age-associated genes in greater detail (Extended Data Fig. 3a,b). By extracting and comparing differentially expressed genes (DEGs) in cardiomyocytes scored as Young versus Adult, we identified cardiomyocyte maturation genes that were associated with cell growth, as expected, but also genes associated with oxytocin signalling. Pathways involved with myogenesis, negative regulation of the immune system and the cellular response to growth factor were enriched in the Young gene signature. Our data are consistent with the conclusion that age is a minor contributor to cardiomyocyte gene-expression differences in CHD, however improved age matching of control and disease samples will be important as more data become available.
Cardiomyocyte characteristics in CHD
We explored transcriptional characteristics of cardiomyocytes by performing pathway enrichment analysis on DEGs (Fig. 2f, Extended Data Fig. 4a and Supplementary Table 5). We generated enrichment maps using DEGs to determine the proportion of genes derived from each cluster (P-value < 0.05) (Fig. 2f; Methods). CM1, derived from control donor tissue, was enriched in gene categories associated with muscle contraction, calcium signalling and adrenergic signalling. CM2 contained transcriptional signatures including actin cytoskeleton, tight junctions, leukocyte migration and Hippo signalling consistent with remodelling and inflammation in CHD. Notably, increased Hippo signalling has been implicated in cytokinesis failure in cardiomyocytes from TOF14. DEGs in CM2 included cardiac stress markers such as NPPA, THBS1, ANKRD1 and NPPB15 (Fig. 2c and Supplementary Table 4). CM3, derived uniquely from CHD, had prominent metabolic signatures of increased EGFR signalling, FOXO signalling and insulin resistance (Fig. 2f).
Other DEGs included CORIN and CRIM1, which have been implicated in adult heart failure but not in CHD. CORIN is a transmembrane serine protease that cleaves and activates atrial and brain natriuretic propeptides16,17. CORIN deficiency results in maladaptive atrial natriuretic factor and brain natriuretic factor propeptide accumulation and is associated with worse clinical outcomes in adult heart disease18. CORIN expression was reduced in the CHD-enriched clusters CM2 and CM3 compared with CM1 (Fig. 2g and Extended Data Fig. 4a). CRIM1 is enriched in CM2 and CM3, is likely to modulate TGFβ signalling, and has been suggested as a biomarker for heart failure in adults19 (Fig. 2g and Extended Data Fig. 4a). RYR2, a canonical cardiomyocyte marker, was similarly expressed in CM1, CM2 and CM3 (Fig. 2g). Quantification of CRIM1 and CORIN expression ratios in individual cardiomyocytes by dual RNA fluorescent in situ hybridization (RNAscope) showed a greater CRIM:CORIN ratio in single cardiomyocytes from TOF, Neo-HLHS, HF-HLHS and DCM compared with controls, indicating that CORIN expression is reduced and CRIM1 expression is increased in CHD (Fig. 2h–j and Extended Data Fig. 4b–d).
For further validation, we performed assay transposase-accessible chromatin using sequencing (ATAC-seq) to assess open versus closed chromatin and cardiomyocyte cell state. Loci of CHD-enriched open chromatin were compared to DEGs from CM2 and CM3 (Extended Data Fig. 4e,f and Supplementary Table 6). The ATAC-seq data overlapped with the snRNA-seq, with 90% (n = 289) of DEGs in CM2 and 84% (n = 396) of DEGs in CM3 having more accessible chromatin compared with controls. More accessible genes from CM2 included THBS1 and GADD45B, and those from CM3 included WNT9A and FRMD5 (Extended Data Fig. 4e and Supplementary Table 6).
Cardiac fibroblast heterogeneity in CHD
Iterative clustering of cardiac fibroblasts identified four cardiac fibroblast clusters (CF1–CF4) (Fig. 3a,b and Extended Data Fig. 5a–c). Control cardiac fibroblasts contributed to CF1, CF3 and CF4—but not to CF2—and revealed gene expression associated with cardiac fibroblast activation and inflammation in CF3 and CF4, most probably owing to myocardial stress during the organ procurement process, including surgery and mechanical ventilation20. CF1 comprised cardiac fibroblasts from controls as well as from all CHD diagnoses (Fig. 3c and Extended Data Fig. 5b,c). The CF2 cluster was derived only from CHD samples, and the largest contributions to CF2 were from DCM and TOF. CF3 included cells from control, DCM and Neo-HLHS hearts, and exhibited gene-expression signatures consistent with cardiac fibroblast activation, as indicated by expression of the cardiac fibroblast activation markers FAP and POSTN21 (Fig. 3c, Extended Data Fig. 5b,c and Supplementary Table 7). CF4 was composed of cardiac fibroblasts from all heart samples but was enriched in cardiac fibroblasts from HLHS (Neo-HLHS and HF-HLHS) (Fig. 3c).
Fig. 3 |. Profiling of cardiac fibroblasts in paediatric patients.
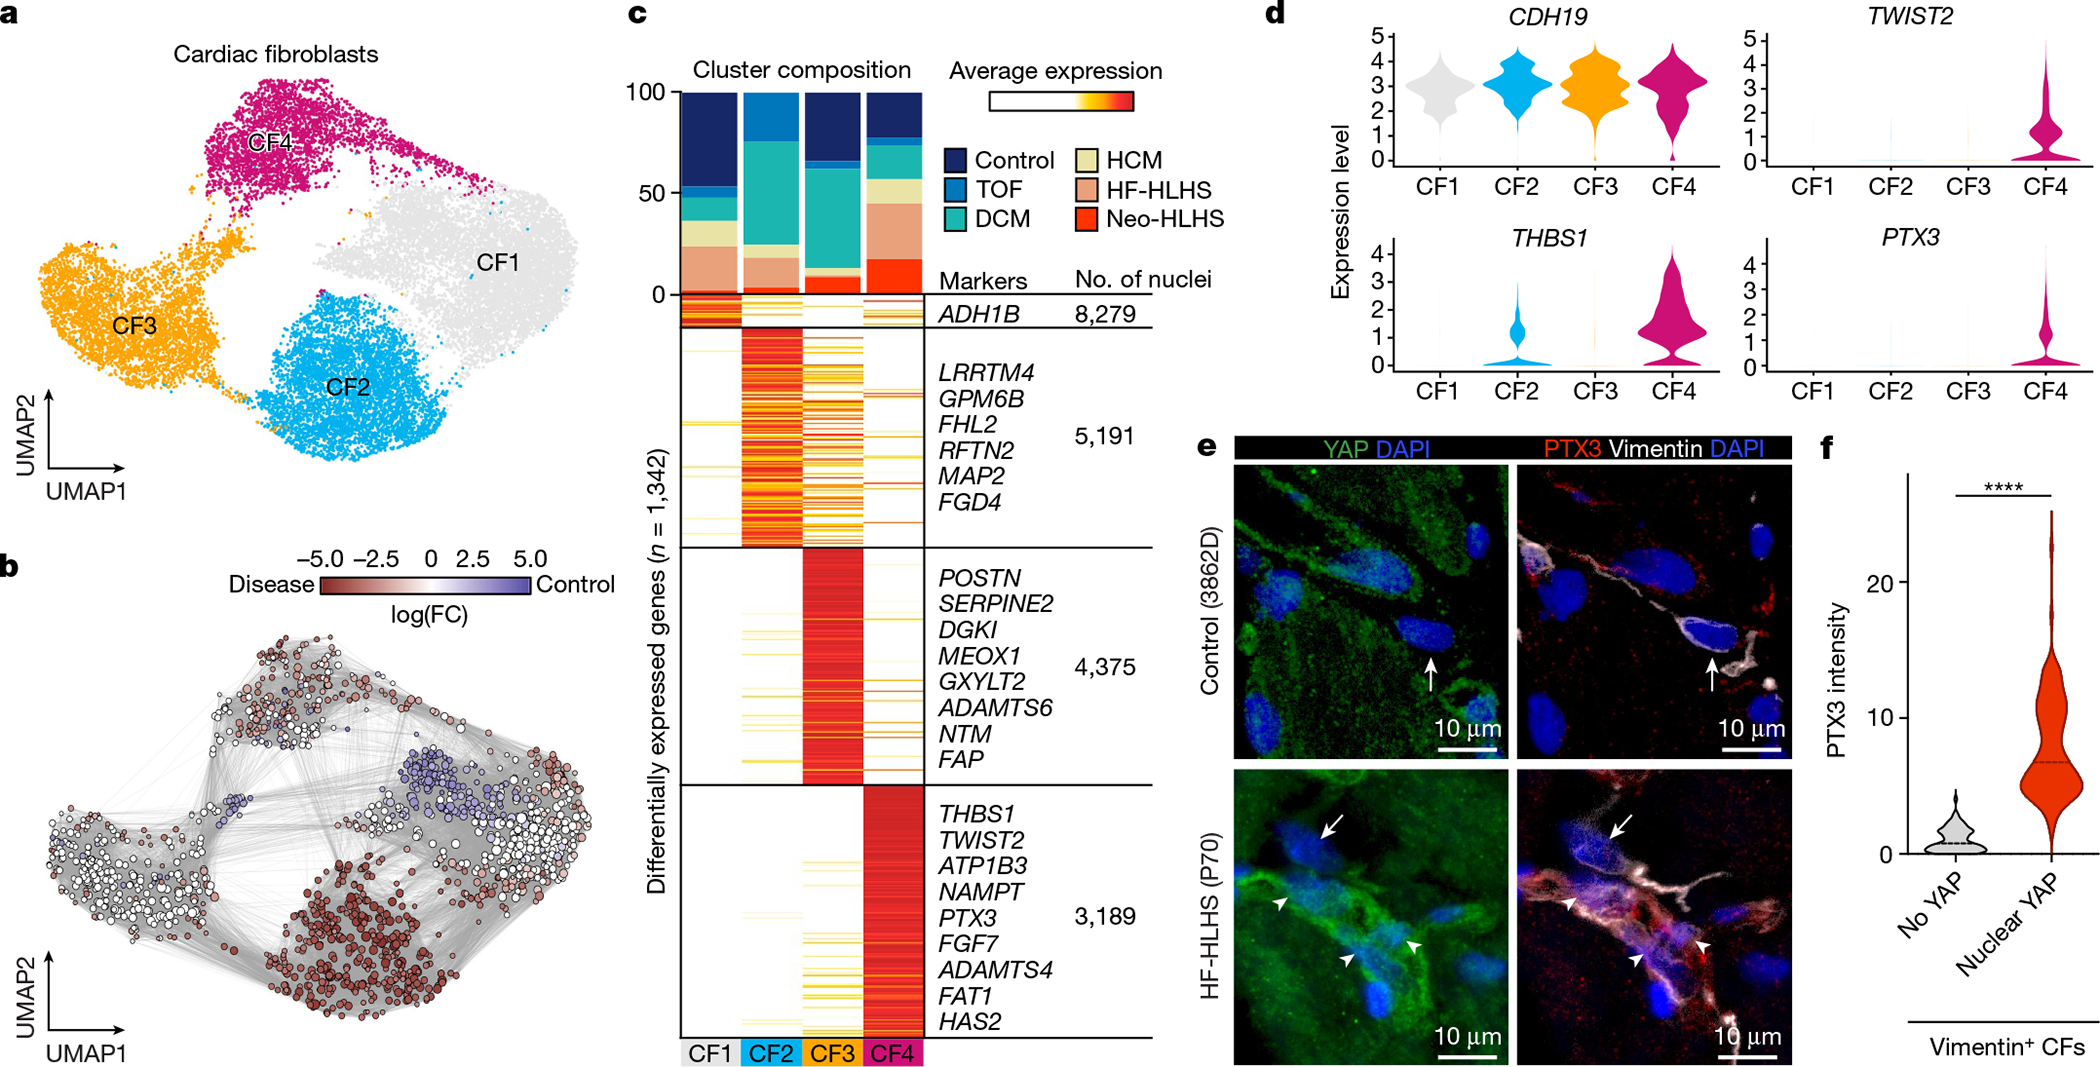
a, UMAP embedding of cardiac fibroblast reiterative clustering. b, Embedding of Milo k-nearest neighbour differential abundance testing results for cardiac fibroblasts. All nodes represent neighbourhoods, coloured by log fold change for CHD versus controls. Neighbourhoods with insignificant log fold changes (FDR <10%) are shown in white. The layout of nodes is determined by UMAP embedding shown in a. c, Top, cluster composition plot indicating the percentage of cells from each diagnosis that contribute to each cluster. Bottom, average expression heat map with representative genes shown on the right. d, Violin plots showing expression levels for each cardiac fibroblast cluster, coloured according to the cluster designations in a.e, Representative YAP and PTX3 expression in vimentin-positive cardiac fibroblasts in an HF-HLHS sample. Arrows show cardiac fibroblasts without nuclear YAP and arrowheads denote nuclear YAP. f, Quantification of PTX3 intensity in cardiac fibroblasts that are negative (n = 73) and positive (n = 101) for nuclear YAP across fifteen samples (2 controls, 3 TOF, 2 neo-HLHS, 4 HF-HLHS and 4 DCM). Two-tailed Mann–Whitney test. ****P < 0.0001.
Gene Ontology (GO) analysis revealed that CF1, largely composed of cells from controls, had signatures of metalloendopeptidase inhibitor activity (thought to be an anti-fibrotic signal22), acyltransferase activity and hormone binding involved in lipid metabolism and cellular homoeostasis (Extended Data Fig. 5d). CF2 contained signatures of increased insulin signalling, including genes such as IGFBP5, which promotes fibrosis, and genes involved in promoting GEF activity, which also result in enhanced fibrotic signalling23,24 (Extended Data Fig. 5d). CF3 was enriched in genes controlling cytoskeletal remodelling as well as actin and integrin binding. CF3 and CF4 both showed increased expression of growth factor genes and genes associated with TGFβ signalling, which is profibrotic (Extended Data Fig. 5d). CF4 included increased expression of canonical YAP target genes such as CYR61 (also known as CCN1), FAT1, THBS1, CCL2, AMOTL1 and PTX325 (Fig. 3d and Supplementary Table 7). In addition, CF4 was marked by the expression of KDM6B, which encodes a histone demethylase important for the profibrotic cardiac fibroblast phenotype26 (Supplementary Table 7). We used immunofluorescence to study co-localization of nuclear YAP and PTX3, a target of YAP and a CF4 marker, in control and multiple CHD samples (Fig. 3e,f). Control cardiac fibroblasts expressed very low levels of nuclear YAP or PTX3, whereas HF-HLHS cardiac fibroblasts had high levels of nuclear YAP with co-localized PTX3. Quantification of co-localized nuclear YAP and PTX3 expression in vimentin-positive cardiac fibroblasts revealed that HF-HLHS samples were enriched for nuclear YAP- and PTX3-expressing cardiac fibroblasts, consistent with the snRNA-seq data indicating that CF4 has high YAP activity (Fig. 3e). Quantification of co-localized nuclear YAP and PTX3 expression in cardiac fibroblasts across multiple CHD diagnoses indicated that nuclear YAP and PTX3 were more commonly co-localized in CHD compared with controls (Fig. 3f).
Endothelial cell heterogeneity in CHD
Iterative clustering of endothelial cells revealed seven endothelial cell clusters (EC1–EC5, EndoC and LEC), including all subclasses of vascular endothelial cells (Extended Data Fig. 5e,f). EC1 represented capillary endothelial cells and expressed the markers CA4 and RGCC27, whereas EC2 represented venous endothelial cells and expressed canonical venous markers NR2F2 and SELP28,29 (Extended Data Fig. 5e,f and Supplementary Table 8). EC3 exhibited a pro-inflammatory signature, expressing cytokines such as IL6 and the gene encoding the NFκB family transcription factor RELB (Extended Data Fig. 5e,f). EC4 had an arterial endothelial cell signature, with GJA5 and SEMA3G expression28,30. EC5 was derived from a patient with DCM and comprised a small cluster of endothelial cells expressing KIT.
We compared control endothelial cells to endothelial cells from all CHDs using k-nearest neighbour differential abundance analysis and found that endothelial cells were more homogenous across CHD compared with cardiomyocytes and cardiac fibroblasts (Extended Data Fig. 5g,h). Consistent with the similarity in endothelial cell states between CHD samples, differential expression analysis and cluster composition across CHD diagnoses were similar (Extended Data Fig. 5i and Supplementary Table 8). Most endothelial cell clusters appeared in all CHD samples, with the exception of EC5, which was from a single patient with DCM and probably represents a patient-specific cell cluster. The enrichment of EC5 was not significant given its small size (Extended Data Fig. 5h). When compared by CHD diagnosis, endothelial cells from Neo-HLHS were enriched in inflammatory EC3, whereas TOF rarely contributed to EC3 (Extended Data Fig. 5i). One patient with HCM (P86) had increased LECs, which has not been reported in paediatric patients, but is consistent with adult HCM31 (Extended Data Fig. 5i).
Differential pathway enrichment analysis revealed that the venous EC2 cluster was associated with metallothionein and platelet activation, suggesting venous thrombosis and disrupted redox homoeostasis, a known complication in CHD32 (Extended Data Fig. 5j). The inflammatory EC3 cluster showed enrichment for interleukin signalling and extracellular matrix interactions, whereas cells in the arterial EC4 cluster had higher levels of the mechano-responsive NOTCH signalling pathway, elastin fibre expression, Rho GTPase activity, and proapoptotic NRAGE signalling, suggesting arterial endothelial cell dysfunction33 (Extended Data Fig. 5j).
YAP- and MYC-driven gene programs in CHD
Histology and immunofluorescence analysis showed that control donor tissue had interstitial oedema, consistent with the activated stress response genes observed in snRNA-seq data (Fig. 4a,b and Extended Data Fig. 6). Myocardium from Neo-HLHS and TOF had grossly normal tissue architecture, whereas those from late-stage heart failure, including HF-HLHS and DCM, exhibited replacement and interstitial fibrosis and inflammatory infiltrates, consistent with inflammatory transcriptional signatures identified in snRNA-seq data (Fig. 4a,b and Extended Data Fig. 6a–e).
Fig. 4 |. Tissue histology and validation of tissue snRNA-seq results across paediatric cardiac diseases.
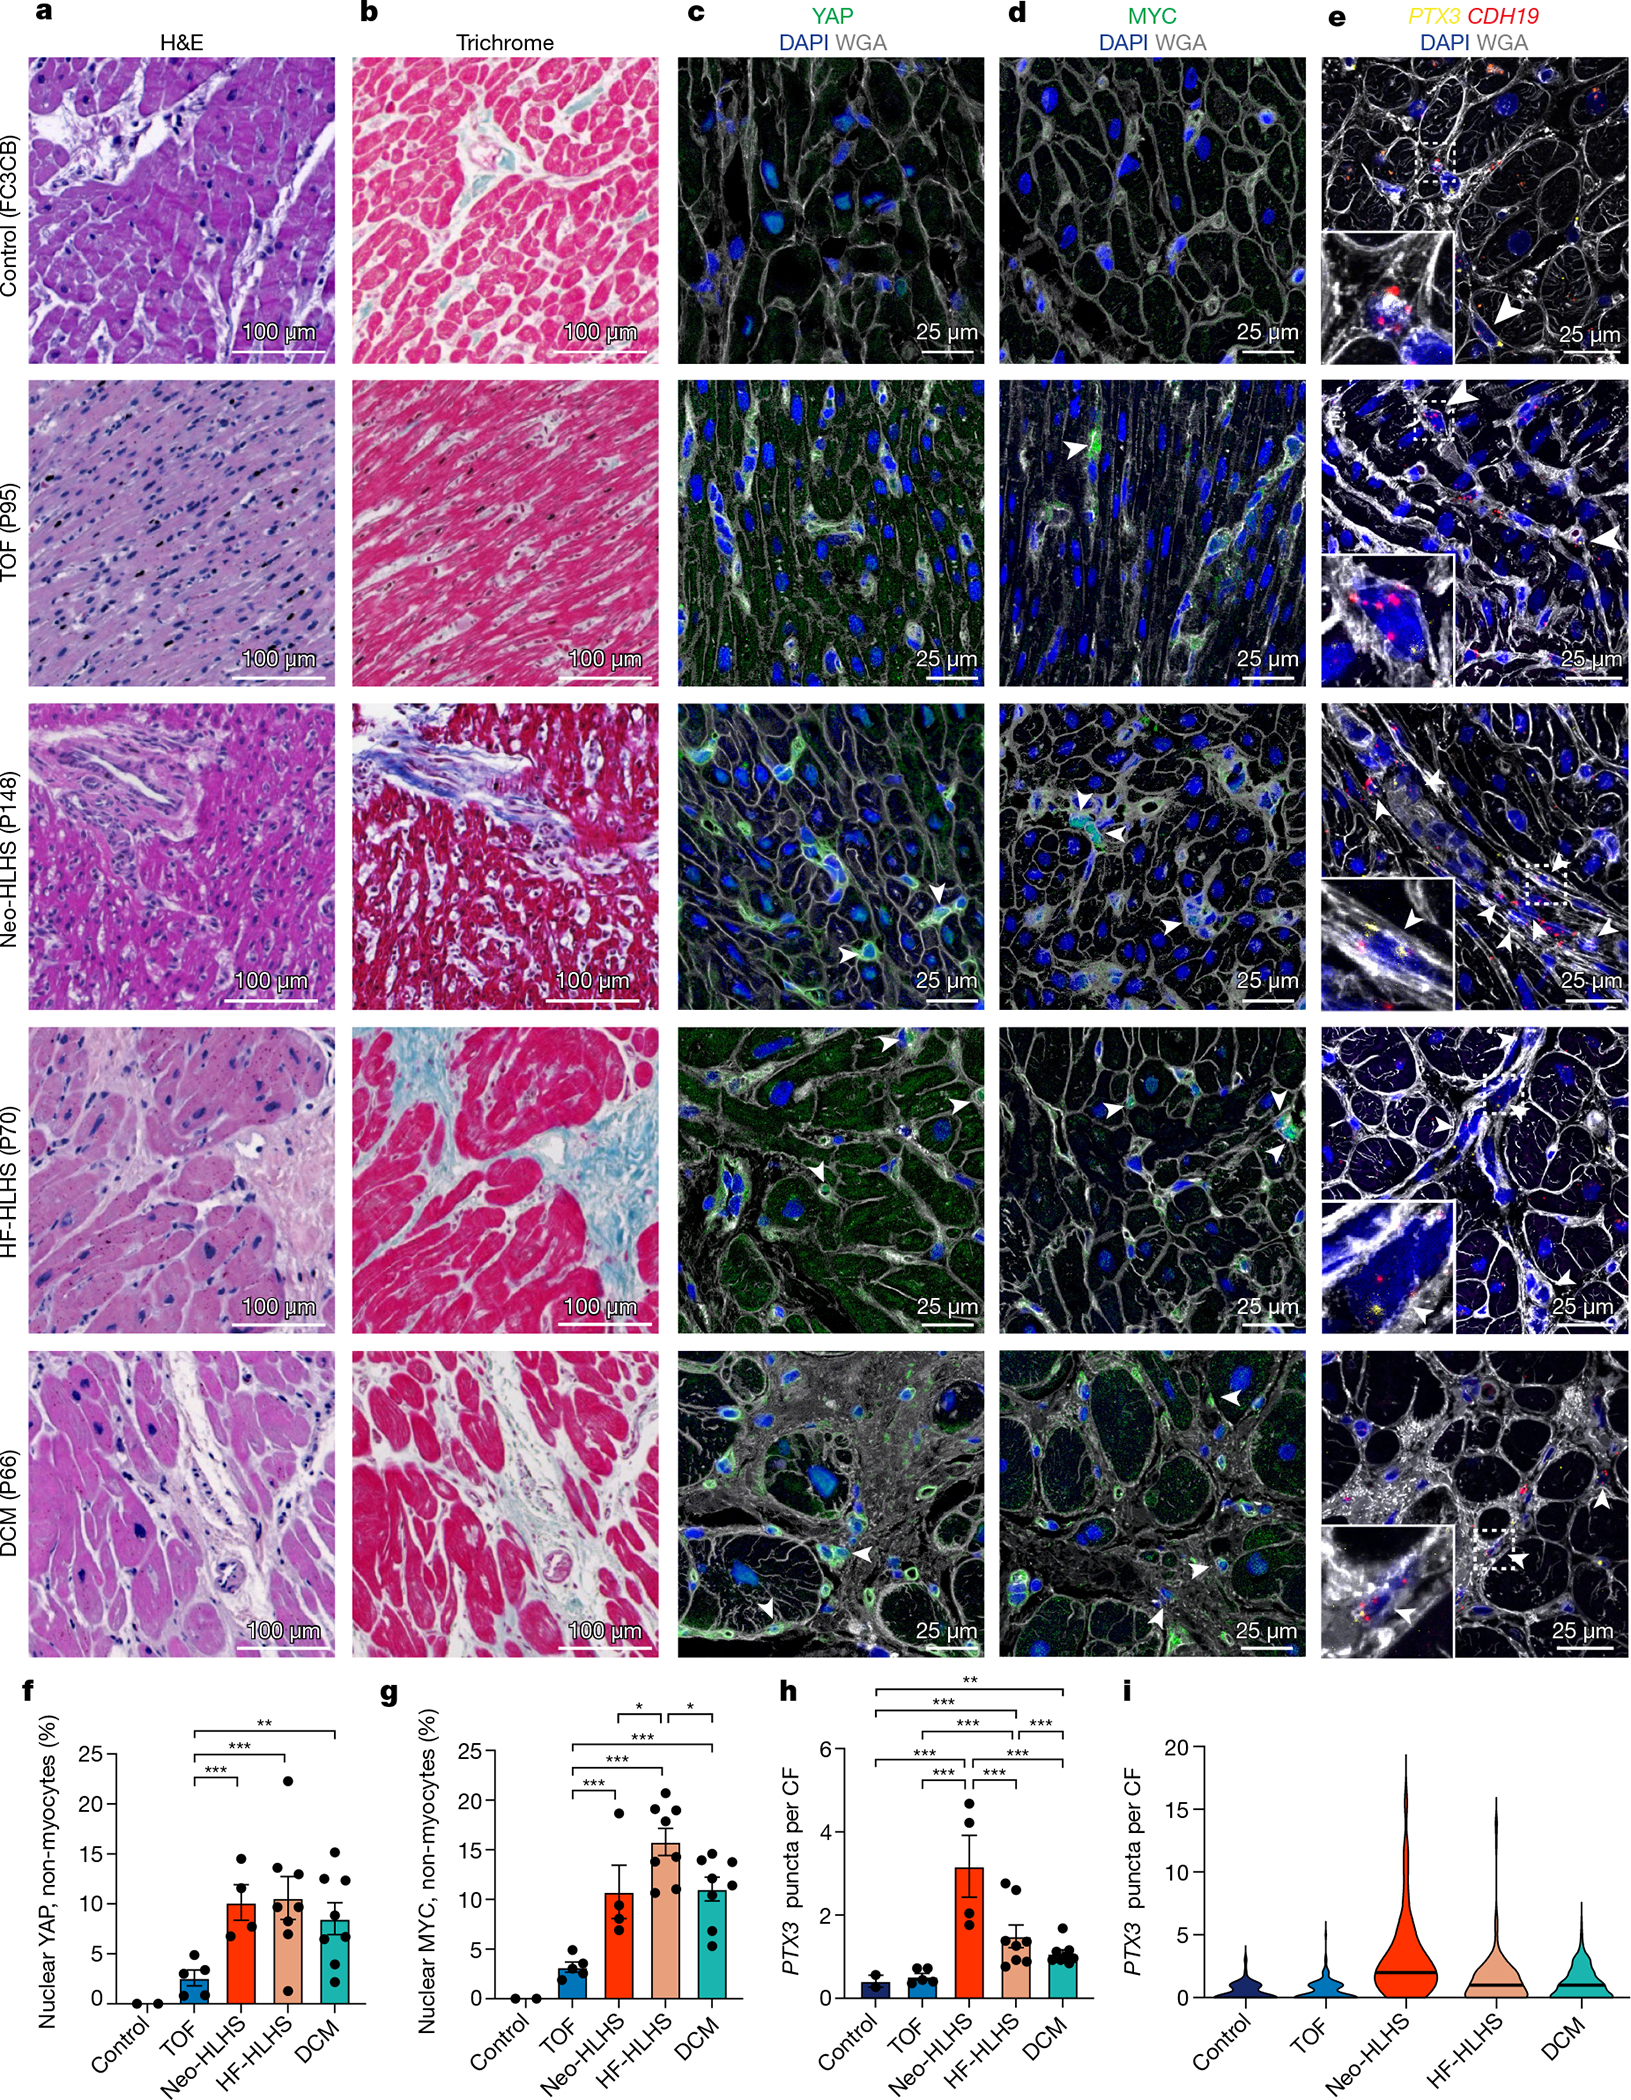
a, Haematoxylin and eosin (H&E) staining of myocardial samples. b, Masson’s trichrome staining of myocardial samples. c,d, Tissue immunohistochemistry for YAP (c) and MYC (d), co-stained with DAPI and WGA to visualize tissue composition. Arrowheads indicate cells with a nuclear expression pattern of the protein of interest. e, RNAscope for PTX3 and CDH19, co-stained with DAPI and WGA to visualize tissue composition. Arrowheads show co-expression of PTX3 and CDH19. f,g, Quantification of nuclear localization of YAP (f) and MYC (g) in non-myocytes (n = 5,897 for YAP, n = 5,149 for MYC). Each data point shows the percentage of cells with nuclear expression in one sample (2 control, 5 TOF, 4 Neo-HLHS, 8 HF-HLHS and 8 DCM). h, Quantification of relative PTX3 expression in CDH19+ fibroblasts (n = 668). Each data point is the average expression from an individual sample (2 control, 5 TOF, 4 Neo-HLHS, 8 HF-HLHS and 8 DCM). i, Violin plot of PTX3 expression in cardiac fibroblasts (n = 668). *P < 0.05, **P < 0.01, ***P < 0.001; mixed-effects model. Data are mean ± s.e.m.
snRNA-seq and immunofluorescence indicated that CF4 (Fig. 3c–f), which was enriched in patients with Neo-HLHS or HF-HLHS, had a low-Hippo–high-YAP transcriptional signature25. Using immunofluorescence for further validation, we found that control tissue lacked nuclear-localized YAP or MYC (a YAP target) in non-myocytes, whereas TOF tissue exhibited rare non-myocyte nuclear YAP and MYC (Fig. 4c–d,f,g). By contrast, nuclear YAP and MYC were commonly found in non-myocytes of Neo-HLHS, HF-HLHS and DCM samples (Fig. 4c,d,f,g). The enrichment of CF4 in Neo-HLHS and HF-HLHS hearts was further validated by RNAscope detection of the YAP target PTX3. Co-staining for the fibroblast markers CDH19 and PTX3 revealed that Neo-HLHS and HF-HLHS hearts showed increased PTX3 expression in cardiac fibroblasts, with Neo-HLHS hearts showing the highest PTX3 expression (Fig 4e,h,i), consistent with snRNA-seq results showing that Neo-HLHS and HF-HLHS samples were enriched for CF4 (Extended Data Fig. 5a–c). Better age matching between control and CHD samples as more become available is expected to further support our findings.
The perivascular microenvironment in CHD
We investigated spatially resolved inflammatory cell heterogeneity in CHD and control samples using imaging mass cytometry (IMC) and image segmentation, phenotyping and marker quantification (Fig. 5a and Extended Data Fig. 7a,b). We quantified 23 biomarkers in 21 samples using an antibody panel for inflammation, which also included markers of cell proliferation, DNA damage and fibrosis (Fig. 5b). We identified 11 clusters of perivascular cells, including vascular SMCs, macrophages, cardiac fibroblasts and endothelial cells located in proximity to SMCs (EC-SMC) (Fig. 5c,d). Macrophages separated into 3 clusters (MΦ1–MΦ3), distinguished by expression of CD68, CD14 and CD163, and were localized to perivascular fibrotic areas (Fig. 5b–d and Extended Data Fig. 7b). MΦ1 and MΦ2 were localized near T cells, which expressed immunosuppressive molecules, including PD-L1 (also known as CD274), CD73 and CD33 (Fig. 5d,e). PD-L1 is part of an immunosuppressive checkpoint with functions to prevent autoimmune disease in the heart34. The CD73 ecto-enzyme, elevates local adenosine levels in the microenvironment to suppress the immune response35. In tumours, CD33 is expressed by myeloid-derived immunosuppressor cells, which have, to our knowledge, not previously described in connection with CHD36. The perivascular T cells, which expressed proteins consistent with an anti-inflammatory signature, were localized near vessel-specific ACTA2+ cells and were expanded in CHD compared with controls, suggesting an immunosuppressed perivascular microenvironment in CHD (Fig. 5b,e).
Fig. 5 |. High-dimensional histopathology of paediatric cardiac diseases.
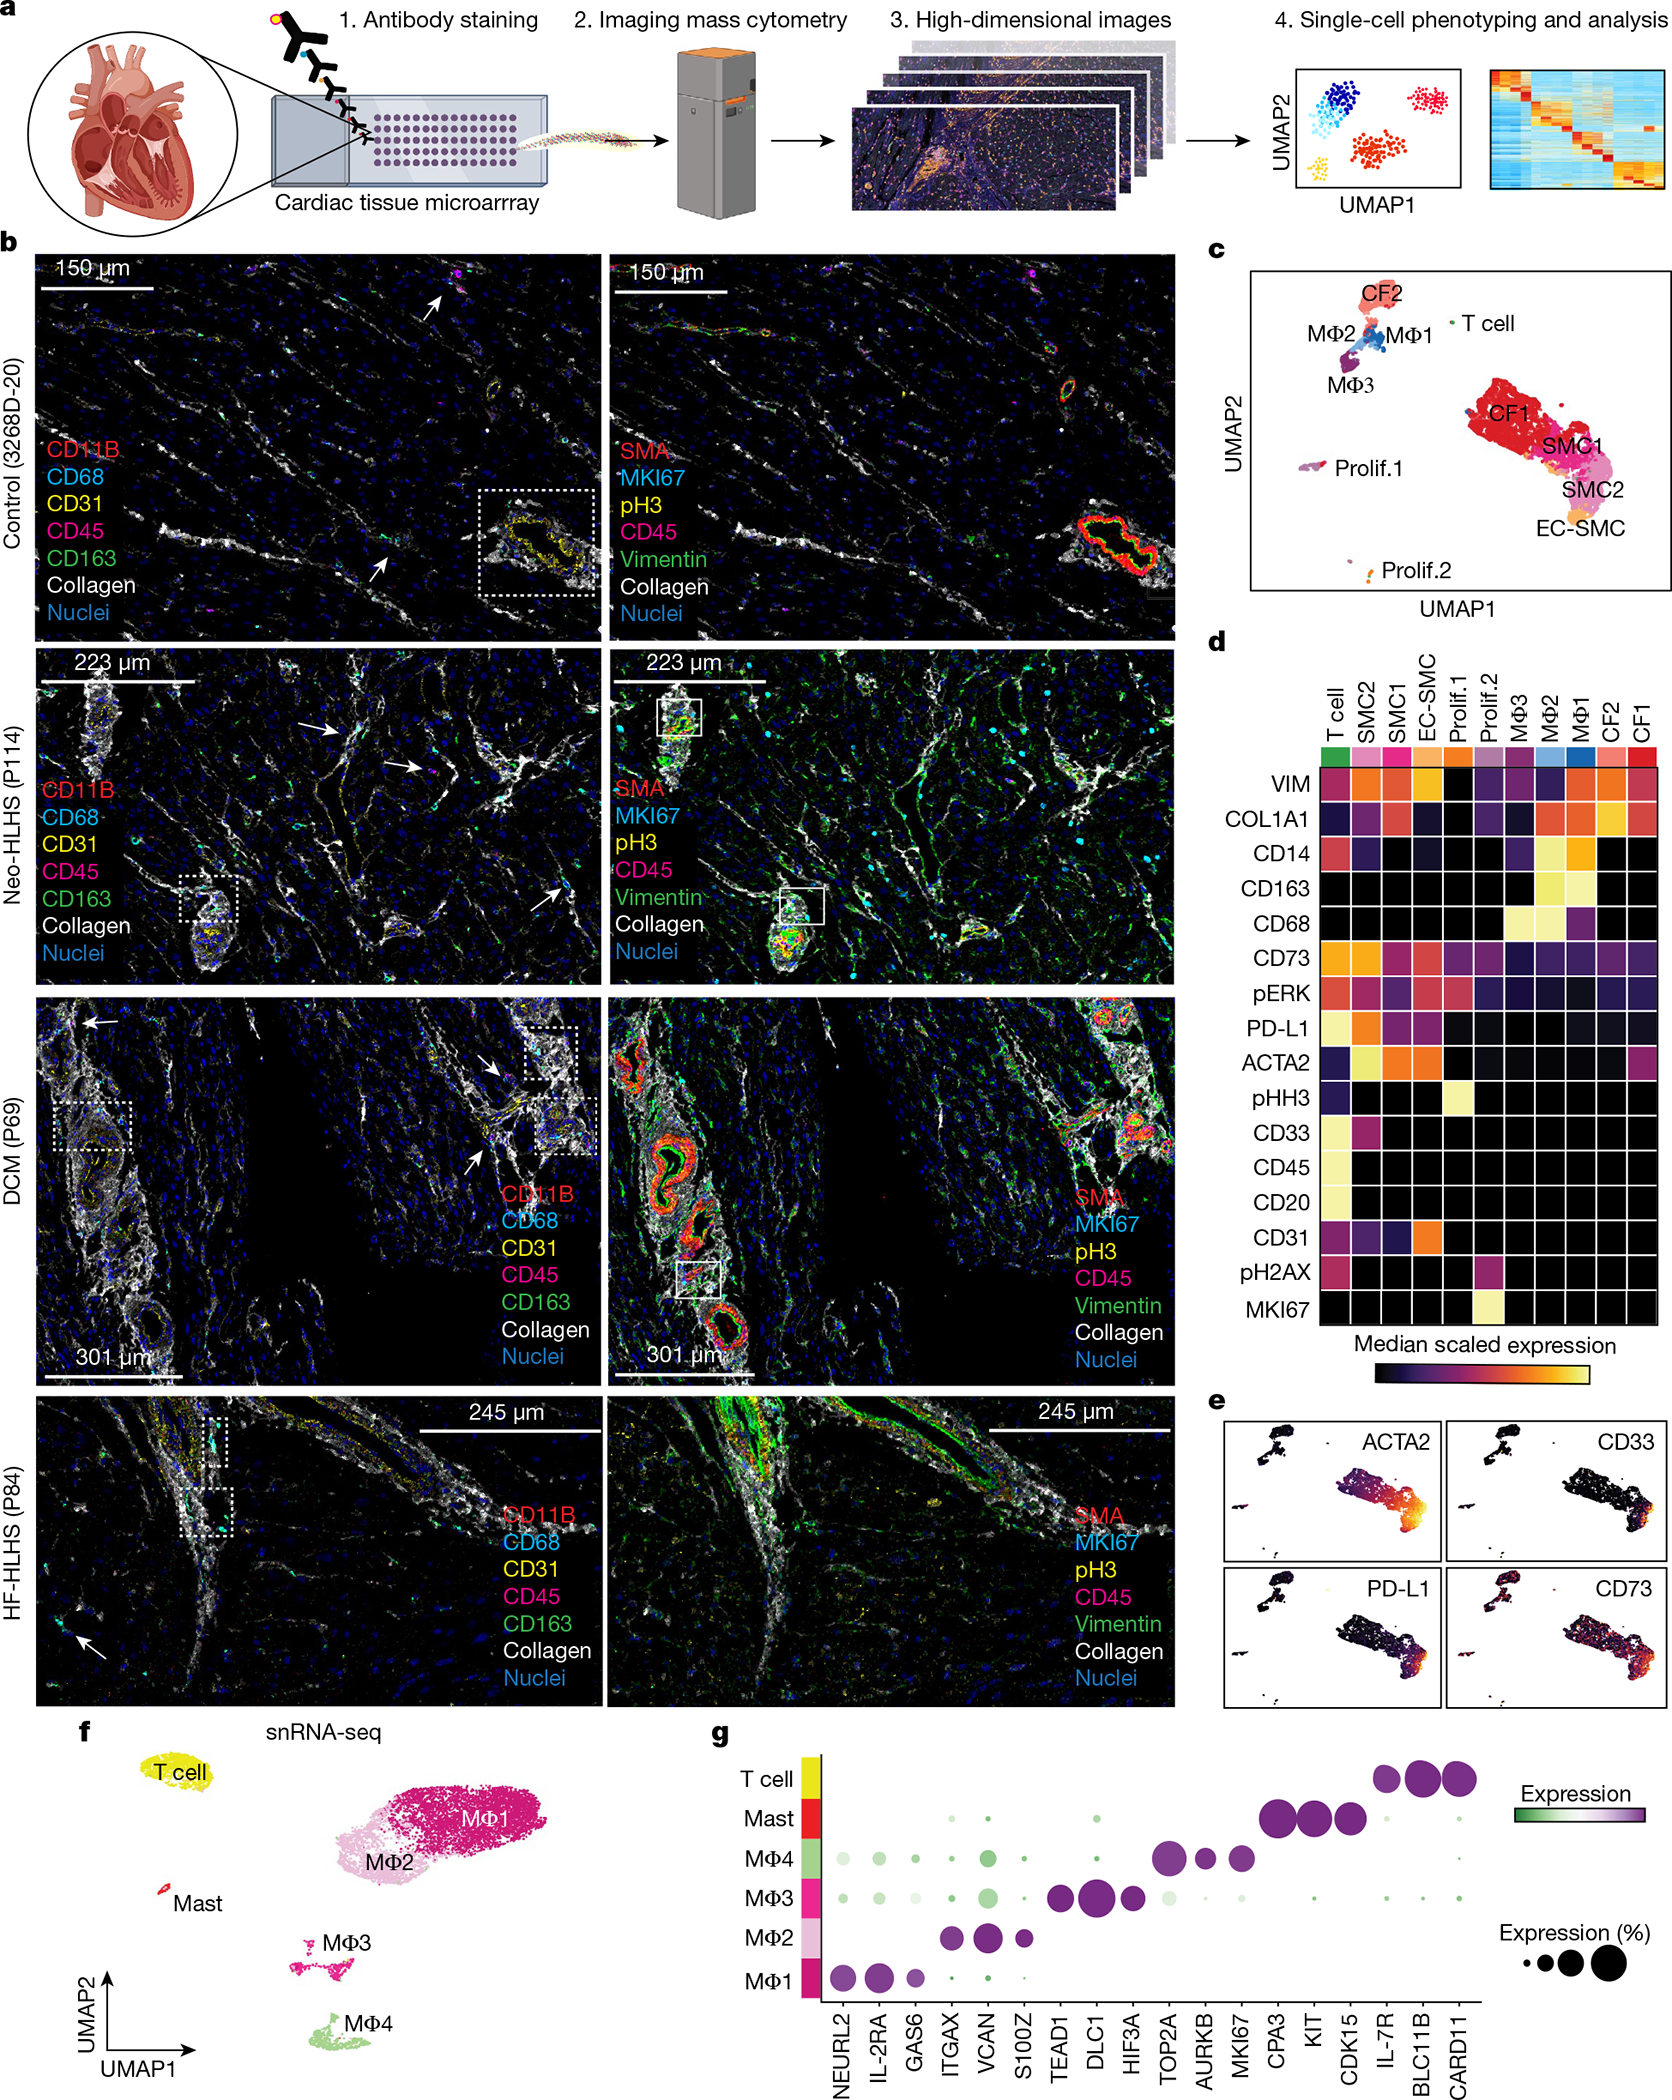
a, Schematic of the IMC experimental and analytical workflow. b, Representative IMC images from the indicated patient samples. Dashed boxes indicate immune infiltrates in perivascular regions. Arrows indicate cells expressing immune marker CD45 and macrophage-specific markers (CD163, CD68 and CD11B). Solid boxes indicate cells expressing the proliferation marker MKI67 in perivascular regions. c, UMAP embedding of all IMC data, coloured by cluster. Prolif., proliferating cells. Total samples: 20 (1 Neo-HLHS, 8 HF-HLHS, 3 TOF, 8 DCM). d, Heat map displaying biomarker expression across each cell cluster. e, Plots showing biomarker expression from IMC. f, UMAP embedding of immune cell populations derived from cardiac tissue. g, Dot plot showing highly expressed markers for each immune cell population.
We next used our snRNA-seq data to identify clusters of macrophages, mast cells and T cells (Fig. 5f,g). Whereas IMC identified three macro phage clusters, snRNA-seq data revealed four macrophage clusters in control and CHD groups (Fig. 5f,g and Extended Data Fig. 7c,d). Differential expression analysis identified genes that distinguished each cluster (n = 2,333 genes) (Fig. 5g, Extended Data Fig. 7e and Supplementary Table 9). Pathway enrichment revealed MΦ2, a cluster in which interferon-γ (IFNγ) signalling genes were expressed (Extended Data Fig. 7f). Although pro-inflammatory in many tissues, IFNγ signalling is immunosuppressive in the heart37. Moreover, PD-L1 (also known as CD274) is known to be induced by IFNγ signalling, suggesting that MΦ2, by expressing IFNγ, inhibits T cell activation in the perivascular microenvironment in CHD, a hypothesis that is also supported by spatially resolved IMC38 (Fig. 5c,d). Of note, the proliferative MΦ4 cluster was rare in CHD, consistent with an immunosuppressed state, an observation that has been made recently in adult DCM but– not in CHD39 (Extended Data Fig. 7d–f).
Characterization of PBMCs in CHD
To investigate systemic inflammation in CHD, we profiled peripheral blood mononuclear cells (PBMCs), a clinically accessible cell population with diagnostic value. We generated a dataset combining 63,086 single-cell PBMC transcriptomes from CHD and publicly available control PBMC transcriptomes40,41 (Extended Data Fig. 8a). Cell annotation based on known marker-gene expression revealed 12 clusters of circulating immune cells, including MS4A1+ B cells, CD14+ monocytes and KLRF1+ natural killer (NK) cells (Extended Data Fig. 8a–c and Supplementary Table 10). CHD and control samples contributed equally to PBMC clusters (Extended Data Fig. 8d,e).
Cycling immune cells, progenitor-like immune cells and immature B cells were more highly represented in controls than in CHD40 (Extended Data Fig. 8f). We also observed compositional shifts in PBMCs between different CHD diagnoses (Extended Data Fig. 8g). Compared with controls, HF-HLHS PBMCs had elevated B cells, monocytes and NK cells; Neo-HLHS had increased levels of monocytes; and TOF had decreased monocytes and dendritic cells (Extended Data Fig. 8g). To look more closely at monocytes, we used iterative clustering and identified four cell clusters, including two clusters of CD14+ monocytes, one cluster of nonclassical CD16+ monocytes, and monocyte-derived dendritic cells (Extended Data Fig. 8h,i and Supplementary Table 11). THBS1-expressing cells in the CD14–1 cluster were enriched in CHD PBMCs. Monocytes in the CD14–2 cluster were enriched in control PBMCs and expressed pro-inflammatory factors, including CCL3, CXCl8 and IL1B, which expressed at much lower levels in CHD-enriched CD14–1 monocytes (Extended Data Fig. 8i,j). The same subclustering analysis on circulating NK cells and cytotoxic T cells did not uncover any significant compositional differences between CHD and controls (Extended Data Fig. 8k–m and Supplementary Table 12). Cells in the NK2 cluster expressed the chemokines XCL1 and XCL2, which are known inducers of monocyte-derived dendritic cells and markers of activated NK cells42 (Extended Data Fig. 8k–m).
To further validate the single-cell RNA-sequencing (scRNA-seq) data, we performed ATAC-seq on CD14+ monocytes and NK cells from CHD. PCA revealed the highly cell-type-specific nature of the ATAC-seq data (Extended Data Fig. 9a). The epigenetic status of known markers, such as the myeloid-enriched transcription factor SPI1 (also known as PU.1) was also indicative of cell-type-specific enrichment (Extended Data Fig. 9a). Differential chromatin accessibility analysis uncovered 16,011 CD14+-enriched peaks and 8,867 NK cell-specific regions (adjusted P-value < 10−9) (Extended Data Fig. 9b and Supplementary Table 13). In CD14+ monocytes, genes such as CLEC4E and THBS1, which were highly expressed in the CHD-enriched CD14–1 cluster, were also highly accessible at the epigenetic level (Extended Data Fig. 9c). The ATAC-seq data also showed that the activated NK2 marker genes XCL1 and SPTSSB were both accessible and were cell-type-specific (Extended Data Fig. 9c). These data are consistent with an activated NK cell state in patients with CHD.
Plasma proteome profiling in CHD
To gain insight into the cardiac cell response to circulating cytokines in CHD, we performed proteome profiling of plasma from patients with CHD. Out of the 105 soluble proteins measured in CHD-derived plasma, 69 of the corresponding mRNAs were co-expressed in PBMCs (Extended Data Fig. 9d and Supplementary Table 14). To assess whether plasma factors signalled to cardiac cells, we analysed our cardiac cell snRNA-seq dataset for mRNAs encoding cognate receptors for the CHD plasma factors (Extended Data Fig. 9e). We identified 133 differentially expressed cardiac cell mRNAs encoding receptors for circulating factors (Supplemental Table 15). Filtering of the top tissue-expressed receptor–ligand combinations indicated that both developmental and pro-inflammatory signalling pathways were activated in CHD and signal to specific cardiac cells in CHD (Extended Data Fig. 9e,f and Supplementary Table 16). For example, cells in the CF4 cluster were competent to receive IL-6 cytokine signalling, whereas those in CF2 were receptive to EGF signals. In addition, CHD-enriched CM3 cells were predicted to receive THBS1 signals, which are known to cause cardiomyocyte atrophy in preclinical models43 (Extended Data Fig. 9e,f).
Intercellular signalling in CHD
To gain further insight into local intercellular signalling in CHD, we performed ligand–receptor analysis using CellChat, which predicts signalling inputs and outputs of cells, and focused on macrophages, cardiomyocytes and cardiac fibroblasts44. The number and strength of cell–cell signalling interactions was greater in CHD compared to controls, consistent with a disrupted tissue microenvironment in CHD (Fig. 6a,b). To uncover cell-type-specific changes in intercellular signalling interactions, we compared incoming and outgoing interaction strengths for each cluster between CHD and controls. In CHD, the largest shifts occurred in CM3 and CF2, cell types that were absent in controls. By contrast, there were decreased incoming signalling interactions to macrophages in CHD (Fig. 6b).
Fig. 6 |. Intercellular communication in paediatric cardiovascular disease.
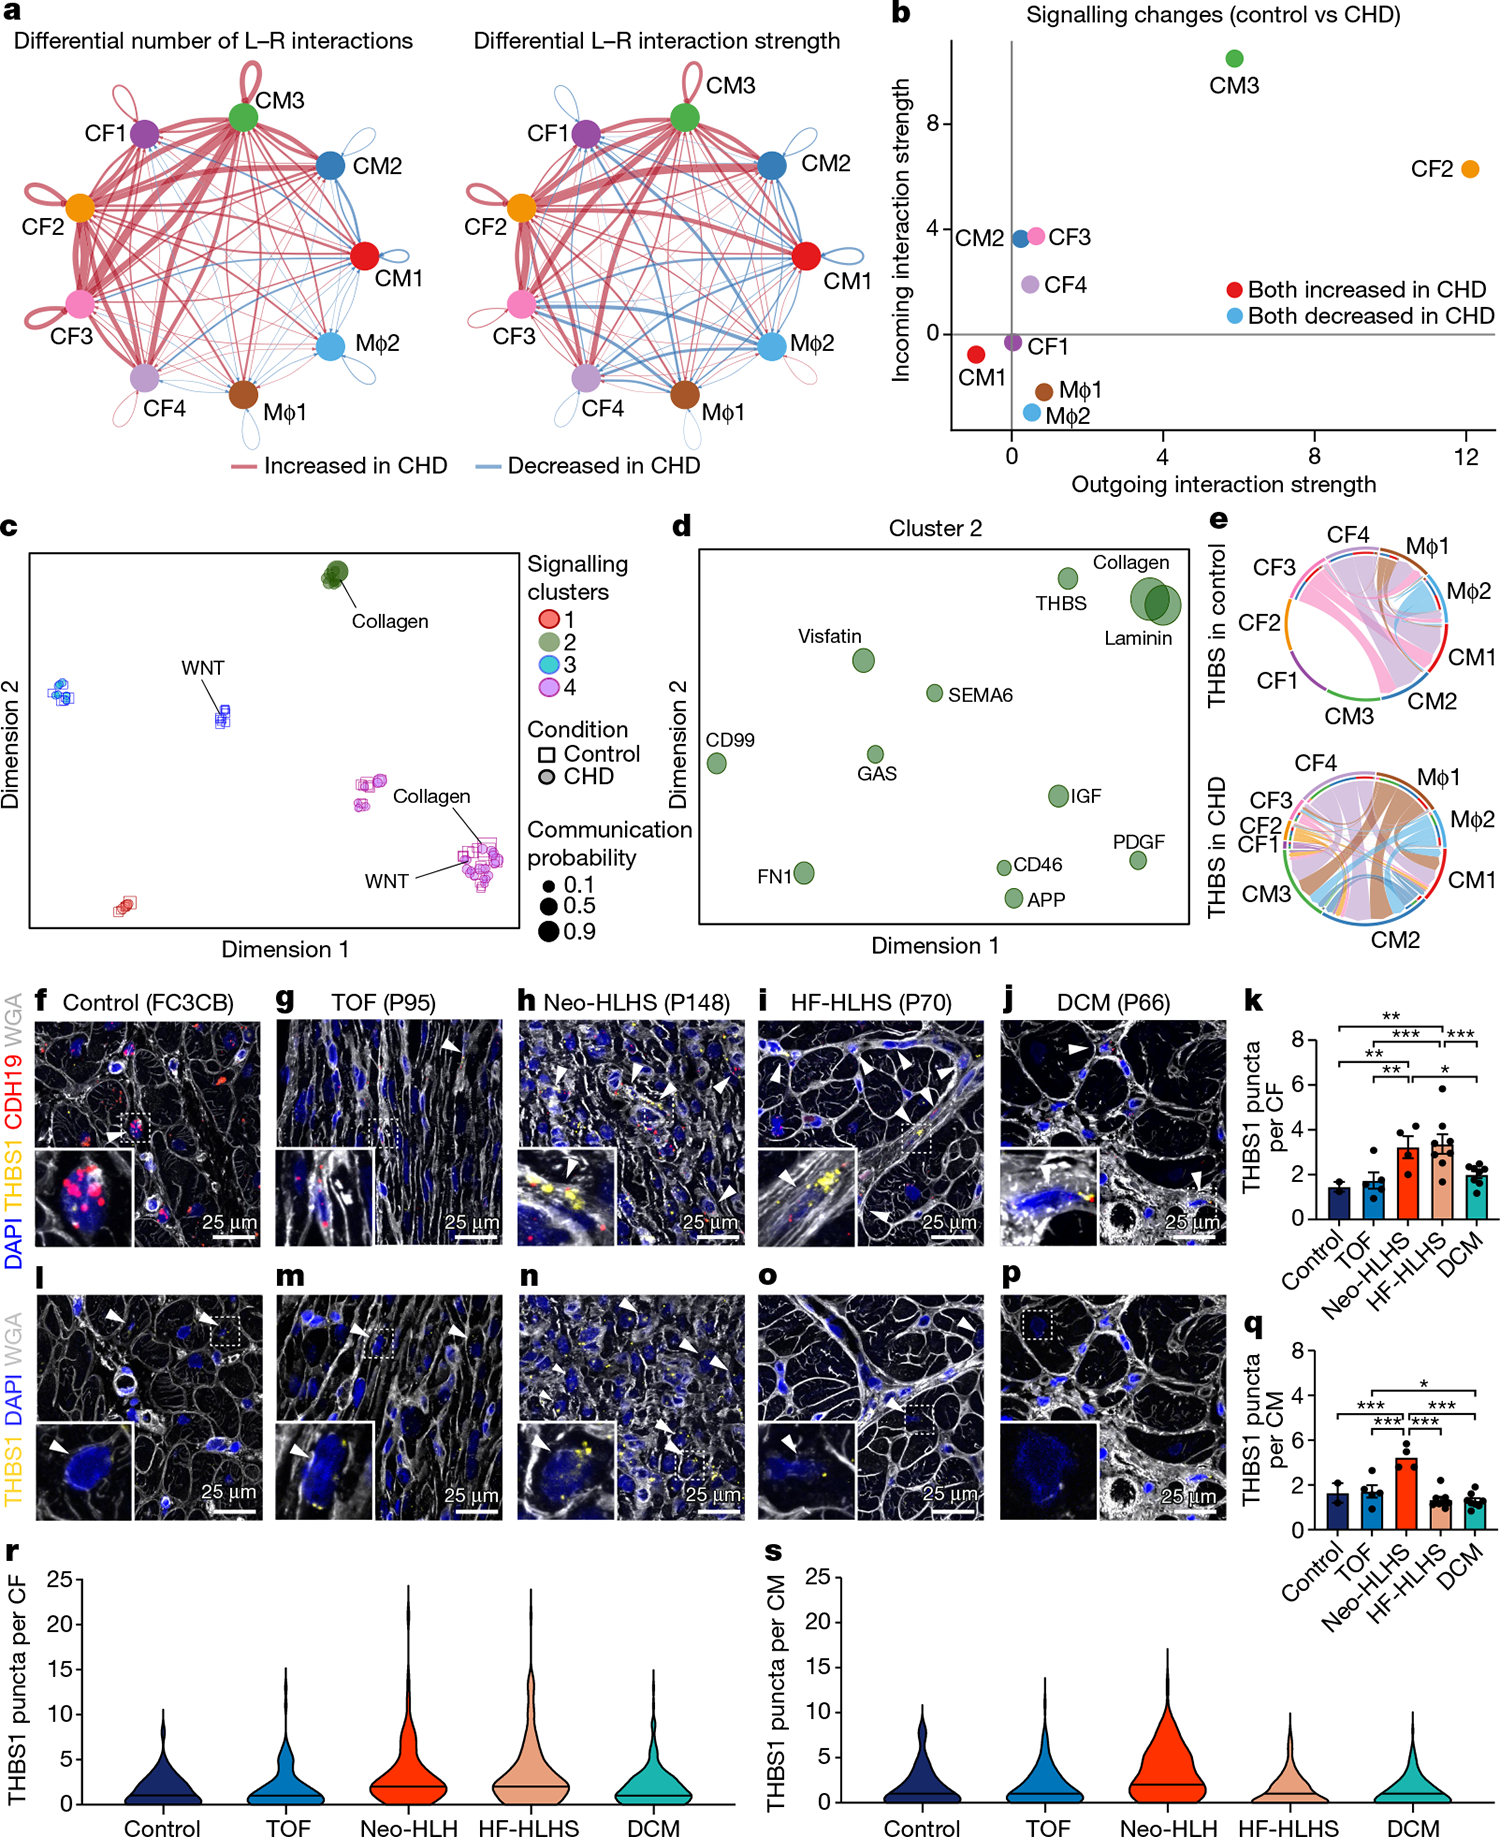
a, Circle plot highlighting the differential number of ligand–receptor (L–R) interactions between control and CHD nuclei. b, Comparison of major targets and source shifts between control and CHD samples. Positive values indicate an increase in signal in CHD. c, Joint projection and clustering of signalling pathways from control and CHD datasets according to topological pathway similarities. Each data point represents an individual signalling pathway. The size of each point is proportional to the communication probability of that network. Representative pathways are highlighted. d, Magnified view of cluster 2 from c. The size of each point is proportional to the communication probability. e, Circle plot showing THBS signalling network activity in control and CHD cardiac tissue. Each link indicates an intercellular connection. The root of each arrow is the ligand-expressing cell type, and the tip of each arrow is the receiving cell. f–j, RNAscope for THBS1 and CDH19 in control (f), TOF (g), Neo-HLHS (h), HF-HLHS (i) and DCM (j) tissue, co-stained with DAPI and WGA to visualize tissue composition. Arrowheads show co-expression of THBS1 and CDH19 in cardiac fibroblasts. k, TBHS1 expression in CDH19+ fibroblasts (n = 640). Each data point represents average expression from one sample (2 control, 5 TOF, 4 Neo-HLHS, 8 HF-HLHS and 8 DCM). l–p, RNAscope for THBS1 in control (l), TOF (m), Neo-HLHS (n), HF-HLHS (o) and DCM (p) tissue. Arrowheads show THBS1 expression in cardiomyocytes. q, Relative TBHS1 expression in cardiomyocytes (n = 611). Each data point represents average expression from one sample (2 control, 5 TOF, 4 Neo-HLHS, 8 HF-HLHS and 8 DCM). r, Violin plot of THBS1 expression in cardiac fibroblasts (n = 640). s, Violin plot of THBS1 expression in cardiomyocytes (n = 611). *P < 0.05, **P < 0.01, ***P < 0.001; mixed-effects model. Data are mean ± s.e.m.
To simplify our analysis, we quantified the similarities among the significant signalling pathways by grouping them on the basis of cellular communication network topology. In this analysis, the topological differences between signalling pathways, which separate them into individual clusters, are defined by how sender and receiver cells utilize intercellular signalling pathways (for example, large numbers of sender cells and small numbers of receivers). Using joint manifold learning and pathway classification, we uncovered four signalling clusters44 (Fig. 6c). We found several pathways that differed between control and CHD groups, including WNT and collagen.
In controls, WNT signalling was restricted to cluster 3, whereas in patients with CHD, WNT signalling was found in cluster 4. This indicates a shift in the topology of the signalling pathway between the two conditions. Similarly, collagen showed structural similarities to other signalling pathways in cluster 4 in controls, but took on characteristics of cluster 2 in CHD. Of all the clusters that we identified, only cluster 2 was unique to CHD hearts. Focusing on cluster 2, we identified pathways that were enriched in CHD, including THBS, PDGF, collagen and FN1 signalling pathways (Fig. 6d). Consistent with our plasma proteome profiling showing upregulation of THBS1 in CHD plasma, we found increased THBS1 signalling connectivity in patients with CHD (Extended Data Fig. 9e,f). Moreover, RNAscope analysis of additional samples (Supplementary Table 1) revealed that THBS1 expression was increased in Neo-HLHS and HF-HLHS cardiac fibroblasts (Fig. 6f–k,r) and that Neo-HLHS cardiomyocytes exhibited increased THBS1 expression, further implicating THBS1 in the cardiomyocyte pathology of CHD (Fig. 6l–q,s).
Discussion
Here we have investigated CHD using snRNA-seq, IMC and peripheral blood profiling of systemic inflammation. Our analysis of single nuclei of cardiac cells, protein expression by IMC, scRNA-seq of PBMCs and plasma profiling expands our understanding of cardiac cell states in CHD, as well as the local and systemic inflammatory responses in CHD. We uncovered distinct cardiac cell signatures in different categories of CHD, providing insight into the pathophysiology of CHD, which will help to better define outcomes and develop new therapies for CHD. However, the limitations associated with performing snRNA-seq on human cardiac samples are well known12. The paediatric control samples show evidence of stress related to organ procurement, which is inherent to all human cardiac profiling studies. Biases from surgical sampling, age, race and ethnicity, medication and environment are also a concern in studies of this type; these will be reduced by improved age matching of control donor tissue and increasing the number of CHD samples to uncover CHD-specific characteristics. The samples analysed in this study are rare and difficult to obtain, and are derived from disparate diagnoses including HCM, DCM and the structural heart diseases (for example, TOF), including some samples with haemodynamic stress (for example, HF-HLHS). More focused analyses, directly comparing tissues within the different classes of diagnoses will help unravel the influence of age and diagnosis on the cellular state of cardiac cells. In particular, direct comparison of failing hearts with different diagnoses, such as HF-HLHS and DCM, will help distinguish between the influence of underlying CHD and cell-state changes due to disrupted haemodynamics. We expect this study to stimulate the discovery of new mechanistic insights into CHD.
Online content
Any methods, additional references, Nature Research reporting summaries, source data, extended data, supplementary information, acknowledgements, peer review information; details of author contributions and competing interests; and statements of data and code availability are available at https://doi.org/10.1038/s41586-022-04989-3.
Methods
Research ethics for donated tissues
Cardiac tissues and blood samples used in this study were collected during cardiothoracic surgeries performed at Texas Children’s Hospital (Houston, Texas). The protocols for the procurement and use of these patient samples were approved by the Institutional Review Board for Baylor College of Medicine and Affiliated Hospitals (Protocol Number H-26502). With the help of the Heart Center Biorepository at Texas Children’s Hospital, consent was obtained from patients with various forms of paediatric heart disease, including HLHS, TOF, DCM and HCM. The anatomic location of tissue collected was based on the specific surgical repair being performed. This information, along with more specific patient information, can be found in Supplementary Table 1.
Control cardiac tissue samples from donors were collected from the University of Kentucky (Samples UK1/FC3CB and UK2/3B62D) and Washington University in St Louis (LV198/RV198/13-198 and RV325/13-235). Samples from the University of Kentucky were processed by the Gill Cardiovascular Biorepository after being obtained from terminal organ donors whose hearts could not be used for transplantation because of technical reasons (blood type mismatch, and so on). The local Organ Procurement Organization, in this case the Kentucky Organ Donor Affiliates (KODA), obtained informed consent from the legally authorized representatives. This consent allowed the hearts to be used for research if they could not be used as part of clinical care. These tissue samples were collected by technical staff in the operating room, immediately placed into cold saline, and then taken back to the lab for dissection into anatomic regions. The samples were then flash-frozen in liquid nitrogen and stored in the vapour phase of liquid nitrogen. Further information can be found in Blair et al.45. Samples from Washington University in St Louis donor families were consented, hearts procured at Med-American Transplant, and entered into the Translational Cardiovascular Biobank and Repository (TCBR) at Washington University School of Medicine (no. 201104172). For paediatric tissues, consent was obtained from the legal authorized representative and tissues entered into the TCBR (no. 201104172).
Sample collection and preservation
Cardiac tissue and blood samples were collected in the operating room during various paediatric cardiovascular surgeries. Cardiac tissue samples were kept in cold saline on ice during transfer to the laboratory for preservation. Blood samples were collected before cardiac bypass was initiated into EDTA-coated vacutainers and were then transferred to the laboratory on ice. Cardiac tissue samples were carefully dissected into multiple aliquots, some of which were flash-frozen and stored at −80 °C and others of which were fixed in 10% neutral buffered formalin for 16 to 24 h at 4 °C. Formalin-fixed samples then underwent serial dehydration and were embedded in paraffin blocks for histology. Formalin-fixed paraffin-embedded (FFPE) samples were then used to make a tissue microarray (2 mm cores) for high-throughput image analysis. After the isolation of PBMCs, cells to be cryopreserved were resuspended in CryoStor CS10 solution (StemCell Technologies, catalogue (cat.) no. 07930) and frozen at a controlled rate by using a Corning CoolCell Freezing Container. Isolated plasma was stored at −80 °C.
Isolation of PBMCs
Fresh blood samples were kept on ice until isolation was started. In a sterile laminar flow hood, equal parts blood and Dulbecco’s phosphate-buffered saline (PBS) were mixed with 2% fetal bovine serum (FBS; StemCell Technologies, cat. no. 07905). Lymphoprep solution (StemCell Technologies, cat. no. 07801) was added to a SepMate-15 (IVD) tube (StemCell Technologies, cat. no. 85415). The blood was carefully layered on top of the Lymoprep solution and spun at 1,200g for 20 min. The plasma layer was pipetted off, aliquotted, and stored at −80 °C. The PBMC layer was poured off and washed in 10 ml of Dulbecco’s PBS with 2% FBS and spun at 1,000g for 4 min to pellet PBMCs for downstream analysis and cryopreservation.
Isolation and ATAC-seq of NK cells and monocytes
CD14+ cells were isolated by using the CD14 MicroBeads (Miltenyi Biotec, 130-050-201) as per the manufacturer’s instructions. In brief, PBMCs were washed twice with Dulbecco’s PBS containing 2% FBS (StemCell Technologies, 07905) before being bound to CD14 MicroBeads and isolated with MS columns (Miltenyi Biotec, 130-042-201). Cells were subjected to two rounds of purification before ATAC-seq. NK cells were isolated from CD14+ cell-depleted PBMC pools by taking the flow through from the CD14+ MACS enrichment. After flowing through the MACS MS columns, NK cells were isolated by using the human NK cell isolation kit (Miltenyi Biotec, 130-092-657) according to the manufacturer’s instructions, allowing for the isolation of both cell types simultaneously from the same patient sample. After the purification of NK cells and CD14+ monocytes from density gradient–purified PBMCs, we performed ATAC-seq by using the Omni-ATAC protocol with roughly 50,000 cells as input46. All samples were sequenced on an Illumina Nextseq 500.
Isolation of nuclei from cardiac tissue
Nuclear isolation was performed as previously described47. Some modifications were made for snRNA-seq. In brief, cardiac nuclei were isolated by using density gradient centrifugation with Optiprep Density Gradient Medium (Sigma). All nuclei were isolated from the 30% to 40% interface and then diluted into nuclei wash buffer (PBS containing 1.0 % bovine serum albumin (BSA)) (Sigma) with 0.2 U μl−1 RNase inhibitor (Enzymatics/Qiagen, Y9240L) before being spun down at 1,000g for 5 min. Next, the supernatant was removed, and the nuclei were washed twice with 25 ml of nuclei wash buffer. Nuclei were then resuspended in an appropriate volume of nuclei wash buffer to achieve a concentration appropriate for use with 10X Genomics Single Cell 3′ Reagents.
scRNA-seq and snRNA-seq
All scRNA-seq and snRNA-seq were performed by using the 10X Genomics platform. Cells or nuclei were isolated as described earlier and were loaded into the 10X Genomics Chromium Controller to obtain the gel beads in emulsion. The sequencing libraries were then prepared according to the 10X genomics protocol for Single Cell 3′ Reagents Kit v3. Sequencing was performed by using the NextSeq 500 and NovaSeq 6000 systems by using recommended sequencing parameters.
Cardiomyocyte-specific ATAC-seq
Nuclear isolation, library preparation and quality control were performed as described47 for pericentriolar material 1 (PCM1) isolation and ATAC-seq.
Histology
Tissue sections were deparaffinized at 60 °C for 1 h, then dewaxed and rehydrated in a graded series of alcohol. For H&E staining, tissue sections were incubated with haematoxylin for 15 min, followed by incubation with acidified EosinY for 3 min at room temperature. The samples were re-paraffinized, dried, and mounted before imaging. Masson’s Trichrome staining was performed according to manufacturer’s instruction (Sigma, HT15). Images were acquired using the Cytation 5 Cell Imaging Multi-Mode Reader (Biotek). Contrast of both H&E and Masson’s Trichrome images were enhanced using the auto-contrast function in Adobe Photoshop, with the same contrast settings applied to each image for consistency.
Tissue immunohistochemistry
Immunohistochemistry was performed on paraffin-embedded sections as previously described48. In brief, samples were deparaffinized, treated with 3% H2O2 in 95% ethanol, boiled in antigen unmasking solution that was citric acid based (Vector Labs), then permeabilized with 0.5% Tween 20 in PBS, and blocked with 10% donkey serum in PBST (PBS + 0.1% Tween 20). For staining vimentin, YAP and PTX3, sections were incubated with rabbit anti-YAP and rat anti-PTX3 antibodies overnight at 4° C. After washing with PBST, sections were then incubated with biotinylated anti-rabbit IgG and Alexa Fluor 546 conjugated anti-rat IgG antibodies for 2 h at room temperature. After washing with PBST, tissues were incubated with Streptavidine Alexa Fluor 647 in PBS for 10 min. Sections were incubated with rabbit anti-vimentin, Alexa Fluor 488 conjugated at 4° C overnight. After washing, sections were stained with DAPI. For staining YAP or MYC, sections were incubated with primary antibodies overnight at 4° C. After washing with PBST, tissues were incubated with biotinylated anti-rabbit IgG for 2 h, washed, then stained with DAPI, WGA–rhodamine, and streptavidin–Alexa Fluor 488 in PBS for 10 min. Immunostained slides were mounted with Dako Fluorescence mounting media (Agilent) after washing with PBS. Mounted sections were documented by using a Leica TCS SP5 confocal microscope with Leica LAS AF software. Intensity of PTX3 was measured using ImageJ software. All antibodies used in this study can be found in Supplementary Table 18.
Single-molecule fluorescence in situ hybridization using RNAscope probes
FFPE cardiac tissue samples were cut to a 3 μm thickness. The slides were stained by using the RNAscope Multiplex Fluorescent V2 assay for Human FFPE samples (ACDBio) according to the manufacturer’s protocol. Nuclei were stained with DAPI, and cell membranes were stained with WGA–AF488 (ThermoFisher, cat. no. W11261). The following probes were used for analysis: Probe-Hs-THBS1 (cat. no. 426581), Probe-Hs-PTX3 (cat. no. 517611) and Probe-Hs-CDH19-C2 (cat. no. 571271-C2). Transcripts were visualized by using the Opal 7-Color Dyes from Akoya Biosciences, specifically Opal 520 (cat. no. FP1487001KT), Opal 570 (cat. no. FP1488001KT), and Opal 690 (cat. no. FP1497001KT) dyes. Slides were imaged by using a Zeiss LSM780 confocal microscope. Visualization and image processing (scale bar, pseudocolour) was performed with FIJI/ImageJ software. All RNAscope probes used in this study can be found in Supplementary Table 18.
Imaging mass cytometry
The tissue microarray of FFPE cardiac samples was used for IMC analysis. Tissue sections were warmed at 60 °C for 1 h and dewaxed in three separate xylene washes for 10 min each. The tissue sections were then rehydrated in a graded series of alcohol (ethanol:deionized water 100:0, 100:0, 96:4, 90:10, 80:20, 70:30) for 5 min each and then in TBS for 10 min. Epitope retrieval was performed in Tris EDTA retrieval buffer (pH 9; GeneMed) at 95 °C for 20 min, after which the slides were immediately cooled in TBS for 20 min. Samples were blocked in 3% BSA and 10% donkey serum in TBST for 2 h at room temperature. Incubation with the antibody panel was performed in blocking buffer overnight at 4 °C. Tissue samples were washed twice with TBST and twice with TBS. Slides were incubated with intercalator-Ir solution for 5 min at room temperature and washed twice with TBS. The samples were dipped in water and dried before IMC measurements. The antibody panel targets functional markers for DNA damage, immune regulation, cell cycle, and phenotypic markers to identify epithelial, endothelial, mesenchymal, and immune cell types. The panel of antibodies can be found in the methods. The Hyperion Imaging System (Fluidigm) was used for IMC image acquisition. The largest square area was selected from the centre of each tissue microarray (TMA) core for laser ablation. Commercial acquisition software (Fluidigm) was used to pre-process raw data and monitor acquisition quality. In certain instances, acquisition was interrupted and continued, resulting in multiple images from the same sample core. All conjugated antibodies used in this study can be found in Supplementary Table 18.
Plasma cytokine array
Cytokine protein expression from patient-derived plasma was analysed with the Proteome Profiler Human XL Cytokine Array Kit (R&D Biosystems, ARY022B) according to the manufacturer’s instructions for plasma. Human cord blood plasma (StemCell Technologies, 70020.1) was used as a control.
Data analysis methods
IMC data analysis.
MCD Viewer and Visiopharm software (Fluidigm) were used to convert data to TIFF format and for segmentation of single cells. Individual cells and vessel landmarks were segmented with the use of the Visiopharm software. For normalization, clustering, visualization and dimensionality reduction we used the R package CATALYST (version 1.12.2)49.
snRNA-seq analysis.
Raw sequencing data were handled by using the 10X Genomics Cell Ranger software (version 3.0.1; www.10xgenomics.com). Fastq files were mapped to the hg19 genome, and gene counts were quantified by using Cellranger count function. For counting, we provided a pre-mRNA version of hg19 transcripts (exons and introns included). To remove unwanted background, the Cellranger output was input into CellBender (version 0.1.0)50. Subsequently, bent h5 expression matrices from each experiment were then imported into Seurat (version 3.1.4) and merged into a single object. The data were then normalized, variable features were selected (n = 2,000), data were scaled, and principal components were calculated (n = 20). Nuclei were selected with a minimum of 700 genes per nuclei, with a maximum of 10,000 genes. For mitochondrial reads, we imposed a 0.2% cut-off. For batch correction, we then input these data into Harmony (version 1.0)51. For Harmony batch correction, the batch indices were used as variables, and we included all 20 principal components. Dimensionality reduction (UMAP) and clustering were then carried out in Seurat (dimensions = 20, cluster resolution = 1.5). We next performed differential expression analysis (FindAllMarkers function, Seurat) to aid in the identification of doublets. Clusters consisting of obvious doublets were removed as described previously52. In brief, clusters displaying expression profiles of more than one major cell type are removed from the dataset. To accomplish this doublet filtering, we first look at the markers associated with each individual cell cluster determined via FindAllMarkers. Next, we evaluate individual clusters for the expression of markers derived from the major cardiac cell types, including cardiomyocytes, fibroblasts, endothelial cells, and macrophages whose markers are well known in the literature and have been previously identified through similar snRNA-seq methods (for example, TTN is a cardiomyocyte marker). Following this evaluation clusters that express markers from more than one major cell type are flagged. If a cluster appreciably expresses markers for two or more cell types it is manually removed (subset from Seurat object). For example, if a cluster expresses high levels of RYR2 (cardiomyocyte markers) and CD163 (a macrophage marker) it is considered a doublet and removed. Interestingly, many clusters of doublets will connect the two main cell types at this initial stage of filtering. Removing all doublets from large snRNA-seq datasets requires multiple rounds of filtering as the resolution of clustering for massive numbers of nuclei is not fine enough. To further remove doublets not appropriately clustered in the large global dataset, we next subset the data by major cell type and then performed subclustering and differential expression analysis. Again, clusters consisting of cells expressing more than one major cell-type marker are removed from the dataset, as described above. To generate the final global data object (Fig. 1b), we merged all the cell-type-specific objects back together. Metrics for each dataset can be found in Supplementary Table 17. Differential expression of the individual clusters was achieved by using the Seurat implementation of the Wilcoxon rank-sum test (FindMarkers, min.pct = 0.05, thresh.use = 0.15). We subset the top 500 genes, if that many reached the above criteria, per cluster ranked by their average log fold change for incorporation into the final list of DEGs. For analysing a cell subtype of interest, we performed subclustering with Louvain resolution = 0.1 (Seurat FindClusters(resolution = 0.1)). GO analysis was performed by using the clusterProfiler package (version 3.16.1)53. Enriched KEGG and GO terms were calculated with the compareCluster function, with a P-value cut-off of 0.05. And enrichment networks were determined with the enrichment map function (emapplot). Pseduobulk RNA-seq analysis was performed by subsetting the raw counts for each sample and then performing differential expression analysis with DEseq2 (version 1.28.1)54. Principal components for pseudo-bulk RNA-seq analysis were explored and plotted by using pcaExplorer (version 2.14.2)55. Ligand–receptor connectome information for the analysis of PBMCs was extracted from the FANTOM5 network database56. All complex Venn diagrams generated with an online tool (http://bioinformatics.psb.ugent.be/webtools/Venn/). Differential abundance testing was performed with MiloR (version 0.99.19). For k-nearest neighbour graph construction, we used our reduced dimensions output from Harmony. For differential abundance testing we corrected for gender and tested for Disease versus control (testNhoods). To perform ligand–receptor analysis on tissue snRNA-seq data we used the CellChat package (version 1.1.2)44. In brief, all non-CHD-derived cells for the relevant cell types were merged into a single dataset and those from patients with CHD were similarly merged. Given that we saw the biggest changes in cell state from macrophages, cardiomyocytes and cardiac fibroblasts, we only included these cell types in our comparative analysis. We filtered out clusters that had less than 300 nuclei within either condition, and performed the analysis using default parameters.
For our transcriptional age scoring procedure we used gene-expression modules. A gene-expression module score is determined by calculating the average expression of each gene within a list subtracted by the average expression of randomly selected control genes57. For the ‘Young’ and ‘Adult’ scores/modules we used the samples reported by Sim et. al.10 to identify genes that were differentially expressed from PCM1+ cardiomyocytes (FDR < 0.05, N = 263). We then used each list of genes to construct an expression module score, which we referred to as ‘Adult’ or ‘Young’ gene-expression module, using the Seurat function AddModuleScore with Adult-specific or Young-specific gene lists as features (version 3.1.4). The CM2 score was generated with the following list of genes: ACTA1, ANKRD1, NPPB, THBS1, FLNC, BTG2, ACTN1 and C1QTNF1.
ATAC-seq analysis.
ATAC-seq analysis was performed as described58. In brief, reads were mapped to the human genome (hg19) by using Bowtie2 with default paired-end settings (version 7.3.0)59. Next, all non-nuclear reads and improperly paired reads were discarded. Duplicated reads were next removed with picard MarkDuplicates. Peak calling was carried out with MACS2 (version 2.1.1.20160309) (callpeak --nomodel –broad)60. Blacklisted regions were removed along with peaks of low sequencing quality (require > q30). Reads were counted for each condition from the comprehensive peak file by using bed-tools (version v2.26.0) (multicov module)61. Quantile normalization of ATAC-seq datasets was performed with CQN (version 1.34.0)62, and these offsets were fed into DESeq2 to quantify differential accessibility. Motif enrichment analysis was conducted with Homer (v4.10.3) (findMotifsGenome.pl)63. Genome tracks were generated with Homer (makeUCSCfile) and converted to bigwig format.
Statistical analysis.
For the generalized linear mixed-effects model and statistical analysis performed in this study we used the Linear Mixed-Effects Models using Eigen and S4 (lme4) package in R (version 1.1–27.9000). Statistics were calculated with the glmer function. For all RNAscope data (THBS1, CORIN, CRIM1 and PTX3) this function was run with the family set to ‘poisson’. Anf for quantification of nuclear YAP and MYC quantification family was set to ‘binomial’.
Extended Data
Extended Data Fig. 1 |. Cardiac tissue snRNA-seq profiling.
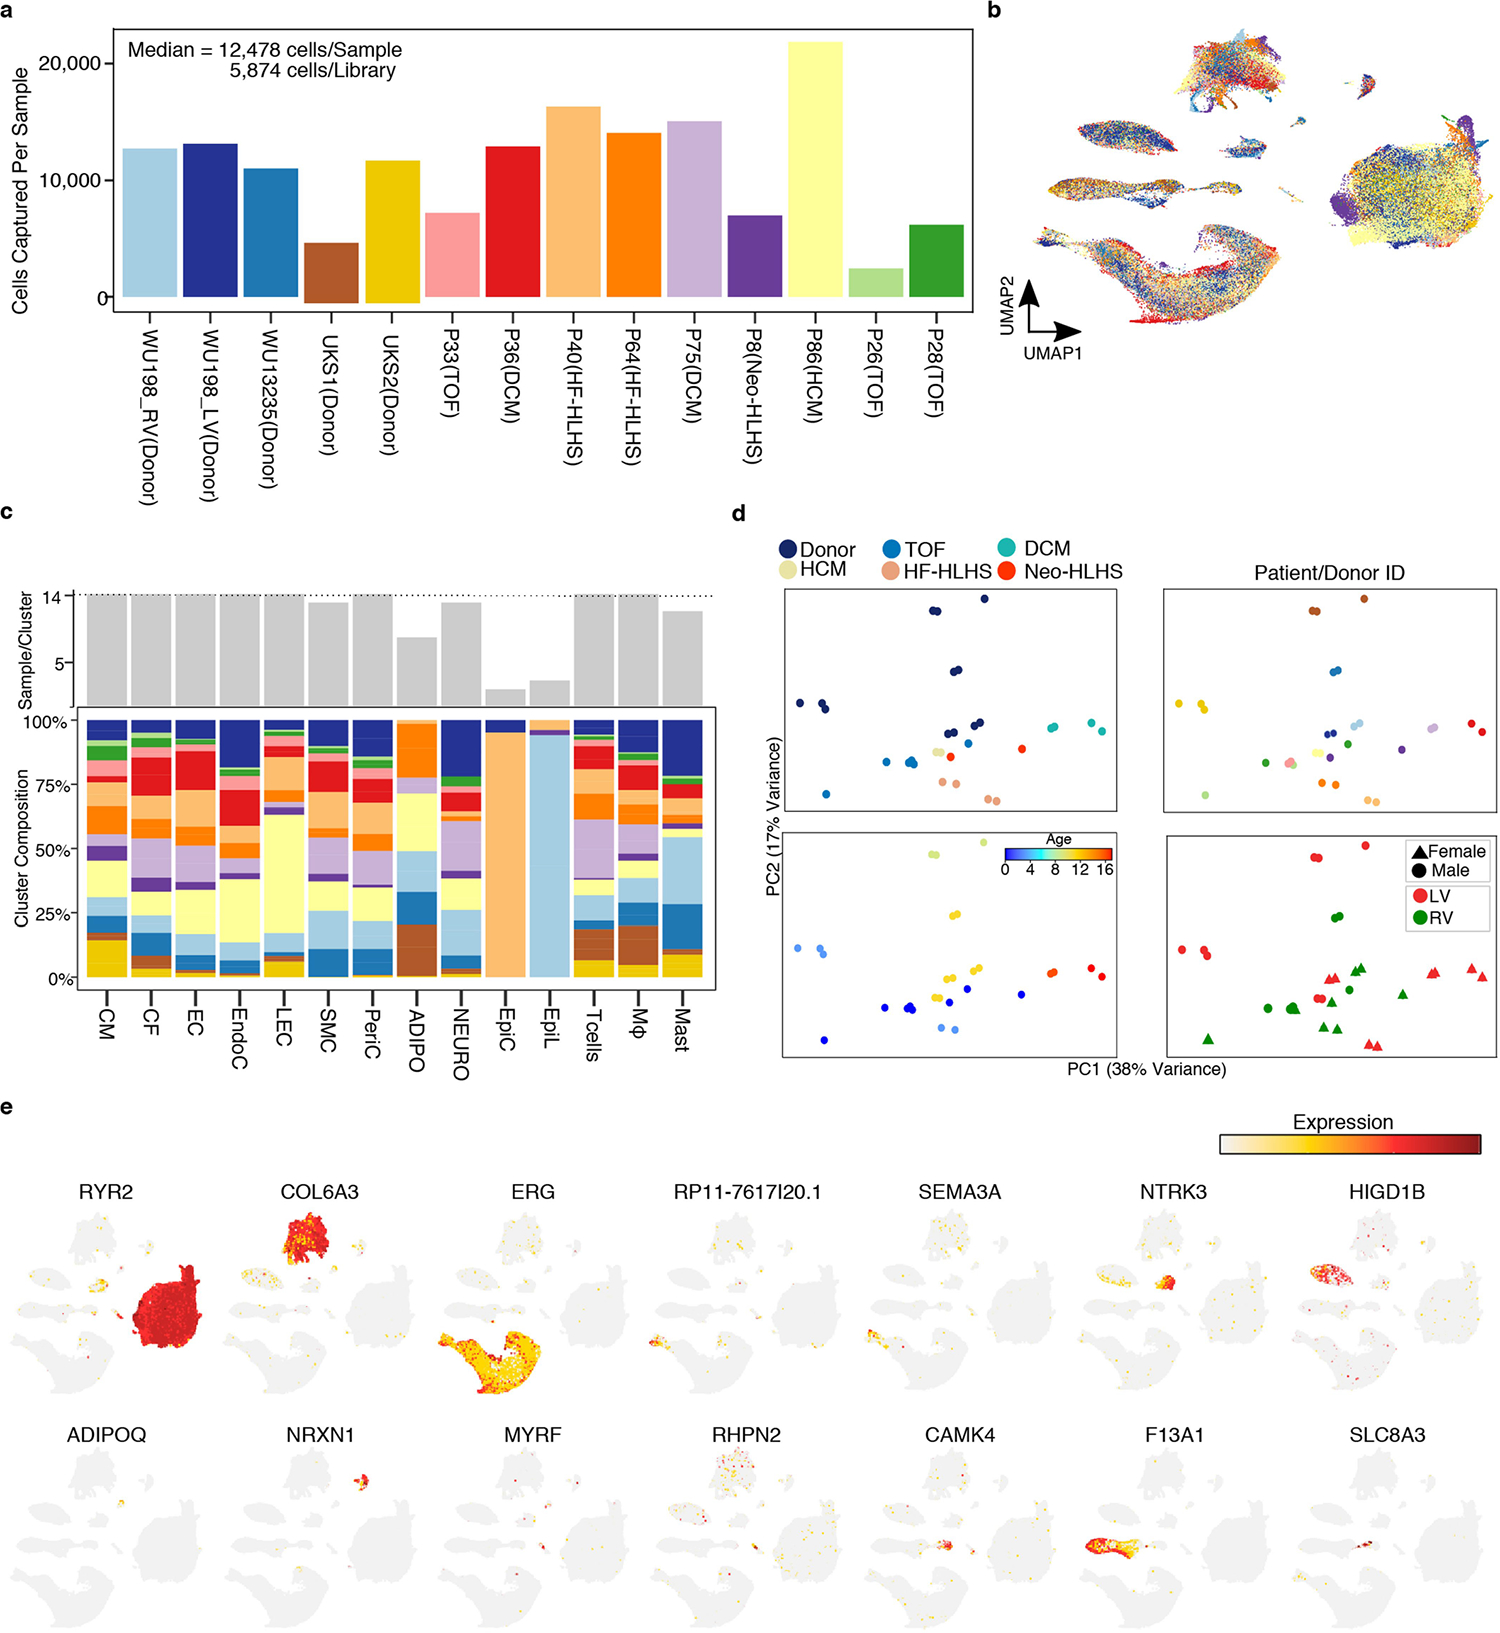
a, The number of nuclei detected per sample. Calculations for cell (nuclei) per library performed be dividing total number of nuclei by the number of technical replicates (libraries). b, UMAP showing sample identity. Colored according to Extended Data Fig. 1a. c, Cluster composition across cell types. (Top) Number of samples detected per cluster. (Bottom) Stacked bar graph indicating the percentage of each samples contribution to the indicated cluster. Colored according to Extended Data Fig. 1a. d, Pseduobulk RNA-seq from all cell types collapsed. All technical and biological and technical replicates (libraries) are shown. e, Feature plot showing expression of marker genes across global UMAP from Fig. 1b.
Extended Data Fig. 2 |. Characterization of pediatric cardiomyocytes.
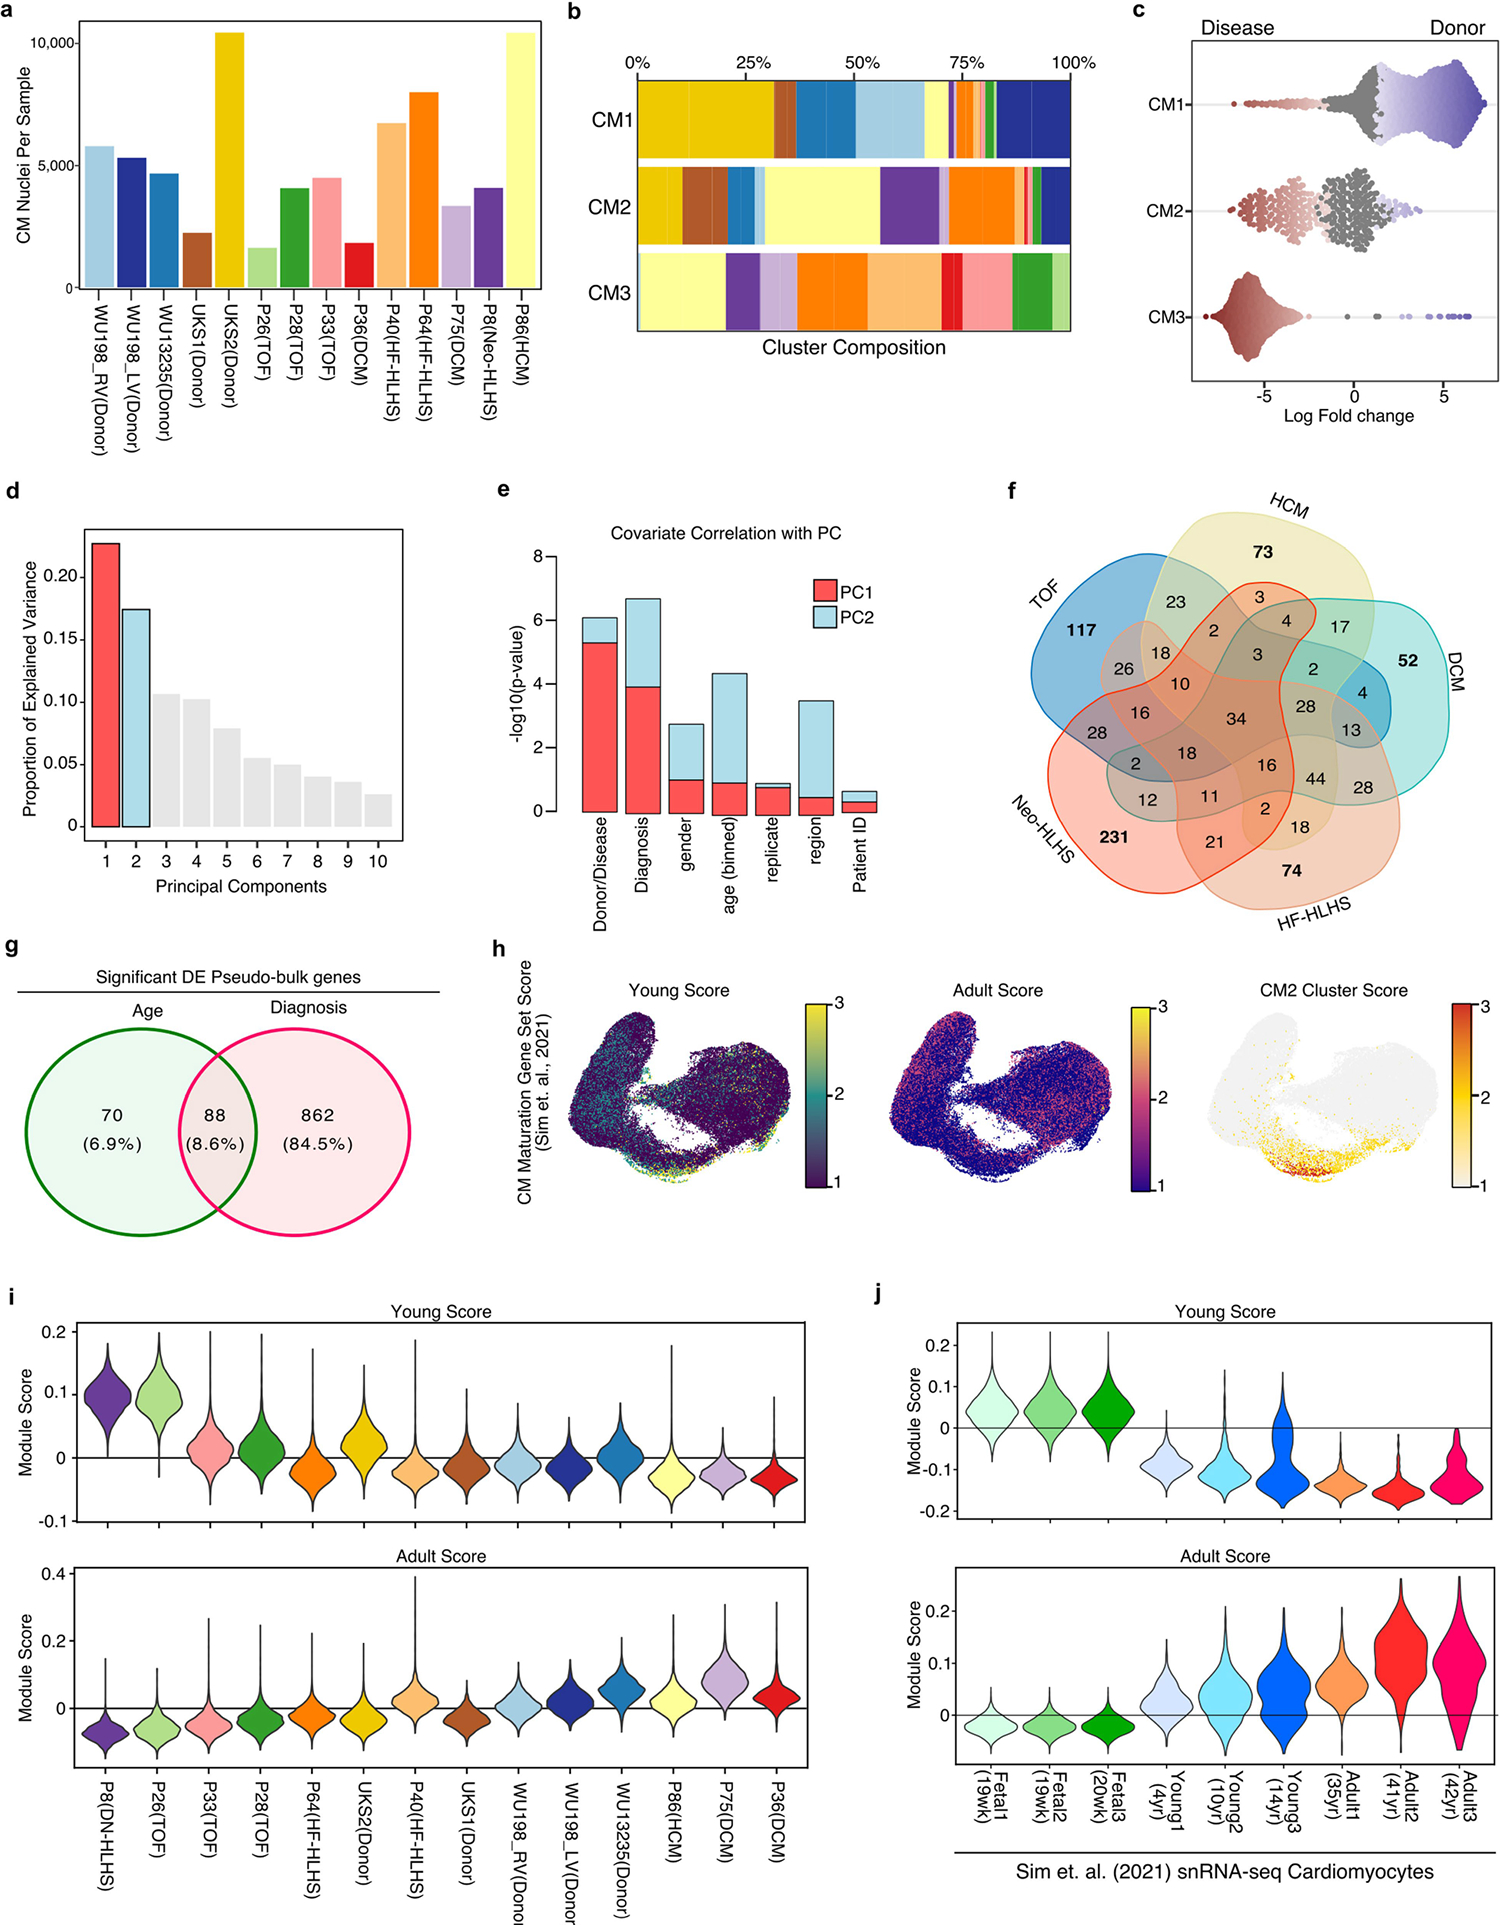
a, Bar plot indicating the number of cardiomyocyte nuclei detected from each pediatric human sample. b, Stacked bar plot showing the composition of each patient sample across the indicated CM clusters. c, Beeswarm plot showing the log-fold distribution of changes across disease and donors in neighborhoods from different cardiomyocyte clusters. Differentially abundant neighborhoods are shown in color. d, A scree plot displaying the proportion of explained variance for all principal components derived from the pseudo-bulk RNA-seq analysis of CMs. e, Bar plot showing the significance of relation with PC1 (red) and PC2 (blue). f, Venn diagram for the intersection of all individual Diagnoses from pseudobulk RNA-seq analysis. g, Venn diagram for the intersection of all age-related and diagnosis-related genes from pseudo-bulk analysis of CM nuclei. h, Gene signature scores projected across UMAP embedding of CM nuclei. i, Violin plot of CM maturation gene module scores for all CMs separated by patient. The patients are ordered by age, from youngest (left) to oldest (right). j, Violin plot of CM maturation gene module scores for all CMs derived from Sim et. al.
Extended Data Fig. 3 |. Cardiomyocyte transcriptomic Maturation.
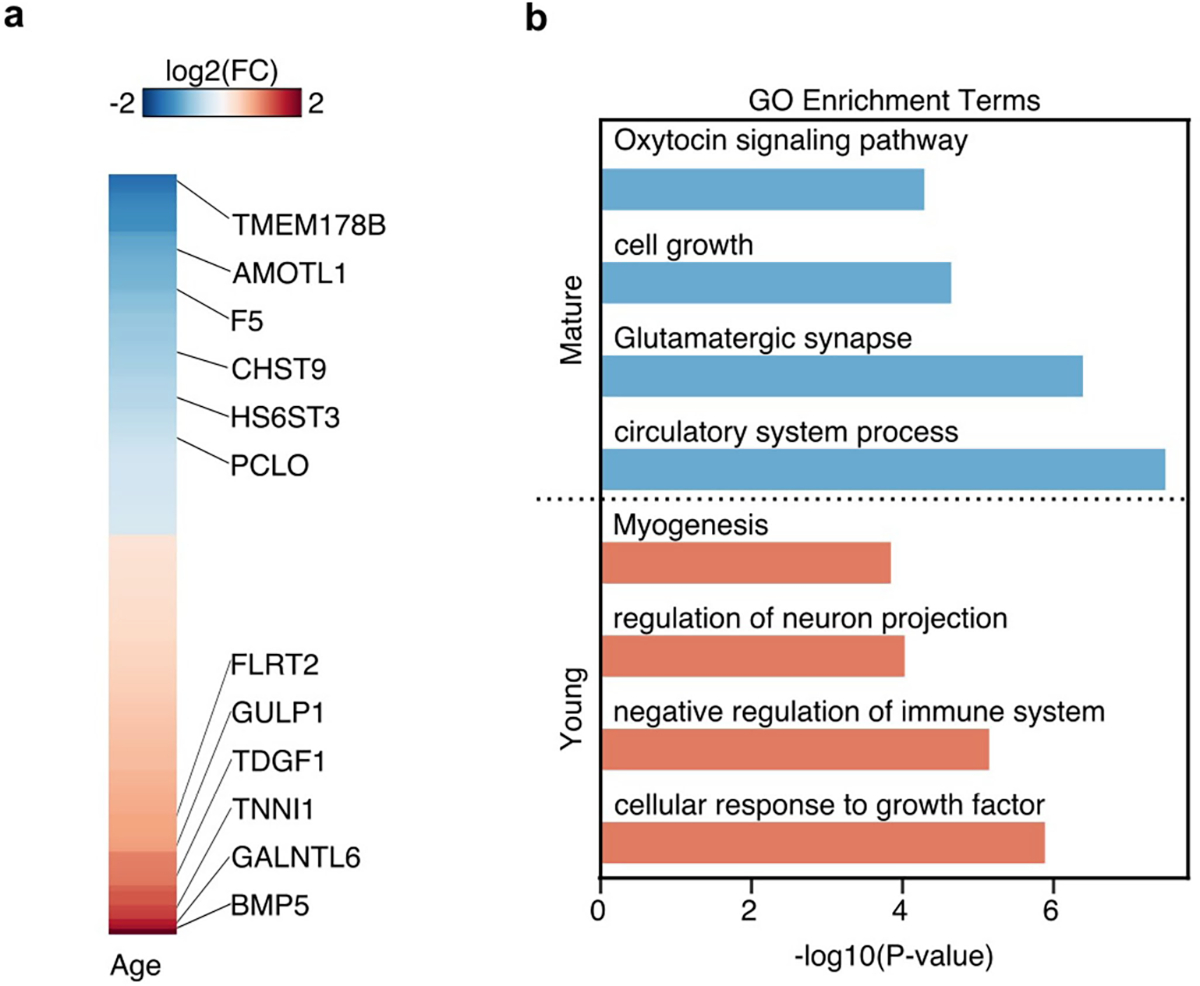
a, Heatmap of log2 foldchange values from pseudo-bulk RNA-seq analysis of CMs. Adjusted p-value < 0.01. b, Gene ontology (GO) analysis of mature and young gene signatures identified in Extended Data Fig.2j.
Extended Data Fig. 4 |. Epigenomic characterization of cardiomyocytes in CHD.
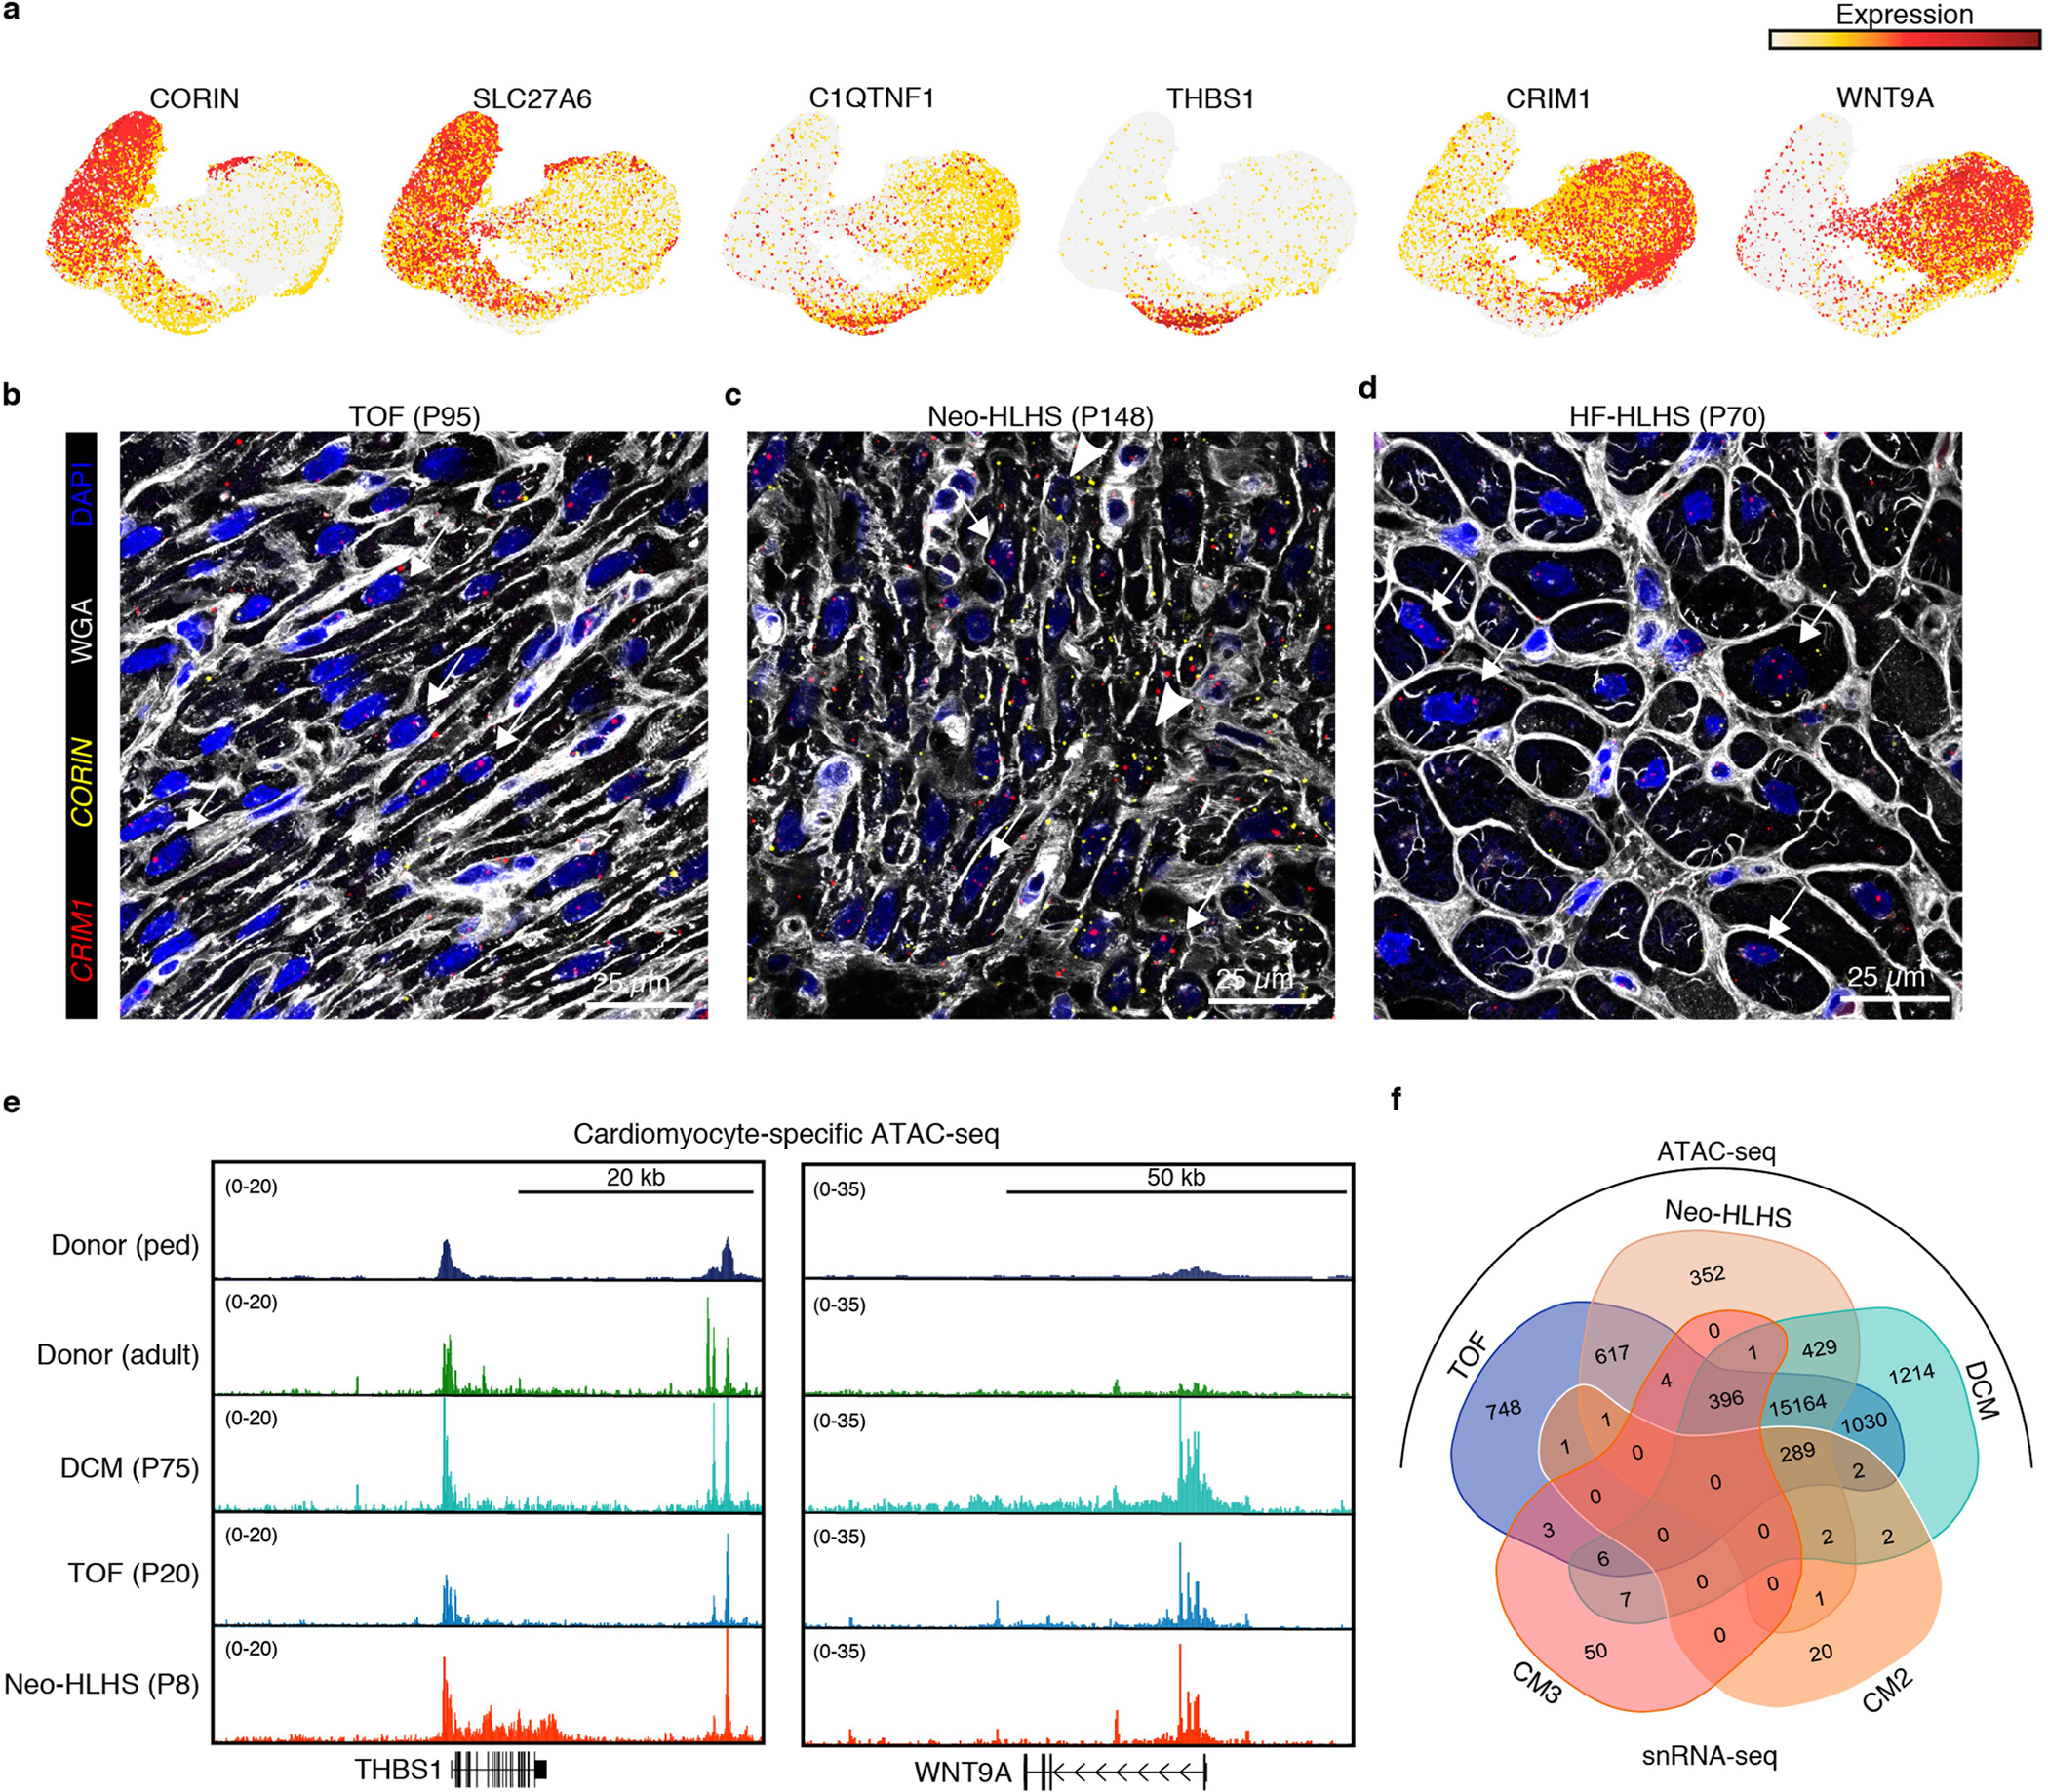
a, Feature plots showing gene expression in cardiomyocytes. b–d, RNAscope for CRIM1 and CORIN. e, Genome browser tracks displaying cardiomyocyte-specific ATAC-seq data. f, Venn diagram showing the overlap of genes annotated from ATAC-seq peaks and snRNA-seq clusters.
Extended Data Fig. 5 |. Transcriptional profiling of pediatric cardiac fibroblasts and endothelial cells.
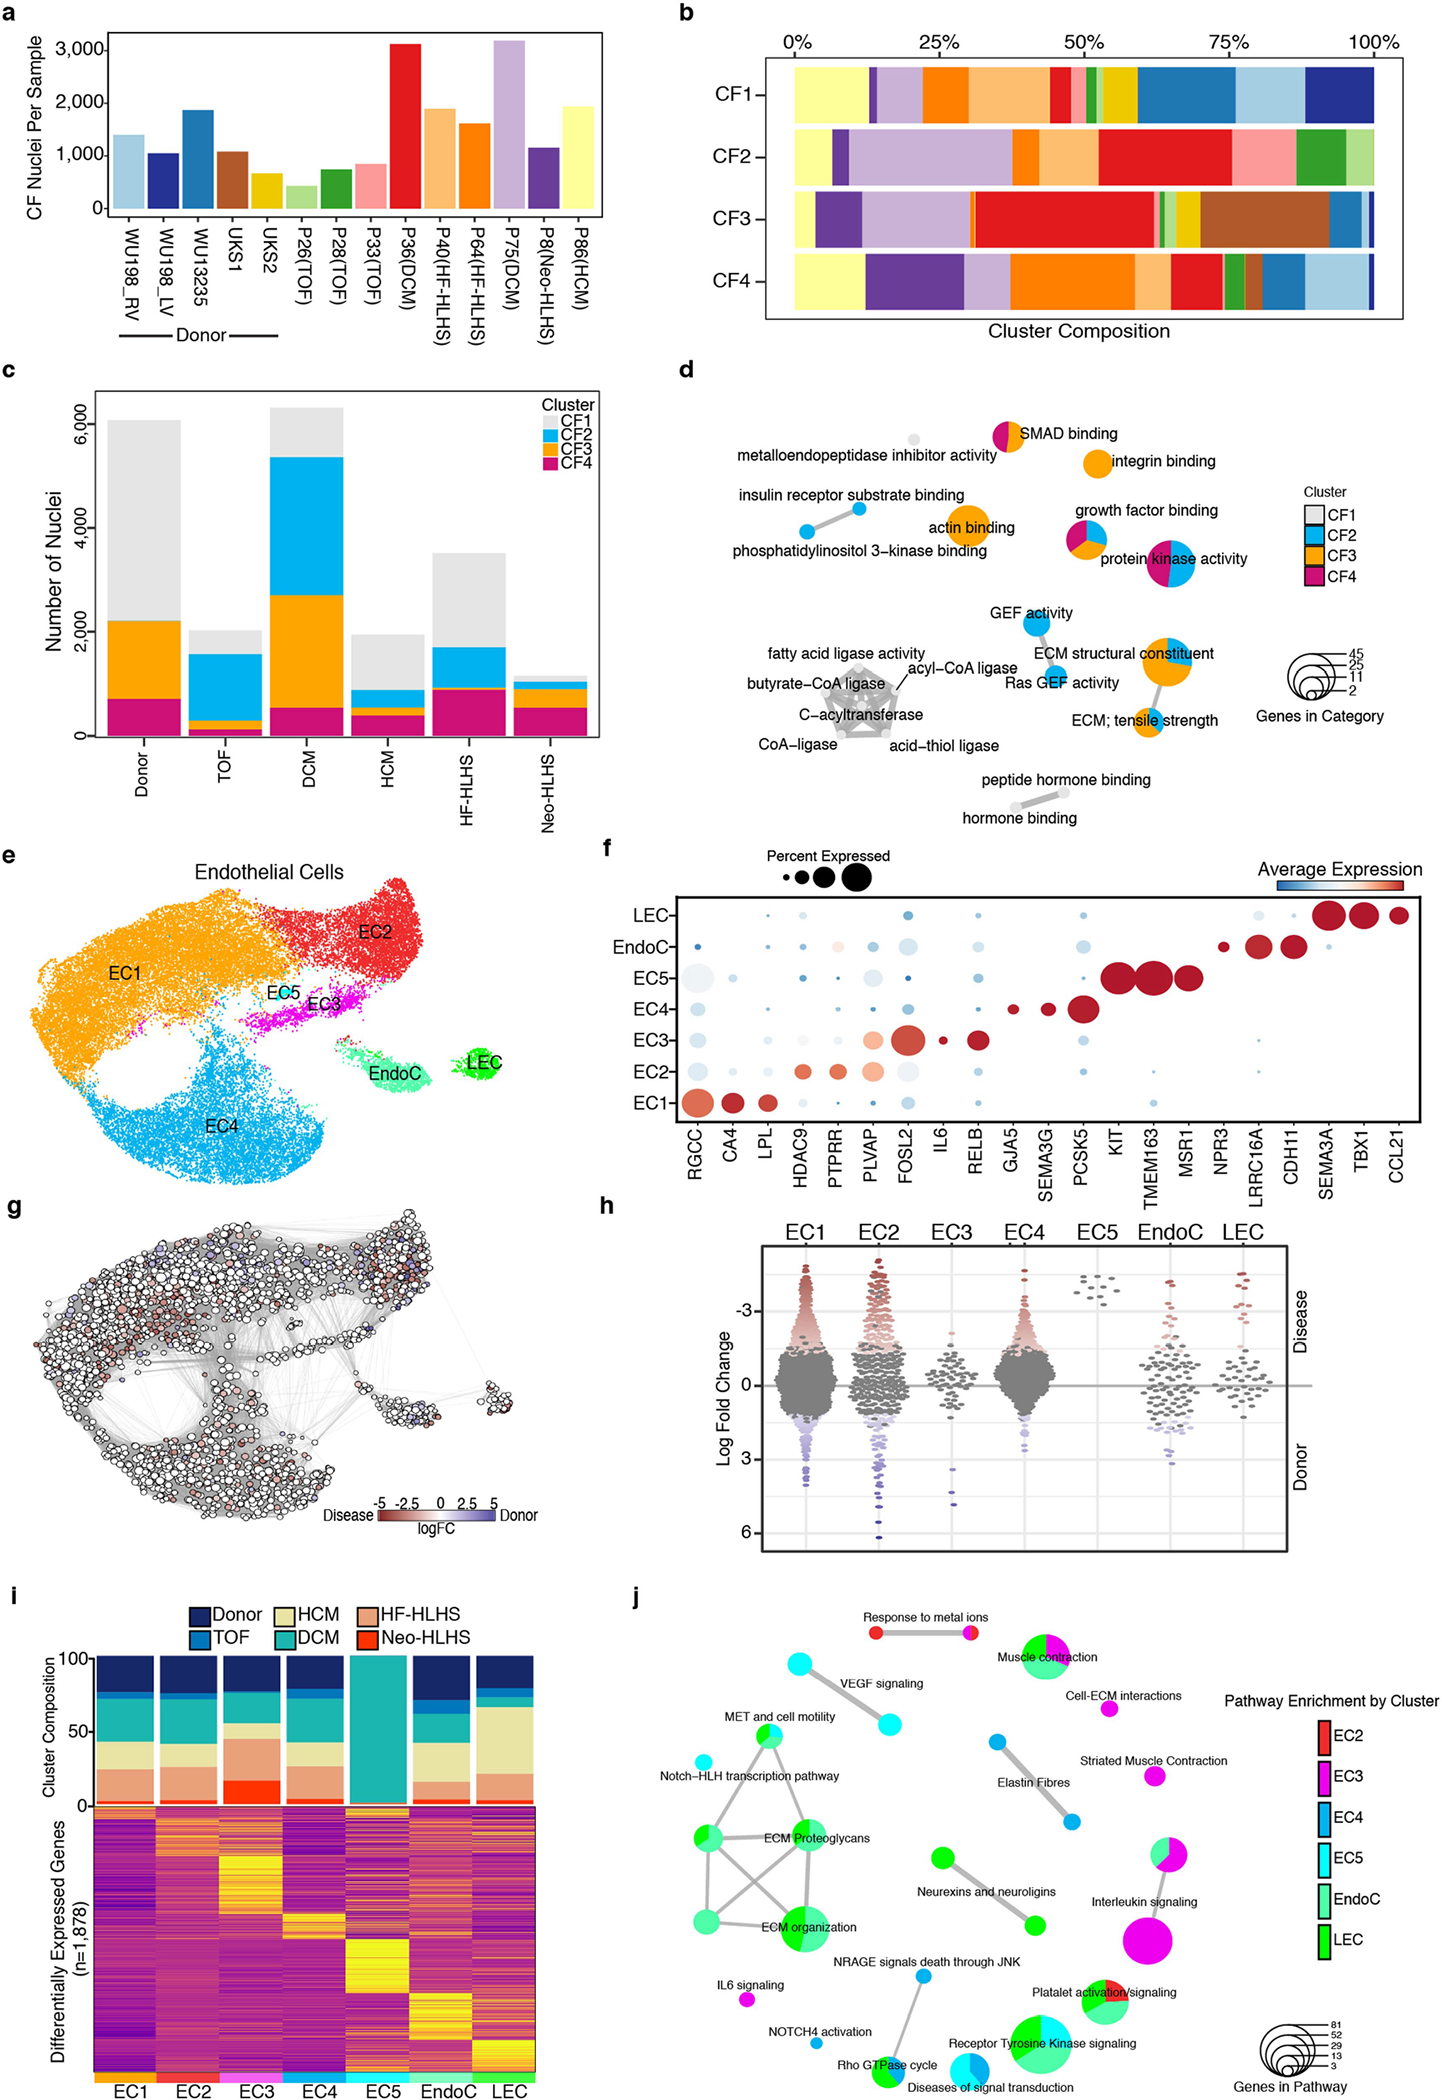
a, Bar plot indicating the number of fibroblast nuclei detected from each sample. b, Stacked bar plot showing the composition of each sample across the indicated CF clusters. c, Stacked bar graph displaying the total number of detected CF nuclei from each patient group. The composition of each CF cluster is highlighted. d, Enrichment map for gene pathway overrepresentation analysis colored by CF cluster. e, UMAP manifold of cardiac ECs colored by cluster. (f) Dot plot of snRNA-seq expression for EC marker genes. g, Embedding of the Milo K-NN differential abundance testing results for ECs. All nodes represent neighborhoods, colored by their log fold changes for disease versus donor. Neighborhoods with insignificant log fold changes (FDR 10%) are white. Layout of nodes determined by UMAP embedding, shown in Extended Data Fig. 5e. h, Beeswarm plot showing the log-fold distribution of changes across disease and donors in neighborhoods from different EC clusters. Differentially abundant neighborhoods are shown in color. i, Top, cluster composition bar plot colored by patient diagnosis. Bottom, heatmap displaying average expression for all differentially expressed genes for EC clusters. j, Enrichment map for gene pathway over-representation analysis colored by EC cluster.
Extended Data Fig. 6 |. Additional tissue histology.
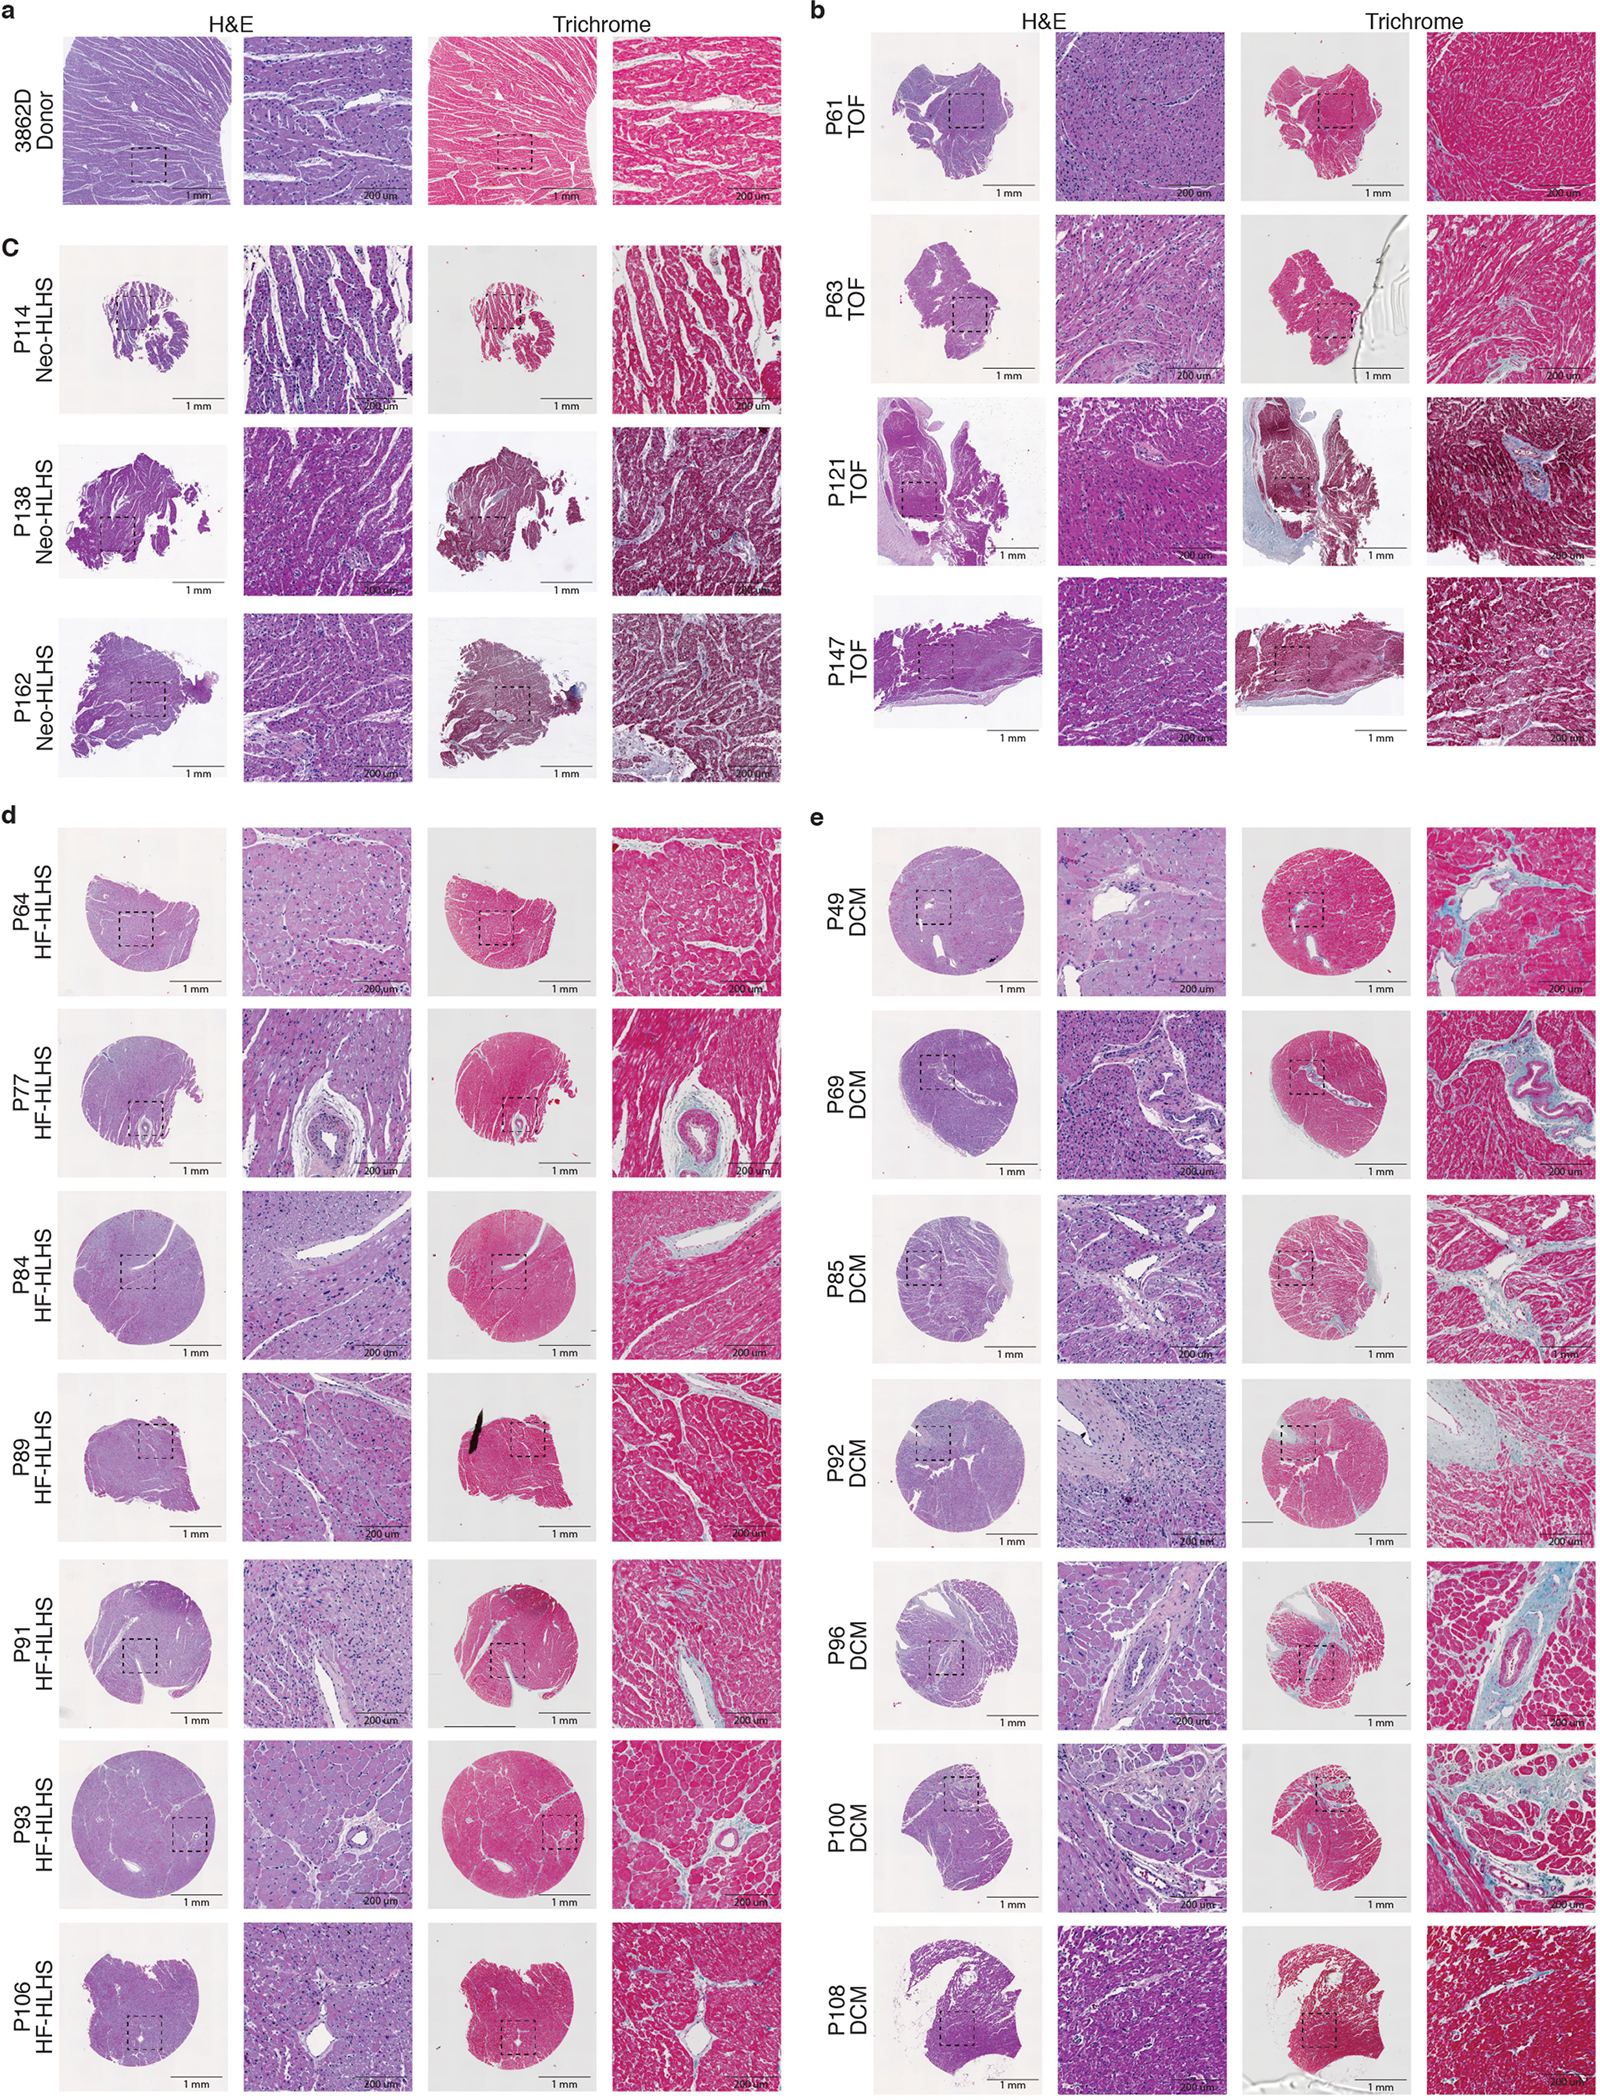
a–e, H&E and trichrome staining of additional myocardial samples from donor (a), TOF (b), Neo-HLHS (c), HF-HLHS (d), and DCM (e) patients. Left image is a 2-mm core, and the dashed box outlines the highlighted perivascular region at high magnification in the right image.
Extended Data Fig. 7 |. Transcriptional profiling of pediatric cardiac immune cell populations.
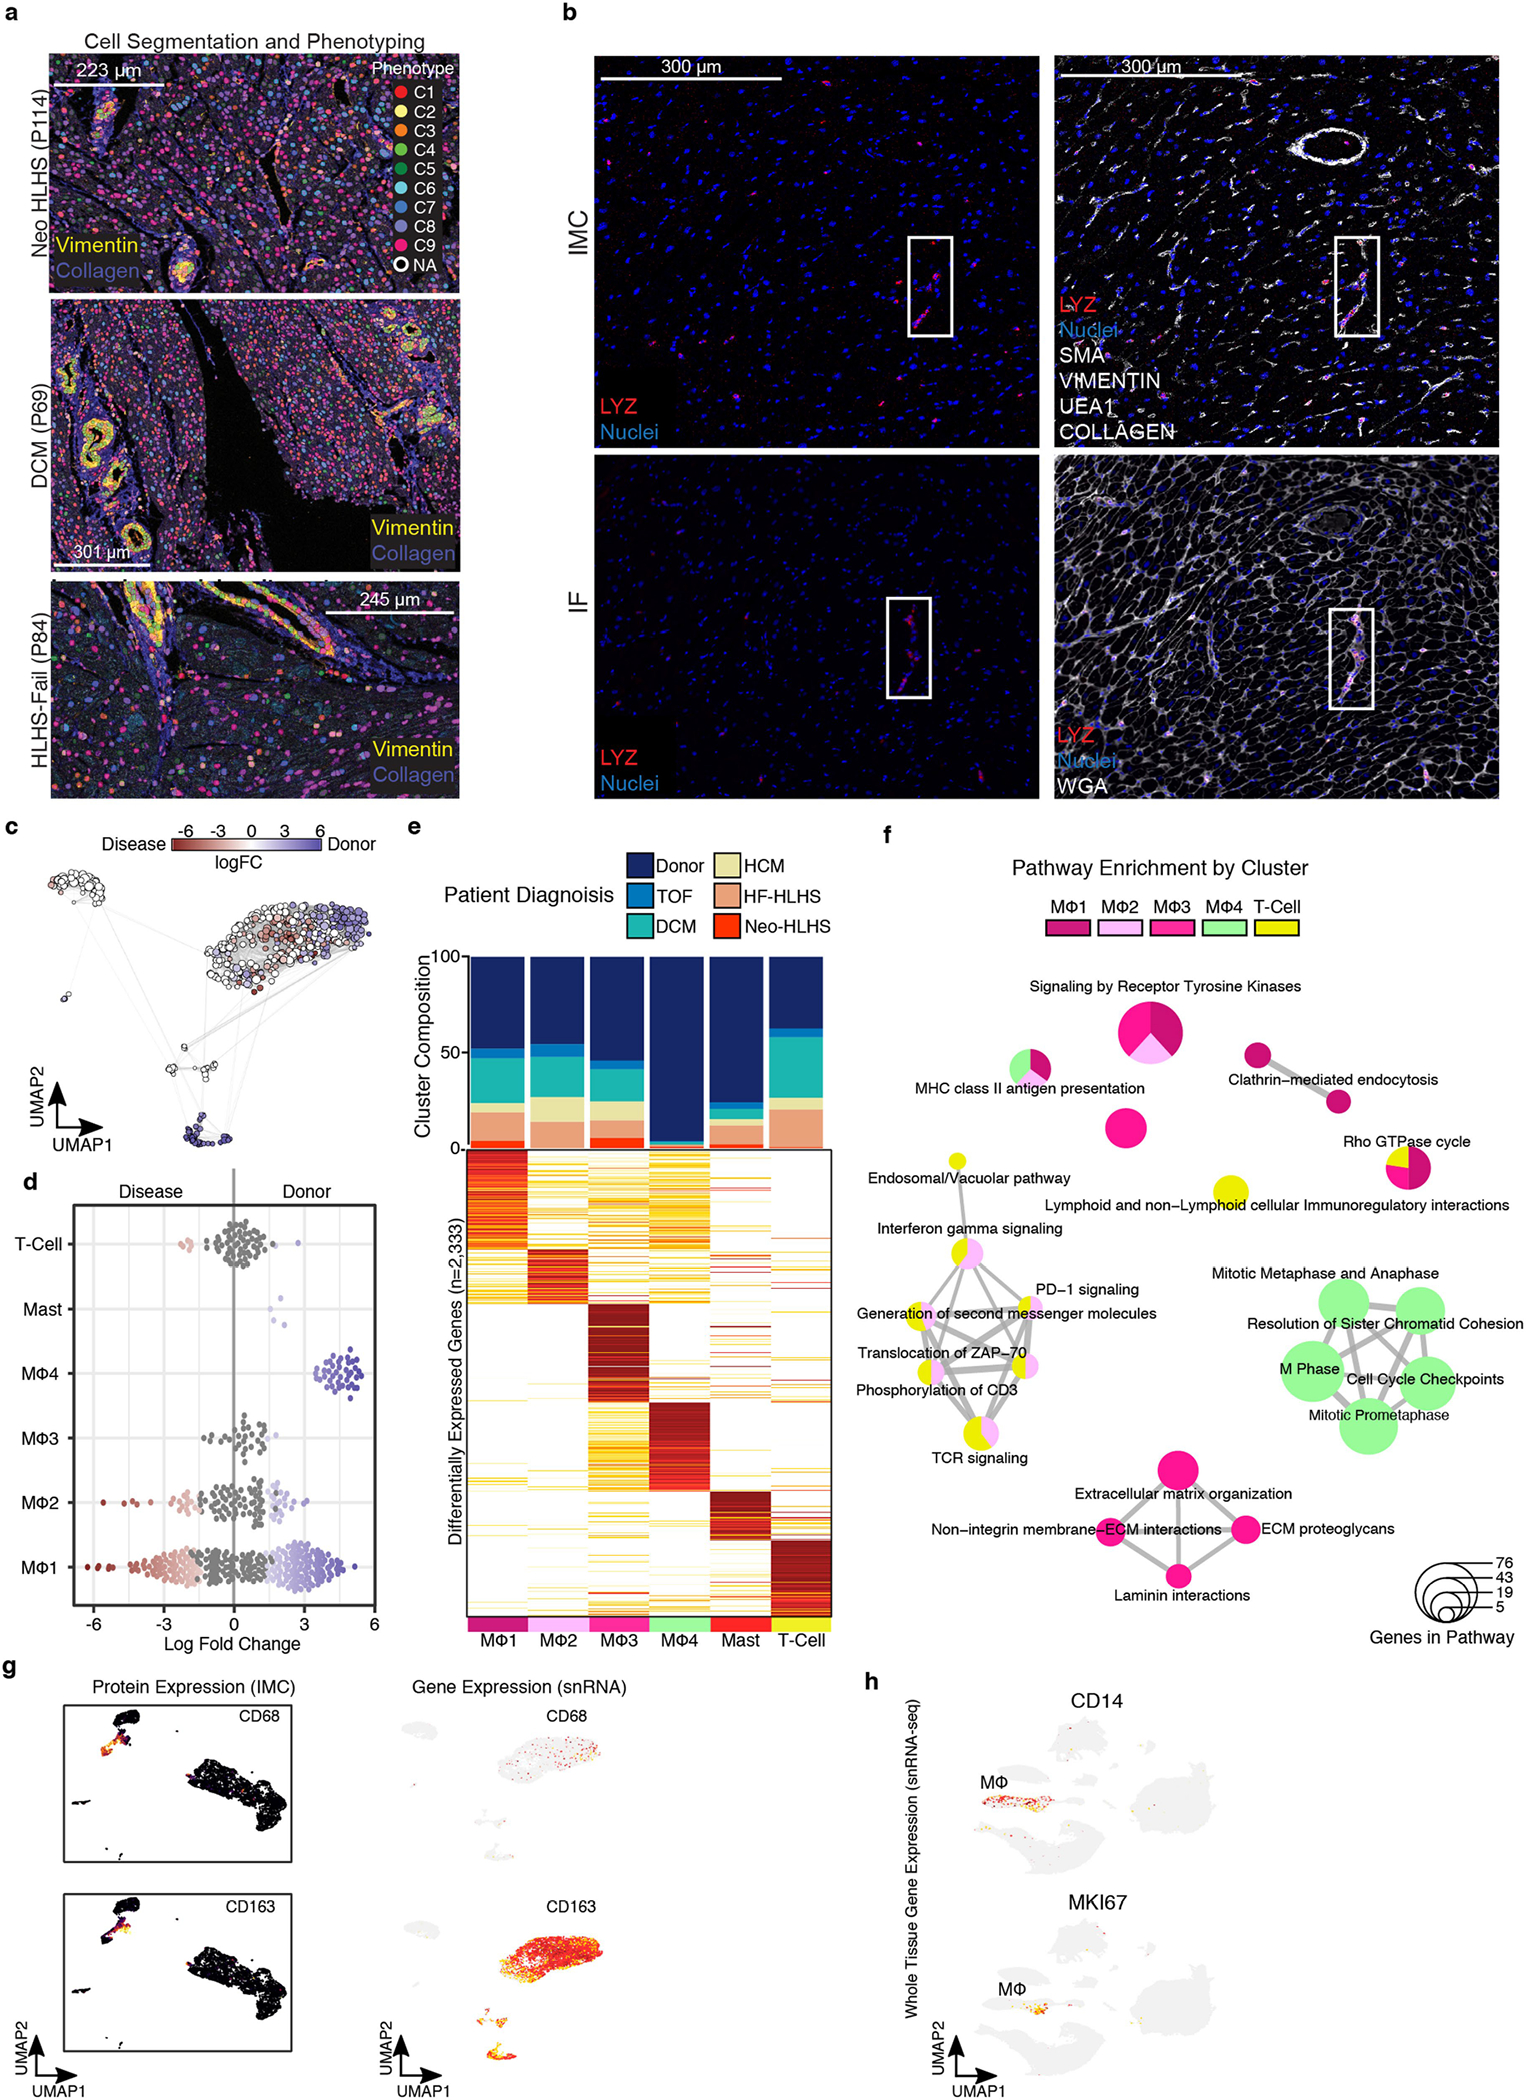
a, Representative images of cell-segmentation and phenotyping analysis performed on imaging mass cytometry (IMC) images. b, Representative images of IMC (top) and immunofluorescence (bottom)of LYZ marker expression. Solid boxes indicate same regions with LYZ expression. c, Embedding of the Milo K-NN differential abundance testing results for cardiac immune cell populations. All nodes represent neighborhoods, colored by their log fold changes for disease versus Donor. Neighborhoods with insignificant log fold changes (FDR 10%) are white. Layout of nodes determined by UMAP embedding, shown in Fig. 6f. d, Beeswarm plot showing the log-fold distribution of changes across disease and donors in neighborhoods from different immune cell clusters. Differentially abundant neighborhoods are shown in color. Compiled from Extended Data Fig. 7a. (e) Top, cluster composition bar plot colored by patient diagnosis. Bottom, heatmap displaying average expression for all differentially expressed genes for myeloid and lymphoid cell clusters. (f) Enrichment map for gene pathway overrepresentation analysis colored by cardiac immune cell cluster. (g) Left, protein expression from IMC data across UMAP embedding. Right, feature plot displaying gene expression from snRNA-seq. (h) Feature plot displaying gene expression from snRNA-seq. Related to Fig. 1b.
Extended Data Fig. 8 |. Single-cell transcriptomic analysis of PBMCs from pediatric patients with CHD.
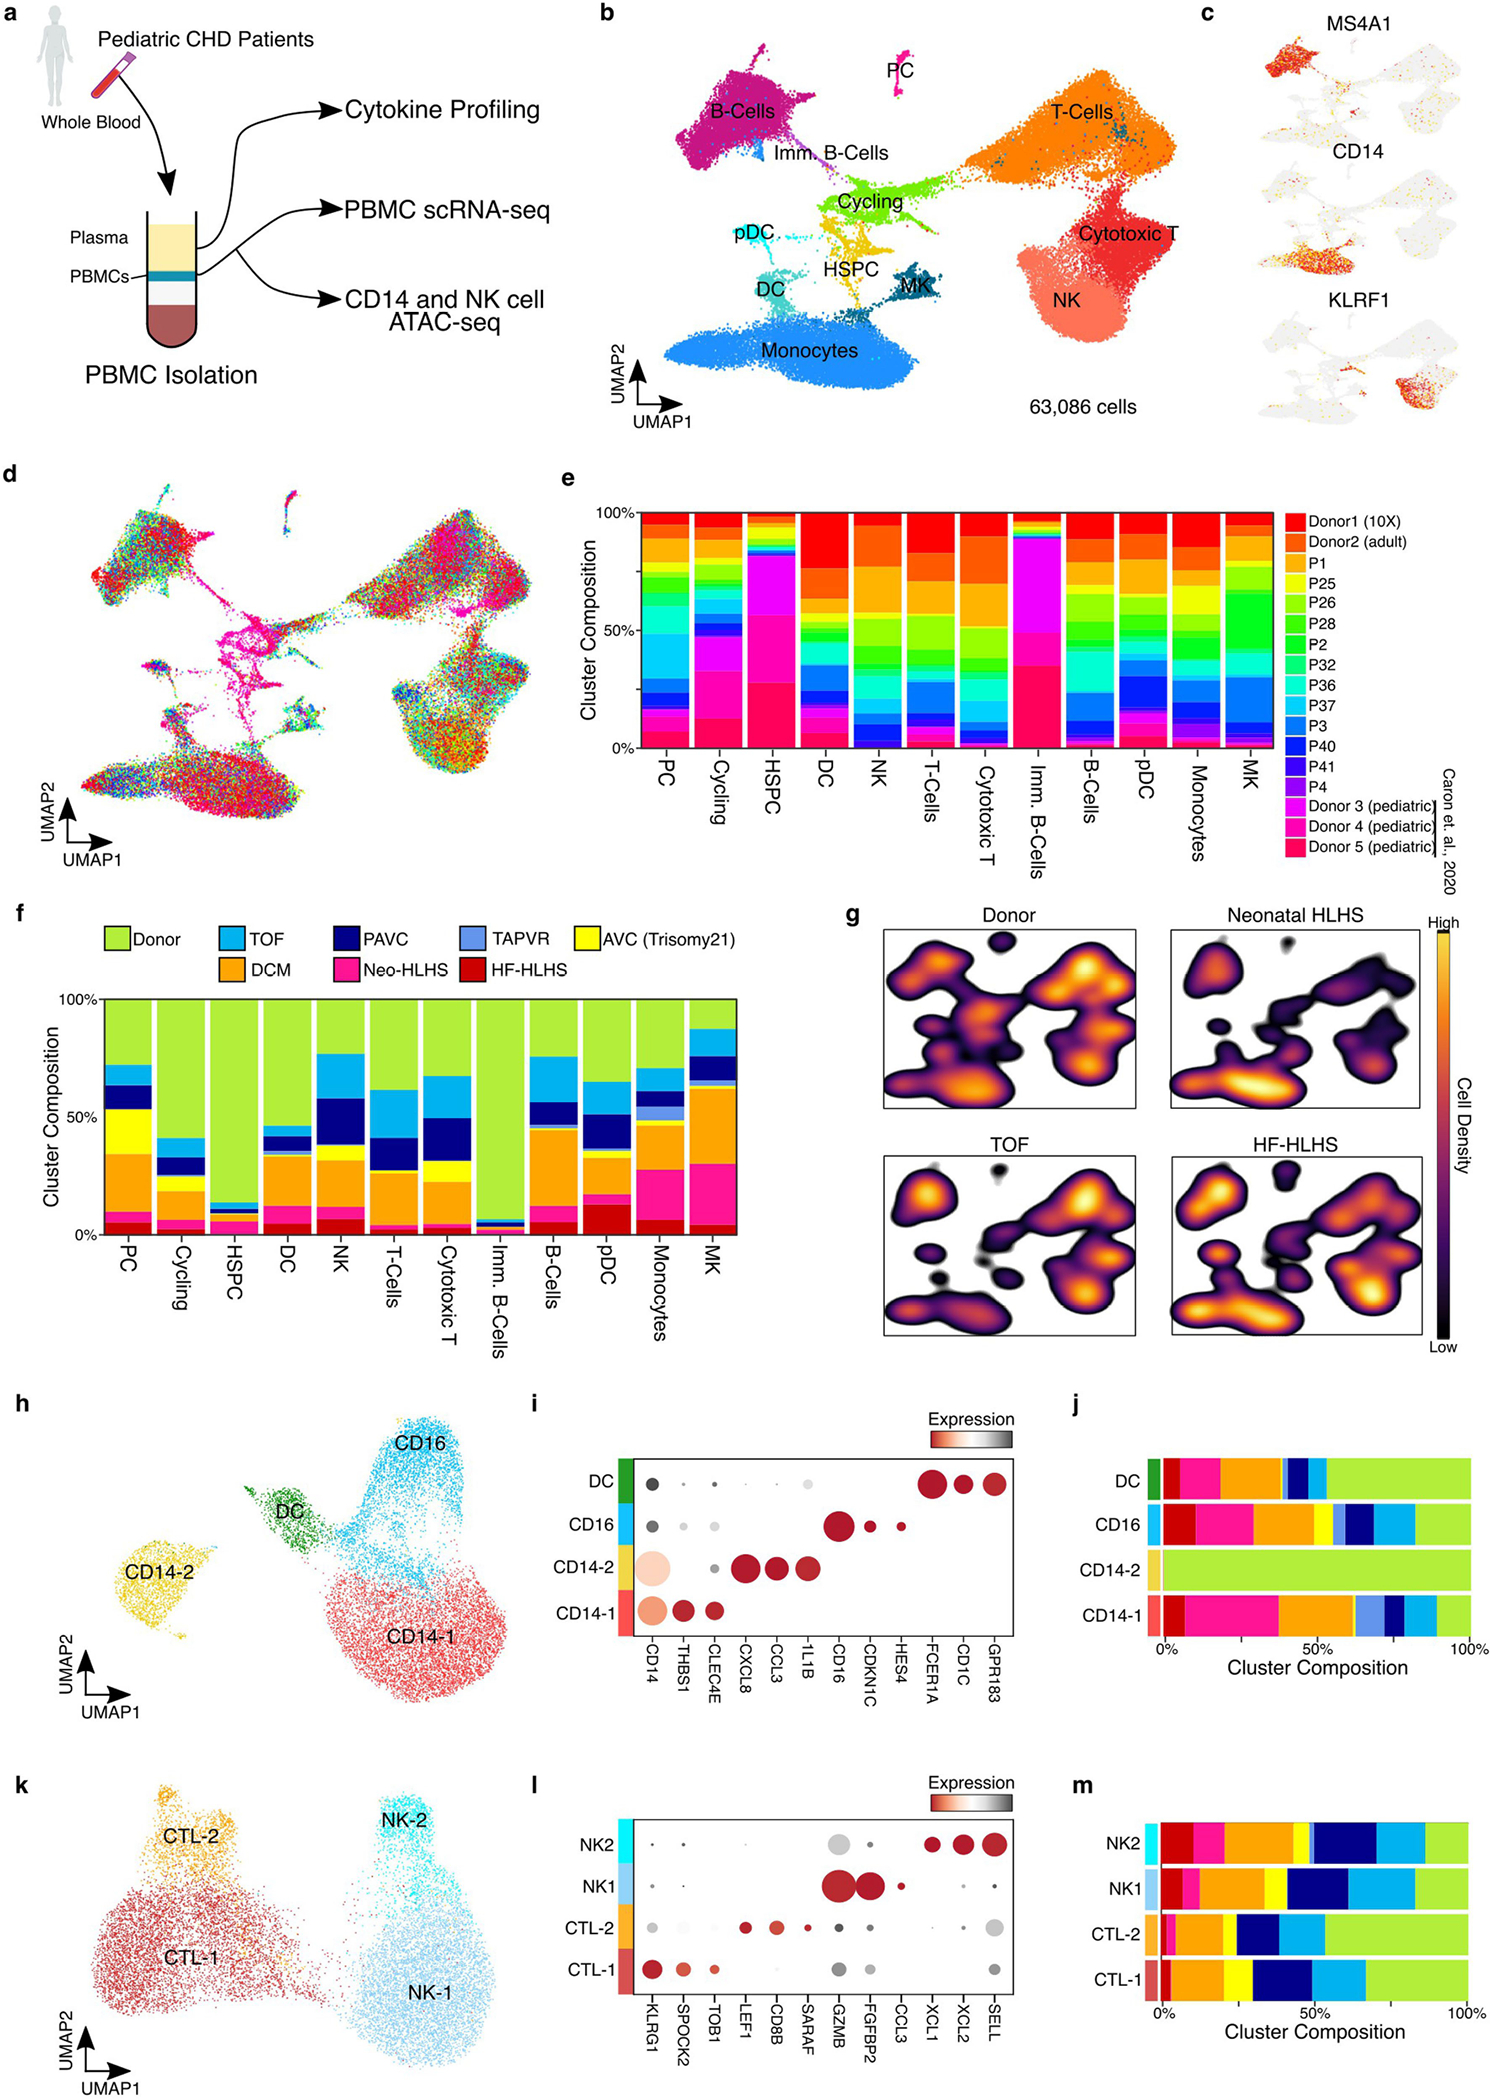
a, Diagram depicting the overall study design for hematological profiling in CHD patients. b, UMAP embedding of PBMCs colored by cell type. c, Feature plots showing the expression of marker genes. d, UMAP embedding of PBMC scRNA-seq data colored by patient sample Identification number. e, Cluster composition analysis of PBMC scRNA-seq data. f, Cluster composition stacked-bar plot highlighting the percent of cells from each diagnosis group within each single cell cluster. g, Density plot for each indicated diagnosis over the UMAP embedding from Extended Data Fig. 8b. h, UMAP embedding of peripheral monocyte cells. i, Dot plot displaying marker gene expression from monocyte cell clusters. j, Cluster composition analysis of monocyte clusters colored by patient diagnosis. k, UMAP embedding of peripheral NK cells. l, Dot plot displaying marker gene expression from NK cell clusters. m, Cluster composition analysis of NK cell clusters colored by patient diagnosis.
Extended Data Fig. 9 |. Transcriptomic and epigenomic characterization of peripheral immune cell populations in CHD.
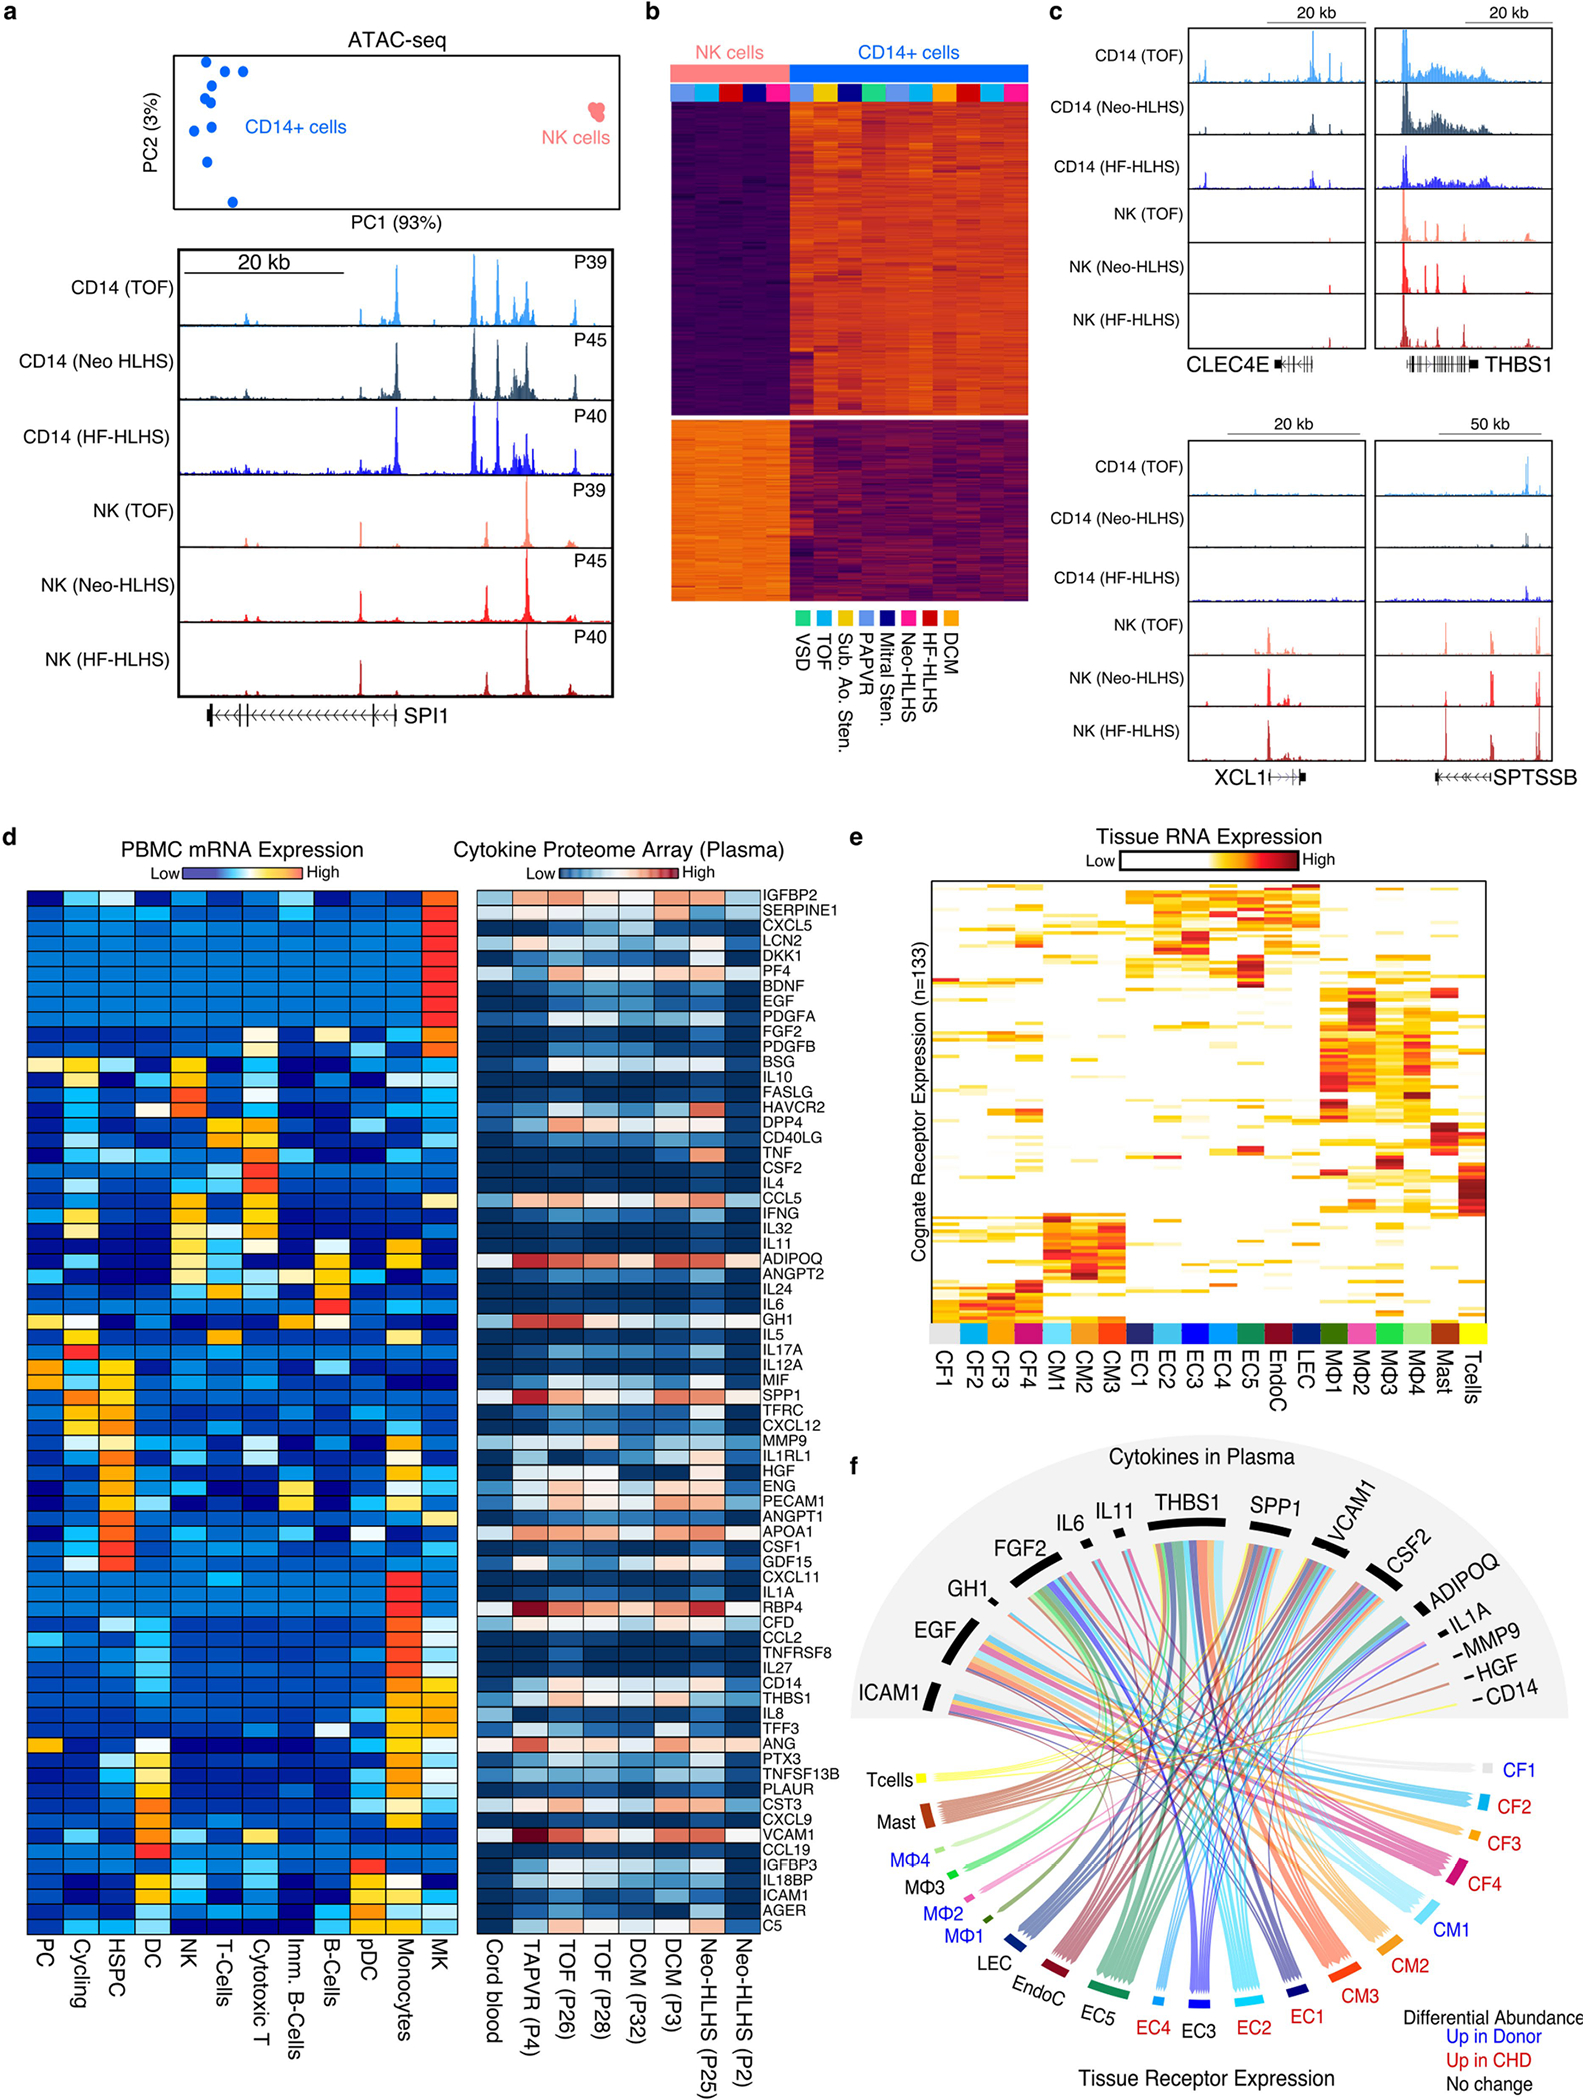
a, Top, PCA plot of NK and CD14+ cell ATAC-seq data. Bottom, Genome Browser tracks for NK cell and CD14+ cell ATAC-seq data. Each track is patient matched by diagnosis. b, Heatmap displaying differential chromatin accessibility analysis of NK cells versus CD14+ monocytes. c, Genome browser tracks displaying genes identified from differential expression analysis in scRNA-seq. d, Left, heatmap displaying the average mRNA expression per cluster of each cytokine (rows) detected in the plasma of CHD patients. Right, heatmap showing the protein expression of each cytokine (row) detected in CHD patient-derived plasma (columns). e, Heatmap depicting the expression of each cognate receptor from the putative ligands identified in Extended Data Fig. 9d from the cardiac snRNA-seq data. f, receptor-ligand map showing the highly expressed receptors identified in Extended Data Fig. 9e with their respective ligands identified in patient plasma. Connections colored by snRNA-seq cluster.
Supplementary Material
Acknowledgements
This work was supported by the Department of Defense (CDMRP) W81XWH-17-1-0418 (J.F.M.); National Institutes of Health (1F31HL156681-01 (H.L.), F30HL145908 (Z.A.K.), 5T32HL007208-42 (M.C.H.), R56 HL142704 and R01HL142704 (J.W.), and R01HL 127717, R01HL 130804 and R01HL 118761 (J.F.M.); the Vivian L. Smith Foundation (J.F.M.); Baylor Research Advocates for Student Scientists and Baylor College of Medicine Medical Scientist Training Program (Z.A.K.); the LeDucq Foundation’s Transatlantic Networks of Excellence in Cardiovascular Research (14CVD01: Defining the Genomic Topology of Atrial Fibrillation), the MacDonald Research Fund Award (16RDM001), and a grant from the Saving Tiny Hearts Society (J.F.M.); and NIH HL149164, HL148785 and University of Kentucky Myocardial Recovery Alliance (E.J.B. and K.S.C.). The TCBR is supported by: Children’s Discovery Institute of Washington University and St Louis Children’s Hospital (PM-LI-2019-829) (J.N. and K.L.), the Baylor College of Medicine Pathology and Histology Core and the BCM Breast Cancer Core. This project was supported by the Optical Imaging and Vital Microscopy (OiVM) core at BCM. This research was performed in the Flow Cytometry and Cellular Imaging Core Facility, which is supported in part by the National Institutes of Health through M. D. Anderson’s Cancer Center Support Grant CA016672, the NCI’s Research Specialist 1 R50 CA243707-01A1, and a Shared Instrumentation Award from the Cancer Prevention Research Institution of Texas (CPRIT), RP121010. This project was supported by the Cytometry and Cell Sorting Core at Baylor College of Medicine with funding from the CPRIT Core Facility Support Award (CPRIT-RP180672), the NIH (CA125123 and RR024574) and the assistance of J. M. Sederstrom. This project was supported in part by the Genomic and RNA Profiling Core at Baylor College of Medicine with funding from the NIH S10 grant (1S10OD023469). We acknowledge the Gill Cardiovascular Biorepository at the University of Kentucky for providing paediatric control myocardium samples. N. Stancel provided editorial support. Artwork for some figures was generated with BioRender.com.
Footnotes
Competing interests The authors declare no competing interests.
Reporting summary
Further information on research design is available in the Nature Research Reporting Summary linked to this paper.
Code availability
The pseduobulk RNA-seq analysis script we used is available at https://hbctraining.github.io/scRNA-seq/lessons/pseudobulk_DESeq2_scrnaseq.html.
Additional information
Supplementary information The online version contains supplementary material available at https://doi.org/10.1038/s41586-022-04989-3.
Peer review information Nature thanks Eva van Rooij and the other, anonymous, reviewer(s) for their contribution to the peer review of this work.
Reprints and permissions information is available at http://www.nature.com/reprints.
Data availability
Raw and processed next-generation sequencing data have been deposited at the NCBI Gene Expression Omnibus under accession number GSE203275. The snRNA-seq data are available online at the Broad Single Cell Portal under study number SCP1852.
References
- 1.Raissadati A, Nieminen H, Jokinen E & Sairanen H Progress in late results among pediatric cardiac surgery patients: a population-based 6-decade study with 98% follow-up. Circulation 131, 347–353 (2015). [DOI] [PubMed] [Google Scholar]
- 2.Diller GP et al. Survival prospects and circumstances of death in contemporary adult congenital heart disease patients under follow-up at a large tertiary centre. Circulation 132, 2118–2125 (2015). [DOI] [PubMed] [Google Scholar]
- 3.Hsu DT & Pearson GD Heart failure in children: part II: diagnosis, treatment, and future directions. Circ. Heart. Fail. 2, 490–498 (2009). [DOI] [PubMed] [Google Scholar]
- 4.Friedberg MK & Reddy S Right ventricular failure in congenital heart disease. Curr. Opin. Pediatr. 31, 604–610 (2019). [DOI] [PMC free article] [PubMed] [Google Scholar]
- 5.Gurvitz M et al. Emerging research directions in adult congenital heart disease: A report from an NHLBI/ACHA working group. J. Am. Coll. Cardiol. 67, 1956–1964 (2016). [DOI] [PMC free article] [PubMed] [Google Scholar]
- 6.Ntiloudi D et al. Adult congenital heart disease: a paradigm of epidemiological change. Int. J. Cardiol. 218, 269–274 (2016). [DOI] [PubMed] [Google Scholar]
- 7.Fontan F et al. Outcome after a “perfect” Fontan operation. Circulation 81, 1520–1536 (1990). [DOI] [PubMed] [Google Scholar]
- 8.Liu X et al. The complex genetics of hypoplastic left heart syndrome. Nat. Genet. 49, 1152–1159 (2017). [DOI] [PMC free article] [PubMed] [Google Scholar]
- 9.Brisson AR, Matsui D, Rieder MJ & Fraser DD Translational research in pediatrics: tissue sampling and biobanking. Pediatrics 129, 153–162 (2012). [DOI] [PubMed] [Google Scholar]
- 10.Sim CB et al. Sex-specific control of human heart maturation by the progesterone receptor. Circulation 143, 1614–1628 (2021). [DOI] [PMC free article] [PubMed] [Google Scholar]
- 11.Litviňuková M et al. Cells of the adult human heart. Nature 588, 466–472 (2020). [DOI] [PMC free article] [PubMed] [Google Scholar]
- 12.Tucker NR et al. Transcriptional and cellular diversity of the human heart. Circulation 142, 466–482 (2020). [DOI] [PMC free article] [PubMed] [Google Scholar]
- 13.Dann E, Henderson NC, Teichmamnn SA, Morgan MD & Marioni JC Differential abundance testing on single-cell data using k-nearest neighbor graphs. Nat. Biotechnol. 40, 245–253 (2022). [DOI] [PMC free article] [PubMed] [Google Scholar]
- 14.Liu H et al. Control of cytokinesis by β-adrenergic receptors indicates an approach for regulating cardiomyocyte endowment. Sci. Transl. Med. 11, eaaw6419 (2019). [DOI] [PMC free article] [PubMed] [Google Scholar]
- 15.van Duijvenboden K et al. Conserved NPPB+ border zone switches from MEF2- to AP-1-driven gene program. Circulation 140, 864–879 (2019). [DOI] [PubMed] [Google Scholar]
- 16.Lee R et al. Regulated inositol-requiring protein 1-dependent decay as a mechanism of corin RNA and protein deficiency in advanced human systolic heart failure. J. Am. Heart Assoc. 3, e001104 (2014). [DOI] [PMC free article] [PubMed] [Google Scholar]
- 17.Goetze JP et al. Cardiac natriuretic peptides. Nat. Rev. Cardiol. 17, 698–717 (2020). [DOI] [PubMed] [Google Scholar]
- 18.Yang SF, Chou RH, Li SY, Huang SS & Huang PH Serum corin level is associated with subsequent decline in renal function in patients with suspected coronary artery disease. J. Am. Heart Assoc. 7, e008157 (2018). [DOI] [PMC free article] [PubMed] [Google Scholar]
- 19.Eleuteri E et al. Fibrosis markers and CRIM1 increase in chronic heart failure of increasing severity. Biomarkers 19, 214–221 (2014). [DOI] [PubMed] [Google Scholar]
- 20.Beckman EJ Management of the pediatric organ donor. J. Pediatr. Pharmacol. Ther. 24, 276–289 (2019). [DOI] [PMC free article] [PubMed] [Google Scholar]
- 21.Tallquist MD & Molkentin JD Redefining the identity of cardiac fibroblasts. Nat. Rev. Cardiol. 14, 484–491 (2017). [DOI] [PMC free article] [PubMed] [Google Scholar]
- 22.Corbel M et al. Inhibition of bleomycin-induced pulmonary fibrosis in mice by the matrix metalloproteinase inhibitor batimastat. J. Pathol. 193, 538–545 (2001). [DOI] [PubMed] [Google Scholar]
- 23.Nguyen XX, Muhammad L, Nietert PJ & Feghali-Bostwick C IGFBP-5 promotes fibrosis via increasing its own expression and that of other pro-fibrotic mediators. Front. Endocrinol. 9, 601 (2018). [DOI] [PMC free article] [PubMed] [Google Scholar]
- 24.Numaga-Tomita T et al. TRPC3–GEF–H1 axis mediates pressure overload-induced cardiac fibrosis. Sci. Rep. 6, 39383 (2016). [DOI] [PMC free article] [PubMed] [Google Scholar]
- 25.Xiao Y et al. Hippo pathway deletion in adult resting cardiac fibroblasts initiates a cell state transition with spontaneous and self-sustaining fibrosis. Genes Dev. 33, 1491–1505 (2019). [DOI] [PMC free article] [PubMed] [Google Scholar]
- 26.Long F et al. Targeting JMJD3 histone demethylase mediates cardiac fibrosis and cardiac function following myocardial infarction. Biochem. Biophys. Res. Commun. 528, 671–677 (2020). [DOI] [PubMed] [Google Scholar]
- 27.Kalucka J et al. Single-cell transcriptome atlas of murine endothelial cells. Cell 180, 764–779.e720 (2020). [DOI] [PubMed] [Google Scholar]
- 28.Su T et al. Single-cell analysis of early progenitor cells that build coronary arteries. Nature 559, 356–362 (2018). [DOI] [PMC free article] [PubMed] [Google Scholar]
- 29.Thiriot A et al. Differential DARC/ACKR1 expression distinguishes venular from non-venular endothelial cells in murine tissues. BMC Biol. 15, 45 (2017). [DOI] [PMC free article] [PubMed] [Google Scholar]
- 30.Vanlandewijck M et al. A molecular atlas of cell types and zonation in the brain vasculature. Nature 554, 475–480 (2018). [DOI] [PubMed] [Google Scholar]
- 31.Jiang X et al. Elevated lymphatic vessel density measured by Lyve-1 expression in areas of replacement fibrosis in the ventricular septum of patients with hypertrophic obstructive cardiomyopathy (HOCM). Heart Vessels 35, 78–85 (2020). [DOI] [PubMed] [Google Scholar]
- 32.Bertero E, Kutschka I, Maack C & Dudek J Cardiolipin remodeling in Barth syndrome and other hereditary cardiomyopathies. Biochim. Biophys. Acta 1866, 165803 (2020). [DOI] [PubMed] [Google Scholar]
- 33.Salehi AH, Xanthoudakis S & Barker PA NRAGE, a p75 neurotrophin receptor-interacting protein, induces caspase activation and cell death through a JNK-dependent mitochondrial pathway. J. Biol. Chem. 277, 48043–48050 (2002). [DOI] [PubMed] [Google Scholar]
- 34.Nishimura H et al. Autoimmune dilated cardiomyopathy in PD-1 receptor-deficient mice. Science 291, 319–322 (2001). [DOI] [PubMed] [Google Scholar]
- 35.Zhang B CD73: a novel target for cancer immunotherapy. Cancer Res. 70, 6407–6411 (2010). [DOI] [PMC free article] [PubMed] [Google Scholar]
- 36.Hyun SY et al. Immunosuppressive role of CD11b+ CD33+ HLA-DR− myeloid-derived suppressor cells-like blast subpopulation in acute myeloid leukemia. Cancer Med. 9, 7007–7017 (2020). [DOI] [PMC free article] [PubMed] [Google Scholar]
- 37.Afanasyeva M et al. Impaired up-regulation of CD25 on CD4+ T cells in IFN-γ knockout mice is associated with progression of myocarditis to heart failure. Proc. Natl Acad. Sci. USA 102, 180–185 (2005). [DOI] [PMC free article] [PubMed] [Google Scholar]
- 38.Grabie N, Lichtman AH & Padera R T cell checkpoint regulators in the heart. Cardiovasc. Res. 115, 869–877 (2019). [DOI] [PMC free article] [PubMed] [Google Scholar]
- 39.Koenig AL et al. Single-cell transcriptomics reveals cell-type-specific diversification in human heart failure. Nat. Cardiovasc. Res. 1, 263–280 (2022). [DOI] [PMC free article] [PubMed] [Google Scholar]
- 40.Caron M et al. Single-cell analysis of childhood leukemia reveals a link between developmental states and ribosomal protein expression as a source of intra-individual heterogeneity. Sci Rep. 10, 8079 (2020). [DOI] [PMC free article] [PubMed] [Google Scholar]
- 41.Zheng GX et al. Massively parallel digital transcriptional profiling of single cells. Nat. Commun. 8, 14049 (2017). [DOI] [PMC free article] [PubMed] [Google Scholar]
- 42.Crozat K et al. The XC chemokine receptor 1 is a conserved selective marker of mammalian cells homologous to mouse CD8α+ dendritic cells. J. Exp. Med. 207, 1283–1292 (2010). [DOI] [PMC free article] [PubMed] [Google Scholar]
- 43.Vanhoutte D et al. Thbs1 induces lethal cardiac atrophy through PERK-ATF4 regulated autophagy. Nat. Commun. 12, 3928 (2021). [DOI] [PMC free article] [PubMed] [Google Scholar]
- 44.Jin S et al. Inference and analysis of cell-cell communication using CellChat. Nat. Commun. 12, 1088 (2021). [DOI] [PMC free article] [PubMed] [Google Scholar]
- 45.Blair CA et al. A protocol for collecting human cardiac tissue for research. VAD J. 2, 12 (2016). [DOI] [PMC free article] [PubMed] [Google Scholar]
- 46.Corces MR et al. An improved ATAC-seq protocol reduces background and enables interrogation of frozen tissues. Nat. Methods 14, 959–962 (2017). [DOI] [PMC free article] [PubMed] [Google Scholar]
- 47.Hill MC & Martin JF Epigenetic assays in purified cardiomyocyte nuclei. Methods Mol. Biol. 2158, 307–321 (2021). [DOI] [PubMed] [Google Scholar]
- 48.Morikawa Y et al. Actin cytoskeletal remodeling with protrusion formation is essential for heart regeneration in Hippo-deficient mice. Sci. Signal. 8, ra41 (2015). [DOI] [PMC free article] [PubMed] [Google Scholar]
- 49.Chevrier S et al. Compensation of signal spillover in suspension and imaging mass cytometry. Cell Syst. 6, 612–620.e615 (2018). [DOI] [PMC free article] [PubMed] [Google Scholar]
- 50.Fleming SJ, Marioni JC & Babadi M CellBender remove-background: a deep generative model for unsupervised removal of background noise from scRNA-seq datasets. Preprint at bioRxiv 10.1101/791699(2019). [DOI] [Google Scholar]
- 51.Korsunsky I et al. Fast, sensitive and accurate integration of single-cell data with Harmony. Nat. Methods 16, 1289–1296 (2019). [DOI] [PMC free article] [PubMed] [Google Scholar]
- 52.Li L et al. Pitx2 maintains mitochondrial function during regeneration to prevent myocardial fat deposition. Development 145, dev168609 (2018). [DOI] [PMC free article] [PubMed] [Google Scholar]
- 53.Yu G, Wang LG, Han Y & He QY clusterProfiler: an R package for comparing biological themes among gene clusters. OMICS 16, 284–287 (2012). [DOI] [PMC free article] [PubMed] [Google Scholar]
- 54.Love MI, Huber W & Anders S Moderated estimation of fold change and dispersion for RNA-seq data with DESeq2. Genome Biol 15, 550 (2014). [DOI] [PMC free article] [PubMed] [Google Scholar]
- 55.Marini F & Binder H pcaExplorer: an R/Bioconductor package for interacting with RNA-seq principal components. BMC Bioinf. 20, 331 (2019). [DOI] [PMC free article] [PubMed] [Google Scholar]
- 56.Ramilowski JA et al. A draft network of ligand–receptor-mediated multicellular signalling in human. Nat. Commun. 6, 7866 (2015). [DOI] [PMC free article] [PubMed] [Google Scholar]
- 57.Tirosh I et al. Dissecting the multicellular ecosystem of metastatic melanoma by single-cell RNA-seq. Science 352, 189–196 (2016). [DOI] [PMC free article] [PubMed] [Google Scholar]
- 58.Monroe TO et al. YAP partially reprograms chromatin accessibility to directly induce adult cardiogenesis in vivo. Dev. Cell 48, 765–779.e767 (2019). [DOI] [PMC free article] [PubMed] [Google Scholar]
- 59.Langmead B & Salzberg SL Fast gapped-read alignment with Bowtie 2. Nat. Methods 9, 357–359 (2012). [DOI] [PMC free article] [PubMed] [Google Scholar]
- 60.Zhang Y et al. Model-based analysis of ChIP-seq (MACS). Genome Biol. 9, R137 (2008). [DOI] [PMC free article] [PubMed] [Google Scholar]
- 61.Quinlan AR & Hall IM BEDTools: a flexible suite of utilities for comparing genomic features. Bioinformatics 26, 841–842 (2010). [DOI] [PMC free article] [PubMed] [Google Scholar]
- 62.Hansen KD, Irizarry RA & Wu Z Removing technical variability in RNA-seq data using conditional quantile normalization. Biostatistics 13, 204–216 (2012). [DOI] [PMC free article] [PubMed] [Google Scholar]
- 63.Heinz S et al. Simple combinations of lineage-determining transcription factors prime cis-regulatory elements required for macrophage and B cell identities. Mol. Cell 38, 576–589 (2010). [DOI] [PMC free article] [PubMed] [Google Scholar]
Associated Data
This section collects any data citations, data availability statements, or supplementary materials included in this article.
Supplementary Materials
Data Availability Statement
Raw and processed next-generation sequencing data have been deposited at the NCBI Gene Expression Omnibus under accession number GSE203275. The snRNA-seq data are available online at the Broad Single Cell Portal under study number SCP1852.


