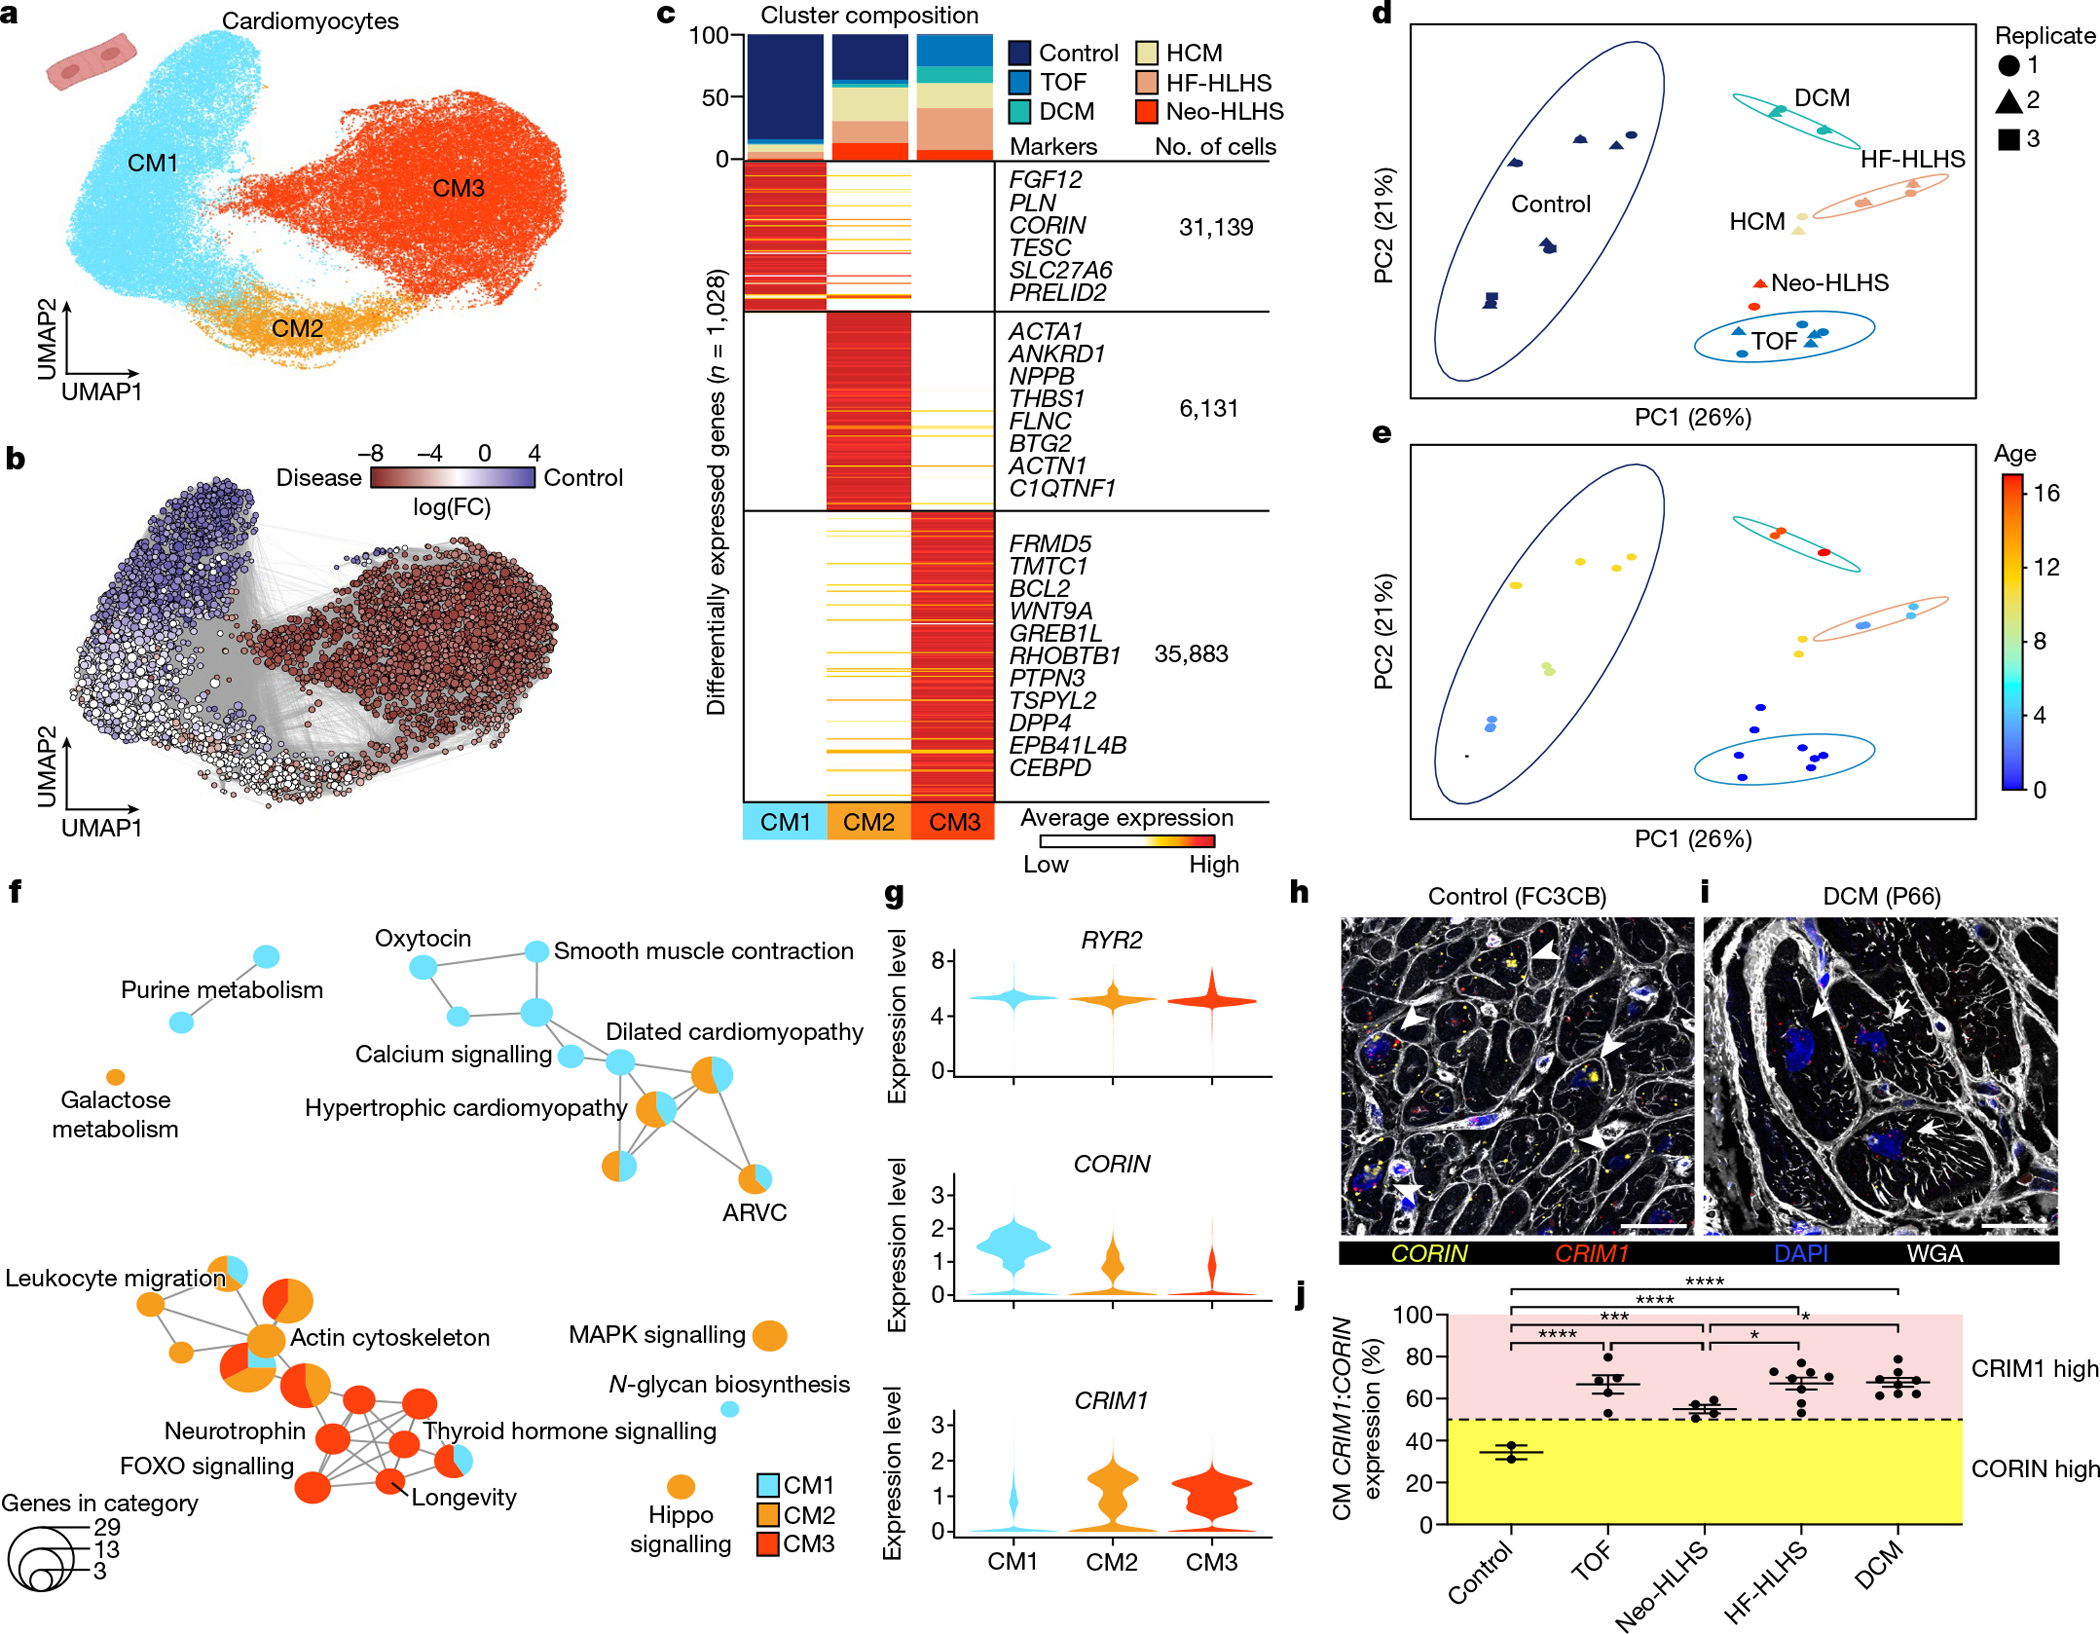
Fig. 2 |. snRNA-seq showing the unique transcriptional signature of cardiomyocytes in paediatric patients with CHD.

a, UMAP embedding of reiterative clustering of cardiomyocytes. b, Embedding the Milo k-nearest neighbour differential abundance testing results for cardiomyocytes. All nodes represent neighbourhoods, coloured by log fold changes for CHD versus control samples. Neighbourhoods with insignificant log fold changes (false discovery rate (FDR) < 10%) are shown in white. The layout of nodes is determined by UMAP embedding, as shown in a. c, Top, cluster composition plot indicating the percentage of cells from each diagnosis that contribute to each cluster. Bottom, average expression heat map with representative genes shown on the right. d, PCA plot for pseudo-bulk RNA-seq analysis of all cardiomyocytes by diagnosis. Plots are coloured by diagnosis as in c. Ellipses indicate the 95% confidence interval. Replicates (libraries) from each sample indicated by a different shape. e, PCA plot for pseudo-bulk RNA-seq analysis of all cardiomyocytes from d, coloured by donor age. The colours highlight the gross pattern of age progression from youngest to oldest. Ellipses indicate the 95% confidence interval. f, Cluster enrichment map displaying the proportional KEGG pathways analysis for all cardiomyocyte clusters. The size of each node indicates the number of genes within each KEGG category. g, Violin plots showing expression levels for each cardiomyocyte cluster, coloured according to the cluster designations in a. h,i, RNA fluorescence in situ hybridization for CRIM1 and CORIN, co-stained with DAPI and wheat germ agglutinin (WGA). Arrowheads show cardiomyocytes with high CORIN expression and arrows show cardiomyocytes with high CRIM1 expression. j, CRIM1:CORIN expression ratio (n = 672) across 27 individuals (2 control, 5 TOF, 4 Neo-HLHS, 8 HF-HLHS and 8 DCM), each data point is the average relative expression in a sample from one individual. *P < 0.05, ***P < 0.001, ****P < 0.0001 with mixed-effect model. Data are mean values ± s.e.m.
