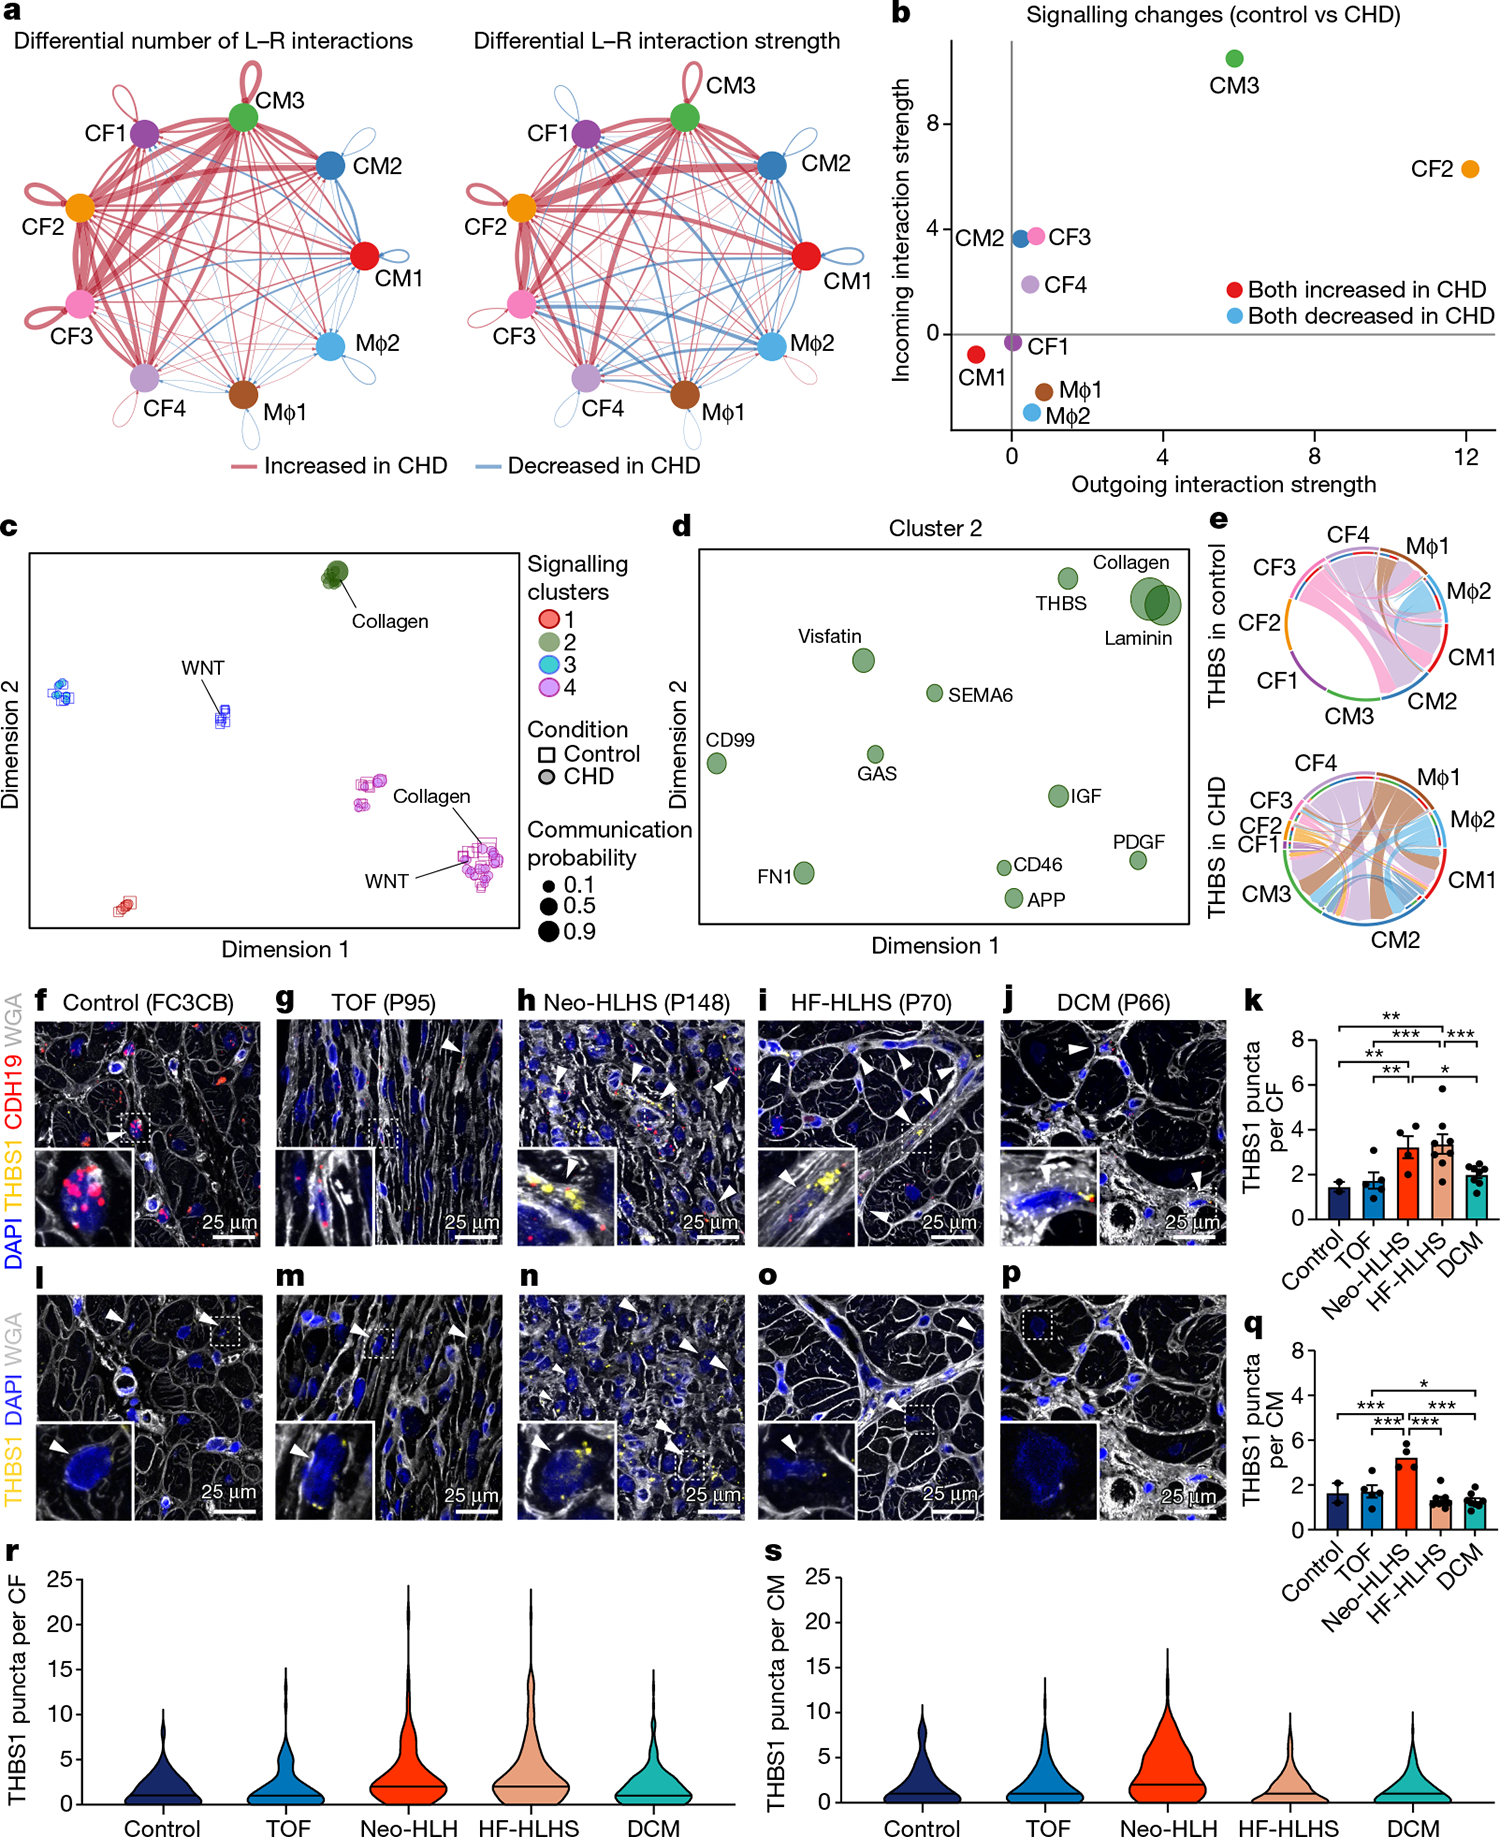
Fig. 6 |. Intercellular communication in paediatric cardiovascular disease.

a, Circle plot highlighting the differential number of ligand–receptor (L–R) interactions between control and CHD nuclei. b, Comparison of major targets and source shifts between control and CHD samples. Positive values indicate an increase in signal in CHD. c, Joint projection and clustering of signalling pathways from control and CHD datasets according to topological pathway similarities. Each data point represents an individual signalling pathway. The size of each point is proportional to the communication probability of that network. Representative pathways are highlighted. d, Magnified view of cluster 2 from c. The size of each point is proportional to the communication probability. e, Circle plot showing THBS signalling network activity in control and CHD cardiac tissue. Each link indicates an intercellular connection. The root of each arrow is the ligand-expressing cell type, and the tip of each arrow is the receiving cell. f–j, RNAscope for THBS1 and CDH19 in control (f), TOF (g), Neo-HLHS (h), HF-HLHS (i) and DCM (j) tissue, co-stained with DAPI and WGA to visualize tissue composition. Arrowheads show co-expression of THBS1 and CDH19 in cardiac fibroblasts. k, TBHS1 expression in CDH19+ fibroblasts (n = 640). Each data point represents average expression from one sample (2 control, 5 TOF, 4 Neo-HLHS, 8 HF-HLHS and 8 DCM). l–p, RNAscope for THBS1 in control (l), TOF (m), Neo-HLHS (n), HF-HLHS (o) and DCM (p) tissue. Arrowheads show THBS1 expression in cardiomyocytes. q, Relative TBHS1 expression in cardiomyocytes (n = 611). Each data point represents average expression from one sample (2 control, 5 TOF, 4 Neo-HLHS, 8 HF-HLHS and 8 DCM). r, Violin plot of THBS1 expression in cardiac fibroblasts (n = 640). s, Violin plot of THBS1 expression in cardiomyocytes (n = 611). *P < 0.05, **P < 0.01, ***P < 0.001; mixed-effects model. Data are mean ± s.e.m.
