

Abstract
Background:
Cleft lip with cleft palate (CLP) is a congenital condition that affects both the oral cavity and the lips. This study estimated the prevalence and mortality of CLP using surveillance data collected from birth defect registries around the world.
Methods:
Data from 22 population- and hospital-based surveillance programs affiliated with the International Clearinghouse for Birth Defects Surveillance and Research (ICBDSR) in 18 countries on live births (LB), stillbirths (SB), and elective terminations of pregnancy for fetal anomaly (ETOPFA) for CLP from 1974 to 2014 were analyzed. Prevalence and survival (survival for LB only) estimates were calculated for total and subclassifications of CLP and by pregnancy outcome.
Results:
The pooled prevalence of total CLP cases was 6.4 CLP per 10,000 births. The prevalence of CLP and all of the pregnancy outcomes varied across programs. Higher ETOPFA rates were recorded in most European programs compared to programs in other continents. In programs reporting low ETOPFA rates or where there was no ascertainment of ETOPFA, the rate of CLP among LB and SB was higher compared to those where ETOPFA rates were ascertained. Overall survival for total CLP was 91%. For isolated CLP, the survival was 97.7%. CLP associated with multiple congenital anomalies had an overall survival of 77.1%, and for CLP associated with genetic/chromosomal syndromes, overall survival was 40.9%.
Conclusions:
Total CLP prevalence reported in this study is lower than estimates from prior studies, with variation by pregnancy outcomes between programs. Survival was lower when CLP was associated with other congenital anomalies or syndromes compared to isolated CLP.
Keywords: craniofacial abnormalities, congenital anomalies, mortality, prevalence, surveillance
1 |. INTRODUCTION
Cleft lip with cleft palate (CLP) describes a congenital condition that affects both the oral cavity and the lips (Kadir et al., 2017). The condition is a result of the failure of the left and right palatal shelves and lips fusing during the first 9 weeks of fetal development (Berkowitz, 2013). CLP can arise as part of a syndrome or as an isolated disorder and the causes behind CLP are thought to be due to a range of both genetic and environmental factors (Berkowitz, 2013; Cobourne & Sharpe, 2012). The degree of clefting varies from case to case and does not affect each person equally. This article focuses on undifferentiated CLP for which current estimates of prevalence are 1.7 per 1,000 live births (LB) (Mossey, Little, Munger, Dixon, & Shaw, 2009).
The prevalence data available for orofacial clefts (OFC) vary internationally due to differences in ascertainment ability, registry resources, and comparability of the conditions classified in reported studies. A European study carried out across 17 different nations demonstrated variation between 6.3 and 26.2 per 10,000 births for all orofacial clefts (cleft palate or cleft lip +/− cleft palate) (mean prevalence 15.2 per 10,000 births) (Calzolari, Rubies, Neville, & Bianchi, 2002). As with many conditions, high-income countries have a greater ability to conduct birth defect surveillance due to more advanced health systems and centrally organized registries (Swanson, 2021). In low- and middle- income countries, the resources available for birth defect surveillance are reduced, which impacts data availability and prevents accurate international comparisons and inferences (Cobourne & Sharpe, 2012).
Mortality of infants born with OFC is associated with the lack of access to appropriate care and surgical intervention (Cobourne & Sharpe, 2012). The diagnosis and treatment available for children with OFC varies internationally, leading to inequalities in health outcomes (Mossey et al., 2009). Understanding where mortality rates are high could help to target further research and interventions to reduce mortality, improve quality of life, and provide greater equity of care. Prevalence data from multiple countries would guide future research to identify risk factors, policies, or ascertainment methods that give rise to variation globally, including nutrition/ fortification policies, policies regarding early termination of pregnancy for fetal anomaly ETOPFA, prenatal care arrangement, and prevalence of underlying genetic/chromosomal anomalies in the parent population. Understanding more about these associations could enable development and testing of preventative interventions.
The International Clearinghouse for Birth Defects Surveillance and Research (ICBDSR) was founded in 1974 and is affiliated with the World Health Organization. It has a stated mission to “bring together birth defect programs from around the world with the aim of conducting worldwide surveillance and research to prevent birth defects and to ameliorate their consequences” (ICBDSR, n.d.). The ICBDSR includes 42 programs spread across the world with a mixture of population- and hospital-based registries. Data collected by ICBDSR programs enable analysis of the prevalence, pregnancy outcomes, and survival for a range of congenital anomalies on an international basis.
The aim of this retrospective cohort study was to analyze undifferentiated CLP birth surveillance data from participating ICBDSR programs to estimate the prevalence and survival of CLP by pregnancy outcomes while identifying areas for improvement in data collection processes for this type of study.
2 |. METHODS
The structure and content of this article is informed by The Strengthening the Reporting of Observational Studies in Epidemiology (STROBE) Statement: guidelines for reporting observational studies (von Elm et al., 2007).
2.1 |. Case definition
The primary congenital anomaly reported in this study is undifferentiated CLP. This includes all CLP cases including isolated CLP (no other orofacial anomalies identified), CLP associated with multiple congenital anomalies, and CLP associated with syndromes. Isolated cleft palate and isolated cleft lip have been reported separately to this data set and are, therefore, not included here. Cases included all identified conceptions, resulting in an individual with CLP, regardless of outcome. Where data were available, subclassifications including isolated CLP, CLP associated with multiple congenital anomalies, and CLP associated with syndromes are reported as mutually exclusive categories.
Keeping with accepted terminology, birth prevalence is used in this article to describe the point prevalence of CLP in discrete populations included in ICBDSR programs (Mason, Kirby, Sever, & Langlois, 2005). Mason et al. (2005) suggested using total births alone as the denominator, but those data were not available in this study, so a slightly modified equation was used. Birth prevalence was calculated as follows:
2.2 |. Data source
All ICBDSR programs were invited to participate. Twenty-three birth surveillance programs from 18 countries provided data covering a range of time periods within the date range 1974–2014. Each program returned a single data set except for the Registry of the Spanish Collaborative Study of Congenital Malformations (ECEMC). ECEMC provided data from two different hospital cohorts, one reporting ETOPFA and the other where data regarding ETOPFA was explicitly not recorded. The ECEMC data sets have been treated separately in the data analysis.
The programs are a mix of population and hospital-based registries. Raw data were provided in the form of MS Excel documents with cases classified by pattern into the following categories: isolated CLP, CLP associated with multiple congenital anomalies, CLP associated with syndromes, and CLP unclassified. No program returned data for CLP unclassified and, therefore, analysis is focused on the other categories only. Further to this, all programs reported a “Total CLP” value that combines all the aforementioned subclassifications.
Data sets included varying amounts of data on LB, stillbirths (SB) and ETOPFA for each of the CLP subclassifications. The most complete data set across all programs was ‘Total CLP’ and this was selected for more detailed analysis with descriptive statistics presented for subclassifications where possible.
2.3 |. Data quality assessment/Data analysis
Data were extracted and combined using the Microsoft Excel. Primary inspection and analysis of the data were conducted using R (R Core Team, 2021). The data were inspected and cleaned. Data anomalies identified in the reporting triggered dialog with the reporting programs for clarification and correction of errors where possible. Data quality issues were considered by NMG, GR, and PM following early data cleaning. Data sets with overwhelming data errors or omissions following attempts to clarify were excluded from the analysis (n = 1). Therefore, data from 22 surveillance programs amounting to 23 data sets have been included in the analysis.
The quantities of data and formatting of the data files varied considerably between programs, so automated importation was not practical and the data had to be manually imported one file at a time. The data set from each program was individually copied and pasted into a large Excel “master” file, which was of a format suitable for analysis in R. The data were inspected primarily through the use of the aggregate command and ggplot2 to produce summary statistic tables and graphs. Where possible, the data were further checked for obvious errors (e.g., extremely low or high prevalence or mathematical errors such as more deaths than reported cases in a given year).
Not all programs provided data for the entire observation period; therefore, data provided were averaged for the period that each program provided results. For example, when calculating prevalence, while the number of years returned varied, the denominator in all cases was the total number of LB plus SB reported by that program for all the years they returned data, and the numerator was the total cases observed during that same period.
Survival was calculated using data for LB only. Survival data are presented as percentages surviving at timepoints from <1 day to 5 years + where this was ascertained. Overall survival includes the timepoint survival data and any death confirmed but without a timepoint attached.
2.4 |. Ethical consideration
ICBDSR programs providing data for this study have done so according to local ethical procedures and review. Only aggregated data without any personal identifiers were used in this study, and therefore, further ethical review was not required.
3 |. RESULTS
Data from 22 programs amounting to 23 separate data sets were included in the analysis. This included a total number of 23,523,031 births and 15,103 CLP cases. Table 1 provides a description (location, type of registry, area covered, ascertainment period, stillbirth definition, whether ETOPFA is permitted, and prenatal screening services) of ICBDSR programs providing data and included in this study. A description of the follow-up method for LB for each program is presented in Table 2.
TABLE 1.
Description of ICBDSR Birth Surveillance programs providing data and included in this study.
| Country | Birth surveillance program | Population or hospital-based program | Area covered Ascertainment period |
Ascertainment methoda |
Stillbirth definition | ETOPFA permitted |
Prenatal screening services |
|---|---|---|---|---|---|---|---|
| Argentina | RENAC | Hospital | National Hospital discharge | Passive | >500 g | No | Yes, but no official program |
| Colombia | Cali | Hospital | Regional 1 day/hospital discharge | Passive | >500 g | Yes, since 2006, but not registered | Yes |
| Czech Republic | Czech | Population | National 15 years | Passive | 22 weeks or >500 g | Yes | Yes |
| Spain | ECEMC hospitals not reporting ETOPFA | Hospital | Regional 3 days | Active | 24 weeks or >500 g | Yes, since 1985 | Yes |
| Spain | ECEMC hospitals reporting ETOPFA | Hospital | Regional 3 days | Active | 24 weeks or >500 g | Yes, since 1985 | Yes |
| France | Paris | Population | Regional 28 days | Active | 22 weeks or >500 g | Yes | Yes |
| Germany | Saxony-Anhalt | Population | Regional 1 year | Passive | >500 g | Yes | Yes, since 1990 |
| Iran | Tabriz Registry of Congenital Anomalies (TRoCA) | Hospital | Regional Hospital Discharge | Hybrid | 20 weeks or >400 g | Yes, but not formally registered. | Yes |
| Israel | Israel | Hospital | Regional Hospital discharge | Passive | 22 weeks or >500 g | Yes, not registered | Yes |
| Italy | Lombardy | Population | Regional 6 years | Passive | 22 weeks | Yes | Yes |
| Italy | Tuscany | Population | Regional 1 year | Passive | 20 weeks | Yes | Yes |
| Malta | Malta | Population | National 1 year | Active | 22 weeks or >500 g | No | Limited |
| Mexico | Nuevo Leon | Population | Regional 6 Days | Active | 20 weeks | No | Yes |
| Mexico | RYVEMCE | Hospital | Regional 3 days | Active | 20 weeks or >500 g | No | In a small number of institutions but not nationally |
| Netherlands | Eurocat Northern Netherlands | Population | Regional 10 years | Active | 24 weeks | Yes | Yes, since 2007 |
| South America | ECLAMC | Hospital | Regional Hospital discharge | Passive | >500 g | Yes | Yes |
| Slovak Republic | Population | National Hospital discharge | Passive | >500 g | Yes | Yes | |
| Sweden | Sweden | Population | National Until 1986:1 month, since 1987:1 year | Passive | Until 2006:28 weeks, since 2007:22 weeks | Yes, since 1999 | Yes, since early 1980’s |
| UK | Wales | Population | Regional 18 years | Active | 24 weeks | Yes | Yes, since 2003 |
| Ukraine | OMNI-Net BD program | Population | Regional Until 2002:7 days, 2003– 2007:28 days, since 2008–1 year. | Active | Until 2006:28 weeks or >1,000 g; since 2007:22 weeks or >500 g. | Yes | Yes |
| USA | Arkansas | Population | State 2 years | Active | 20 weeks | Yes, up to 20 weeks | Yes |
| USA | Atlanta | Population | Regional 6 years | Active | 20 weeks | Yes | Yes |
| USA | Utah | Population | State 2 years | Active | 20 weeks | Yes | Yes |
Abbreviations: ECEMC, Registry of the Spanish Collaborative Study of Congenital Malformations; ECLAMC, Latin American Collaborative Study of Congenital Malformations; ETOPFA, Early termination of pregnancy for fetal anomaly; ICBDSR, International Clearing House for Birth defects Surveillance and Research; RENAC, National Network of Congenital Anomalies of Argentina; RYVEMCE, Mexican Registry and Epidemiological Surveillance of External Congenital Malformations; SMC, Soroka Medical Center; UK, United Kingdom; USA, United States of America.
Defined using CDC birth defects surveillance toolkit: https://www.cdc.gov/ncbddd/birthdefects/surveillancemanual/facilitators-guide/module-3/mod3-3.html.
TABLE 2.
Description of the follow-up method for live births from ICBDSR programs contributing to this study.
| Country | Birth surveillance program | Until discharge from the maternity hospital | By clinician or program staff | Linkage with death certificates |
|---|---|---|---|---|
| Argentina | RENAC | Yes | Yes | No |
| Colombia | Cali | Yes | Yes | No |
| Czech Republic | Czech | No | No | Yes |
| Spain | ECEMC hospitals not reporting ETOPFA | Yes | Yes | No |
| Spain | ECEMC hospitals reporting ETOPFA | Yes | Yes | No |
| France | Paris | Yes | Yes | No |
| Germany | Saxony-Anhalt | Yes | Yes | No |
| Iran | Tabriz Registry of Congenital Anomalies (TRoCA) | Yes | Yes | No |
| Israel | Israel | Yes | Yes | Yes |
| Italy | Lombardy | no | yes | Yes, 2003 up to 2021 |
| Italy | Tuscany | No | No | Yes, 1992 up to 2015 |
| Malta | Malta Congenital Anomalies Registry (MCAR) | No | Hospital files followed up until 1 year of age | Yes |
| Mexico | Nuevo Leon | Yes | Yes | Yes |
| Mexico | RYVEMCE | Yes | Only until discharge from maternity hospital | No |
| Netherlands | Eurocat Northern Netherlands | Yes | Yes | No |
| South America | ECLAMC | Yes | Yes | No |
| Slovak Republic | Yes | Only until discharge from the maternity hospital | No | |
| Sweden | Sweden | No | No | No |
| UK | Wales | Yes | Only until discharge from maternity hospital | Yes, up to 18 years |
| Ukraine | OMNI-Net BD program | Yes | Yes | No |
| USA | Arkansas | Yes | Only until discharge from maternity hospital | Yes, 1993 up to 2015 |
| USA | Atlanta | Yes | Only until discharge from maternity hospital with abstract of visits to children’s hospitals until age 6. | Yes, 1979 up to 2008 |
| USA | Utah | Yes | Only until discharge from maternity hospital | Yes, until age 2 |
Abbreviations: ECEMC, Registry of the Spanish Collaborative Study of Congenital Malformations; ECLAMC, Latin American Collaborative Study of Congenital Malformations; ETOPFA, early termination of pregnancy for fetal anomaly; ICBDSR, International Clearing House for Birth defects Surveillance and Research; RENAC, National Network of Congenital Anomalies of Argentina; RYVEMCE, Mexican Registry and Epidemiological Surveillance of External Congenital Malformations; SMC, Soroka Medical Center; UK, United Kingdom; USA, United States of America.
Table 3 presents descriptive statistics including pregnancy outcomes for each of the included programs (total number of births, total number of CLP cases, prevalence per 10,000 births, percentage of LB among CLP cases, percentage of SB among CLP cases, and percentage of ETOPFA among CLP cases) for the observation period 1974–2014. Tables 4, 5, and 6 present similar descriptive statistics for programs that provided data for each of the subclassifications of CLP described in the methods.
TABLE 3.
Total CLP by birth outcome during 1974–2014 from reporting ICBDSR programs. Presented in order of prevalence.
| Country | Birth surveillance program | Population or hospital- based program | Observation period |
Total birthsa |
Total CLP cases |
Total CLP prevalence per 10,000 births | Total CLP Live birth % | Total CLP stillbirth % | Total CLP ETOPFA (%) |
|---|---|---|---|---|---|---|---|---|---|
| Mexico | RYVEMCE | Hospital | 1978–2013 | 1,198,579 | 1,243 | 10.37 | 90.43 | 9.57 | 0 |
| Germany | Saxony-Anhalt | Population | 1980–2014 | 526,289 | 531 | 10.09 | 83.43 | 6.97 | 9.6 |
| South America | ECLAMC | Hospital | 1995–2014 | 2,927,555 | 2,862 | 9.78 | 90.64 | 9.36 | 0 |
| Iran | Tabriz Registry of Congenital Anomalies (TRoCA) | Hospital | 2004–2012 | 160,755 | 157 | 9.77 | 99.36 | 0.64 | 0 |
| Argentina | RENAC | Hospital | 2009–2014 | 1,023,108 | 983 | 9.61 | 97.15 | 2.85 | No datab |
| Netherlands | Eurocat Northern Netherlands | Population | 1981–2014 | 562,462 | 496 | 8.82 | 93.95 | 2.62 | 3.43 |
| USA | Utah | Population | 1995–2012 | 889,634 | 771 | 8.67 | 90.66 | 3.37 | 5.97 |
| Sweden | Sweden | Population | 1974–2014 | 4,195,523 | 3,113 | 7.42 | 95.47 | 0.93 | 3.6 |
| UK | Wales | Population | 1998–2014 | 569,341 | 419 | 7.36 | 80.19 | 0.95 | 18.38 |
| USA | Arkansas | Population | 1993–2012 | 760,777 | 525 | 6.9 | 94.86 | 3.62 | 0.95 |
| Slovak Republic | Population | 2001–2013 | 722,978 | 459 | 6.35 | 97.39 | 0.87 | 1.09 | |
| USA | Atlanta | Population | 1994–2008 | 737,250 | 458 | 6.21 | 85.59 | 5.02 | 8.52 |
| Ukraine | OMNI-Net BD program | Population | 2000–2013 | 404,172 | 235 | 5.81 | 81.28 | 2.13 | 14.47 |
| Malta | Malta Congenital Anomalies Registry (MCAR) | Population | 1995–2013 | 79,948 | 42 | 5.25 | 80.95 | 19.05 | 0 |
| France | Paris | Population | 1981–2014 | 875,241 | 436 | 4.98 | 70.64 | 5.28 | 24.08 |
| Italy | Lombardy | Population | 2003–2012 | 133,182 | 65 | 4.88 | 80 | 3.08 | 16.92 |
| Spain | ECEMC hospitals reporting ETOPFA | Hospital | 1995–2013 | 373,698 | 155 | 4.15 | 65.16 | 1.29 | 33.55 |
| Colombia | Cali | Hospital | 2011–2014 | 27,294 | 11 | 4.03 | 100 | 0 | 0 |
| Italy | Tuscany | Population | 1992–2014 | 636,562 | 225 | 3.53 | 81.78 | 2.22 | 16 |
| Czech Republic | Czech | Population | 1980–2014 | 4,034,194 | 1,244 | 3.08 | 88.1 | 0.48 | 11.41 |
| Spain | ECEMC hospitals not reporting ETPOFA | Hospital | 1986–2013 | 2,135,249 | 575 | 2.69 | 96.87 | 3.13 | No datab |
| Israel | Hospital | 2000–2014 | 200,660 | 54 | 2.69 | 100 | 0 | 0 | |
| Mexico | Nuevo Leon | Population | 2011–2014 | 348,580 | 44 | 1.26 | 100 | 0 | 0 |
Abbreviations: ECEMC, Registry of the Spanish Collaborative Study of Congenital Malformations; ECLAMC, Latin American Collaborative Study of Congenital Malformations; ETOPFA, early termination of pregnancy for fetal anomaly; ICBDSR, International Clearing House for Birth defects Surveillance and Research; RENAC, National Network of Congenital Anomalies of Argentina; RYVEMCE, Mexican Registry and Epidemiological Surveillance of External Congenital Malformations; SMC, Soroka Medical Center; UK, United Kingdom; USA, United States of America.
Live births and still births.
No data for this measure were confirmed by the registry.
TABLE 4.
Isolated CLP by birth outcome during 1974–2014 from reporting ICBDSR programs. Presented in order of prevalence.
| Country | Birth surveillance program | Population or hospital-based program | Observation period |
Total Birthsa |
Isolated CLP cases | Isolated CLP prevalence per 10,000 births | Isolated CLP Live birth % | Isolated CLP Stillbirth % | Isolated CLP ETOPFA(%) |
|---|---|---|---|---|---|---|---|---|---|
| Mexico | RYVEMCE | Hospital | 1978–2013 | 1,198,579 | 912 | 7.61 | 96.27 | 3.73 | 0 |
| Germany | Saxony-Anhalt | Population | 1980–2014 | 526,289 | 393 | 7.47 | 94.4 | 4.58 | 1.02 |
| Netherlands | Eurocat Northern Netherlands | Population | 1981–2014 | 562,462 | 398 | 7.08 | 98.24 | 1.26 | 0.5 |
| Argentina | RENAC | Hospital | 2009–2014 | 1,023,108 | 701 | 6.85 | 99.29 | 0.71 | No datab |
| USA | Utah | Population | 1995–2012 | 889,634 | 534 | 6 | 95.69 | 1.5 | 2.81 |
| South America | ECLAMC | Hospital | 1995–2014 | 2,927,555 | 1727 | 5.9 | 96.87 | 3.13 | 0 |
| Sweden | Sweden | Population | 1974–2014 | 4,195,523 | 2,461 | 5.87 | 99.02 | 0.57 | 0.41 |
| Slovak Republic | Population | 2001–2013 | 722,978 | 351 | 4.85 | 99.15 | 0.85 | 0 | |
| UK | Wales | Population | 1998–2014 | 569,341 | 257 | 4.51 | 98.44 | 0 | 1.56 |
| Ukraine | OMNI-Net BD Program | Population | 2000–2013 | 404,172 | 170 | 4.21 | 91.76 | 0.59 | 6.47 |
| Colombia | Cali | Hospital | 2011–2014 | 27,294 | 11 | 4.03 | 100 | 0 | 0 |
| France | Paris | Population | 1981–2014 | 875,241 | 267 | 3.05 | 95.13 | 1.5 | 3.37 |
| Italy | Lombardy | Population | 2003–2012 | 133,182 | 38 | 2.85 | 97.37 | 2.63 | 0 |
| Malta | MCAR | Population | 1995–2013 | 79,948 | 20 | 2.5 | 100 | 0 | 0 |
| Israel | Hospital | 2000–2014 | 200,660 | 45 | 2.24 | 100 | 0 | 0 | |
| Spain | ECEMC hospitals reporting ETOPFA | Hospital | 1995–2013 | 373,698 | 83 | 2.22 | 92.77 | 0 | 7.23 |
| Spain | ECEMC hospitals not reporting ETOPFA | Hospital | 1986–2013 | 2,135,249 | 393 | 1.84 | 98.73 | 1.27 | No datab |
Abbreviations: ECEMC, Registry of the Spanish Collaborative Study of Congenital Malformations; ECLAMC, Latin American Collaborative Study of Congenital Malformations; ETOPFA, early termination of pregnancy for fetal anomaly; ICBDSR, International Clearing House for Birth defects Surveillance and Research; RENAC, National Network of Congenital Anomalies of Argentina; RYVEMCE, Mexican Registry and Epidemiological Surveillance of External Congenital Malformations; SMC, Soroka Medical Center; UK, United Kingdom; USA, United States of America.
Live births and still births.
No data for this measure were confirmed by the registry.
TABLE 5.
CLP cases associated with multiple congenital anomalies by birth outcome during 1974–2014 from reporting ICBDSR programs. Presented in order of prevalence.
| Country | Birth surveillance program |
Population or hospital-based program | Observation period |
Total Birthsa |
CLP with multiple congenital anomalies cases | CLP with multiple congenital anomalies prevalence per 10,000 births | CLP with multiple congenital anomalies Live birth % | CLP with multiple congenital anomalies Stillbirth % | CLP with multiple congenital anomalies ETOPFA(%) |
|---|---|---|---|---|---|---|---|---|---|
| South America | ECLAMC | Hospital | 1995–2014 | 2,927,555 | 1,135 | 3.88 | 81.15 | 18.85 | 0 |
| Argentina | RENAC | Hospital | 2009–2014 | 1,023,108 | 251 | 2.45 | 92.43 | 7.57 | No datab |
| Italy | Lombardy | Population | 2003–2012 | 133,182 | 27 | 2.03 | 55.56 | 3.7 | 40.74 |
| Germany | Saxony-Anhalt | Population | 1980–2014 | 526,289 | 93 | 1.77 | 60.22 | 13.98 | 25.81 |
| Malta | MCAR | Population | 1995–2013 | 79,948 | 14 | 1.75 | 78.57 | 21.43 | 0 |
| Mexico | RYVEMCE | Hospital | 1978–2013 | 1,198,579 | 194 | 1.62 | 72.68 | 27.32 | 0 |
| UK | Wales | Population | 1998–2014 | 569,341 | 90 | 1.58 | 61.11 | 4.44 | 34.44 |
| USA | Utah | Population | 1995–2012 | 889,634 | 132 | 1.48 | 87.88 | 3.79 | 8.33 |
| Slovak Republic | Population | 2001–2013 | 722,978 | 95 | 1.31 | 94.74 | 1.05 | 4.21 | |
| Spain | ECEMC hospitals reporting ETOPFA | Hospital | 1995–2013 | 373,698 | 44 | 1.18 | 45.45 | 2.27 | 52.27 |
| Ukraine | OMNI-Net BD Program | Population | 2000–2013 | 404,172 | 47 | 1.16 | 51.06 | 4.26 | 40.43 |
| France | Paris | Population | 1981–2014 | 875,241 | 92 | 1.05 | 40.22 | 16.3 | 43.48 |
| Sweden | Sweden | Population | 1974–2014 | 4,195,523 | 387 | 0.92 | 85.53 | 2.33 | 12.14 |
| Netherlands | Eurocat Northern Netherlands | Population | 1981–2014 | 562,462 | 40 | 0.71 | 87.5 | 10 | 2.5 |
| Spain | ECEMC hospitals not reporting ETOPFA | Hospital | 1986–2013 | 2,135,249 | 118 | 0.55 | 93.22 | 6.78 | No datab |
| Israel | Hospital | 2000–2014 | 200,660 | 9 | 0.45 | 100 | 0 | 0 |
Abbreviations: ECEMC, Registry of the Spanish Collaborative Study of Congenital Malformations; ECLAMC, Latin American Collaborative Study of Congenital Malformations; ETOPFA, early termination of pregnancy for fetal anomaly; ICBDSR, International Clearing House for Birth defects Surveillance and Research; RENAC, National Network of Congenital Anomalies of Argentina; RYVEMCE, Mexican Registry and Epidemiological Surveillance of External Congenital Malformations; SMC, Soroka Medical Center; UK, United Kingdom; USA, United States of America.
Live births and still births.
No data for this measure were confirmed by the registry.
TABLE 6.
Cases CLP with genetic or chromosomal syndromes by birth outcome during 1974–2014 from reporting ICBDSR programs. Presented in order of prevalence.
| Country | Birth surveillance program |
Population or hospital- based program | Observation period |
Total birthsa |
CLP with genetic or chromosomal syndrome cases | CLP with genetic or chromosomal syndrome prevalence per 10,000 births | CLP with genetic or chromosomal syndrome Live birth % | CLP wdth genetic or chromosomal syndrome Stillbirth % | CLP wdth genetic or chromosomal syndrome ETOPFA(%) |
|---|---|---|---|---|---|---|---|---|---|
| UK | Wales | Population | 1998–2014 | 569,341 | 70 | 1.23 | 40 | 0 | 60 |
| USA | Utah | Population | 1995–2012 | 889,634 | 105 | 1.18 | 68.57 | 12.38 | 19.05 |
| Mexico | RYVEMCE | Hospital | 1978–2013 | 1,198,579 | 137 | 1.14 | 76.64 | 23.36 | 0 |
| Netherlands | Eurocat Northern Netherlands | Population | 1981–2014 | 562,462 | 58 | 1.03 | 68.97 | 6.9 | 24.14 |
| Malta | Population | 1995–2013 | 79,948 | 8 | 1.00 | 37.5 | 62.5 | 0 | |
| France | Paris | Population | 1981–2014 | 875,241 | 77 | 0.88 | 22.08 | 5.19 | 72.73 |
| Germany | Saxony-Anhalt | Population | 1980–2014 | 526,289 | 45 | 0.86 | 35.56 | 13.33 | 51.11 |
| Spain | ECEMC hospitals reporting ETOPFA | Hospital | 1995–2013 | 373,698 | 28 | 0.75 | 14.29 | 3.57 | 82.14 |
| Sweden | Sweden | Population | 1974–2014 | 4,195,523 | 265 | 0.63 | 76.98 | 2.26 | 20.75 |
| Italy | Lombardy | Population | 2003–2012 | 133,182 | 7 | 0.53 | 14.29 | 14.29 | 71.43 |
| Ukraine | OMNI-Net BD Program | Population | 2000–2013 | 404,172 | 18 | 0.45 | 61.11 | 11.11 | 22.22 |
| Argentina | RENAC | Hospital | 2009–2014 | 1,023,108 | 31 | 0.3 | 87.1 | 12.9 | No datab |
| Spain | ECEMC hospitals not reporting ETOPFA | Hospital | 1986–2013 | 2,135,249 | 64 | 0.3 | 92.19 | 7.81 | No datab |
| Slovak Republic | Population | 2001–2013 | 722,978 | 14 | 0.19 | 92.86 | 0 | 7.14 | |
| Czech Republic | Czech | Population | 1980–2014 | 4,034,194 | 49 | 0.12 | 67.35 | 0 | 32.65 |
Abbreviations: ECEMC, Registry of the Spanish Collaborative Study of Congenital Malformations; ECLAMC, Latin American Collaborative Study of Congenital Malformations; ETOPFA, early termination of pregnancy for fetal anomaly; ICBDSR, International Clearing House for Birth defects Surveillance and Research; RENAC, National Network of Congenital Anomalies of Argentina; RYVEMCE, Mexican Registry and Epidemiological Surveillance of External Congenital Malformations; SMC, Soroka Medical Center; UK, United Kingdom; USA, United States of America.
Live births and still births.
No data for this measure were confirmed by the registry.
The prevalence of total CLP for each of the included programs ranged from 1.3 per 10,000 births (Mexico Neuvo Leon) to 10.4 per 10,000 births (Mexico RYVEMCE) and is presented in Figure 1. The pooled average for total CLP prevalence from all programs across the observation period was 6.4 per 10,000 births.
FIGURE 1.
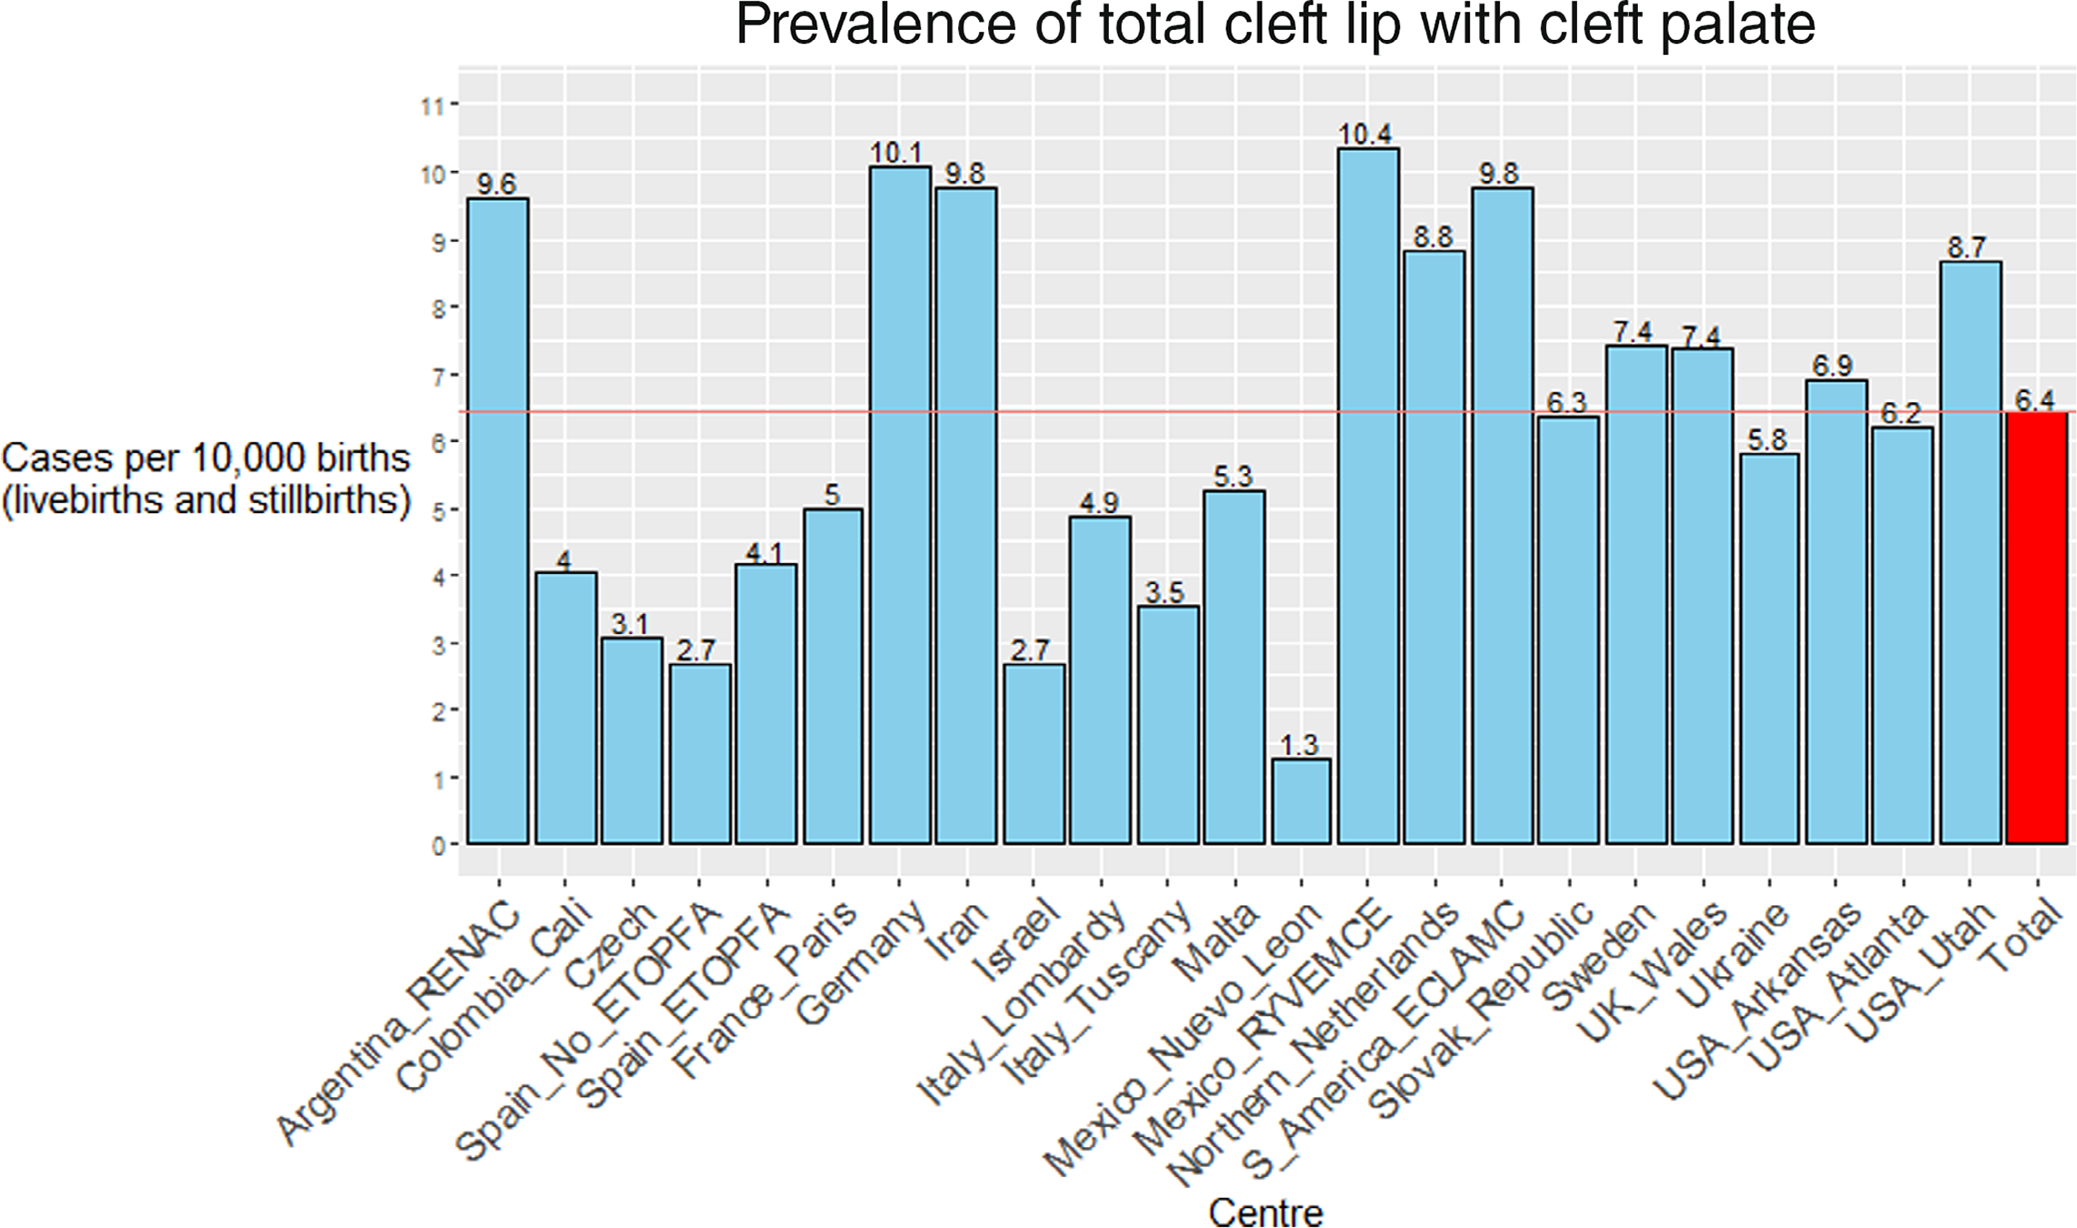
Pooled prevalence per 10,000 births of total cleft lip with the cleft palate for each participating ICBDSR program for the period 1974–2014.
The mean prevalence of total CLP varied each year with a maximum of 11 per 10,000 births (live and still births) reported in 1979 followed by a range between 4.5 per 10,000 births (live and still births) to 8.5 per 10,000 births (live and still births). There is significant spread of data around the mean, illustrated in Figure 2.
FIGURE 2.

Prevalence by year of undifferentiated cleft lip with the cleft palate.
The survival rates of LB varied across programs. A description of the percentage of LB surviving at timepoints varying from 1 day through 5 years for total CLP followed by each of the subclassifications is presented in Table 7. Overall survival is also presented for each program. The pooled average of surviving LB for total CLP was 91% when considering all-cause mortality. The pooled average for isolated CLP was 97.7%. For CLP associated with multiple congenital anomalies, the average surviving LB once all-cause mortality was considered was 77.1%, and for CLP associated with genetic or chromosomal syndromes was 40.9%.
TABLE 7.
Percentage of live births surviving at various timepoints from day 1 to 5 years including overall survival. Data are presented for total CLP for all 22 reporting ICBDSR programs and data for subclassifications where available.
| Percentage surviving |
||||||||||
|---|---|---|---|---|---|---|---|---|---|---|
| Sub-classification | Region | Center | Live births Count | Day <1 |
Days 1–6 |
Days 7–27 | 28 Days–11 Months | Years 1–4 | 5 years + | Overall survival |
| Total | Spain | ECEMC hospitals reporting ETOPFA | 101 | 99 | 99 | 99 | 99 | 99 | 99 | 99 |
| Iran | 156 | 98.7 | 98.1 | 98.1 | 98.1 | 98.1 | 98.1 | 98.1 | ||
| Germany | Saxony-Anhalt | 443 | 99.1 | 98 | 97.1 | 96.2 | 96.2 | 96.2 | 96.2 | |
| Italy | Lombardy | 52 | 100 | 100 | 100 | 96.2 | 96.2 | 96.2 | 96.2 | |
| UK | Wales | 336 | 99.4 | 97 | 96.1 | 95.8 | 95.8 | 95.5 | 95.5 | |
| Italy | Tuscany | 184 | 98.4 | 96.7 | 96.7 | 95.1 | 95.1 | 95.1 | 95.1 | |
| Slovak | 447 | 100 | 95.3 | Not | Not recorded | Not | Not | 94.6 | ||
| Republic | recorded | recorded | recorded | |||||||
| France | Paris | 308 | 96.8 | 95.8 | 94.5 | Not recorded | Not | Not | 94.2 | |
| recorded | recorded | |||||||||
| Spain | ECEMC hospitals not reporting ETOPFA | 557 | 95.5 | 93.7 | 93.7 | 93.7 | 93.7 | 93.7 | 93.7 | |
| Czech | 1,096 | 99.4 | 97.9 | 97.4 | 94.5 | 93.8 | 93.2 | 93.2 | ||
| Republic | ||||||||||
| Netherlands | EUROCAT Northern Netherlands | 466 | 98.7 | 97.4 | 95.7 | 93.8 | 92.9 | 92.7 | 92.7 | |
| Ukraine | OMNI-Net BD Program | 191 | 99.5 | 96.3 | 94.2 | 92.7 | 91.6 | 91.6 | 91.6 | |
| Mexico | RYVEMCE | 1,124 | 94 | 91.4 | 91.4 | 91.4 | 91.4 | 91.4 | 91.1 | |
| Sweden | 2,972 | 98.4 | 96.4 | 95.2 | 92.8 | 92.1 | 90.9 | 90.9 | ||
| Colombia | Cali | 11 | 100 | 100 | 100 | 90.9 | 90.9 | 90.9 | 90.9 | |
| USA | Arkansas | 498 | 97.4 | 94.6 | 92.6 | 90 | 89.2 | 89 | 89 | |
| USA | Atlanta | 392 | 96.7 | 92.9 | 89.8 | 87.8 | 87.5 | 87.2 | 87.2 | |
| USA | Utah | 699 | 95 | 91.6 | 90.1 | 87.6 | 86.7 | 86.4 | 86.4 | |
| Argentina | RENAC | 955 | 100 | 86.3 | 86.3 | 86.3 | 86.3 | 86.3 | 86.3 | |
| Malta | 34 | 100 | 94.1 | 91.2 | 85.3 | 85.3 | 85.3 | 85.3 | ||
| S-America | ECLAMC | 2,594 | 90.4 | 86 | 83.2 | 82.8 | 82.8 | 82.8 | 82 | |
| Mexico | Nuevo Léon | 44 | 97.7 | 93.2 | 86.4 | 81.8 | 81.8 | 81.8 | 81.8 | |
| Israel | 54 | 100 | 94.4 | 92.6 | 83.3 | 83.3 | 81.5 | 81.5 | ||
| Total averages | 98 | 95 | 93.8 | 91.5 | 91.3 | 91.1 | 91 | |||
| Isolated | Spain_ | ECEMC reporting ETOPFA | 77 | 100 | 100 | 100 | 100 | 100 | 100 | 100 |
| Italy | Lombardy | 37 | 100 | 100 | 100 | 100 | 100 | 100 | 100 | |
| Malta | 20 | 100 | 100 | 100 | 100 | 100 | 100 | 100 | ||
| Germany | Saxony-Anhalt | 371 | 100 | 99.7 | 99.7 | 99.7 | 99.7 | 99.7 | 99.7 | |
| France | Paris | 254 | 99.6 | 99.6 | 99.6 | Not recorded | Not recorded |
Not recorded |
99.6 | |
| UK | Wales | 253 | 100 | 99.6 | 99.6 | 99.6 | 99.6 | 99.6 | 99.6 | |
| Spain_ | ECEMC hospitals not reporting ETOPFA | 388 | 99.5 | 99.5 | 99.5 | 99.5 | 99.5 | 99.5 | 99.5 | |
| Slovak Republic |
348 | 100 | 99.1 | Not recorded |
Not recorded | Not recorded |
Not recorded |
99.1 | ||
| Ukraine | OMNI-Net BD Program | 156 | 100 | 100 | 99.4 | 98.7 | 98.7 | 98.7 | 98.7 | |
| Netherlands | EUROCAT Northern Netherlands | 391 | 99.7 | 99.2 | 99 | 98.7 | 98.5 | 98.5 | 98.5 | |
| Sweden | 2,437 | 99.8 | 99.5 | 99.3 | 98.7 | 98.6 | 97.6 | 97.6 | ||
| USA | Utah | 511 | 99.6 | 98.6 | 98.6 | 97.7 | 97.5 | 97.5 | 97.5 | |
| Mexico | RYVEMCE | 878 | 98.1 | 97.4 | 97.4 | 97.4 | 97.4 | 97.4 | 97.2 | |
| Argentina | RENAC | 696 | 100 | 97.1 | 97.1 | 97.1 | 97.1 | 97.1 | 97.1 | |
| S-America | ECLAMC | 1,673 | 98.7 | 97.8 | 97 | 97 | 97 | 97 | 96.9 | |
| Colombia | Cali | 11 | 100 | 100 | 100 | 90.9 | 90.9 | 90.9 | 90.9 | |
| Israel | 45 | 100 | 93.3 | 91.1 | 88.9 | 88.9 | 88.9 | 88.9 | ||
| Isolated averages | 99.7 | 98.9 | 98.6 | 97.8 | 97.8 | 97.7 | 97.7 | |||
| Multiple Congenital Anomalies | Spain | ECEMC hospitals reporting ETOPFA | 20 | 100 | 100 | 100 | 100 | 100 | 100 | 100 |
| UK | Wales | 55 | 100 | 90.9 | 90.9 | 89.1 | 89.1 | 89.1 | 89.1 | |
| Germany | Saxony-Anhalt | 56 | 96.4 | 94.6 | 91.1 | 87.5 | 87.5 | 87.5 | 87.5 | |
| Italy | Lombardy | 15 | 100 | 100 | 100 | 86.7 | 86.7 | 86.7 | 86.7 | |
| Spain | ECEMC not reporting ETOPFA | 110 | 89.1 | 84.5 | 84.5 | 84.5 | 84.5 | 84.5 | 84.5 | |
| Slovak Republic |
90 | 100 | 85.6 | Not recorded |
Not recorded | Not recorded |
Not recorded |
84.4 | ||
| France | Paris | 37 | 89.2 | 86.5 | 86.5 | Not recorded | Not recorded |
Not recorded |
83.8 | |
| Malta | 11 | 100 | 90.9 | 81.8 | 81.8 | 81.8 | 81.8 | 81.8 | ||
| Netherlands | EUROCAT Northern Netherlands | 35 | 94.3 | 94.3 | 85.7 | 80 | 80 | 80 | 80 | |
| Ukraine | OMNI-Net BD Program | 24 | 100 | 83.3 | 79.2 | 79.2 | 79.2 | 79.2 | 79.2 | |
| USA | Utah | 116 | 89.7 | 85.3 | 82.8 | 77.6 | 75 | 75 | 75 | |
| Mexico | RYVEMCE | 141 | 81.6 | 72.3 | 72.3 | 72.3 | 72.3 | 72.3 | 71.6 | |
| Sweden | 331 | 94 | 89.1 | 84 | 76.4 | 73.7 | 71.6 | 71.6 | ||
| Argentina | RENAC | 232 | 100 | 59.1 | 59.1 | 59.1 | 59.1 | 59.1 | 59.1 | |
| S-America | ECLAMC | 921 | 75.5 | 64.6 | 58.1 | 57.1 | 57.1 | 57.1 | 54.8 | |
| Israel | 9 | 100 | 100 | 100 | 55.6 | 55.6 | 44.4 | 44.4 | ||
| MCA averages | 94.35 | 86.32 | 83.84 | 78.68 | 78.35 | 77.52 | 77.1 | |||
| Genetic / Chromosomal | Spain | ECEMC hospitals reporting ETOPFA | 4 | 75 | 75 | 75 | 75 | 75 | 75 | 75 |
| UK | Wales | 28 | 92.86 | 85.71 | 75 | 75 | 75 | 75 | 75 | |
| Spain_ | ECEMC hospitals not reporting ETOPFA | 59 | 81.36 | 72.88 | 72.88 | 72.88 | 72.88 | 72.88 | 72.88 | |
| Mexico | RYVEMCE | 105 | 76.19 | 66.67 | 66.67 | 66.67 | 66.67 | 66.67 | 66.67 | |
| Netherlands | EUROCAT Northern Netherlands | 40 | 92.5 | 82.5 | 72.5 | 57.5 | 50 | 47.5 | 47.5 | |
| Slovak Republic |
13 | 100 | 61.54 | Not recorded |
Not recorded | Not recorded |
Not recorded |
46.15 | ||
| Germany | Saxony-Anhalt | 16 | 87.5 | 68.75 | 56.25 | 43.75 | 43.75 | 43.75 | 43.75 | |
| Sweden | 204 | 89.22 | 71.57 | 65.2 | 49.02 | 44.61 | 42.16 | 42.16 | ||
| Argentina | RENAC | 27 | 100 | 40.74 | 40.74 | 40.74 | 40.74 | 40.74 | 40.74 | |
| France | Paris | 17 | 70.59 | 58.82 | 35.29 | Not recorded | Not recorded |
Not recorded |
35.29 | |
| USA | Utah | 72 | 70.83 | 51.39 | 41.67 | 31.94 | 29.17 | 26.39 | 26.39 | |
| Czech Republic |
33 | 93.94 | 72.73 | 66.67 | 39.39 | 33.33 | 24.24 | 24.24 | ||
| Ukraine | OMNI-Net BD Program | 11 | 90.91 | 72.73 | 54.55 | 36.36 | 18.18 | 18.18 | 18.18 | |
| Italy | Lombardy | 1 | 100 | 100 | 100 | 0 | 0 | 0 | 0 | |
| Malta | 3 | 100 | 66.67 | 66.67 | 0 | 0 | 0 | 0 | ||
| Genetic/chromosomal averages | 88.1 | 69.8 | 63.4 | 45.7 | 43.1 | 42 | 40.9 | |||
Note: Not all registries reported all deaths at all timepoints, data in this table reports deaths where data was returned. Where data were confirmed as not reported by a registry this have been presented in the table and the overall survival covers only the time period for which data were returned.
Abbreviations: CLP, Cleft lip with palate; ECEMC, Registry of the Spanish Collaborative Study of Congenital Malformations; ECLAMC, Latin American Collaborative Study of Congenital Malformations; ETOPFA, early termination of pregnancy for fetal anomaly; ICBDSR, International Clearing House for Birth defects Surveillance and Research; MCA, Multiple Congenital Anomalies; RENAC, National Network of Congenital Anomalies of Argentina; RYVEMCE, Mexican Registry and Epidemiological Surveillance of External Congenital Malformations; SMC, Soroka Medical Center; UK, United Kingdom; USA, United States of America.
4 |. DISCUSSION
Strengths and limitations of this study are discussed throughout this section. The prevalence of total CLP varied substantially across programs ranging from 1.26 to 10.37 per 10,000 births for the observation period. Surveillance methods and ascertainment of the presence of clefts varied during the observation period and between programs. Important differences include hospital- versus population-based registries with hospital programs serving a select sample of a wider population. The geographical area covered by the program is also important to consider, as areas with a local registry may be skewed by local clusters, although this can be very useful when aiming to identify possible causes for perceived higher prevalence associated with a program that may be due to local environmental or genetic influences. Analyses in this study do not account for the heterogeneity between programs. The context of the country, culture, and health system where each registry is based should be taken into account when interpreting the data presented in this article. While these data may point to further questions related to causality, it is not possible to draw inferences on causality from these data. The data will provide utility to reporting programs to discuss and interpret locally.
The pooled birth prevalence presented for total CLP of 6.4 per 10,000 births is slightly lower than what would have been expected from the global literature. Mossey et al. presented a prevalence of 1 per 700 LB corresponding to 14.3 per 10,000 LB for all OFC and Massenburg present a prevalence of 141.56 per 100,000 of OFC in their study population corresponding to 14.1 per 10,000 LB (Massenburg et al., 2021; Mossey et al., 2009). In Europe, a reported prevalence of 14.26 OFC per 10,000 births is reported (European Commission, 2022). Considering that CLP makes up around 50% of the OFC cases, our prevalence estimate from these ICBDSR data is slightly lower than the average global CLP prevalence of around 7.0 per 10,000 (Fogh-Anderson, 1942; Mossey P.A., 2002). The study by the European Commission reported no significant findings in trends over time during a 26-year observation period (European Commission, 2022). Swanson described some of the issues associated with comparability across orofacial cleft epidemiology studies, including data availability and ascertainment (Swanson, 2021). The variability in case definition among published studies makes direct comparison difficult. A range of factors may contribute to the low prevalence reported in our study, such as the inclusion of SB in the denominator data, which may impact the prevalence calculation, variance in the ability of programs to ascertain all cases, and variance in the source used for denominator populations between hospital-based or regional programs.
The rate of ETOPFA for total CLP in most European programs was higher than other continents with notable exceptions such as Malta, where termination of pregnancy is not legal (including for anomalies that are fatal beyond the womb), and the reported rate of ETOPFA was 0% for that surveillance program. A 19% stillbirth rate for total CLP was reported for Malta; it is important to note that the SB were related to chromosomal syndromes and multiple congenital abnormality cases, and the total number of CLP cases for Malta was small, 42 cases, highlighting the need to apply caution when comparing programs. Previous reports of ETOPFA with CLP among European populations averaged 11.8% (Calzolari et al., 2002). A further program of note is Israel, where terminations or SB available but are not registered. For programs that provided data on the subclassifications, the percentage of ETOPFA for isolated CLP was low when compared to the other subclassifications for CLP associated with multiple congenital anomalies and CLP associated with genetic/chromosomal syndrome. This is a positive finding for isolated CLP as this birth anomaly can be surgically repaired resulting in effective cure for the majority of cases (Williams et al., 2001). Unfortunately, access to quality surgical care is not universal, as demonstrated by a 2015 Lancet Commission (Meara et al., 2015). The low rates of EOPTFA for isolated clefts are similar to that reported in other studies (Calzolari et al., 2002; Yazdy, Honein, & Xing, 2007).
Identification of variations in survival is an essential component of the Global Burden of Disease (GBD) project for monitoring progress in global health and alleviation by access to care (Horton, 2012). The variation in the overall survival of LB for total CLP presented in Table 7 shows a tendency for higher survival rates among programs in Europe but with some exceptions such as Malta (where termination of pregnancy is illegal) with an overall survival of 85% compared to the cohort average of 91%. The survival data for the subclassifications demonstrate clear differences among subclassifications with isolated CLP cases having the highest rates of survival. Issues surrounding infant mortality in the presence of birth defects are important in the context of primary prevention, and in the case of CLP, timely access to primary cleft repair results in survival rates equivalent to unaffected infants (Christensen, Juel, Herskind, & Murray, 2004; Cobourne & Sharpe, 2012). Christensen et al. demonstrated an increase in mortality among CLP cases compared to standardized rates in a Danish population (Christensen et al., 2004). Mossey and Modell (2002) have explored the influence of access to care on survival, finding that access to comprehensive (multidisciplinary) cleft care coincides with improved survival; most programs in this study are in countries providing comprehensive care (Cobourne & Sharpe, 2012). Furthermore, cleft lip repair has been suggested as a marker of the provision of essential pediatric care, particularly in low- and middle-income countries (Vanderburg et al., 2021). It is important to note the majority of programs (64%) included in this study are from countries that are classified as high-income by the World Bank. Further consideration of efforts to improve ascertainment and recording of CLP cases in low- and low-middle-income countries should be pursued.
As has been reported in other studies of this kind, some of the variation in findings may be due, in part, to variation in ascertainment, available diagnostics, and data quality issues associated with data submitted for this study; therefore, the results should be interpreted with caution reflecting on the limitations described above (Calzolari et al., 2002; Cobourne & Sharpe, 2012). A detailed diagnostic document has been produced exploring the source data used for this article (Revie, 2020). This presents a number of areas for improvement in data extraction and processes to standardize the approach within reporting programs internationally. It is also suggested to add certain information to the data collection that would aid in useful comparison data across programs and allow for further useful statistical analysis, for example, calculation of risk ratios for specific outcomes.
Following discussion and further consideration the authors propose a draft set of data quality indicators that may improve data quality in future studies of this kind (Figure 3). The indicators reflect some of the analytical and data management issues presented with this large and complex set of data. Factors are separated into “critical” and “less critical”. Critical missing data and evident calculation errors are given a heavier weighting, whereas empty cells in otherwise complete data sets receive a lower weighting. The draft quality indicators and the detailed diagnostic analysis document (not published) may form the basis for discussion and future work to improve the quality of the data extracted and reported from programs. A working group focused on standardizing data collection forms, guidance, and regular reporting mechanisms for CLP may prove beneficial enabling an improvement in the validity and reliability of similar data sets in the future.
FIGURE 3.

Quality indicators used by authors to assess data quality of data sets and inform inclusion criteria.
Adopting a health economics approach and incorporating this in future analysis of orofacial clefts and other congenital anomalies should be considered. Similar analysis that includes the suggestions above could be applied to other data sets held by ICBDSR, including the cleft palate with and without Robin sequence and cleft lip without the cleft palate.
5 |. CONCLUSION
Total CLP prevalence of 6.4 per 10,000 births as reported in this study is regarded as slightly lower than previous global estimates. There was variation across included programs for prevalence, pregnancy outcomes, and survival. The survival of LB with CLP was greatest among cases with isolated CLP (97.7%) and worst among CLP cases associated with genetic or chromosomal syndromes (40.9%). Data quality and heterogeneity among data sets have both been highlighted in this study, and efforts to improve data quality related to future CLP epidemiology studies deserve consideration.
ACKNOWLEDGMENTS
With many thanks to Simonetta Zezza, ICBDSR General Manager, for her help and administrative support when preparing this manuscript.
Footnotes
The findings and conclusions in this report are those of the authors and do not necessarily represent the official position of the Centers for Disease Control and Prevention.
Members of the ECEMC Peripheral Group listed in http://www.fundacion1000.es/Estructura-del-ECEMC for year 2022.
DATA AVAILABILITY STATEMENT
The data that support the findings of this study are available on request from the corresponding author. The data are not publicly available due to privacy or ethical restrictions.
REFERENCES
- Berkowitz S (2013). Cleft lip and palate: Diagnosis and management. (3 Aufl. ed.) Berlin: Springer-Verlag. [Google Scholar]
- Calzolari E, Rubies M, Neville AJ, & Bianchi F (2002). EUROCAT and orofacial clefts: The epidemiology of orofacial clefts in 30 european regions. Retrieved from Belfast: https://eu-rd-platform.jrc.ec.europa.eu/sites/default/files/eurocat-pub-docs/Special-Report-Orofacial-Clefts.pdf [Accessed on December 9, 2022].
- Christensen K, Juel K, Herskind AM, & Murray JC (2004). Long term follow up study of survival associated with cleft lip and palate at birth. BMJ, 328(7453), 1405. 10.1136/bmj.38106.559120.7C [DOI] [PMC free article] [PubMed] [Google Scholar]
- Cobourne MT, & Sharpe PT (2012). Cleft lip and palate: Epidemiology, aetiology and treatment (Vol. 16). Basel: S. Karger AG. [Google Scholar]
- European Commission. (2022). EUROCAT data prevalence charts and tables. Retrieved from https://eu-rd-platform.jrc.ec.europa.eu/eurocat/eurocat-data/prevalence_en [Accessed on December 9, 2022]. [Google Scholar]
- Fogh-Anderson P (1942). Inheritance of harelip and cleft palate. (PhD). Copenhagen. [Google Scholar]
- Horton R (2012). GBD 2010: Understanding disease, injury, and risk. The Lancet, 380(9859), 2053–2054. 10.1016/S0140-6736(12)62133-3 [DOI] [PubMed] [Google Scholar]
- ICBDSR. (n.d.). International clearinghouse for birth defects, surveillance and research. Retrieved from http://www.icbdsr.org/programme-description/ [Accessed on December 9, 2022].
- Kadir A, Mossey PA, Orth M, Blencowe H, Sowmiya M, Lawn JE, … Modell B (2017). Systematic review and meta-analysis of the birth prevalence of orofacial clefts in low- and middle-income countries. The Cleft Palate-Craniofacial Journal, 54(5), 571–581. 10.1597/15-221 [DOI] [PubMed] [Google Scholar]
- Mason CA, Kirby RS, Sever LE, & Langlois PH (2005). Prevalence is the preferred measure of frequency of birth defects. Birth Defects Research Part A: Clinical and Molecular Teratology, 73(10), 690–692. 10.1002/bdra.20211 [DOI] [PubMed] [Google Scholar]
- Massenburg BB, Hopper RA, Crowe CS, Morrison SD, Alonso N, Calis M, … Yuan J (2021). Global burden of orofacial clefts and the world surgical workforce. Plastic and Reconstructive Surgery, 148(4), 568e–580e. 10.1097/prs.0000000000008334 [DOI] [PubMed] [Google Scholar]
- Meara JG, Leather AJM, Hagander L, Alkire BC, Alonso N, Ameh EA, … Yip W (2015). Global surgery 2030: Evidence and solutions for achieving health, welfare, and economic development. The Lancet, 386(9993), 569–624. 10.1016/S0140-6736(15)60160-X [Accessed on December 9, 2022]. [DOI] [PubMed] [Google Scholar]
- Mossey PA, & Modell B (2002). Epidemiology of oral clefts: An international perspective. In DF W (Ed.), Cleft lip and palate: From origin to treatment (pp. 127–158). New York: Oxford University Press. [Google Scholar]
- Mossey PAP, Little JP, Munger RGP, Dixon MJP, & Shaw WCP (2009). Cleft lip and palate. The Lancet (British edition), 374(9703), 1773–1785. 10.1016/S0140-6736(09)60695-4 [DOI] [PubMed] [Google Scholar]
- R Core Team. (2021). R: A language and environment for statistical computing. Retrieved from https://www.R-project.org/ [Accessed on December 9, 2022].
- Revie G (2020). Cleft mortality project analysis report. Dundee: University of Dundee. [Google Scholar]
- Swanson JW (2021). Discussion: Global burden of orofacial clefts and the world surgical workforce. Plastic and Reconstructive Surgery, 148(4), 581e–582e. 10.1097/prs.0000000000008335 [DOI] [PubMed] [Google Scholar]
- Vanderburg R, Alonso N, Desai P, Donkor P, Mossey P, Stieber E, & Mehendale F, V. (2021). Age at primary cleft lip repair: A potential bellwether indicator for pediatric surgery. Plastic and Reconstructive Surgery—Global Open, 9(6), e3657 Retrieved from https://journals.lww.com/prsgo/Fulltext/2021/06000/Age_at_Primary_Cleft_Lip_Repair__A_Potential.44.aspx [Accessed on December 9, 2022] [DOI] [PMC free article] [PubMed] [Google Scholar]
- von Elm E, Altman DG, Egger M, Pocock SJ, Gøtzsche PC, & Vandenbroucke JP (2007). The strengthening the reporting of observational studies in epidemiology (STROBE) statement: Guidelines for reporting observational studies. Annals of Internal Medicine, 147(8), 573–577. 10.7326/0003-4,819-147-8-200,710,160-00010 [DOI] [PubMed] [Google Scholar]
- Williams AC, Bearn D, Mildinhall S, Murphy T, Sell D, Shaw WC, … Sandy JR (2001). Cleft lip and palate care in the united kingdom—The clinical standards advisory group (CSAG) study. Part 2: Dentofacial outcomes and patient satisfaction. The Cleft Palate-Craniofacial Journal, 38(1), 24–29. 10.1597/1545-1569_2001_038_0024_clapci_2.0.co_2 [DOI] [PubMed] [Google Scholar]
- Yazdy MM, Honein MA, & Xing J (2007). Reduction in orofacial clefts following folic acid fortification of the U.S. grain supply. Birth Defects Research Part A: Clinical and Molecular Teratology, 79(1), 16–23. 10.1002/bdra.20319 [DOI] [PubMed] [Google Scholar]
Associated Data
This section collects any data citations, data availability statements, or supplementary materials included in this article.
Data Availability Statement
The data that support the findings of this study are available on request from the corresponding author. The data are not publicly available due to privacy or ethical restrictions.