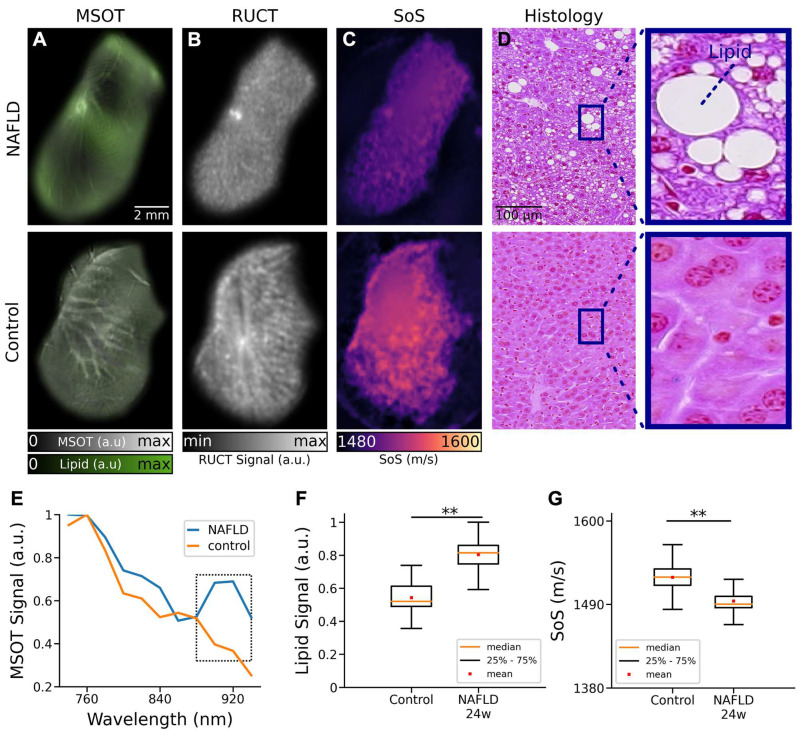
Figure 2.
TROPUS imaging of liver tissues excised from NAFLD and control mice. (A) Un-mixed lipid distribution (green color) overlaid onto the anatomical MSOT images corresponding to averaged signals over all the acquired wavelengths for excised livers from mouse with NAFLD and control mouse. (B) RUCT images of excised livers from mouse with NAFLD and control mouse. (C) SoS images of excised livers from mouse with NAFLD and control mouse. (D) Hematoxylin and Eosin (H&E) staining histological images of excised livers from a mouse with NAFLD and a control mouse used for qualitative validation of fat accumulation in liver tissues. (E) MSOT signal spectra of liver tissue shown in the panels a. (F) Average lipid signal intensities from 3 NAFLD and 3 control mice. (G) Average SoS values from 3 NAFLD and 3 control mice. MSOT: multispectral optoacoustic tomography; NAFLD 24w: non-alcoholic fatty liver disease induced mice at 24 weeks of age; RUCT: reflection ultrasound computed tomography; SoS: speed of sound; (p values are indicated by * ≤ 0.05, ** ≤ 0.01 and *** ≤ 0.001, **** ≤ 0.0001).

