

Abstract
Desmin is the main intermediate filament of striated and smooth muscle cells and plays a crucial role in maintaining the stability of muscle fiber during contraction and relaxation cycles. Being a component of Z-disk area, desmin integrates autophagic pathways, and the disturbance of Z-disk proteins’ structure negatively affects chaperone-assisted selective autophagy (CASA). In the present study, we focused on alteration of autophagy flux in myoblasts expressing various Des mutations. We applied Western blotting, immunocytochemistry, RNA sequencing, and shRNA approach to demonstrate that DesS12F, DesA357P, DesL345P, DesL370P, and DesD399Y mutations. Mutation-specific effect on autophagy flux being most severe in aggregate-prone Des mutations such as DesL345P, DesL370P, and DesD399Y. RNA sequencing data confirmed the most prominent effect of these mutations on expression profile and, in particular, on autophagy-related genes. To verify CASA contribution to desmin aggregate formation, we suppressed CASA by knocking down Bag3 and demonstrated that it promoted aggregate formation and lead to downregulation of Vdac2 and Vps4a and upregulation of Lamp, Pink1, and Prkn. In conclusion, Des mutations showed a mutation-specific effect on autophagy flux in C2C12 cells with either a predominant impact on autophagosome maturation or on degradation and recycling processes. Aggregate-prone desmin mutations lead to the activation of basal autophagy level while suppressing the CASA pathway by knocking down Bag3 can promote desmin aggregate formation.
Supplementary Information
The online version contains supplementary material available at 10.1007/s00441-023-03790-6.
Keywords: Desmin mutation, C2C12, Autophagy, BAG3, CASA, Protein aggregates
Introduction
Being a classical representative of the intermediate filament system in muscle cells, desmin supports the mechanical stability of cardiomyocytes and skeletal muscle fibers under the constant mechanical load. Desmin filaments form a three-dimensional scaffold that ensures cellular compartmentalization and provides a transportation network for signaling pathways ((Capetanaki et al. 2007); (Schroder and Schoser 2009)). This scaffold is organized around the Z-disk area of myofilaments, thus allowing the control of the alliance of fibrils during contraction and relaxation cycles. In addition, this network provides the interaction of myofibrils with sarcolemma, nuclei, and membrane organelles, thus integrating the mechanotransduction process.
Mutations in the DES gene are associated with various muscular and cardiac pathologies, so-called desmin-related myopathies or cardiomyopathies. Histologically, these pathologies are often characterized by the presence of myofibrillar protein aggregates in muscle tissue, the main diagnostic criteria for myofibrillar myopathies ((Thornell et al. 1980); (Goldfarb et al. 2008); (Brodehl et al. 2018)). The presence of desmin aggregates in muscle cells causes the loss of contractility force, disorganization of the Z-disk region, and impairment of signaling pathways. The nature of these aggregates has been in focus of many cellular, biochemical, and molecular studies ((Perng et al. 2004); (Clemen et al. 2013); (Kedia et al. 2019); (Smolina et al. 2020)). Nowadays, it is generally accepted that these protein aggregates are composed of filamin A/C, sequestosome 1 (SQSTM1/p62), Xin actin-binding repeat-containing protein 1 (XIRP1), αB-crystallin, desmin, nestin, and several other proteins ((Feldkirchner et al. 2012); (Maerkens et al. 2016); (Singh et al. 2020)). Not all DES mutations result in aggregate formation. The ability to form the aggregates depends on the mutation site, its projection to the protein structure, and individual effects on the protein polymerization ((Bar et al. 2005); (Kostareva et al. 2011)). One of the most deleterious DES mutations, DESL345P located in the 2B part of the protein rod domain, resulted in marked loss of polymerization ability, formation of protein aggregates, violation of interaction with cell components, and the disruption of Z-disk regions in myofilaments ((Sjoberg et al. 1999); (Schroder et al. 2003)). Other DES mutations found in the rod domain, DESA357P, DESL370P, and DESD399Y, also form protein aggregates and are associated with severe cases of myofibrillar myopathy and cardiomyopathy ((Dagvadorj et al. 2003); (Arias et al. 2006); (Even et al. 2017)). On the other hand, mutations located in the desmin head or tail domains usually are not associated with aggregate formation while still lead to the development of cardiac and skeletal muscle pathology, for example, DESS12F ((Hong et al. 2009).
Myofibrillar structural proteins are subjected to a substantial mechanical load during the force transmission across the muscle cell. Protecting the muscle fiber components from damage and maintenance of proper protein folding is critical for the cellular integrity, myofilament mechanical strength, and functional activity of the cell. Therefore, autophagy is crucial for the on-time elimination of damaged cellular components, organelles, and aggregated proteins, and normally serves as a housekeeping process aimed at maintaining cellular homeostasis (Levine and Klionsky 2004). In addition, when cells are exposed to stress, such as starvation, autophagy becomes one of the key mechanisms of cellular survival by providing nutrients for cells ((Scott et al. 2004); (Nishida et al. 2008)).
There are several main types of autophagy: macroautophagy, microautophagy, and chaperon-mediated autophagy (Kaminskyy et al. 2011). In muscle cells, a subtype of macroautophaty—chaperone-assisted selective autophagy (CASA)—plays an important role, as this machinery helps to degrade damaged Z-line-associated proteins, thus supporting Z-disk integrity and proper organization of the cell. The CASA protein complex comprises the following proteins: HSPA8, HSPB8, HSP70, STUB1, SQSTM/p62, and BAG3 ((Behl 2011); (Ulbricht et al. 2013)). The latter is also a well-known protein associated with myofibrillar myopathies and cardiomyopathies where BAG3 deficiency can substantially deteriorate the autophagy process and protein aggregate formation ((Ji et al. 2019); (Adriaenssens et al. 2020); (Ruparelia et al. 2021)).
In muscle cells, BAG3 expression is induced by different stimuli, and BAG3 is responsible for the formation of polyglutamine repeats before induction of target protein degradation through CASA ((Carra et al. 2008); (Gamerdinger et al. 2009); (Zhao et al. 2019)). In the Bag3-deficient mice model and in human cell cultures with BAG3 mutations, the autophagy process was severely affected and thus resulting in the accumulation of α-actinin, myosin heavy chain, desmin, and vinculin in insoluble protein fraction, which proves the key role of BAG3 in the elimination of damaged proteins from muscle cells ((Fang et al. 2017); (Meister-Broekema et al. 2018)).
Although both aggregate formation and disturbed autophagy are well-known characteristics of desmin-related myopathies and cardiomyopathies, knowledge has been lacking regarding the role of autophagy in the molecular pathogenesis of desmin-related muscle pathology and aggregate formation. In the present study, we focused on autophagy flux in myoblasts expressing various Des mutations. We applied Western blotting to measure levels of autophagy-related proteins, immunocytochemistry to quantify autophagosome puncta in cells, RNA sequencing to determine gene expression profiles, and shRNA approach to promote aggregate accumulation.
We demonstrated that alteration of autophagy flux has a mutation-specific pattern, being the most overt in aggregate-prone Des mutations. Also, we showed that knock-down of Bag3 impaired autophagy and potentiate the formation of desmin aggregates, therefore underscoring the role of autophagy in the accumulation of desmin aggregates.
Materials and methods
Cell culture
The work was performed on mouse immortalized myoblasts C2C12 (ATCC, USA, catalog number: CRL 1772). Cells were cultivated in DMEM medium (Gibco, USA) supplemented with 10% fetal bovine serum (FBS) (Gibco, USA), 2 mM L-glutamine, 50 μg/ml penicillin, and 50 μg/ml streptomycin. Cells were incubated at 37 °C, 5% CO2, and 99% humidity and were re-plated every 72 h in the amount of 100,000 on a 100 mm Petri dish.
The experimental design
C2C12 cells were transduced with lentiviruses (LV) carrying Des wild-type (DesWT) or mutant Des (DesL345P, DesA357P, DesL370P, DesD399Y, DesS12F). After 72 h of LV transduction, starvation-induced autophagy was triggered by incubating cells in EBSS (Sigma, Germany) for 2–8 h. Western blotting was used to evaluate the ratio of LC3 protein isoforms: LC3-I–a soluble or free protein fraction in the cytoplasm and LC3-II–a fraction bound or integrated into the autophagosome membrane, immunocytochemistry was applied to quantify LC3 puncta within the cells, while qPCR was used to evaluate the gene expression of proteins involved in autophagy.
Cultivation and viral transduction of C2C12 cells
LV were produced in HEK293T cells. Cells were transfected with pLeGO-SFFV/IRES-eGFP (20 μg) that expressed DesWT, or DesL345P, DesA357P, DesL370P, DesD399Y, DesS12F, with pMD2.G (5 μg) and psPAX2 (5 μg). Wild-type desmin was subcloned in pLeGO using EcoRI-NotI restriction site. Plasmids with desired mutation were obtained as described in using pLeGO-SFFV/IRES-eGFP (Smolina et al. 2020).To increase the efficiency of transduction, PEI reagent (Sigma, USA) was added to the culture medium at the ratio of 2:1 per total amount of pDNA. The concentration of obtained viruses was performed as described previously (Smolina et al. 2020). The expression of exogenous Des in C2C12 cell was performed using LV transduction with 20 μl of concentrated viral suspension per 60,000 cells in the presence of Polybrene (Sigma, Germany) at a concentration of 8 μg/ml for the entire volume of the growth medium.
Stimulation of the autophagy process
After transduction with DesWT and DesL345P, DesA357P, DesL370P, DesD399Y, and DesS12F, cells were plated at a density of 30,000 or 50,000 cells per 60-mm plate for subsequent detection by immunocytochemistry or Western blotting, respectively. Seventy-two hours after the transduction, the growth medium was replaced with EBSS to induce autophagy. Observation of autophagy was carried out 2–8 h after induction. The inhibitor of autophagosome and lysosome fusion chloroquine (CQ) was applied at a concentration of 100 μM at the time point of 2 h both to experimental and control samples.
Western blotting analysis
To characterize autophagy flux, we performed a quantitative analysis of LC3 protein isoforms, using a protocol developed earlier for C2C12 cells ((Kaminskyy et al. 2011); (Klionsky et al. 2016); Sukhareva et al. 2016). After autophagy stimulation, the cells were collected in a sample tube, pelleted by centrifugation at 1000 g for 5 min. Permeabilization of cellular sediment was performed using the 0.025% digitonin (Sigma, USA) in PBS for 5 min on ice. After centrifugation at 2000 g for 5 min, supernatant was collected for further analysis of the soluble protein isoform LC3 (LC3-I). Extraction of the insoluble fraction of the LC3 protein (LC3-II) was performed by lysing cell sediment in RIPA buffer containing a cocktail of protease inhibitors (Roche, USA) and modification of several components to increase the effectivity of the lysis (1% NP-40, 0.5% sodium deoxycholate, 1% SDS, 1% Triton-X 100, 5 mM EDTA) for 10 min on ice. The protein lysates were centrifuged at 16,000 g for 10 min. The resultant supernatant was collected in a new test tube for further analysis of the insoluble LC3-II isoform associated with the autophagosome membrane. Laemmli buffer was added to all protein lysates and further incubated for 5 min at 100 °C.
Protein lysates were run in 12.5% polyacrylamide gel at a constant current of 20 mA in the stacking gel and 40 mA in the resolving gel. Separated proteins were transferred to a nitrocellulose membrane (Applichem, USA) with a pore diameter of 0.45 microns for 1 h at a constant voltage of 100 V using a transfer buffer (49.9 mM TrisHCl, 38.6 mM glycine, 0.0385% SDS, 20% methanol). To assess the quality of the protein transfer, the membranes were reversibly stained with Ponceau S dye (Sigma-Aldrich, USA), followed by washing in PBS with 0.05% Tween 20 (PBS-T). Non-specific antibody binding was blocked with 5% milk diluted in PBS-T for 30 min at room temperature (RT). The membranes were incubated with primary polyclonal anti-LC3 antibody (MBL International Corporation, USA) and with primary anti-alpha-actinin (Agilent, USA) in a 1:7000 and 1:200 dilutions, respectively, in 5% milk in PBS-T overnight at 4 °C. The membranes were washed 3 times in PBS-T and then incubated with a secondary anti-rabbit antibody, conjugated with horseradish peroxidase (BioRad, USA) at a concentration of 1:20,000 in PBS-T for 1 h at RT. The membranes were developed with SuperSignal West Femto substrate (Thermo Fisher Scientific) and processed in the Vilber Lourmat luminescent signal detection chamber (BioRad, USA). Data obtained by Western blotting were processed using the quantification analysis module of Fusion software. The evaluation of the amount of protein in the band was performed by estimating the optical density of pixels in the selected area of the sample. Total protein levels across the different lanes were normalized by analyzing Ponceau S staining of the membranes (Sigma-Aldrich, USA). Protein level for each mutation sample from each experiment was evaluated relative to its control sample. Each control sample was assigned to 1.0.
Immunocytochemistry
Evaluation of LC3-positive puncta within the cells was performed by immunocytochemical staining with an anti-LC3 antibody. Cells seeded on coverslips were subjected to starvation for 2 h. After starvation, the cell membrane was permeabilized with 0.005% digitonin in PBS for 5 min on ice without prefixation to eliminate the soluble fraction of LC3 protein. Prior to the fixation, cells were washed 3 times in PBS for 5 min. Cells were fixed with 4% paraformaldehyde (Sigma, USA) for 5 min on ice and then blocked with 15% FCS in PBS at RT for 30 min. Incubation with the primary polyclonal anti-LC3 antibody at a dilution of 1:500 was performed at RT for 1 h. Goat anti-rabbit secondary antibody (Alexa Fluor 560, Thermo Fisher Scientific, USA) in a dilution of 1:200 was applied to the cells for 45 min at RT in the dark. DAPI (Invitrogen, USA) was used for 30 s to counterstain nuclei. Quantification of LC3-II signal in cells after immunocytochemical staining was performed by counting the positively stained puncta on the images captured with the Observer.D1 fluorescent microscope in the MosaiX program (Carl Zeiss Microsystems, Germany).
Cell survival assay
To verify cells viability latter were trypsinized from the cultivation dish and stained with Propidium Iodide (Sigma-Aldrich, MO, USA) for 20 min in the dark using the manufacturer’s recommendations. Flow cytometry was performed using the Cytoflex S flow cytometer (Beckman Coulter, California, USA) by determining the relative percentages of positive (apoptosis/necrosis) and negative (living) cells, initially logically gated using forward and side light scattering.
RNA sequencing and gene expression analysis
Total RNA for RNA library preparation and sequencing was extracted using ExtractRNA reagent (Evrogen, Russia) according to the manufacturer’s instructions. Extracted RNA was quantified using Qubit (ThermoFisher, USA), the integrity of RNA was assessed in 1.5% agarose gel. RNA libraries were prepared in accordance with the manufacturer’s reference guide using TruSeq Stranded mRNA kit (Illumina, USA) with dual TruSeq CD Indexes (Illumina, USA). The final libraries’ concentrations and quality were evaluated by Bioanalyzer 2100 (Agilent, USA) using HS DNA chip. Sequencing was performed on the NextSeq 2000.
Bcl files obtained after RNA sequencing were converted into fastq format using the bcl2fastq conversion software v1.8.4 (Illumina).
For RNA-seq data processing, nf-core/rnaseq pipeline was used (Harshil Patel et al. 2022). Briefly, paired-end reads were trimmed using TrimGalore v0.6.7, ribosomal RNA sequences were removed with SortMeRNA v4.3.4, reads were aligned to GRCm38 genome with STAR v2.7.10a, deduplication was performed with Picard v2.25.0 MarkDuplicates, and transcripts were quantified using RSEM v1.3.3.
After the counts data were obtained, DESeq2 (Love, 2014) was used to perform differential expression analysis. C2C12 cells with wild-type desmin (DesWT) were compared with samples with mutant desmin (DesL345P, DesA357P, DesL370P, DesD399Y, and DesS12F) to determine the effect of Des mutations pretense on basal gene expression. All samples on scrBag3 background were compared to all samples on shBag3 background to evaluate the shBag3 effect. Samples with DesWT on shBag3 background were compared with shBag3 background and mutant desmin (DesL345P, DesA357P, DesL370P, DesD399Y, and DesS12F). Phantasus was used to create heat maps for gene sets off interest as a web application for visual and interactive analysis of gene expression (https://artyomovlab.wustl.edu/phantasus/).
For real-time PCR analysis, total RNA was extracted as described above and quantified with NanoDrop 3300 (ThermoFisher, USA). Complementary DNA (cDNA) was synthesized using random primers and MMLV reverse transcription kit (Evrogen, Russia). Gene expression was quantified using qPCR with qPCR mix-HS SYBR + ROX (Evrogen, Russia). Sequences for primers are listed in Supplementary Table 1. The expression level of Gapdh was used to normalize the changes in the expression of genes of interest. For the relative quantification of gene expression, RQ = 2(−∆∆Ct) was calculated and used to compare gene expression in studied samples.
Data processing, visualization, and statistics
The GraphPad program was used for statistical data processing and plotting. The results obtained are presented as an average value for all performed experiments. The reliability of differences between groups was assessed using the non-parametric Mann-Whitney test. Differences were considered significant at the level of P < 0.05.
Results
Viral transduction increases basal autophagy level in C2C12 cells
To evaluate the effect of viral transduction and Des mutations on autophagy flux in C2C12 cells, we assessed the basal LC3-I and LC3-II levels without stimulation. LC3-I and LC3-II were measured separately after transduction with LV carrying DesWT and Des mutations DesS12F, DesL345P, DesA357P, DesL370P, and DesD399Y and compared to NTC cells (Fig. 1). In DesWT and mutation samples, LC3-I levels were reduced almost by half compared to NTC cells with no significant difference between WT and mutant Des (Fig. 1a). Thus, LV transduction per se led to LC3-I decrease regardless of the type of LV-encoded exogenous Des. The amount of LC3-II after LV transduction with Des WT was not changed significantly compared to NTC (Fig. 1b). However, transduction with DesL345P resulted in an increase of LC3-II compared to WT cells. On the other hand, transduction with DesD399Y resulted in a drastic decrease of LC3-II.
Fig. 1.
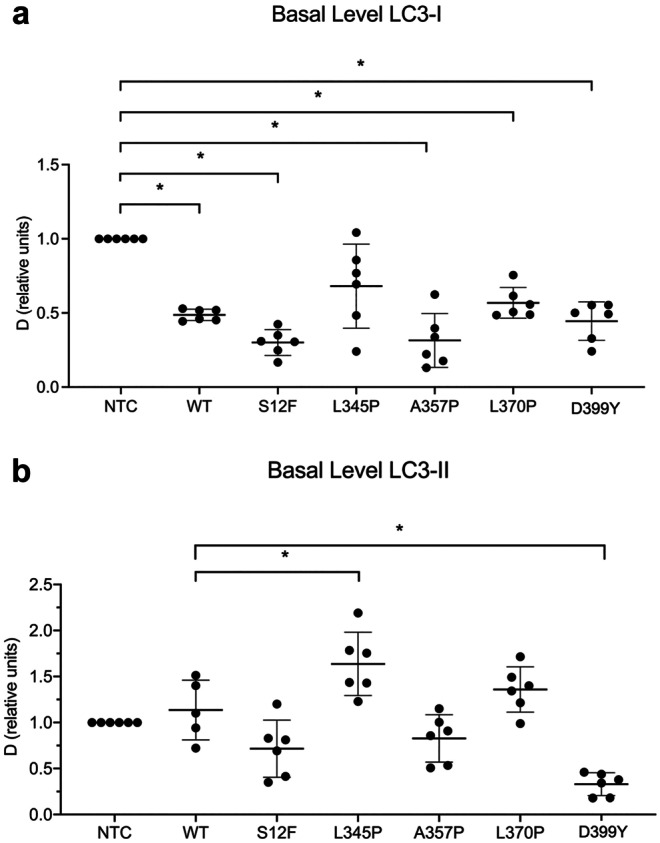
Basal autophagy level shown by the LC3-I and LC3-II dynamics in NTC C2C12 cells and C2C12 with DesWT, DesS12F, DesL345P, DesA357P, DesL370P, and DesD399 mutations. a LC3-I protein dynamics. b LC3-II protein dynamics. * < 0.05. Data presented as mean +—SD. n = 6 biological replicates
Thus, LV transduction boosted autophagy in all samples. However, the further processing of LC3 and the amount of conjugated LC3-II isoform depended on autophagosome formation and degradation rates and was modulated in a mutation-specific manner.
Autophagy stimulation under various desmin mutations demonstrates a mutation-specific response
According to our the previous study for further experiments, we chose the earliest time point of 2 h post-stimulation as the most informative to assess the autophagy dynamics in C2C12 cells transduced with Des mutations (Sukhareva et al. 2021). We considered later time points less informative due to the less striking difference between WT and mutant cells. Moreover, the extended periods of autophagy stimulation negatively affected cell viability due to the high toxic effect of both viral transduction and serum deprivation.
To determine the impact of Des mutations on autophagy flux in C2C12 cells, autophagy was induced by starvation for 2 h after transduction with LV carrying DesWT and Des mutations DesS12F, DesL345P, DesA357P, DesL370P, and DesD399Y. LC3-I and LC3-II levels were evaluated separately, as previously described (Fig. 2). LC3-I level was similarly decreased in NTC, DesWT, DesS12F, and DesA357P cells after 2 h of starvation (Fig. 2(a, a′)). In cells carrying DesL345P after 2 h of serum deprivation, the level of LC3-I was significantly reduced compared to DesWT. The opposite tendency was observed for DesL370P and DesD399Y, where LC3-I was upregulated. Distinct trends were noticed in LC3-II dynamics. LV transduction per se reduced the level of LC3-II, as was observed by the difference between DesWT and NTC samples after 2 h of starvation (Fig. 2(b, b′)). No significant effect on LC3-II level was found in DesS12F and DesA357P compared to DesWT. However, the levels of LC3-II differed between DesWT and DesL345P as well as between DesWT and DesL370P and DesD399Y. The decline of LC3-II level after 2 h of starvation in DesL345P was significantly less pronounced compared to DesWT, when DesL370P and DesD399Y mutations caused a significantly more prominent decrease of LC3-II compared to DesWT.
Fig. 2.

Autophagy dynamics in NTC C2C12 cells and C2C12 carrying various Des mutations: DesWT, DesS12F, DesL345P, DesA357P, DesL370P, DesD399Y, shown by the a′ LC3-I and b′ LC3-II isoform dynamics in control samples and after 2 h of starvations. a and b Western blotting membranes stained with LC3 antibody to visualize LC3 isoforms.(a′, b′) Graph representation of LC3 isoforms dynamics. * < 0.05. Data presented as mean +—SD. n = 6 biological replicates
In summary, the expression of DesL345P, DesL370P, and DesD399Y affected the level of stimulated autophagy and the amount of LC3-I and LC3-II in a mutation-dependent manner. The differences between the mutation effect can be attributed to the diverse stages of autophagosome maturation or degradation affected by the presence of mutations. Thus, Des mutations could control the autophagy flux in various ways, potentially due to the distinct mechanism underlying molecular effects of different Des mutations.
Various desmin mutations impact autophagy by interfering distinct steps of autophagy
To decipher deeper the mechanisms of autophagy flux under the effect of Des mutations, we applied an inhibitor of autophagy CQ (chloroquine) for 2 h along with serum deprivation. Under CQ treatment, the level of LC3-I in DesWT demonstrated a more prominent decrease compared to NTC (Fig. 3(a, b)). In samples with DesS12F and DesA357P, a similar to DesWT decline of LC3-I level was observed, while in DesL345P, the decrease was significantly greater than in WT cells. In contrast, the LC3-I level under CQ treatment was almost unaltered in DesL370P and DesD399Y (Fig. 3(a, b)).
Fig. 3.
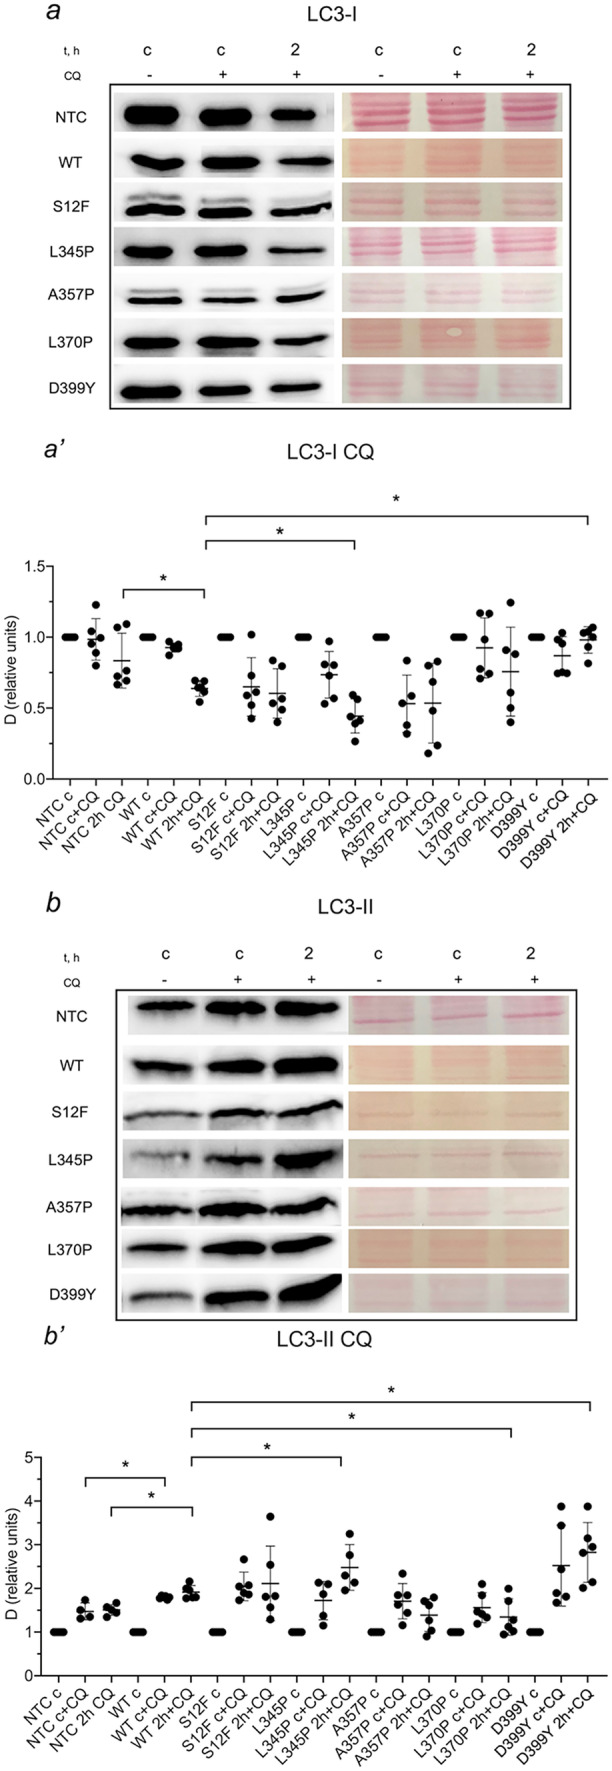
Autophagy dynamics in NTC C2C12 cells and C2C12 carrying various Des mutations: DesWT, DesS12F, DesL345P, DesA357P, DesL370P, DesD399Y, shown by the a′ LC3-I and b′ LC3-II isoform dynamics after 2 h of starvations and use of autophagy inhibitor chloroquine (CQ). a and b Western blotting membranes stained with LC3 antibody to visualize LC3 isoform. (a′, b′) Graph representation of LC3 isoforms dynamics. * < 0.05. Data presented as mean +—SD. n = 6 biological replicates
The level of LC3-II upon starvation under CQ treatment was increased in DesWT compared to CQ-treated NTC cells, meaning that cells with DesWT accumulated LC3-II more extensively (Fig. 3(a′, b′)). In DesS12F and DesA357P cells, LC3-II demonstrated similar to DesWT dynamics. In contrast, cells carrying DesL345P and DesD399Y accumulated LC3-II more efficiently than DesWT. Surprisingly, in DesL370P, LC3-II was slightly decreased after CQ treatment.
In summary, blockade of autophagy flux with autophagy inhibitor CQ allowed to estimate the stage of autophagy turnover modulated by Des mutations. Thus, DesL345P presumably causes the impairment of autolysosome processing and degradation, leading to marked accumulation of LC3-II. In contrast, DesL370P is likely associated with impaired LC3-I to LC3-II conversion leading to the under-processing of LC3-I and lack of LC3-II accumulation. In DesD399Y, the overall increase in the rate of autophagosome formation and autolysosomal degradation was observed which resulted in significant LC3-II accumulation under CQ treatment.
Autophagy in C2C12 cells transduced with Des mutations after 2 h of stimulation assessed by immunocytochemistry
We performed the immunocytochemical staining to evaluate the number of LC3-positive puncta in C2C12 cells. In the first step, we assessed the basal level of autophagy in NTC cell and cells after LV transduction with DesWT and Des mutations: S12F, L345P, A357P, L370P, and D399Y (Supplementary Fig. 1). Immunostaining partially confirmed the results obtained by Western blotting. We found that the relative per mutation amount of autophagosomes in samples after LV transduction was higher compared to NTC cells. Moreover, the number of autophagosomes in DesL345P was the highest among the studied samples. However, we did not observe a significant difference for DesL345P and DesA357P after 2 h of serum deprivation, while the number of autophagosomes in DesS12F and DesL370P was greater compared to DesWT and lower in DesD399Y compared to DesWT. Thus, immunocytostaining results corroborated the data indicating that LV transduction increased the basal activity of autophagy.
Aggregate-prone desmin mutations DesL345P, DesL370P, and DesD399Y are associated with alterations in cell expression profile
To determine whether a higher level of basal autophagy in the presence of Des mutations was associated with the upregulation of genes involved in autophagy pathways or solely caused by protein machinery activation, RNA sequencing was performed. The comparison of each Des mutation: DesS12F, DesL345P, DesA357P, DesL370P, and DesD399Y with DesWT revealed the following numbers of differentially expressed genes: 0, 1165, 0, 211, and 196 for each mutation, respectively (Fig. 4(a–f)). The highest number of differentially expressed genes was found for DesL345P, followed by DesL370P and DesD399Y samples. The absence of differentially expressed genes in DesS12F and DesA357P corresponded to Western blotting data, thus showing the major effect of DesL345P, DesL370P, and DesD399Y mutations on muscle cell function. Of note, DesWT cells differentially expressed 704 genes compared to NTC cells, which confirmed the significant impact of LV transduction on C2C12 expression profile.
Fig. 4.

Gene expression analysis by RNA sequencing of C2C12 samples transuded with Des mutations: S12F, L345P. A357P, L370P, D399Y. (a, b, c, d, e, f) Volcano plot illustrations of RNA-seq differential expression data. Pairwise comparisons is shown between DesWT and the rest of mutations (S12F, L345P, A357P, L370P, and D399Y)
Albeit the autophagy pathway was not among the significantly upregulated ones, we performed a more detailed analysis and focused on the autophagy- and CASA-associated gene expression profiles in C2C12 cells after transduction with Des mutations. The count-based differential expression analysis and its visualization showed that some autophagy-related genes such as Hspb7, Hspb8, Wipi2, Atg12, Chmp3, and Becn1 were highly upregulated in DesL345P, DesL370P, and DesD399Y samples comparing to DesWT (Fig. 5). Moreover, in DesL345P samples, there were several specifically upregulated genes: Map1Lc3a, Map1Lc3b, Pink1; and several specifically downregulated genes: Vps4b, Lamp2, Atg7. Expression of some genes in DesL370P and DesD399Y greatly differed from DesL345P; for instance, Map1Lc3a, Map1Lc3b, and Becn1 were downregulated and Vps4b, Dnm3, Optn, Ulk2, and Myh2 were upregulated. To verify RNA sequencing data, we performed qPCR and confirmed the upregulation of autophagy and CASA-related genes such as Sqstm1, Bag3, Hspb7, and Hspb8 as well as upregulation of Des itself (Supplemental Fig. 2).
Fig. 5.
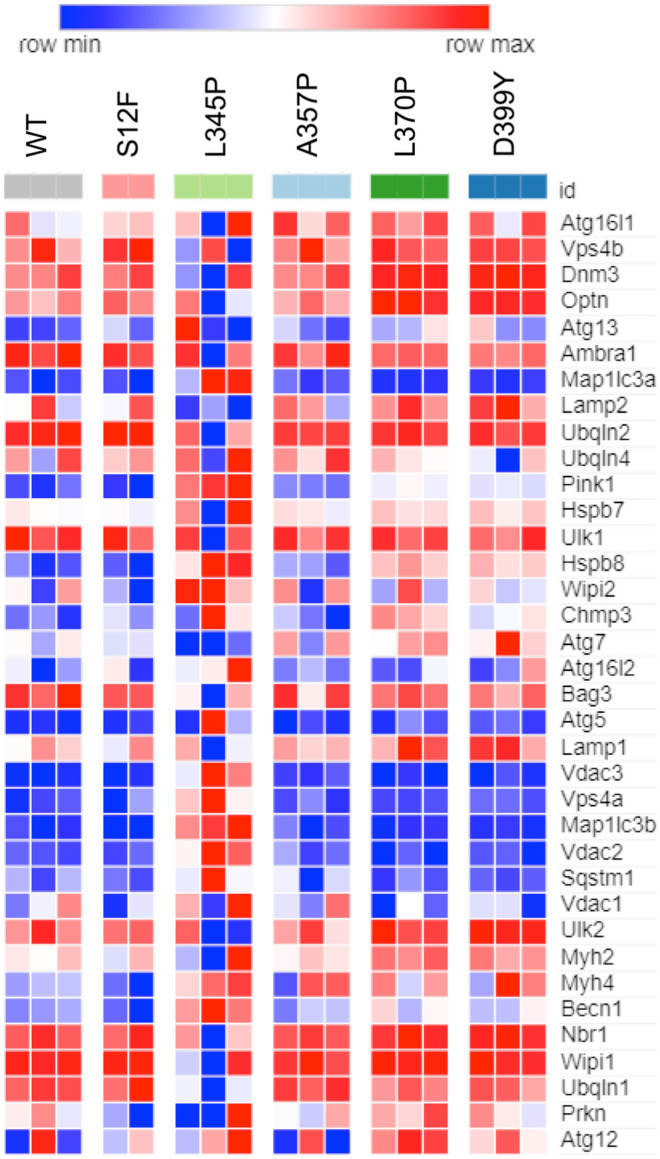
Gene expression analysis by RNA sequencing of C2C12 samples transuded with Des mutations: S12F, L345P. A357P, L370P, D399Y. Heat map illustrating genes associated with autophagy process. Pairwise comparisons is shown between DesWT with the rest of mutations (S12F, L345P, A357P, L370P, and D399Y). Blue, negative log fold-change (log FC) indicates lower expression; red, positive log FC
In summary, DesL345P, DesL370P, and DesD399Y demonstrated the most significant effect on gene expression, which corresponded to the Western blotting results and previously reported aggregate capacity of these mutations ((Bar et al. 2005)). Although the autophagy pathway was not among the ones significantly altered, the obtained data on gene regulation of autophagy in cells expressing Des mutations corresponded to Western blotting results on basal autophagy level demonstrating the prominent effect of LV transduction on gene expression profile and major changes in gene expression among samples with DesL345P, DesL370P, and DesD399Y mutations.
Bag3 suppression is associated with alteration of autophagy-related pathway and results in Des aggregate formation
To further prove the role of autophagy in the molecular pathogenesis of desmin-related muscle pathology and aggregate formation, in particular, we analyzed the effect of various Des mutations under the suppression of one of the key CASA-related genes—Bag3 using shBag3 approach. ScrBag3 with empty vector used as a control of the possible unwanted effects of LV transduction. We analyzed the formation of desmin aggregates after transduction of C2C12 cells with DesWT, DesS12F, DesL357P, DesL345P, and DesD399Y on a scrBag3 and shBag3 background (Fig. 6). Immunostaining using anti-desmin antibody revealed the three-dimensional desmin filament network in control shBag3-NTC cells and cells with scrBag3 and shBag3 background transduced with DesWT, DesS12F, DesA357P (Fig. 6(j, j′, j″, j″′), (c, c′, c″), (d, d′, d″), (f, f′, f″), (k, k′, k″, k″′), (l, l′, l″, l″′), (n, n′, n″, n″′)). In shBag3-DesL345P (Fig. 6(m, m′, m″, m″′)) and shBag3-DesD399Y cells (Fig. 6(p, p′, p″, p″′)), abnormalities of the desmin filament network and the presence of desmin aggregates in C2C12 were found, while in scrBag3-DesL345P (Fig. 6(e, e′, e″)) and scrBag3-DesD399Y cells (Fig. 6(h, h′, h″)), the desmin filament network was present. In shBag3-DesL370P cells (Fig. 6(o, o′, o″)), desmin aggregates were not detected; however, the presented filamentous network differed from those in scrBag3-DesL370P cells (Fig. 6(g, g′, g″)) and was not presented as solid filaments.
Fig. 6.

Immunocytochemistry staining for desmin and visualization of desmin aggregates after Bag3 suppression with shBag3 construct in NTC C2C12 cells and C2C12 transduced with DesWT, DesS12F, DesL345P, DesA357P, DesL370P, DesD399Y lentiviral constructs. (a, a′, a″) Immunofluorescence micrographs of NTC C2C12 cells. (b, b′, b″, c, c′, c″, d, d′, d″, e, e′, e″, f, f′, f″, g, g′, g″, h, h′, h″) Immunofluorescence micrographs of C2C12 with Des mutations: DesWT, DesS12F, DesL345P, DesA357P, DesL370P, DesD399Y transduced with scrBag3 constructs. (i, i′, i″) Immunofluorescence micrographs of C2C12 transduced with DesWT. (j, j′, j″, j″′, k, k′, k″, k″′, l, l′, l″, l″′, m, m′, m″, m″′, n, n′, n″, n″′, o, o′, o″, o″′, p, p′, p″, p″′) Immunofluorescence micrographs of C2C12 with various Des mutations: DesWT, DesS12F, DesL345P, DesA357P, DesL370P, DesD399Y transduced with shBag3 constructs. (j″′, k″′, l″′, m″′, n″′, o″′, p″′) A zoomed area of accumulated desmin aggregates. Cells were immunostained for desmin (Des, red), nuclei DAPI (DAPI, blue), control of LV transduction with GFP (LV, green). Accumulated aggregates are indicated by white boxes
Therefore, the suppression of the CASA pathway resulted in the impairment of desmin filamentous network with the most remarkable changes in DesL345P, DesL370P, and DesD399Y as determined by Western blotting and RNA sequencing. Knock-down of Bag3 caused the formation of aggregates in the most deleterious Des mutations: DesL345P and DesD399Y.
Bag3 knock-down reveals new possible players in maintenance of Bag3 desmin network stability in C2C12 cells
To uncover the intracellular processes that determine the pathological effect of Des mutations and lead to accumulation of desmin aggregates in Bag3-deficient C2C12 cells, transcriptome analysis was performed. A comparison of shBag3 and scrBag3 samples revealed that Bag3, Ubqln1, and Ubqln4 were downregulated and Hspb8, Hspb7, Wipi1, and Becn1 were upregulated in shBag3 cells (Supplementary Fig. 3). These findings illustrated that introduction of shBag3 altered the autophagy pathway. In the next step, we focused on RNA sequencing analysis of shBag3-DesWT cells compared to and shBag3 cells transduced with Des mutations: DesS12F, DesL345P, DesA357P, DesL370P, DesD399Y. We identified the amount of differentially expressed genes after transduction with different mutations with the maximum number of genes identified in DesL370P and DesL345P cells (Fig. 7e, c). However, we did not reveal any autophagy pathways that were differentially regulated under the effect of shBag3 and desmin mutations. To analyze further the autophagy- and CASA-related genes in Bag3-deficient cells expressing Des mutations, we generated heat map visualizations of normalized counts of genes associated with the autophagy process in muscle cells. In most of the studied mutations, we revealed downregulation of the most well-known autophagy genes, such as Atg16l1, Atg7, Lamp1, Vps4a, Map1lc3a, and Map1lc3b (Fig. 8). These data are consistent with previous results; the major differences were observed in more deleterious and aggregate-prone mutations such as DesL345P and DesL370P, DesD399Y.
Fig. 7.

Gene expression analysis by RNA sequencing of C2C12 samples transdused with Des mutations: S12F, L345P. A357P, L370P, D399Y on shBAG3 background. (a, b, c, d, e, f) Volcano plot illustrations RNA-seq differential expression data. Pairwise comparisons is shown between DesWT and the rest of mutations (S12F, L345P, A357P, L370P, and D399Y) on shBag3 background
Fig. 8.
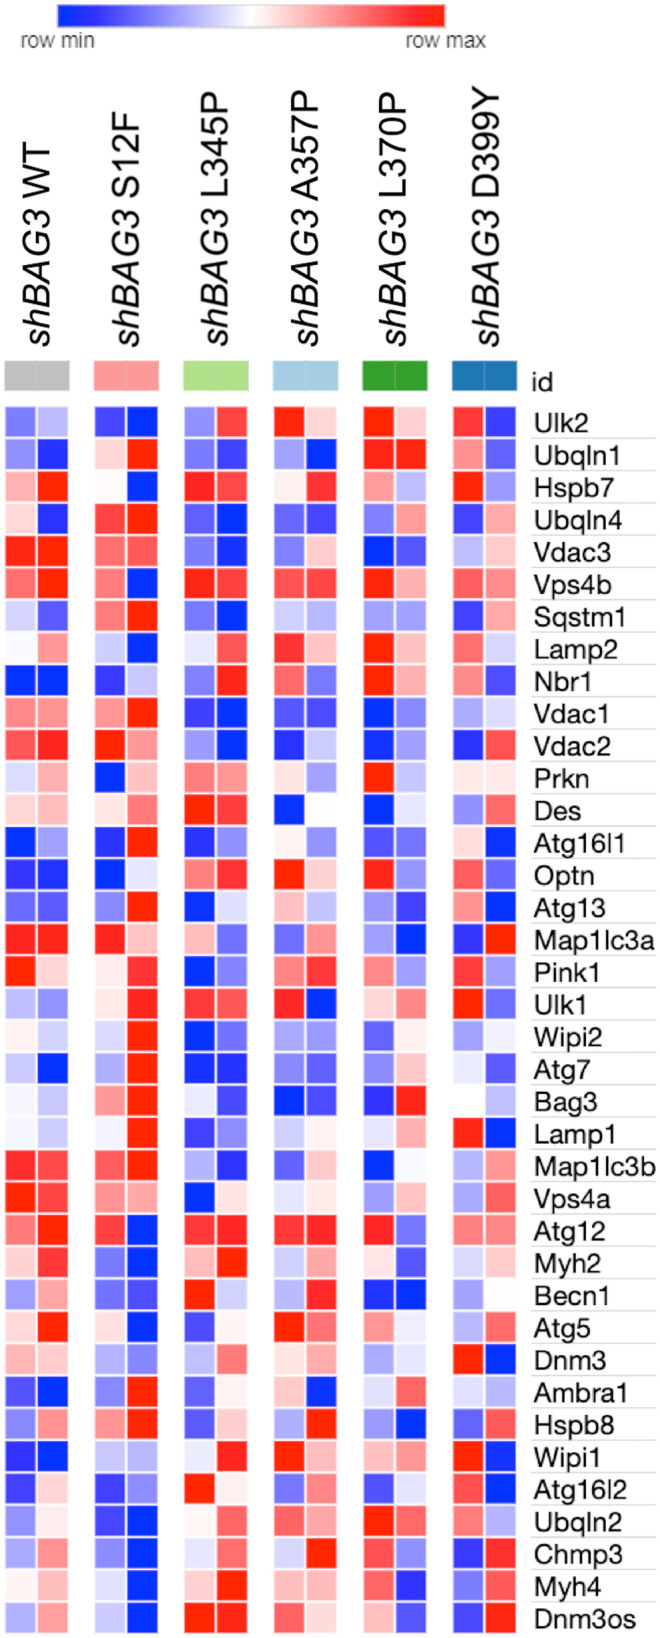
Gene expression analysis by RNA sequencing of C2C12 samples transdused with Des mutations: S12F, L345P. A357P, L370P, D399Y on shBAG3 background. Heat map illustrating genes associated with autophagy process. Pairwise comparisons is shown between DesWT with the rest of mutations (S12F, L345P, A357P, L370P, and D399Y) on shBag3 background. Blue, negative log fold-change (log FC) indicates lower expression; red, positive log FC
Next, we compared each Des mutation on scrBag3 background to the same mutation on shBag3 background to identify the up- and downregulated autophagy-related gene sets and estimate a potential effect of Bag3 knock-down on Des mutation phenotype. We also compared the effect of Des mutations on shBag3 background with shBag3-DesWT to identify the up- and downregulated autophagy-related gene sets and estimate a potential effect of a specific Des mutation under Bag3 downregulation background. For each Des mutation pair, we compared both up- and downregulated gene sets, respectively, using the Venn diagram, which allowed us to pick up the genes both affected by Des mutations and Bag3 knock-down and potentially linked to the aggregate formation (Fig. 9(a–j)). This comparison allowed us to list Ulk2, Hspb7, Hspb8, Wipi2, Pink, and Atg16l1 as most commonly upregulated and Vdac1, Vdac2, Vdac3, Myh2, and Myh4 as most commonly downregulated genes. The obtained RNA sequencing results were partially confirmed by qPCR (Supplementary Fig. 4).
Fig. 9.

Venn diagram illustration of up- and downregulated overlapping genes between (a, b, c, d, e) scrBag3-DesMut/shBag3-DesMut comparison and (f, g, h, i, j) shBag3-DesWT/shBag3-DesMut comparison
The overlap of the obtained gene sets with the genes identified by the heat map in scrBag3 cells confirmed the important role of autophagy in the mitigation of Des mutations effects by degrading intracellular desmin aggregates. The identification of new genes in shBag3 samples revealed additional possible players: Ulk2, Hspb7, Hspb8, Wipi2, Pink, Atg16l1, Vdac1, Vdac2, Vdac3, Myh2, Myh4, involved in the process of desmin aggregates accumulation in cells with DesL345P, DesL370P, and DesD399Y mutations.
Discussion
DES mutations have been linked to the development of neuromuscular and cardiac muscle pathologies for over two decades ((Goebel 1995); (Goldfarb et al. 1998); (Munoz-Marmol et al. 1998)). On the cellular level, the disruption of muscle fibers and mutation aggregation propensity play a key role in the disease progression. It is well known that the autophagy process eliminates cytosolic protein aggregates and is essential for protein quality control under stressful conditions (Klionsky and Emr 2000). In highly dynamic systems, such as muscle and cardiac tissues, where the turnover of proteins normally is at very high level due to mechanotransduction, the autophagy machinery needs to be perfectly functional (Millward et al. 1975) (Tipton et al. 2018). The mechanisms of an autophagy flux arrest, bringing to the development of severe muscle pathologies, are being actively studied. In the three-dimensional intracellular space of the muscle fibers, desmin, apart from its structural functions, acts as a transport network during the autophagosome maturation process and their fusion with lysosomes ((Capetanaki et al. 2007); (Tsoupri and Capetanaki 2013)). Therefore, it is reasonable to consider the alteration of the autophagy process as one of the key molecular mechanisms leading to desmin-related pathologies ((Capetanaki et al. 2015); (Huang et al. 2021)).
In the our studies, we described a regular turnover of LC3-I to LC3-II in NTC and DesWT C2C12 cells during autophagy induction to characterize the autophagy flux in muscle cells (Sukhareva et al. 2021). The level of LC3-I steadily declined with the time of nutritional stress, while the level of LC3-II did not change or only slightly increased at the beginning and then substantially degraded to the later time points. Notably, the observed autophagy dynamics differed from autophagy dynamics in HeLa, MEF, and HEK293, where the major accumulation of LC3-II was observed in the early autophagy stages (Klionsky et al. 2016). This difference can reflect a higher rate of autophagy turnover in muscle cells required for muscle protein homeostasis (Sebastian and Zorzano 2020). Moreover, in all samples after LV transduction, we did not observe LC3-II accumulation with time of autophagy stimulation even though basal LC3-II levels were increased before the induction of starvation. Thus, in DesL345P samples, basal LC3-II level was increased, which can be a sign of the basal autophagy induction in response to aggregate-prone Des mutation, whereas non-aggregate mutations did not show any significant LC3-II accumulation. In this sense, the decline in LC3-I content without autophagy induction represented conversion to the LC3-II.
The induction of autophagy by 2 h of serum deprivation revealed that in DesL345P, LC3-I protein amount declined faster than in DesWT, which can signify a high autophagosome formation rate. On the other hand, in DesL370P and DesD399Y, the conversion of LC3-I was slower, suggesting an impairment in the autophagosome maturation process. Consequently, the autophagosome degradation for some mutations was more intensive, such as DesL370P and DesD399Y mutations, where the LC3-II level fell below DesWT, while in DesL345P LC3-II level fell behind DesWT. In addition, in DesL345P cells, LC3-I conversion to LC3-II was not compensated, possibly due to the loss of LC3-II degradation capacity and rapid turnover. DesL370P and DesD399Y mutations demonstrated a similar effect on the autophagy process. In both mutations, the deceleration of LC3-I conversion and a considerable decline in LC3-II level compared to DesWT were observed. These findings would seem to suggest either an alteration of autophagosome maturation or a higher autophagosome degradation rate.
There are several potential explanations for the observed autophagy dynamics. First, autophagy can be hampered by the disruption of desmin filaments serving as a transport path for autophagosome vesicle maturation and its fusion with lysosome. Second, the increased of autophagy flux and degradation rate can occur as a response to the presence of protein aggregates (Winter et al. 2019). To test which of two plausible mechanisms is involved, the inhibitor of lysosome and autophagosome fusion stage CQ was applied in the subsequent experiments.
In DesL345P, the effect of CQ was depicted by a massive accumulation of LC3-II and the reduction of LC3-I after 2 h of starvation. Similar dynamics occurred in DesD399Y. Thus, we suggested that both mutations induced a higher rate of autophagosome formation. Similar autophagy dynamics for DesD399Y mutation was shown in a study made by Lorena (Perrone et al. 2019). However, the difference in LC3-I after 2 h of starvation in the presence of CQ in DesL345P and DesD399Y indicated that for DesL345P the degradation process was mainly disrupted, while in DesD399Y both degradation and recycling proceeded faster compared to DesWT.
Looking into the protein dynamics of DesL370P after 2 h of starvation under the effect of CQ, we observed LC3-II was not accumulated compared to DesWT. Hence, we concluded that in DesL370P samples, the conversion of LC3-I to LC3-II was impaired, suggesting that the autophagosomes did not form properly even though the degradation and recycling processes proceeded normally.
To summarize, all studied Des mutations showed an effect on autophagy flux in muscle C2C12 cells with either a predominant impact on autophagosome maturation or on degradation and recycling processes. As a result, we proposed the following model of autophagy flux in the presence of Des mutations (Fig. 10a–h). Earlier, Bar et al. and Kreplak et al. demonstrated that proline mutations in DES could cause a severe disruption of desmin filament assembly at various stages of polymerization leading to the different mechanical properties of desmin filaments ((Wawersik et al. 1997); (Bar et al. 2005); (Kreplak and Bar 2009)). Given that the filament assembly for these mutations was altered at different stages, we assumed that the abnormal desmin polymerization process could deteriorate various protein-protein interactions. For this reason, the impairment of proteostasis and decreased autophagy performance in the presence of Des mutations took place at distinct steps of the autophagy process: either deteriorating or, as for DesD399Y mutation, accelerating the autophagy flux to support homeostasis.
Fig. 10.

Proposed mechanisms of Des mutations effect on autophagy pathway. Created via BioRender. The scheme illustrated the alterations in normal conditions (a, b, c, d) and after the chloroquine (CQ) blockage (e, f, g, h). Several autophagy patterns influenced by Des mutations are illustrated. (a, b) DesWT, DesS12F, and DesA357P. (b, f) for DesL345P. (c, g) DesL370P. (d, h) DesD399Y. Autophagy dynamics (a, e) for DesWT, DesS12F, and DesA357P demonstrates the normal protein turnover patter in muscle cells with increased rate of autophagosomes formation, its subsequent fusion with lysosomes and degradation. (b, f) DesL345P results in violation of autolysosomes degradation process; therefore, the partial return of LC3-II to LC3-I is detained. (c, g) In DesL370P, the process of autophagosome maturation is impaired due to delay in the formation of autophagosomes. (d, h) DesD399Y demonstrates the increased turnover speed with the highest autophagosome formation and degradation rate
In line with Western blotting data, RNA sequence demonstrated no difference in autophagy-related gene expression between DesWT and cells carrying DesS12F, DesA357P. The major effect and the highest number of differentially expressed genes were determined in DesL345P, DesL370P, and DesD399Y samples. Thus, DesL345P cells where significant increase in the level of LC3-II at the basal level was observed by Western Blotting, demonstrated the upregulation of autophagy-related genes, such as Map1lc3a, Map1lc3b, Becn1, and Sqstm1 compared to DesWT. Therefore, we consider that basal upregulation of autophagy flux in muscle cells initially serves to prevent the accumulation of mutant desmin in cells and desmin aggregate formation.
To further delineate the role of autophagy in aggregate formation, we suppressed the expression of a key effector protein in chaperone-mediated autophagy Bag3 using shBag3 approach. Consequently, the basal autophagy flux was arrested. The Bag3 knock-down allowed us to visualize the desmin aggregates in DesL345P, DesD399Y, and DesL370P cells which were not previously seen in native or scrBag3 background. In contrast, in DesS12F and DesA357P cells, where the significant difference in autophagy efficiency was not detected, the filament networks remained detectable in all samples with shBag3 and Des mutations. Therefore, the disruption of a desmin filament network and the presence of protein aggregates caused by autophagy restriction stressed the role of autophagy in the elimination of mutant desmin aggregates from cells. ShBag3 samples analyzed by RNA sequencing further confirmed the highest effect of DesL345P, DesL370P, and DesD399Y mutations. Most of differentially expressed genes were detected in the samples where aggregates were formed. Thus, RNA sequencing data well corresponded to Western blotting and immunocytocheminstry results showing the most prominent effect on autophagy of DesL345, DesL370P, and DesD399Y mutations, where the most common downregulated genes on shBag3 background were Vdac2 and Vps4a. The contribution of autophagy-related genes in aggregate accumulation is still under discussion because of seeming contradictions in available data ((Malta et al. 2019); (Pan et al. 2019)). Autophagy is a highly conserved and diversified process. For this reason, if some of the autophagy pathways are blocked, others stay active or become upregulated. Even though, in the presented study, we suppressed some autophagy paths by Bag3 knock-down or by introduction of Des mutations, or at some point both, it does obligatory lead to an ultimate and total block the entire autophagy process (Sandri 2010). Since autophagy pathway is very crucial for muscle cell viability, when suppressing one branch of autophagy pathway the other can activate more intensively, leading to a temporal compensation. Thus, the detailed delineation of exact mechanisms of autophagy impairment in various desmin mutations can help the precise targeting of molecular pathogenesis of desmin-related myopathies and cardiomyopathies.
Conclusion
In the current study, we have focused on the autophagy impairment in muscle cells under the effect of various Des mutations using Western blotting, immunocytochemistry, RNA sequencing analysis, and shRNA approach. We showed that for studied Des mutations, stress stimulation of autophagy affected the autophagy flux in a mutation-specific manner. We demonstrated that Des mutations are often associated with an increased basal autophagy rate and upregulation of genes responsible for autophagy-mediated protein degradation. The latter phenomenon, possibly, can represent a basis for a long-time compensation of desmin aggregate formation in muscle cells regardless of the presence of mutant desmin filaments. We showed that suppression of Bag3 gene with shBag3 impaired autophagy turnover, resulting in more prominent disruption of desmin filament network promoting the aggregates accumulation. Further, we identified several autophagy-related genes which we suggest are associated with maintaining aggregate-free cellular status of muscle cells for an extended period. Thus, this study can be a good starting point for further research on the autophagy process in muscle cells with pathological Des mutations linked to severe cases of myopathies.
Limitations
SNormaleveral limitations of the current study restrict the full interpretation of the obtained results due to some technical caveats. Thus, lentiviral transduction of C2C12 with Des constructs caused a toxic effect that was found in all performed experiments, and a comparison of NTC and DesWT detected that viral transduction itself induced LC3-I conversion. The number of experiments carried out for Western blotting analysis was limited to six and the number of immunocytochemistry experiments to only three. In each experiment, the number of cells counted for each mutation and each time point was 50. The partial incoherence of immunocytochemistry and Western blotting results could potentially be explained by the morphological difference of autophagosomes among different Des mutations. For example, in DesS12F, the autophagosome number could be greater than in DesWT, but their size was smaller. Conversely, in comparison of DesL345P and DesWT, where the difference in autophagosome number was absent, it could be because of the bigger autophagosome size in DesL345P. Unfortunately, it was impossible to perform immunocytochemistry staining for samples under the effect of CQ due to the low viability of cells and decrease in cell adherence throughout the experiment (Supplementary Fig. 5). In addition, for RNA sequencing, all samples were analyzed in duplicates and autophagy dynamics on samples with shBag3 background was not evaluated by Western blotting due to the low viability of cells in the presence of severe Des mutations. The above technical and design caveats can limit the extrapolation of the data obtained.
Supplementary Information
Below is the link to the electronic supplementary material.
Supplementary Figure 1. Autophagy dynamics in NTC C2C12 cells and C2C12 carrying various Des mutations (DesWT, DesS12F, DesL345P, DesA357P, DesL370P, DesD399Y) illustrated by the relative numbers of autophagosome in basal conditions and after 2h of starvation. (a) - Graph representation of relative autophagosome number (a’) in basal conditions and (a’’) after 2h of autophagy stimulation. (b) - Immunofluorescence micrographs of autophagosomes in NTC C2C12 cells and C2C12 with various Des mutations DesWT, DesS12F, DesL345P, DesA357P, DesL370P, DesD399Y stained for LC3-II in control samples and samples after 2h of serum deprivation. Cells were immunostained for LC3 (LC3, red) and nuclei DAPI (DAPI, blue). x100, * < 0.05. Data presented as mean + - SD. n = 50 counted cells. (TIFF 22678 KB)
Supplementary Figure 2. Gene expression by qPCR in NTC C2C12 cells and C2C12 cells transduced with DesWT, DesS12F, DesL345P, DesA357P, DesL370P, DesD399Y lentivaral constructions. (a) - Transcript levels of Des compared by real-time PCR analysis between NTC C2C12 and mutant samples. (b) - Transcript levels of Sqstm compared by real-time PCR analysis between NTC C2C12 and mutant samples. (c) - Transcript levels of Bag3 compared by real-time PCR analysis between NTC C2C12 and mutant samples. (d) - Transcript levels of Hspb7 compared by real-time PCR analysis. (e) - Transcript levels of Hspb8 compared by real-time PCR analysis. * < 0.05. Data presented as mean + - SD. n = 3 biological replicates. (TIFF 33414 KB)
Supplementary Fig. 3. Gene expression analysis by RNA sequencing of C2C12 samples transuded with Des mutations: S12F, L345P. A357P, L370P, D399Y on shBag3 and scrBag3 background. (a)—Volcano plot illustration of RNA-seq differential expression data. Pairwise comparisons is shown for each desmin transduction between scrBag3 and shBag3 background. (b) Heat map is illustrating genes associated with autophagy process. Pairwise comparisons is shown between all DesMut samples on scrBag3 background and all DesMut samples on shBag3 background. Blue, negative log fold-change (log FC) indicates lower expression; red, positive log FC. (TIFF 41250 KB)
Supplementary Fig. 4. Gene expression by qPCR of C2C12 samples transuded with Des mutations: S12F, L345P. A357P, L370P, D399Y on shBag3 background. (a)—Transcript levels of Sqstm compared by real-time PCR analysis between DesWT and mutant samples shBag3 background. (b)—Transcript levels of Vdac2 compared by real-time PCR analysis between DesWT and mutant samples shBag3 background. (c)—Transcript levels of Ulk1 compared by real-time PCR analysis between DesWT and mutant samples shBag3 background. (d)—Transcript levels of Atg7 compared by real-time PCR analysis between DesWT and mutant samples shBag3 background. n = 3 biological replicates. (TIFF 14069 KB)
Supplementary Fig. 5. Cell survival assay. The graph demonstrates the decrease in cell survival after viral transduction with various Des mutations, autophagy stimulation for 2 h of starvation and the effect of CQ. Data is presented as a relative amount of alive cells The results were obtained using propidium iodide (PI) dye by flow cytometry. (TIFF 14020 KB)
Supplementary Table 1. Primers sequences complementary for mouse used for qPCR analysis. (JPG 146874 KB)
Author contribution
KS and NS performed the experiments, analyzed data, and contributed to the writing of the manuscript. ACh, KK, and AP performed the experiments, analyzed data. AKh provided helpful advice and critical reading of the paper. GF, GBL, TS, and AKo contributed to the conception or design of the work, and final approval of the version to be published. AKo provided funding acquisition. All authors approved the final version of the manuscript.
Funding
Open access funding provided by Università degli Studi di Verona within the CRUI-CARE Agreement. The present work was supported by Russian Science Foundation grant number 20–15–00271.
Declarations
Ethical approval.
Not applicable.
Consent to participate
Not Applicable.
Conflict of interest
The authors declare no conflict of interest.
Footnotes
Publisher's Note
Springer Nature remains neutral with regard to jurisdictional claims in published maps and institutional affiliations.
References
- Adriaenssens E, Tedesco B, Mediani L, Asselbergh B, Crippa V, Antoniani F, et al. BAG3 Pro209 mutants associated with myopathy and neuropathy relocate chaperones of the CASA-complex to aggresomes. Sci Rep. 2020;10(1):8755. doi: 10.1038/s41598-020-65664-z. [DOI] [PMC free article] [PubMed] [Google Scholar]
- Arias M, Pardo J, Blanco-Arias P, Sobrido MJ, Arias S, Dapena D, et al. Distinct phenotypic features and gender-specific disease manifestations in a Spanish family with desmin L370P mutation. Neuromuscul Disord. 2006;16(8):498–503. doi: 10.1016/j.nmd.2006.05.011. [DOI] [PubMed] [Google Scholar]
- Bar H, Mucke N, Kostareva A, Sjoberg G, Aebi U, Herrmann H. Severe muscle disease-causing desmin mutations interfere with in vitro filament assembly at distinct stages. Proc Natl Acad Sci U S A. 2005;102(42):15099–15104. doi: 10.1073/pnas.0504568102. [DOI] [PMC free article] [PubMed] [Google Scholar]
- Behl C. BAG3 and friends: co-chaperones in selective autophagy during aging and disease. Autophagy. 2011;7(7):795–798. doi: 10.4161/auto.7.7.15844. [DOI] [PubMed] [Google Scholar]
- Brodehl A, Gaertner-Rommel A, Milting H. Molecular insights into cardiomyopathies associated with desmin (DES) mutations. Biophys Rev. 2018;10(4):983–1006. doi: 10.1007/s12551-018-0429-0. [DOI] [PMC free article] [PubMed] [Google Scholar]
- Capetanaki Y, Bloch RJ, Kouloumenta A, Mavroidis M, Psarras S. Muscle intermediate filaments and their links to membranes and membranous organelles. Exp Cell Res. 2007;313(10):2063–2076. doi: 10.1016/j.yexcr.2007.03.033. [DOI] [PubMed] [Google Scholar]
- Capetanaki Y, Papathanasiou S, Diokmetzidou A, Vatsellas G, Tsikitis M. Desmin related disease: a matter of cell survival failure. Curr Opin Cell Biol. 2015;32:113–120. doi: 10.1016/j.ceb.2015.01.004. [DOI] [PMC free article] [PubMed] [Google Scholar]
- Carra S, Seguin SJ, Lambert H, Landry J. HspB8 chaperone activity toward poly(Q)-containing proteins depends on its association with Bag3, a stimulator of macroautophagy. J Biol Chem. 2008;283(3):1437–1444. doi: 10.1074/jbc.M706304200. [DOI] [PubMed] [Google Scholar]
- Clemen CS, Herrmann H, Strelkov SV, Schroder R. Desminopathies: pathology and mechanisms. Acta Neuropathol. 2013;125(1):47–75. doi: 10.1007/s00401-012-1057-6. [DOI] [PMC free article] [PubMed] [Google Scholar]
- Dagvadorj A, Goudeau B, Hilton-Jones D, Blancato JK, Shatunov A, Simon-Casteras M, et al. Respiratory insufficiency in desminopathy patients caused by introduction of proline residues in desmin c-terminal alpha-helical segment. Muscle Nerve. 2003;27(6):669–675. doi: 10.1002/mus.10370. [DOI] [PubMed] [Google Scholar]
- Di Malta C, Cinque L, Settembre C. Transcriptional regulation of autophagy: mechanisms and diseases. Front Cell Dev Biol. 2019;7:114. doi: 10.3389/fcell.2019.00114. [DOI] [PMC free article] [PubMed] [Google Scholar]
- Even C, Abramovici G, Delort F, Rigato AF, Bailleux V, de Sousa Moreira A, et al. Mutation in the core structure of desmin intermediate filaments affects myoblast elasticity. Biophys J. 2017;113(3):627–636. doi: 10.1016/j.bpj.2017.06.020. [DOI] [PMC free article] [PubMed] [Google Scholar]
- Fang X, Bogomolovas J, Wu T, Zhang W, Liu C, Veevers J, et al. Loss-of-function mutations in co-chaperone BAG3 destabilize small HSPs and cause cardiomyopathy. J Clin Invest. 2017;127(8):3189–3200. doi: 10.1172/JCI94310. [DOI] [PMC free article] [PubMed] [Google Scholar]
- Feldkirchner S, Schessl J, Muller S, Schoser B, Hanisch FG. Patient-specific protein aggregates in myofibrillar myopathies: laser microdissection and differential proteomics for identification of plaque components. Proteomics. 2012;12(23–24):3598–3609. doi: 10.1002/pmic.201100559. [DOI] [PubMed] [Google Scholar]
- Gamerdinger M, Hajieva P, Kaya AM, Wolfrum U, Hartl FU, Behl C. Protein quality control during aging involves recruitment of the macroautophagy pathway by BAG3. EMBO J. 2009;28(7):889–901. doi: 10.1038/emboj.2009.29. [DOI] [PMC free article] [PubMed] [Google Scholar]
- Goebel HH. Desmin-related neuromuscular disorders. Muscle Nerve. 1995;18(11):1306–1320. doi: 10.1002/mus.880181114. [DOI] [PubMed] [Google Scholar]
- Goldfarb LG, Olive M, Vicart P, Goebel HH. Intermediate filament diseases: desminopathy. Adv Exp Med Biol. 2008;642:131–164. doi: 10.1007/978-0-387-84847-1_11. [DOI] [PMC free article] [PubMed] [Google Scholar]
- Goldfarb LG, Park KY, Cervenakova L, Gorokhova S, Lee HS, Vasconcelos O, et al. Missense mutations in desmin associated with familial cardiac and skeletal myopathy. Nat Genet. 1998;19(4):402–403. doi: 10.1038/1300. [DOI] [PubMed] [Google Scholar]
- Harshil Patel PE, Alexander Peltzer, Rickard Hammarén, Olga Botvinnik, Gregor Sturm, Denis Moreno, Pranathi Vemur, silviamorins, Lorena Pantano, Mahesh Binzer-Panchal, BABS-STP1, nf-core bot, FriederikeHanssen, Maxime U Garcia, ames A, Fellows Yates, Chris Cheshire, rfenouil, Jose Espinosa-Carrasco, marchoeppner, Peng Zhou, Sarah Guinchard, Gisela Gabernet, Matthias Zepper, Christian Mertes, Daniel Straub, Matthias Hörtenhuber, Paolo Di Tommaso, Sven F., George Hall (2022). nf-core/rnaseq: nf-core/rnaseq v3.8.1 - Plastered Magnesium Mongoose. Zenodo. (3.8.1). 10.5281/zenodo.6587789
- Hong DJ, Wan XH, Zhang W, Chen B, Feng L, Wang ZX, et al. A novel mutation of S12F in desmin causing desminopathy: A family report. Chin J Neurol. 2009;42:682–685. doi: 10.3760/cma.j.issn.1006-7876.2009.10.009. [DOI] [Google Scholar]
- Huang YS, Xing YL, Li HW. Heterozygous desmin gene (DES) mutation contributes to familial dilated cardiomyopathy. J Int Med Res. 2021;49(4):3000605211006598. doi: 10.1177/03000605211006598. [DOI] [PMC free article] [PubMed] [Google Scholar]
- Ji C, Tang M, Zeidler C, Hohfeld J, Johnson GV. BAG3 and SYNPO (synaptopodin) facilitate phospho-MAPT/Tau degradation via autophagy in neuronal processes. Autophagy. 2019;15(7):1199–1213. doi: 10.1080/15548627.2019.1580096. [DOI] [PMC free article] [PubMed] [Google Scholar]
- Kaminskyy V, Abdi A, Zhivotovsky B. A quantitative assay for the monitoring of autophagosome accumulation in different phases of the cell cycle. Autophagy. 2011;7(1):83–90. doi: 10.4161/auto.7.1.13893. [DOI] [PubMed] [Google Scholar]
- Kedia N, Arhzaouy K, Pittman SK, Sun Y, Batchelor M, Weihl CC, et al. Desmin forms toxic, seeding-competent amyloid aggregates that persist in muscle fibers. Proc Natl Acad Sci U S A. 2019;116(34):16835–16840. doi: 10.1073/pnas.1908263116. [DOI] [PMC free article] [PubMed] [Google Scholar]
- Klionsky DJ, Abdelmohsen K, Abe A, Abedin MJ, Abeliovich H, Acevedo Arozena A, et al. Guidelines for the use and interpretation of assays for monitoring autophagy (3rd edition) Autophagy. 2016;12(1):1–222. doi: 10.1080/15548627.2015.1100356. [DOI] [PMC free article] [PubMed] [Google Scholar]
- Klionsky DJ, Emr SD. Autophagy as a regulated pathway of cellular degradation. Science. 2000;290(5497):1717–1721. doi: 10.1126/science.290.5497.1717. [DOI] [PMC free article] [PubMed] [Google Scholar]
- Kostareva A, Sjoberg G, Gudkova A, Smolina N, Semernin E, Shlyakhto E, et al. Desmin A213V substitution represents a rare polymorphism but not a mutation and is more prevalent in patients with heart dilation of various origins. Acta Myol. 2011;30(1):42–45. [PMC free article] [PubMed] [Google Scholar]
- Kreplak L, Bar H. Severe myopathy mutations modify the nanomechanics of desmin intermediate filaments. J Mol Biol. 2009;385(4):1043–1051. doi: 10.1016/j.jmb.2008.10.095. [DOI] [PubMed] [Google Scholar]
- Levine B, Klionsky DJ. Development by self-digestion: molecular mechanisms and biological functions of autophagy. Dev Cell. 2004;6(4):463–477. doi: 10.1016/s1534-5807(04)00099-1. [DOI] [PubMed] [Google Scholar]
- Love MI, Huber W, Anders S. Moderated estimation of fold change and dispersion for RNA-seq data with DESeq2. Genome Biol. 2014 doi: 10.1186/s13059-014-0550-8. [DOI] [PMC free article] [PubMed] [Google Scholar]
- Maerkens A, Olive M, Schreiner A, Feldkirchner S, Schessl J, Uszkoreit J, et al. New insights into the protein aggregation pathology in myotilinopathy by combined proteomic and immunolocalization analyses. Acta Neuropathol Commun. 2016;4:8. doi: 10.1186/s40478-016-0280-0. [DOI] [PMC free article] [PubMed] [Google Scholar]
- Meister-Broekema M, Freilich R, Jagadeesan C, Rauch JN, Bengoechea R, Motley WW, et al. Myopathy associated BAG3 mutations lead to protein aggregation by stalling Hsp70 networks. Nat Commun. 2018;9(1):5342. doi: 10.1038/s41467-018-07718-5. [DOI] [PMC free article] [PubMed] [Google Scholar]
- Millward DJ, Garlick PJ, Stewart RJ, Nnanyelugo DO, Waterlow JC. Skeletal-muscle growth and protein turnover. Biochem J. 1975;150(2):235–243. doi: 10.1042/bj1500235. [DOI] [PMC free article] [PubMed] [Google Scholar]
- Munoz-Marmol AM, Strasser G, Isamat M, Coulombe PA, Yang Y, Roca X, et al. A dysfunctional desmin mutation in a patient with severe generalized myopathy. Proc Natl Acad Sci U S A. 1998;95(19):11312–11317. doi: 10.1073/pnas.95.19.11312. [DOI] [PMC free article] [PubMed] [Google Scholar]
- Nishida K, Yamaguchi O, Otsu K. Crosstalk between autophagy and apoptosis in heart disease. Circ Res. 2008;103(4):343–351. doi: 10.1161/CIRCRESAHA.108.175448. [DOI] [PubMed] [Google Scholar]
- Pan B, Lewno MT, Wu P, Wang X. Highly dynamic changes in the activity and regulation of macroautophagy in hearts subjected to increased proteotoxic stress. Front Physiol. 2019;10:758. doi: 10.3389/fphys.2019.00758. [DOI] [PMC free article] [PubMed] [Google Scholar]
- Perng MD, Wen SF, van den, I.P., Prescott, A.R., and Quinlan, R.A. Desmin aggregate formation by R120G alphaB-crystallin is caused by altered filament interactions and is dependent upon network status in cells. Mol Biol Cell. 2004;15(5):2335–2346. doi: 10.1091/mbc.e03-12-0893. [DOI] [PMC free article] [PubMed] [Google Scholar]
- Perrone L, Squillaro T, Napolitano F, Terracciano C, Sampaolo S, Melone MAB (2019) The autophagy signaling pathway: a potential multifunctional therapeutic target of curcumin in neurological and neuromuscular diseases. Nutrients 11(8). 10.3390/nu11081881 [DOI] [PMC free article] [PubMed]
- Ruparelia AA, McKaige EA, Williams C, Schulze KE, Fuchs M, Oorschot V, et al. Metformin rescues muscle function in BAG3 myofibrillar myopathy models. Autophagy. 2021;17(9):2494–2510. doi: 10.1080/15548627.2020.1833500. [DOI] [PMC free article] [PubMed] [Google Scholar]
- Sandri M. Autophagy in skeletal muscle. FEBS Lett. 2010;584(7):1411–1416. doi: 10.1016/j.febslet.2010.01.056. [DOI] [PubMed] [Google Scholar]
- Schroder R, Goudeau B, Simon MC, Fischer D, Eggermann T, Clemen CS, et al. On noxious desmin: functional effects of a novel heterozygous desmin insertion mutation on the extrasarcomeric desmin cytoskeleton and mitochondria. Hum Mol Genet. 2003;12(6):657–669. doi: 10.1093/hmg/ddg060. [DOI] [PubMed] [Google Scholar]
- Schroder R, Schoser B. Myofibrillar myopathies: a clinical and myopathological guide. Brain Pathol. 2009;19(3):483–492. doi: 10.1111/j.1750-3639.2009.00289.x. [DOI] [PMC free article] [PubMed] [Google Scholar]
- Scott RC, Schuldiner O, Neufeld TP. Role and regulation of starvation-induced autophagy in the Drosophila fat body. Dev Cell. 2004;7(2):167–178. doi: 10.1016/j.devcel.2004.07.009. [DOI] [PubMed] [Google Scholar]
- Sebastian D, Zorzano A. Self-eating for muscle fitness: autophagy in the control of energy metabolism. Dev Cell. 2020;54(2):268–281. doi: 10.1016/j.devcel.2020.06.030. [DOI] [PubMed] [Google Scholar]
- Singh SR, Kadioglu H, Patel K, Carrier L, Agnetti G (2020) Is desmin propensity to aggregate part of its protective function?. Cells 9(2). 10.3390/cells9020491 [DOI] [PMC free article] [PubMed]
- Sjoberg G, Saavedra-Matiz CA, Rosen DR, Wijsman EM, Borg K, Horowitz SH, et al. A missense mutation in the desmin rod domain is associated with autosomal dominant distal myopathy, and exerts a dominant negative effect on filament formation. Hum Mol Genet. 1999;8(12):2191–2198. doi: 10.1093/hmg/8.12.2191. [DOI] [PubMed] [Google Scholar]
- Smolina N, Khudiakov A, Knyazeva, A, Zlotina, A., Sukhareva, K., Kondratov, K., et al. (2020). Desmin mutations result in mitochondrial dysfunction regardless of their aggregation properties. Biochim Biophys Acta Mol Basis Dis 1866(6), 165745. 10.1016/j.bbadis.2020.165745 [DOI] [PubMed]
- Sukhareva KS, S.N.A., Golovkin A.S., Khudyakov A.A., Knyazeva A.A., Mishanin A.L., Kostareva A.A. Methodological approaches to detection autophagy in muscle cells. Translational Medicine. 2016;3:129–137. doi: 10.18705/2311-4495-2016-3-5-129-137. [DOI] [Google Scholar]
- Sukhareva KS, Smolina NA, Knyazeva AA, Kalugina KK, Khudyakov AA, Kostareva AA. The effect of mutation of L345P in the desmin gene on the process of autophagy in muscle cells of the C2C12 line. Cell and Tissue Biology. 2021;15(1):34–43. doi: 10.1134/S1990519X21010119. [DOI] [Google Scholar]
- Thornell LE, Edstrom L, Eriksson A, Henriksson KG, Angqvist KA. The distribution of intermediate filament protein (skeletin) in normal and diseased human skeletal muscle–an immunohistochemical and electron-microscopic study. J Neurol Sci. 1980;47(2):153–170. doi: 10.1016/0022-510x(80)90001-5. [DOI] [PubMed] [Google Scholar]
- Tipton KD, Hamilton DL, Gallagher IJ. Assessing the role of muscle protein breakdown in response to nutrition and exercise in humans. Sports Med. 2018;48(Suppl 1):53–64. doi: 10.1007/s40279-017-0845-5. [DOI] [PMC free article] [PubMed] [Google Scholar]
- Tsoupri E, Capetanaki Y. Muyospryn: a multifunctional desmin-associated protein. Histochem Cell Biol. 2013;140(1):55–63. doi: 10.1007/s00418-013-1103-z. [DOI] [PubMed] [Google Scholar]
- Ulbricht, A., Arndt, V., and Hohfeld, J. (2013). Chaperone-assisted proteostasis is essential for mechanotransduction in mammalian cells. Commun Integr Biol 6(4), e24925. 10.4161/cib.24925 [DOI] [PMC free article] [PubMed]
- Wawersik M, Paladini RD, Noensie E, Coulombe PA. A proline residue in the alpha-helical rod domain of type I keratin 16 destabilizes keratin heterotetramers. J Biol Chem. 1997;272(51):32557–32565. doi: 10.1074/jbc.272.51.32557. [DOI] [PubMed] [Google Scholar]
- Winter L, Unger A, Berwanger C, Sporrer M, Turk M, Chevessier F, et al. Imbalances in protein homeostasis caused by mutant desmin. Neuropathol Appl Neurobiol. 2019;45(5):476–494. doi: 10.1111/nan.12516. [DOI] [PubMed] [Google Scholar]
- Zhao S, Wang JM, Yan J, Zhang DL, Liu BQ, Jiang JY, et al. BAG3 promotes autophagy and glutaminolysis via stabilizing glutaminase. Cell Death Dis. 2019;10(4):284. doi: 10.1038/s41419-019-1504-6. [DOI] [PMC free article] [PubMed] [Google Scholar]
Associated Data
This section collects any data citations, data availability statements, or supplementary materials included in this article.
Supplementary Materials
Supplementary Figure 1. Autophagy dynamics in NTC C2C12 cells and C2C12 carrying various Des mutations (DesWT, DesS12F, DesL345P, DesA357P, DesL370P, DesD399Y) illustrated by the relative numbers of autophagosome in basal conditions and after 2h of starvation. (a) - Graph representation of relative autophagosome number (a’) in basal conditions and (a’’) after 2h of autophagy stimulation. (b) - Immunofluorescence micrographs of autophagosomes in NTC C2C12 cells and C2C12 with various Des mutations DesWT, DesS12F, DesL345P, DesA357P, DesL370P, DesD399Y stained for LC3-II in control samples and samples after 2h of serum deprivation. Cells were immunostained for LC3 (LC3, red) and nuclei DAPI (DAPI, blue). x100, * < 0.05. Data presented as mean + - SD. n = 50 counted cells. (TIFF 22678 KB)
Supplementary Figure 2. Gene expression by qPCR in NTC C2C12 cells and C2C12 cells transduced with DesWT, DesS12F, DesL345P, DesA357P, DesL370P, DesD399Y lentivaral constructions. (a) - Transcript levels of Des compared by real-time PCR analysis between NTC C2C12 and mutant samples. (b) - Transcript levels of Sqstm compared by real-time PCR analysis between NTC C2C12 and mutant samples. (c) - Transcript levels of Bag3 compared by real-time PCR analysis between NTC C2C12 and mutant samples. (d) - Transcript levels of Hspb7 compared by real-time PCR analysis. (e) - Transcript levels of Hspb8 compared by real-time PCR analysis. * < 0.05. Data presented as mean + - SD. n = 3 biological replicates. (TIFF 33414 KB)
Supplementary Fig. 3. Gene expression analysis by RNA sequencing of C2C12 samples transuded with Des mutations: S12F, L345P. A357P, L370P, D399Y on shBag3 and scrBag3 background. (a)—Volcano plot illustration of RNA-seq differential expression data. Pairwise comparisons is shown for each desmin transduction between scrBag3 and shBag3 background. (b) Heat map is illustrating genes associated with autophagy process. Pairwise comparisons is shown between all DesMut samples on scrBag3 background and all DesMut samples on shBag3 background. Blue, negative log fold-change (log FC) indicates lower expression; red, positive log FC. (TIFF 41250 KB)
Supplementary Fig. 4. Gene expression by qPCR of C2C12 samples transuded with Des mutations: S12F, L345P. A357P, L370P, D399Y on shBag3 background. (a)—Transcript levels of Sqstm compared by real-time PCR analysis between DesWT and mutant samples shBag3 background. (b)—Transcript levels of Vdac2 compared by real-time PCR analysis between DesWT and mutant samples shBag3 background. (c)—Transcript levels of Ulk1 compared by real-time PCR analysis between DesWT and mutant samples shBag3 background. (d)—Transcript levels of Atg7 compared by real-time PCR analysis between DesWT and mutant samples shBag3 background. n = 3 biological replicates. (TIFF 14069 KB)
Supplementary Fig. 5. Cell survival assay. The graph demonstrates the decrease in cell survival after viral transduction with various Des mutations, autophagy stimulation for 2 h of starvation and the effect of CQ. Data is presented as a relative amount of alive cells The results were obtained using propidium iodide (PI) dye by flow cytometry. (TIFF 14020 KB)
Supplementary Table 1. Primers sequences complementary for mouse used for qPCR analysis. (JPG 146874 KB)