

Abstract
Many empirical studies suggest that samples of continuous-time signals taken at locations randomly deviated from an equispaced grid (i.e., off-the-grid) can benefit signal acquisition, e.g., undersampling and anti-aliasing. However, explicit statements of such advantages and their respective conditions are scarce in the literature. This paper provides some insight on this topic when the sampling positions are known, with grid deviations generated i.i.d. from a variety distributions. By solving a square-root LASSO decoder with an interpolation kernel we demonstrate the capabilities of nonuniform samples for compressive sampling, an effective paradigm for undersampling and anti-aliasing. For functions in the Wiener algebra that admit a discrete s-sparse representation in some transform domain, we show that random off-the-grid samples are sufficient to recover an accurate -bandlimited approximation of the signal. For sparse signals (i.e., ), this sampling complexity is a great reduction in comparison to equispaced sampling where measurements are needed for the same quality of reconstruction (Nyquist–Shannon sampling theorem). We further consider noise attenuation via oversampling (relative to a desired bandwidth), a standard technique with limited theoretical understanding when the sampling positions are non-equispaced. By solving a least squares problem, we show that i.i.d. randomly deviated samples provide an accurate -bandlimited approximation of the signal with suppression of the noise energy by a factor
Keywords: Nonuniform sampling, Sub-Nyquist sampling, Anti-aliasing, Jitter sampling, Compressive sensing, Dirichlet kernel
Introduction
The Nyquist–Shannon sampling theorem is perhaps the most impactful result in the theory of signal processing, fundamentally shaping the practice of acquiring and processing data [1, 2] (also attributed to Kotel’nikov [3], Ferrar [4], Cauchy [5], Ogura [6], Whittaker [7, 8]). In this setting, typical acquisition of a continuous-time signal involves taking equispaced samples at a rate slightly higher than a prescribed frequency Hz in order to obtain a bandlimited approximation via a quickly decaying kernel. Such techniques provide accurate approximations of (noisy) signals whose spectral energy is largely contained in the band [5, 9–11].
As a consequence, industrial signal acquisition and post-processing methods tend to be designed to incorporate uniform sampling. However, such sampling schemes are difficult to honor in practice due to physical constraints and natural factors that perturb sampling locations from the uniform grid, i.e., nonuniform or off-the-grid samples. In response, nonuniform analogs of the noise-free sampling theorem have been developed, where an average sampling density proportional to the highest frequency of the signal guarantees accurate interpolation, e.g., Landau density [11–13]. However, non-equispaced samples are typically unwanted and regarded as a burden due to the extra computational cost involved in regularization, i.e., interpolating the nonuniform samples onto the desired equispaced grid.
On the other hand, many works in the literature have considered the potential benefits of deliberate nonuniform sampling [14–41]. Suppression of aliasing error, i.e., anti-aliasing, is a well known advantage of randomly perturbed samples. For example, jittered sampling is a common technique for anti-aliasing that also provides a well distributed set of samples [30, 42–44]. To the best of the authors’ knowledge, this phenomenon was first noticed by Shapiro and Silverman [14] (also by Beutler [15, 16] and implicitly by Landau [12]) and remained unused in applications until rediscovered in Pixar animation studios by Cook [17]. According to our literature review, such observations remain largely empirical or arguably uninformative for applications. Closing this gap between theory and experiments would help the practical design of such widely used methodologies.
To this end, in this paper we propose a practical framework that allows us to concretely investigate the properties of randomly deviated samples for undersampling, anti-aliasing and general noise attenuation. To elaborate (see Sect. 1.1 for notation), let be our function of interest that belongs to some smoothness class. Our goal is to obtain a uniform discretization where an estimate of will provide an accurate approximation of for all We are given noisy non-equispaced samples, where is the nonuniformly sampled signal and encompasses unwanted additive noise. In general, we will consider functions with support on whose periodic extension is in the Wiener algebra [45], where by abuse of notation denotes the interval and the torus
To achieve undersampling and anti-aliasing, we assume our uniform signal admits a sparse (or compressible) representation along the lines of compressive sensing [46–48]. We say that f is compressible with respect to a transform, if there exists some such that and g can be accurately approximated by an s-sparse vector In this scenario, our methodology consists of constructing an interpolation kernel that achieves accurately for smooth signals, in order to define our estimate using the discrete approximation where
| 1 |
and is a parameter to be chosen appropriately. We show that for signals in the Wiener algebra and under certain distributions if we have off-the-grid samples with i.i.d. deviations then the approximation error is proportional to the error of the best s-sparse approximation of g, and the error of the best -bandlimited approximation of in the Wiener algebra norm (see equation 6.1 in [45]). If the average sampling rate required for our result (step size ) provides a stark contrast to standard density conditions where a rate proportional to the highest frequency resulting in step size is needed for the same bandlimited approximation. The result is among the first to formally state the anti-aliasing nature of nonuniform sampling in the context of undersampling (see Sect. 3).
Removing the sparse signal model, we attenuate measurement noise (i.e., denoise) by defining using the discrete estimate
| 2 |
In this context, our main result states that i.i.d. randomly deviated samples provide approximation error proportional to the noise level ) and the error of the best -bandlimited approximation of in the Wiener algebra norm. Thus, by nonuniform oversampling (relative to the desired -bandwidth) we attenuate unwanted noise regardless of its structure. While uniform oversampling is a common noise filtration technique, our results show that general nonuniform samples also posses this denoising property (see Sect. 4).
The rest of the paper is organized as follows: Sect. 2 provides a detailed elaboration of our sampling scenario, signal model and methodology. Section 3 showcases our results for anti-aliasing and undersampling of compressible signals while Sect. 4 considers noise attenuation via oversampling. A comprehensive discussion of the results and implications is presented in Sect. 5. Several experiments and computational considerations are found in Sect. 6, followed by concluding remarks in Sect. 7. We postpone the proofs of our statements until Sect. 8. Before proceeding to the next section, we find it best to introduce the general notation that will be used throughout. However, each subsequent section may introduce additional notation helpful in its specific context.
Notation
We denote complex valued functions of real variables using bold letters, e.g., For any integer [n] denotes the set For indicates the k-th entry of the vector b, denotes the entry of the matrix D and denotes the k-th row (resp. -th column) of the matrix. We reserve x to denote real variables and write the complex exponential as where i is the imaginary unit. For a vector and is the p-norm, and gives the total number of non-zero elements of f. For a matrix denotes the k-th largest singular value of X and is the spectral norm. is the Wiener algebra and is the Sobolev space (with domain ), is the unit sphere in and the adjoint of a linear operator is denoted by
Assumptions and methodology
In this section we develop the signal model, deviation model and interpolation kernel, in Sects. 2.1, 2.2 and 2.3 respectively. This will allow us to proceed to Sects. 3 and 4 where the main results are elaborated. We note that the deviation model (Sect. 2.2) and sparse signal model at the end of Sect. 2.1 only apply to the compressive sensing results in Sect. 3. However, the sampling on the torus assumption in Sect. 2.1 does apply to the results in Sect. 4 as well.
Signal model
For the results in Sects. 3 and 4, let and let be the function of interest to be sampled. We assume with Fourier expansion
| 3 |
on Note that our regularity assumption implies that
which will be crucial for our error bounds. Further, for so that our context applies to many signals of interest.
Henceforth, let be odd. We denote the discretized regular data vector by which is obtained by sampling on the uniform grid with (which is a collection of equispaced points) so that The vector f will be our discrete signal of interest to recover via nonuniform samples in order to ultimately obtain an approximation to for all Similar results can be obtained in the case N is even, our current assumption is adopted to simplify the exposition.
The observed nonuniform data is encapsulated in the vector with underlying unstructured grid where is now a collection of generally non-equispaced points. The entries of the perturbation vector define the pointwise deviations of from the equispaced grid where Noisy nonuniform samples are given as
where the noise model, d, does not incorporate off-the-grid corruption. We assume that we know
In order for the expansion (3) to remain valid for we must impose This is not possible for the general deviations we wish to examine, so we instead adopt the torus as our sampling domain to ensure this condition.
Sampling on the torus: for all our results, we consider sampling schemes to be on the torus. In other words, we allow grid points to lie outside of the interval but they will correspond to samples of within via a circular wrap-around. To elaborate, if is given as
then we define as the periodic extension of to the whole line
We now apply samples generated from our deviations to Indeed, for any generated outside of will have for some In this way, we avoid restricting the magnitude of the entries of and the expansion (3) will remain valid for any nonuniform samples generated.
Sparse signal model: For the results of Sect. 3 only, we impose a compressibility condition on To this end, let be a basis with and We assume there exists some such that where g can be accurately approximated by an sparse vector. To be precise, for we define the error of best s-sparse approximation of g as
and assume s has been chosen so that is within a prescribed error tolerance determined by the practitioner.
In Sect. 8.1, we will relax the condition that be a basis by allowing full column rank matrices with While such transforms are not typical in compressive sensing, we argue that they may be of practical interest since our results will show that if can be selected as tall matrix then the sampling complexity will solely depend on its number of columns (i.e., the smallest dimension n).
The transform will have to be coherent with respect to the 1D centered discrete Fourier basis (see Sect. 2.3 for definition of We define the DFT-incoherence parameter as
which provides a uniform bound on the -norm of the discrete Fourier coefficients of the columns of This parameter will play a role in the sampling complexity of our result in Sect. 3, as a metric that quantifies the smoothness of our signal of interest. We discuss in detail in Sect. 5.3, including examples for several transforms common in compressive sensing.
Deviation model
Section 3 will apply to random deviations whose entries are i.i.d. with any distribution, that obeys the following: for there exists some such that for all integers we have
| 4 |
This will be known as our deviation model. In our results, distributions with smaller parameter will require less samples and provide reduced error bounds. We postpone further discussion of the deviation model until Sect. 5.2, where we will also provide examples of deviations that fit our criteria. We note that the deviation model is most relevant when The case is discussed in Sect. 4, which no longer requires this deviation model or the sparse signal model.
Dirichlet kernel
In Sects. 3 and 4, we model our nonuniform samples via an interpolation kernel that achieves accurately. We consider the Dirichlet kernel defined by where is a 1D centered discrete Fourier transform (DFT) and is a 1D centered nonuniform discrete Fourier transform (NDFT, see [49, 50]) with normalized rows and non-harmonic frequencies chosen according to In other words, let then the entry of is given as
This NDFT is referred to as a nonuniform discrete Fourier transform of type 2 in [50]. Thus, the action of on can be given as follows: we first apply the centered inverse DFT to our discrete uniform data
| 5 |
followed by the NDFT in terms of :
| 6 |
Equivalently,
| 7 |
where is the Dirichlet kernel. This equality is well known and holds by applying the geometric series formula upon expansion. This kernel is commonly used for trigonometric interpolation and is accurate when acting on signals that can be well approximated by trigonometric polynomials of finite order, as we show in the following theorem.
Theorem 1
Let and be defined as above and for some If for some then
| 8 |
and otherwise
| 9 |
where with giving the remainder after division of p by q. As a consequence, if for all then for any integer
| 10 |
and
| 11 |
The proof of this theorem is postponed until Sect. 8.3. Therefore, the error due to is proportional to the 1-norm (or Wiener algebra norm) of the Fourier coefficients of that correspond to frequencies larger than In particular notice that if for all we obtain perfect interpolation, as expected from standard results in signal processing (i.e., bandlimited signals consisting of trigonometric polynomials with finite degree Despite the wide usage of trigonometric interpolation in applications [51–53], such a result that gives a sharp error bound does not seem to exist in the literature.
Notice that Theorem 1 only holds for as restricted in Sect. 2.1. However, the results continues to hold for unrestricted if we sample on the torus as imposed in Sect. 2.1. Therefore, the error bound will always hold under our setup.
Anti-aliasing via nonuniform sampling
With the definitions and assumptions introduced in Sect. 2, our methodology in this chapter will consist of modeling our m nonuniform measurements via and approximating the s largest coefficients of f in (in the representation This discrete approximation will provide an accurate estimate of for all achieving precision comparable to that given by the best -bandlimited approximation of while requiring samples.
The following is a simplified statement, assuming that is an orthonormal basis and We focus on this cleaner result for ease of exposition, presented as a corollary of the main result in Sect. 8.1. The full statement considers the case and allows for more general and practical that allow for reduced sample complexity.
Theorem 2
Let and where m is the number of nonuniform samples. Under our signal model with Fourier expansion (3), let be an orthonormal basis with DFT-incoherence parameter Define the interpolation kernel as in Sect. 2.3 with the entries of i.i.d. from any distribution satisfying our deviation model from Sect. 2.2 with
Define
| 12 |
with
If
| 13 |
where and are absolute constants, then
| 14 |
with probability exceeding
Therefore, with randomly perturbed samples we can recover f with error (14) proportional to the sparse model mismatch the noise level and the error of the best -bandlimited approximation of in the Wiener algebra norm (i.e., As a consequence, we can approximate for all as stated in the following corollary.
Corollary 1
Let be the vector valued function defined entry-wise for as
| 15 |
and define the function via
| 16 |
where is given by (12).
Then, under the assumptions of Theorem 2,
| 17 |
holds for all with probability exceeding
The proof of this corollary is presented in Sect. 8.3. In the case the results intuitively say that we can recover a -bandlimited approximation of with random off-the-grid samples. In the case of equispaced samples, measurements are needed for the same quality of reconstruction by the Nyquist–Shannon sampling theorem (or by Theorem 1 directly). Thus, for compressible signals with random nonuniform samples provide a significant reduction in sampling complexity (undersampling) and simultaneously allow recovery of frequency components exceeding the sampling density (anti-aliasing). See Sect. 5 for further discussion.
Notice that general denoising is not guaranteed in an undersampling scenario, due to the term in (14), and (17). In other words, one cannot expect the output estimate to reduce the measurement noise since appearing in our error bound implies an amplification of the input noise level. Such situations with limited samples are typical in compressive sensing and this noise amplifying behavior is demonstrated numerically in Sect. 6.3. In general a practitioner must oversample (i.e., ) to attenuate the effects of generic noise. However, Theorem 2 and Corollary 1 state that nonuniform samples specifically attenuate aliasing noise.
Denoising via nonuniform oversampling
In this section, we show that reduction in the noise level introduced during acquisition is possible given nonuniform samples whose average density exceeds the Nyquist rate (relative to a desired bandwidth). While the implications of this section are not surprising in the context of classical sampling theory, to the best of our knowledge such guarantees do not exist in the literature when the sampling points are nonuniform.
By removing the sparse signal model (Sect. 2.1), deviation model (Sect. 2.2), and requiring off-the-grid samples (on the torus, see Sect. 2.1), we now use the numerically cheaper program of least squares. To reiterate, with Fourier expansion is our continuous signal of interest. With N odd, is the discrete signal to be approximated, where for The vector encapsulates the nonuniformly sampled data where for Noisy nonuniform samples are given as
where the additive noise model, d, does not incorporate off-the-grid corruption.
In this oversampling context, we provide a denoising result for a more general set of deviations.
Theorem 3
Let the entries of be i.i.d. from any distribution and define
| 18 |
If with then
| 19 |
with probability exceeding
The proof can be found in Sect. 8.2. In this scenario, we oversample relative to the -bandlimited output by generating a set samples with average density exceeding the Nyquist rate (step size With for bound (19) tells us that we can diminish the measurement noise level by a factor The oversampling parameter may be varied for increased attenuation at the cost of denser sampling. We comment that the methodology from Sect. 3 with also allows for denoising and similar error bounds (see Theorem 4). However, focusing on the oversampling case distinctly provides simplified results with many additional benefits.
In particular, here the deviations need not be from our deviation model in Sect. 2.2 and instead the result applies to perturbations generated by any distribution. This includes the degenerate distribution (deterministic), so the claim also holds in the case of equispaced samples. Furthermore, we no longer require the sparsity assumption and the result applies to all functions in the Wiener algebra. Finally, the recovery method (18) consists of standard least squares which can be solved cheaply relative to the square-root LASSO decoder (12) from the previous section.
We may proceed analogously to Corollary 1 and show that the output discrete signal provides a continuous approximation
for all where h(x) is defined in (15). The error of this estimate is bounded as
proportional to the error of the best -bandlimited approximation in the Wiener algebra norm while attenuating the introduced measurement noise. In the result, the structure of the deviated samples is quite general and accounts for many practical cases.
While related results exist in the equispaced case (see for example Sect. 4 of [10]), Theorem 3 is the first such statement in a general non-equispaced case. The result therefore provides insight into widely applied techniques for the removal of unwanted noise, without making any assumptions on the noise structure.
Discussion
This section elaborates on several aspects of the results. Section 5.1 discusses relevant work in the literature. Section 5.2 provides examples of distributions that satisfy our deviation model and intuition of its meaning. Section 5.3 explores the parameter with examples of transformations that produce a satisfiable sampling complexity.
Related work
Several studies in the compressive sensing literature are similar to our results in Sect. 3 [53, 54]. In contrast to these references, we derive recovery guarantees for non-orthonormal systems (when ) while focusing the scope of the paper within the context of classical sampling theory (introducing error according to the bandlimited approximation). The work in [53] considers sampling of sparse trigonometric polynomials and overlaps with our application in the case Our results generalize this work to allow for other signal models and sparsifying transforms. Furthermore, [53] assumes that the samples are chosen uniformly at random from a continuous interval or a discrete set of N equispaced points. In contrast, our results pertain to general deviations from an equispaced grid with average sampling density and allow for many other distributions of the perturbations.
Deviation model
In this section, we present several examples of distributions that are suitable for our results in Sect. 3. Notice that our deviation model utilizes the characteristic function of a given distribution, evaluated at a finite set of points. This allows one to easily consider many distributions for our purpose by consulting the relevant and exhaustive literature of characteristic functions (see for example [55]).
Uniform continuous: gives To generalize this example, we may take for any and to obtain (i.e., shift and dilate on the torus). Notice that with we obtain i.i.d. samples chosen uniformly from the whole interval (as in [53]).
Uniform discrete: with gives To generalize, we may shift and dilate for any and integer We obtain as well.
- Normal: for any mean and variance Here
In particular, for fixed m may be chosen large enough to satisfy the conditions of Theorem 4 and vice versa. - Laplace: for any location and scale gives
- Exponential: for any rate gives
In particular, notice that examples 1 and 2 include cases of jittered sampling [30, 42–44]. Indeed, with these examples partition into m regions of equal size and these distributions will choose a point randomly from each region (in a continuous or discrete sense). The jittered sampling list can be expanded by considering other distributions to generate samples within each region.
In general we will have which implies deteriorated output quality and increases the number of required off-the-grid samples according to Theorem 2. Arguably, our deviation model introduces a notion of optimal jitter when the chosen distribution achieves ideal in our results. This observation may be of interest in the active literature of jittered sampling techniques [30].
Intuitively, is measuring how biased a given distribution is in generating deviations. If means that the distribution is nearly centered and impartial. On the other hand, gives the opposite interpretation where the deviations will be generated favoring a certain direction in an almost deterministic sense. Our result is not applicable to such biased distributions, since in Theorem 2 as the error bound becomes unbounded and meaningless.
Signal model
In this section we discuss the DFT-incoherence parameter introduced in Sect. 2.1 as
where we now let be a full column rank matrix with The parameter a uniform upper bound on the 1-norm of the discrete Fourier coefficients of the columns of Since the decay of the Fourier coefficients of a function is related to its smoothness, intuitively can be seen as a measure of the smoothness of the columns of Implicitly, this also measures the smoothness of since its uniform discretization admits a representation via this transformation
Therefore, the role of on the sampling complexity is clear, relatively small implies that our signal of interest is smooth and therefore requires less samples. This observation is intuitive, since non-smooth functions will require additional samples to capture discontinuities in accordance with Gibbs phenomenon. This argument is validated numerically in Sect. 6.1, where we compare reconstruction via an infinitely differentiable ensemble (FFT) and a discontinuous wavelet (Daubechies 2).
We now consider several common choices for and discuss the respective parameter:
(the DFT), then which is optimal. However, most appropriate and common is the choice which can be shown to exhibit by a simple calculation.
When is the inverse 1D Haar wavelet transform, we have In [56] it is shown that the inner products between rows of and rows of decay according to an inverse power law of the frequency (see Lemma 1 therein). A similar proof shows that which gives the desired upper bound for via an integral comparison. Notice that these basis vectors have jump discontinuities, and yet we still obtain an acceptable DFT-incoherence parameter for nonuniform undersampling.
- (the identity) gives This is the worst case scenario for normalized transforms since
In general, our smooth signals of interest are not fit for this sparsity model. Let be an integer. Matrices whose columns are uniform discretizations of p-differentiable functions, with periodic and continuous derivatives and p-th derivative that is piecewise continuous. In this case if and if For sake of brevity we do not provide this calculation, but refer the reader to Section 2.8 in [57] for an informal argument.
Example 4 is particularly informative due to its generality and ability to somewhat formalize the intuition behind previously discussed. This example implies the applicability of our result to a general class of smooth functions that agree nicely with our signal model defined in Sect. 2.1 (functions in
Numerical experiments
In this section we present numerical experiments to explore several aspects of our methodology and results. Specifically, we consider the effects of the DFT-incoherence and parameter in Sects. 6.1 and 6.2 respectively. Section 6.3 investigates the noise attenuation properties of nonuniform samples. We first introduce several terms and models to describe the setup of the experiments. Throughout we let be the size of the uniformly discretized signal f.
Program (1) with is solved using CVX [58, 59], a MATLAB optimization toolbox for solving convex problems. We implement the Dirichlet kernel using (7) directly to construct We warn the reader that in this section we have not dedicated much effort to optimize the numerical complexity of the interpolation kernel. For a faster implementation, we recommend instead applying the DFT/NDFT representation (see Sect. 2.3) using NFFT 3 software from [49] or its parallel counterpart [60].
Given output with true solution f, we consider the relative norm of the reconstruction error as a measure of output quality, given as
Grid perturbations: To construct the nonuniform grid we introduce an irregularity parameter We define our perturbations by sampling from a uniform distribution, so that each is drawn uniformly at random from for all independently. Off-the-grid samples are generated independently for each signal reconstruction experiment.
Complex exponential signal model: We consider bandlimited complex exponentials with random harmonic frequencies. With bandwidth and sparsity level we generate by choosing s frequencies uniformly at random from and let
We use the DFT as a sparsifying transform so that is a 50-sparse vector. This transform is implemented using MATLAB’s fft function. The frequency vector, is generated randomly for each independent set of experiments. Note that in this case we have optimal DFT-incoherence parameter (see Sect. 5.3).
Gaussian signal model: We consider a non-bandlimited signal consisting of sums of Gaussian functions. This signal model is defined as
For this dataset, we use the Daubechies 2 wavelet as a sparsifying transform implemented using the Rice Wavelet Toolbox [61]. This provides that can be well approximated by a 50-sparse vector. In other words, all entries of g are non-zero but and if is the best 50-sparse approximation of g then The smallest singular value of the transform is and we have computed numerically.
Effect of DFT-incoherence
This section is dedicated to exploring the effect of the DFT-incoherence parameter in signal reconstruction. We consider the complex exponential and Gaussian signal models described above. Recall that in the complex exponential model we have (the DFT) with optimal DFT-incoherence parameter In the Gaussian model is the Daubechies 2 wavelet with Varying the number of nonuniform samples, we will compare the quality of reconstruction using both signal models with respective transforms to investigate the role of in the reconstruction error. We consider the sparsity level and solve (1) with though the Gaussian signal model is not 50-sparse in the Daubechies domain (see last paragraph of this subsection for further discussion).
Here we set irregularity parameter to generate the deviations (so that ) and vary the average step size of the nonuniform samples. We do so by letting m vary through the set For each fixed value of m, the average relative error is obtained by averaging the relative errors of 50 independent reconstruction experiments. The results are shown in Fig. 1, where we plot the average step size vs average relative reconstruction error.
Fig. 1.

Plot of average relative reconstruction error vs average step size for both signal models. In the complex exponential model the DFT) we have and in the Gaussian signal model we have (Daubechies 2 wavelet). Notice that the complex exponential model allows for reconstruction from larger step sizes in comparison to the Gaussian signal model
These experiments demonstrate the negative effect of larger DFT-incoherence parameters in signal reconstruction. Indeed, in Fig. 1 we see that the complex exponential model with allows for accurate reconstruction from larger step sizes. This is to be expected from Sect. 3, where the results imply that the Daubechies 2 wavelet will require more samples for successful reconstruction according to its parameter
To appropriately interpret these experiments, it is important to note that the signal from the Gaussian model is only compressible and does not exhibit a 50-sparse representation via the Daubechies transform. Arguably, this may render the experiments of this section inappropriate to purely determine the effect of since the impact of approximating the Gaussian signal with a 50-sparse vector may be significant and produce an unfair comparison (i.e., due the sparse model mismatch term appearing in our error bound (14)). This is important for the reader to keep in mind, but we argue that the effect of this mismatch is negligible since in the Gaussian signal model with we have and if is the best 50-sparse approximation of g then This argument can be further validated with modified numerical experiments where f does have a 50-sparse representation in the Daubechies domain, producing reconstruction errors with identical behavior and magnitude as those in Fig. 1. Therefore, we believe our results here are informative to understand the impact of For brevity, we do not present these modified experiments since such an f will not longer satisfy the Gaussian signal model and complicate our discussion.
Effect of the deviation model parameter
In this section we generate the deviations in such a way that vary the deviation model parameter in order to explore its effect on signal reconstruction. We only consider the complex exponential signal model for this purpose and fix
We vary by generating deviations with irregularity parameter varying over For each fixed value we compute the average relative reconstruction error of 50 independent experiments. Notice that for each and any j
Given we use this observation and definition (4) to compute the respective value by considering the maximum of the expression above over all The relationship between and is illustrated in Fig. 2 (right plot), where smaller irregularity parameters provide larger deviation model parameters
Fig. 2.

(Left) Plot of average relative reconstruction error vs corresponding parameter and (right) plot illustrating the relationship between the irregularity parameter and the deviation model parameter The plots emphasize via red outlines the values that satisfy the conditions of Theorem 2 (i.e., Although our results only hold for three values (0, .409, .833), the experiments demonstrate that accurate recovery is possible otherwise
According to (4), this allows which violates the assumption of Theorem 2 and does not allow (1) to be implemented with parameter in the required range
Despite this, we implement all experiments in this section with (where Such a fixed choice may not provide a fair set of results, since the parameter is not adapted in any way to the deviation model. Regardless, the experiments will prove to be informative while revealing the robustness of the square-root LASSO decoder with respect to parameter selection.
Figure 2 plots vs average relative reconstruction error (left plot). In the plot, our main result (Theorem 2) is only strictly applicable in three cases (outlined in red, However, the experiments demonstrate that decent signal reconstruction may be achieved when the condition does not hold and the parameter is not chosen appropriately. Therefore, the applicability of the methodology goes beyond the restrictions of the theorem and the numerical results demonstrate the flexibility of the square-root LASSO decoder.
Noise attenuation
This section explores the robustness of the methodology when presented with measurement noise, in both the undersampled and oversampled cases relative to the target bandwidth (Sects. 3 and 4 respectively). We only solve the square-root LASSO problem (1) with and avoid the least squares problem (18) for brevity. However, we note that both programs produce similar results and conclusions in the oversampled case (see Theorem 4). We only consider the bandlimited complex exponential signal model for this purpose. We generate additive random noise from a uniform distribution. Each entry of is i.i.d. from where chosen to maintain relatively constant as m varies.
We set to generate the deviations (so that ) and vary the average step size of the nonuniform samples. We do so by letting m vary through the set notice that only the first two cases correspond to oversampling. For each fixed value of m, the relative reconstruction error is obtained by averaging the result of 50 independent experiments. The results are shown in Fig. 3, where we plot the average step size vs average relative reconstruction error and average relative input noise level
Fig. 3.
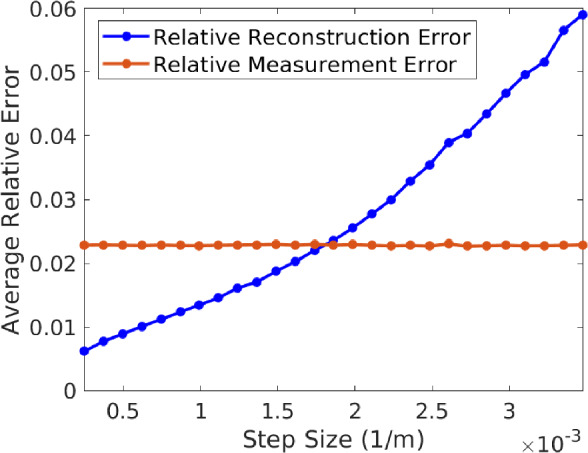
Plot of average relative reconstruction error vs average step size (blue curve) and average input relative measurement error vs average step size (red curve). Notice that the first 13 step size values achieve noise attenuation, i.e., the reconstruction error is lower than the input noise level
The first two cases ) correspond to oversampling and illustrate the results from Sect. 4 (and Theorem 4), where attenuation of the input noise level is achieved. Surprisingly, these experiments demonstrate that nonuniform undersampling also allows for denoising. This is seen in Fig. 3, where the values correspond to sub-Nyquist rates and output an average relative reconstruction error smaller than the input measurement noise level. Thus, when nonuniform samples are not severely undersampled, the negative effects of random noise can be reduced.
Conclusions
This paper provides a concrete framework to study the benefits of random nonuniform samples for signal acquisition (in comparison to equispaced sampling), with explicit statements that are informative for practitioners. Related observations are extensive but largely empirical in the sampling theory literature. Therefore, this work supplies novel theoretical insights on this widely discussed phenomenon. In the context of compressive sensing, we extend the applicability of this acquisition paradigm by demonstrating how it naturally intersects with standard sampling techniques. We hope that these observations will prompt a broader usage of compressive sensing in real world applications that rely on classical sampling theory.
There are several avenues for future research. First, the overall methodology requires the practitioner to know the nonuniform sampling locations accurately. While this is typical for signal reconstruction techniques that involve non-equispaced samples, it would be of practical interest to extend the methodology is such a way that allows for robustness to inaccurate sampling locations and even self-calibration. Further, as mentioned in Sect. 6, this work has not dedicated much effort to a numerically efficient implementation of the Dirichlet kernel This is crucial for large-scale applications, where a direct implementation of the Dirichlet kernel via its Fourier or Dirichlet representation (see [62]) may be too inefficient for practical purposes. As future work, it would be useful to consider other interpolation kernels with greater numerical efficiency (e.g., a low order Lagrange interpolation operator).
Finally, to explore the undersampling and anti-aliasing properties of nonuniform samples, our results here require a sparse signal assumption and adopt compressive sensing methodologies. However, most work that first discussed this nonuniform sampling phenomenon precedes the introduction of compressive sensing and does not explicitly impose sparsity assumptions. Therefore, to fully determine the benefits provided by off-the-grid samples it would be most informative to consider a more general setting, e.g., only relying on the smoothness of continuous-time signals. We believe the work achieved here provides a potential avenue to do so.
Proofs
We now provide proofs to all of our claims. In Sect. 8.1 we prove Theorem 2 via a more general result. Theorem 3 is proven in Sect. 8.2. Section 8.3 establishes the Dirichlet kernel error bounds in Theorem 1 and Corollary 1.
Proof of Theorem 2
In this section, we will prove a more general result than Theorem 2 assuming that is a full column-rank matrix and allowing Theorem 2 will follow from Theorem 4 by taking and simplifying some terms.
Theorem 4
Let and be a full column rank matrix with DFT-incoherence parameter and extreme singular values Let the entries of be i.i.d. from any distribution satisfying our deviation model with Define
| 20 |
with
If
| 21 |
where and are absolute constants, then
with probability exceeding
This theorem generalizes Theorem 2 to more general transformations for sparse representation. This is more practical since the columns of need not be orthogonal, instead linear independence suffices (with knowledge of the singular values In particular notice that (21) depends on n and does not involve N, as opposed to in (13). Since this general result allows for a potential reduction in sample complexity if the practitioner may construct in such an efficient manner while still allowing a sparse and accurate representation of f.
Furthermore, notice that this more general result allows for oversampling or If we apply Theorem 4 with then and we obtain an error bound similar to those in Sect. 4, reducing additive noise by a factor from off-the-grid samples. However, in this scenario the sparsifying transform is no longer of much relevance and it is arguably best to consider the approach of Sect. 4 which removes the need to consider and via a numerically cheaper methodology and a more general set of deviations.
To establish Theorem 4 we will consider the -adjusted restricted isometry property -RIP) [63], defined as follows:
Definition 1
-adjusted restricted isometry property [63]) Let and be invertible. The s-th -adjusted Restricted Isometry Constant -RIC) of a matrix is the smallest such that
for all If then the matrix is said to satisfy the -adjusted Restricted Isometry Property -RIP) of order s.
This property ensures that a measurement matrix is well conditioned amongst all s-sparse signals, allowing for successful compressive sensing from measurements. Once established for our measurement ensemble, Theorem 4 will follow by applying the following result:
Theorem 5
(Theorem 13.9 in [63]) Let be invertible and have the -RIP of order q and constant where
| 22 |
Let and Then
satisfies
| 23 |
We therefore obtain our main result if we establish the -RIP for
To do so, we note that our measurement ensemble is generated from a nondegenerate collection of independent families of random vectors. Such random matrices have been shown to possess the -RIP in the literature. To be specific, a nondegenerate collection is defined as follows:
Definition 2
(Nondegenerate collection [63]) Let be independent families of random vectors on The collection is nondegenerate if the matrix
where is positive-definite. In this case, write for its unique positive-definite square root.
Our ensemble fits this definition, with the rows of generated from a collection of m independent families of random vectors:
Therefore, in our scenario, the k-th family independently generates deviation and produces a random vector of the form above as the k-th row of This in turn also generates the rows of independently, since its k-th row is given as To apply -RIP results from the literature for such matrices, we will have to consider the coherence of our collection:
Definition 3
(Coherence of an unsaturated collection [63]) Let be independent families of random vectors, with smallest constants such that
holds almost surely for The coherence of an unsaturated collection is
In the above definition, a family is saturated is it consists of a single vector and a collection is unsaturated if no family in the collection is saturated. In our context, it is easy to see that the condition avoids saturation and the definition above applies. The coherence of our collection of families will translate to the DFT-incoherence parameter defined in Sect. 2.1.
With these definitions in mind, we now state a simplified version of Theorem 13.12 in [63] that will show the -RIP for our ensemble.
Theorem 6
Let be a nondegenerate collection generating the rows of Suppose that
| 24 |
where is an absolute constant. Then with probability at least the matrix has the -RIP of order s with constant
In conclusion, to obtain Theorem 4 we will first show that is generated by a nondegenerate collection with unique positive-definite square root Establishing this will provide a upper bounds for and At this point, Theorem 6 will provide with the -RIP and subsequently Theorem 5 can be applied to obtain the error bounds.
To establish that the collection above is nondegenerate, it suffices to show that
| 25 |
for all This will show that is positive-definite if the deviation model satisfies Further, let be the unique positive-definite square root of then (25) will also show that
| 26 |
To this end, let and normalize so that for
Throughout, let be an independent copy of the entries of Then with
The last equality can be obtained as follows,
The third equality uses the fact that for all in order to properly factor out this constant from the sum in the fourth equality. The last equality is due to the geometric series formula.
Returning to our original calculation, we bound the last term using our deviation model assumptions
is the index set of allowed indices according to j, i.e., that satisfy and The second inequality holds by our deviation model assumption (4).
The remaining sum (with ) can be bounded similarly. Combine these inequalities with the singular values of to obtain
and
We will apply this inequality and similar orthogonality properties in what follows (e.g., in Sect. 8.2), and ask the reader to keep this in mind.
To upper bound the coherence of the collection let as above. Then
and therefore
| 27 |
The proof of Theorem 4 is now an application of Theorems 6 and 5 using the derivations above.
Proof of Theorem 4
We are considering the equivalent program
From the arguments above, the rows of are generated by a nondegenerate collection with coherence bounded as (27). The unique positive-definite square root of denoted satisfies the bounds (26).
We now apply Theorem 6 with and order
| 28 |
then (24) is satisfied and the conclusion of Theorem 6 holds. Therefore, with probability exceeding has -RIP of order q with constant
To show that our sampling assumption (21) satisfies (28), notice that by (26)
The last inequality holds since
and for any real number it holds that In (28), replace q with This provides our assumed sampling complexity, where expression (21) simplifies by absorbing all absolute constants into and
With parameter chosen for (20), the conditions of Theorem 5 hold with and we obtain the error bound
To finish, notice that
and
where the last inequality holds by Theorem 1.
To obtain Theorem 2 from Theorem 4, notice that in Theorem 2 we have and The assumption gives that
which allows further simplification by combining all the logarithmic factors into a single term (introducing absolute constants where necessary). We note that the condition is not needed and is only applied for ease of exposition in the introductory result.
Proof of Theorem 3
To establish the claim, we aim to show that
| 29 |
holds with high probability. By optimality of this will give
where the last inequality is due to our noise model and trigonometric interpolation error (Theorem 1).
To this end, we normalize by letting and note that when our sampling operator is isometric in the sense that
| 30 |
where is the identity matrix. To see this, we use our calculations from the previous section (that establish (25)) to obtain as before that for
However, if notice that the middle case never occurs since for all Therefore, (30) holds.
With the isometry established, we may now proceed to the main component of the proof of Theorem 3.
Theorem 7
Let with and the entries of be i.i.d. with any distribution. Then
with probability exceeding
Proof
We will apply a matrix Chernoff inequality to lower bound the smallest eigenvalue of To apply Theorem 1.1 in [64], notice that we can expand
which is a sum of independent, random, self-adjoint, and positive-definite matrices. Our isometry condition (30) gives that has extreme eigenvalues equal to 1, we stress that this holds because we assume as shown above. Further,
Therefore, by Theorem 1.1 in [64] with and we obtain
With and the left hand side is upper bounded by Since the singular values of are the square root of the eigenvalues of this establishes the result.
With our remarks in the beginning of the section, we can now easily establish the proof of Theorem 3.
Proof of Theorem 3
Under our assumptions, apply Theorem 7 to obtain that for all
holds with the prescribed probability. This establishes (29) with The remainder of the proof follows from our outline in the beginning of the section.
Interpolation error of Dirichlet kernel: proof
In this section we provide the error term of our interpolation operator when applied to our signal model (Theorem 1) and also the error bound given in Corollary 1.
Proof of Theorem 1
We begin by showing (8), i.e., if for some (our “nonuniform” sample lies on the equispaced interpolation grid) then the error is zero. This is easy to see by orthogonality of the complex exponentials, combining (5), (6) (recall that ) we have
The fourth equality holds since we are assuming for some
We now deal with the general case (9). Recall the Fourier expansion of our underlying function
Again, using (5), (6) and the Fourier expansion at we obtain
At this point, we wish to switch the order of summation and sum over all We must assume the corresponding summands are non-zero. To this end, we continue assuming for all We will deal with these cases separately afterward. In particular we will remove this assumption for the ’s and show that under our assumption
Proceeding, we may now sum over all to obtain
The second equality is obtained by orthogonality of the exponential basis functions, when and otherwise equal to for some where The last equality results from a reordering of the absolutely convergent series where the mapping r is defined as in the statement of Theorem 1.
To illustrate the reordering, we consider (for simplicity) and first notice that since N is assumed to be odd in Sect. 2.1. Aesthetically expanding the previous sum gives
Notice that in the first row starting at the second coefficient we have indices followed by and so on, which are subsequent to the indices of the coefficients in the last row (one column prior). Therefore, if start at the top left coefficient and “column-wise” traverse this infinite array of Fourier coefficients we will obtain the ordered sequence (with no repetitions).
The coefficients in row correspond to frequency value and have indices of the form for some To establish that the reordered series is equivalent, we finish by checking that for a given index the mapping r gives the correct frequency value, i.e., for all :
We can therefore reorder the series as desired and incorporate the sum over via the same logic to establish the equality.
Since for we have and we finally obtain
The definition of the p-norms along with the triangle inequality give the remaining claim. In particular,
This finishes the proof in the case for all To remove this condition for the ’s, we may find a real number such that the function
is non-zero when In particular notice that if we define then for all Therefore, only assuming now that for the previous argument can be applied to conclude
However, if denotes the all ones vector and is the -th standard basis vector, notice that
The fourth equality holds by orthogonality of and since The fifth inequality holds since Therefore
and the claim holds in this case as well.
The assumption will always hold if i.e., for all We show this case by deriving conditions under which this occurs. As noted before, we have
and we see that iff and However, notice that
so that iff This condition equivalently requires for some Since this must hold for all we have finally have that
We see that such a condition would imply that which violates our assumption This finishes the proof.
We end this section with the proof of Corollary 1.
Proof of Corollary 1
The proof will consist of applying Theorem 2 (under identical assumptions) and Theorem 1.
By Theorem 2, we have that
with probability exceeding As in the proof of Theorem 1, we can show that for
Therefore
The last inequality holds since (here x is considered fixed and This finishes the proof.
Acknowledgements
This work was in part financially supported by the Natural Sciences and Engineering Research Council of Canada (NSERC) Collaborative Research and Development Grant DNOISE II (375142-08). This research was carried out as part of the SINBAD II project with support from the following organizations: BG Group, BGP, CGG, Chevron, ConocoPhillips, DownUnder GeoSolutions, Hess Corporation, Petrobras, PGS, Sub Salt Solutions, WesternGeco, and Woodside. Özgür Yılmaz also acknowledges an NSERC Discovery Grant (22R82411) and an NSERC Accelerator Award (22R68054).
Data Availability
Not applicable
References
- 1.Shannon CE. Communication in the presence of noise. Proc. IRE. 1949;37(1):10–21. [Google Scholar]
- 2.Nyquist H. Certain topics in telegraph transmission theory. AIEE Trans. 1928;47:617–644. [Google Scholar]
- 3.Kotel’nikov, V.A.: On the transmission capacity of ether and wire in electrocommunications. Physics-Uspekhi. 49(7), 736 (2006)
- 4.Ferrar WL. On the consistency of cardinal function interpolation. Proc. R. Soc. Edinb. 1928;47:230–242. [Google Scholar]
- 5.Jerri AJ. The Shannon sampling theorem—its various extensions and applications: a tutorial review. Proc. IEEE. 1977;65(11):1565–1596. [Google Scholar]
- 6.Ogura K. On a certain transcendental function in the theory of interpolation. Tôhoku Math. J. 1920;17:64–72. [Google Scholar]
- 7.Whittaker ET. On the functions which are represented by the expansion of interpolating theory. Proc. R. Soc. Edinb. 1915;35:181–194. [Google Scholar]
- 8.Whittaker JM. The Fourier theory of the cardinal functions. Proc. Math. Soc. Edinb. 1929;1:169–176. [Google Scholar]
- 9.Zayed AI. Advances in Shannon’s Sampling Theory. Boca Raton: CRC Press; 1993. [Google Scholar]
- 10.Oppenheim AV, Schafer RW. Discrete-Time Signal Processing. 3. Hoboken: Prentice Hall Press; 2009. [Google Scholar]
- 11.Marvasti F. Nonuniform Sampling: Theory and Practice. Berlin: Springer; 2001. [Google Scholar]
- 12.Landau H. Necessary density condition for sampling and interpolation of certain entire functions. Acta Math. 1967;117:37–52. [Google Scholar]
- 13.Grochenig K, Razafinjatovo H. On Landau’s necessary density conditions for sampling and interpolation of band-limited functions. J. Lond. Math. Soc. 1996;54(3):557–565. [Google Scholar]
- 14.Shapiro HS, Silverman RA. Alias-free sampling of random noise. J. Soc. Ind. Appl. Math. 1960;8(2):225–248. [Google Scholar]
- 15.Beutler FJ. Error-free recovery of signals from irregularly spaced samples. Soc. Ind. Appl. Math. 1966;8(3):328–335. [Google Scholar]
- 16.Beutler F. Alias-free randomly timed sampling of stochastic processes. IEEE Trans. Inf. Theory. 1970;16(2):147–152. [Google Scholar]
- 17.Cook, R.L.: Stochastic sampling in computer graphics. ACM Trans. Graph. 6(1), 51–72 (1986)
- 18.Venkataramani R, Bresler Y. Optimal sub-Nyquist nonuniform sampling and reconstruction for multiband signals. IEEE Trans. Signal Process. 2001;48(10):2301–2313. [Google Scholar]
- 19.Hajar M, El Badaoui M, Raad A, Bonnardot F. Discrete random sampling: theory and practice in machine monitoring. Mech. Syst. Signal Process. 2019;123:386–402. [Google Scholar]
- 20.Jia, M., Wang, C., Ting Chen, K., Baba, T.: An non-uniform sampling strategy for physiological signals component analysis. In: Digest of Technical Papers—IEEE International Conference on Consumer Electronics (ICCE), Las Vegas, NV, USA. pp. 526–529 (2013)
- 21.Maciejewski MW, Qui HZ, Mobli M, Hoch JC. Nonuniform sampling and spectral aliasing. J. Magn. Reson. 2009;199(1):88–93. doi: 10.1016/j.jmr.2009.04.006. [DOI] [PMC free article] [PubMed] [Google Scholar]
- 22.Wu T, Dey S, Chen Mike Shuo-Wei. A nonuniform sampling ADC architecture with reconfigurable digital anti-aliasing filter. IEEE J. Sel. Top. Signal Process. 2016;63(10):1639–1651. [Google Scholar]
- 23.Czyż K. Nonuniformly sampled active noise control system. IFAC Proc. Vol. 2004;37(20):351–355. [Google Scholar]
- 24.Wang, D., Liu, X., Wu, X., Wang, Z.: Reconstruction of periodic band limited signals from non-uniform samples with sub-Nyquist sampling rate. Sensors. 20(21) (2020) [DOI] [PMC free article] [PubMed]
- 25.Zeevi YY, Shlomot E. Nonuniform sampling and antialiasing in image representation. IEEE Trans. Signal Process. 1993;41(3):1223–1236. [Google Scholar]
- 26.Mitchell DP. Generating antialiased images at low sampling densities. ACM SIGGRAPH Comput. Graph. 1987;21(4):65–72. [Google Scholar]
- 27.Mitchell, D.P.: The antialiasing problem in ray tracing. In: SIGGRAPH 90 (1990)
- 28.Maymon S, Oppenheim AV. Sinc interpolation of nonuniform samples. IEEE Trans. Signal Process. 2011;59(10):4745–4758. [Google Scholar]
- 29.Hennenfent G, Herrmann FJ. Seismic denoising with nonuniformly sampled curvelets. Comput. Sci. Eng. 2006;8(3):16–25. [Google Scholar]
- 30.Christensen, P., Kensler, A., Kilpatrick, C.: Progressive multi-jittered sample sequences. Computer Graphics Forum. 37, 21–33 (2018)
- 31.Bretthorst, G.L.: Nonuniform Sampling: Bandwidth and Aliasing. AIP Conf. Proc. 567(1), 1–28 (2001)
- 32.Gastpar M, Bresler Y. On the necessary density for spectrum-blind nonuniform sampling subject to quantization. Proc. IEEE Int. Conf. Acoust. Speech Signal Process. 2000;1:348–351. [Google Scholar]
- 33.Shlomot, E., Zeevi, Y.Y.: A nonuniform sampling and representation scheme for images which are not bandlimited. In: The Sixteenth Conference of Electrical and Electronics Engineers in Israel Tel-Aviv, Israel. 1–4 (1989)
- 34.Penev, P.S., Iordanov, L.G.: Optimal estimation of subband speech from nonuniform non-recurrent signal-driven sparse samples. In: IEEE International Conference on Acoustics, Speech and Signal Processing Proceedings, Salt Lake City, UT, USA. 2, 765–768 (2001)
- 35.Wisecup RD. Unambiguous signal recovery above the Nyquist using random-sample-interval imaging. Geophysics. 1998;63(2):331–789. [Google Scholar]
- 36.Cary, P.W.: 3D Stacking of Irregularly Sampled Data by Wavefield Reconstruction. SEG Technical Program Expanded Abstracts (1997)
- 37.Han, K., Wei, Y., Ma, X.: An efficient non-uniform filtering method for level-crossing sampling. In: IEEE International Conference on Digital Signal Processing (2016)
- 38.Koh J, Lee W, Sarkar TK, Salazar-Palma M. Calculation of far-field radiation pattern using nonuniformly spaced antennas by a least square method. IEEE Trans. Antennas Propag. 2013;62(4):1572–1578. [Google Scholar]
- 39.Bechir, D.M., Ridha, B.: Non-uniform sampling schemes for RF bandpass sampling receiver. In: International Conference on Signal Processing Systems, Singapore, 3–17 (2009)
- 40.Lee, H., Bien, Z.: Sub-Nyquist nonuniform sampling and perfect reconstruction of speech signals. In: TENCON 2005-2005 IEEE Region 10 Conference, Melbourne, VIC, Australia, 1–6 (2005)
- 41.Hennenfent G, Herrmann FJ. Simply denoise: wavefield reconstruction via jittered undersampling. Geophysics. 2008;73(3):V19–V28. [Google Scholar]
- 42.Bellhouse DR. Area estimation by point-counting techniques. Biometrics. 1981;37(2):303–312. [Google Scholar]
- 43.Cook, R.L., Porter, T., Carpenter, L.: Distributed ray tracing. ACM SIGGRAPH Computer Graphics. 18(3), 137–145 (1984)
- 44.Dobkin DP, Eppstein D, Mitchell DP. Computing the discrepancy with applications to supersampling patterns. ACM Trans. Graph. 1996;15(4):354–376. [Google Scholar]
- 45.Katznelson Y. An Introduction to Harmonic Analysis. 3. Cambridge: Cambridge University Press; 2004. [Google Scholar]
- 46.Boche H, Calderbank R, Kutyniok G, Vybíral J. Compressed Sensing and Its Applications. Basel: Birkhäuser; 2013. [Google Scholar]
- 47.Foucart S, Rauhut H. A Mathematical Introduction to Compressive Sensing. Basel: Birkhäuser; 2013. [Google Scholar]
- 48.Pfander GE. Sampling Theory, a Renaissance. Basel: Birkhäuser; 2015. [Google Scholar]
- 49.Keiner, J., Kunis, S., Potts, D.: Using NFFT 3—a software library for various non-equispaced fast Fourier transforms. ACM Trans. Math. Softw. 36, 19:1–19:30 (2008)
- 50.Greengard L, Lee J. Accelerating the nonuniform fast Fourier transform. Appl. Comput. Harmon. Anal. 2004;35:111–129. [Google Scholar]
- 51.Strohmer T. Numerical analysis of the non-uniform sampling problem. J. Comput. Appl. Math. 2000;122:297–316. [Google Scholar]
- 52.Margolis E, Eldar YC. Nonuniform sampling of periodic bandlimited signals. IEEE Trans. Signal Process. 2008;56(7):2728–2745. [Google Scholar]
- 53.Rauhut H. Stability results for random sampling of sparse trigonometric polynomials. IEEE Trans. Inf. Theory. 2008;54(12):5661–5670. [Google Scholar]
- 54.Rauhut, H.: Compressive sensing and structured random matrices. Theoretical Foundations and Numerical Methods for Sparse Recovery, edited by Massimo Fornasier, Berlin, New York: De Gruyter. 1–92 (2010). 10.1515/9783110226157.1
- 55.Oberhettinger F. Fourier Transforms of Distributions and Their Inverses: A Collection of Tables. Cambridge: Academic Press; 1973. [Google Scholar]
- 56.Krahmer F, Ward R. Stable and robust sampling strategies for compressive imaging. IEEE Trans. Image Process. 2014;23(2):612–622. doi: 10.1109/TIP.2013.2288004. [DOI] [PubMed] [Google Scholar]
- 57.López, O.: Embracing Nonuniform Samples (T). University of British Columbia (2019). Retrieved from https://open.library.ubc.ca/collections/ubctheses/24/items/1.0380720. Accessed on 1 Sep 2022
- 58.Grant, M., Boyd, S.: CVX: Matlab software for disciplined convex programming, version 2.0 beta. (2013). http://cvxr.com/cvx. Accessed on 1 Mar 2023
- 59.Grant, M., Boyd, S.: Graph implementations for nonsmooth convex programs. In: Recent Advances in Learning and Control (A Tribute to M. Vidyasagar). Lecture Notes in Control and Information Sciences, pp. 95–110. Springer, Berlin (2008). http://stanford.edu/~boyd/graph_dcp.html
- 60.Pippig M, Potts D. Parallel three-dimensional non-equispaced fast Fourier transforms and their applications to particle simulation. SIAM J. Sci. Comput. 2013;35(4):C411–C437. [Google Scholar]
- 61.Baraniuk, R., Choi, H., Fernandes, F., Hendricks, B., Neelamani, R., Ribeiro, V., Romberg, J., Gopinath, R., Guo, H., Lang, M., Odegard, J.E., Wei, D.: Rice Wavelet Toolbox. [Online] (2001). https://www.ece.rice.edu/dsp/software/rwt.shtml. Accessed 13 June 2019
- 62.López, O., Kumar, R., Yılmaz, Ö., Herrmann, F.J.: Off-the-grid low-rank matrix recovery and seismic data reconstruction. IEEE J. Sel. Top. Signal Process. 10(4) 658–671 (2016)
- 63.Adcock B, Hansen A. Compressive Imaging: Structure, Sampling, Learning. Cambridge: Cambridge University Press; 2021. [Google Scholar]
- 64.Tropp J. User-friendly tail bounds for sums of random matrices. Found. Comput. Math. 2012;12:389–434. doi: 10.1007/s10208-011-9099-z. [DOI] [Google Scholar]
Associated Data
This section collects any data citations, data availability statements, or supplementary materials included in this article.
Data Availability Statement
Not applicable