

Abstract
Melanoma is the most lethal of all skin cancers. This necessitates the need for a machine learning-driven skin cancer detection system to help medical professionals with early detection. We propose an integrated multi-modal ensemble framework that combines deep convolution neural representations with extracted lesion characteristics and patient meta-data. This study intends to integrate transfer-learned image features, global and local textural information, and patient data using a custom generator to diagnose skin cancer accurately. The architecture combines multiple models in a weighted ensemble strategy, which was trained and validated on specific and distinct datasets, namely, HAM10000, BCN20000 + MSK, and the ISIC2020 challenge datasets. They were evaluated on the mean values of precision, recall or sensitivity, specificity, and balanced accuracy metrics. Sensitivity and specificity play a major role in diagnostics. The model achieved sensitivities of 94.15%, 86.69%, and 86.48% and specificity of 99.24%, 97.73%, and 98.51% for each dataset, respectively. Additionally, the accuracy on the malignant classes of the three datasets was 94%, 87.33%, and 89%, which is significantly higher than the physician recognition rate. The results demonstrate that our weighted voting integrated ensemble strategy outperforms existing models and could serve as an initial diagnostic tool for skin cancer.
Supplementary Information
The online version contains supplementary material available at 10.1007/s10278-023-00837-6.
Keywords: Skin lesion detection, Ensemble strategy, Custom generator, Multi-modal learning, Textural feature extraction
Introduction
Overexposure to the sun’s UV radiation can result in the growth of skin lesions, which are aberrant skin cells. According to the WHO, one-third of cancer diagnoses are skin cancer, with melanoma being the most severe form. Fortunately, if the melanoma is detected early, the 5-year survival rate is 95%, as stated by the WHO. However, if the infection spreads to lymph nodes, the survival rate drops to 63% and decreases to 20% if it reaches the inner layers of the skin.
As the number of cases and mortality rates continues to rise, the importance of early detection of melanoma is becoming more and more evident. The three most common types of skin cancer are basal cell carcinoma, squamous cell carcinoma, and melanoma. Symptoms of skin cancer can include a growing bump on the skin, a patch that will not heal, a lump or scaly patch on the skin, or a change in the shape, or color of a mole. Diagnosing skin cancer at the earliest is essential in order to stop it from spreading and to make sure it can be treated successfully.
Visual inspection by dermatologists and dermoscopic devices are used to identify skin lesions. Additionally, histopathological methods are recommended for their accuracy; however, this is an expensive and time-consuming medical procedure. The advancements in artificial intelligence and medical image processing techniques call for the automation of skin lesion diagnosis with the help of high-resolution dermoscopic images. The International Skin Imaging Collaboration (ISIC) competitions hosted by Society for Imaging Informatics in Medicine (SIIM), held annually since 2016, encourages researchers from around the world to work towards robust skin cancer detection solutions. Besides the yearly grand challenges, ISIC also runs regular live challenges where researchers and students can measure the performance of their algorithms using ISIC image repositories.
The wide range of skin types and the complexity of diagnosis make it necessary for a computerized system that can help physicians to treat skin cancer patients. More than two thousand varieties of skin cancer have been identified; the supplemental material presents the hierarchy of the most common lesions (Fig. S1). These cancers can be divided into two categories: benign and malignant. Benign growths are non-cancerous and generally look like freckles or rashes. Malignant lesions, on the other hand, are cancerous and grow quickly in an irregular shape. Physicians use certain standard protocols such as the ABCDE rule [1], which looks at asymmetry, border, shape, color, diameter, and evolution from patient history, or the CASH rule [2], which assesses color, architecture, shape, as well as homogeneity of the lesion, to diagnose skin lesions. Another standard protocol, Glasgow’s 7-point checklist [3], looks at changes in size, shape irregularity, and infection on a seven-point scale.
The last 10 years have seen a heightened emphasis on early skin cancer detection. Table 1 reviews various models published in reputed journals. The use of digital dermoscopic images for diagnostic automation has been impacted by traditional therapy strategies based on clinical dermoscopic and lesion identification standards. For instance, in [4], and [5], clinical features were scraped from afflicted areas of dermoscopic lesion images for training different machine learning classifiers to facilitate automated diagnosis. Furthermore, texture features from grayscale images of skin cancers and other conventional features [6] have been used to capture texture differences. The accuracy metric is mostly chosen for evaluating the models, which could not be ideal when dealing with imbalanced datasets. According to Hameed et al. [7], the complexity of classifiers increases with their capability to recognize classes.
Table 1.
Related literature in automated skin lesion detection
| Reference | Dataset | Machine learning model | Results |
|---|---|---|---|
| Zghal and Derbel (2020) [5] | PH2 | ABCDE features and total value calculation | Sensitivity (87.50%) |
| Ghalejoogh et al. (2020) [6] | PH2 | Ensemble of SVM, KNN, and MLP | Sensitivity (94.00%) |
| Yilmaz et al. (2022) [9] | BCN20000 | Transfer learning with XceptionNet | Sensitivity (89.99%) |
| Hameed et al. (2020) [7] | ISIC2016, PH2 | AlexNet | Sensitivity (87.21%) |
| Kassem et al. (2020) [8] | 1912 images of ISIC2019 | GoogleNet | Sensitivity (79.80%) |
| Nahata and Singh (2020) [10] | 5000 images of ISIC2018 | Transfer learning on pre-trained architectures | Accuracy (91.00%) |
| Gessert et al. (2018) [11] | ISIC2018 | Ensembles of DenseNet, ResNeXt, and ResNeXt | Balanced accuracy (85.10%) |
| Xin et al. (2022) [12] | ISIC2018 | Vision attention transformers | Balanced accuracy (94.10%) |
| Gessert et al. (2020) [13] | ISIC2019, Derm7pt | Ensembles of ResNeSt, SEResNeXt, and EfficientNets | Sensitivity (74.20%) |
| Monika et al. (2020) [4] |
800 images of ISIC2019 |
Ensemble of SVM predictions | Accuracy (96.25%) |
| Benyahiya et al. (2022) [14] | ISIC2019, PH2 | Ensembles of DenseNet + KNN and cubic SVM | Accuracy (91.71%) |
| Ha et al. (2020) [15] | ISIC2020, ISIC2019, ISIC2018 | Ensembles of EfficientNets, ResNest101, and SEResNeXt | AUC (94.90%) |
| Qureshi and Ross (2022) [16] | ISIC2020 | Ensembles of 6 custom CNNs + SVM | AUC (85.25%) |
| Adepu et al. (2023) [17] | ISIC2020 | Ensembles of EfficientNetB2 and EfficientNetB5 | AUC (92.95%) |
| Teodoro et al. (2022) [18] | ISIC2020, ISIC2019 | EfficientAttentionNet | AUC (96.02%) |
Deep learning architectures are well-recognized for their great degree of layer-deep accuracy, which enables them to efficiently represent the fundamental characteristics of data. Leveraging information from previously trained models speeds up this process even further, which reduces the complexity of tweaking hyperparameters for a new network. Kassem et al. [8] fine-tuned GoogLeNet on ISIC2019 challenge data, Yilmaz et al. [9] explored XceptionNet, and Nahata and Singh [10] transfer-learned various pre-trained models to identify the best existing model for skin lesion detection. Furthermore, researchers have incorporated metadata from the dataset to improve detection rates, often done using DenseNets.
Several studies have demonstrated the effectiveness of ensemble approaches for combining predictions from trained models to maximize productivity and lower uncertainty in the results [17]. By augmenting the image dataset and training an ensemble of networks in a threefold validation procedure, Ha et al. [15] were able to win the ISIC2020 competition.
Nevertheless, detecting more specific lesion types than benign or malignant ones is necessary in real-life settings. Gessert et al. [13] won the ISIC 2019 challenge by integrating substantial data augmentation and loss balancing with several networks. They also detail the entry that won second place in the 2018 challenge in [11]. They combined several networks with an unscaled dataset and a fivefold cross-validation approach for detailed feature extraction. Pre-trained models have also been utilized as a feature extractor in Qureshi and Ross [16] and Benyahia et al. [14], with machine learning classifiers such as KNN and SVM used as the static classifiers. To circumvent the limitation of insufficient data in most studies, it is usually suggested to aggregate multiple existing pre-trained models on multiple datasets, such as [15] and [13], to address the issue of inadequate data in most research. General adversarial networks (GANs) are also widely used to generate synthetic sample data for classes with lesser representation in order to develop a precise yet insensitive model in order to address the data insufficiency [18, 19].
The diagnosis of melanoma poses several obstacles, as well as opportunities, due to the high interclass similarities. Pre-trained models have been found to outperform traditional machine learning techniques in this domain. To maximize the potential of each model, multiple neural networks can be combined to utilize their individual strengths. It could also be a tedious task to identify features in valuable images. As skin cancer is often indicated by minor shifts in skin texture, color, and other characteristics, it can be tricky to record these distinctions precisely. A combination of deep learning and signal processing techniques, incorporating handcrafted features from images as metadata, may prove effective in overcoming the challenges and yielding powerful results. Additionally, selecting an appropriate metric for use with imbalanced data is pivotal, as incorrect metrics may lead to unreliable results.
To this end, we designed an autonomous skin lesion diagnosis model that can effectively and accurately identify even the most uncommon forms of skin cancer. This approach integrates deep learning techniques with textural patterns and patient-specific metadata to create powerful representations of skin lesions. We developed an architecture that employs a weighted ensemble technique that combines multiple models, which was trained and assessed on specific datasets to establish its effectiveness.
Contributions of the study could be summarized as follows:
We propose the architecture of an integrated multi-modal ensemble framework that combines deep convolution neural representations with handcrafted textural features and patient metadata.
A custom generator is designed capable of combining image data and textural descriptors extracted from the images, as well as patient-centric metadata for training and testing the model.
Comprehensible performance of the proposed approach is achieved on benchmark skin cancer datasets, namely, HAM10000, BCN20000 + MSK, and ISIC2020.
The grid-searched weighted ensemble approach proves efficient in all datasets tested with a marginal gain of at least 4% in model sensitivity.
Materials
This research attempts to create an integrated system of networks that would use image data, lesion-specific textural features, and patient-centric information to diagnose skin lesions. We compared the model’s performance by using the well-known and published skin cancer datasets HAM10000 [20], BCN20000 [21], MSK [22], and ISIC2020 [23]. Each of these datasets, published as part of the repository in the International Skin Imaging Collaboration (ISIC) challenge, also has associated patient metadata. The ISIC challenge stimulates global cooperation and development in the domain of skin imaging for the automated analysis of dermoscopic lesion images. The datasets were trained and validated separately to determine the model’s accuracy.
Analysis of Data
Table 2 provides the specifications of the repositories used in this study. The HAM10000 dataset, also the ISIC2018 challenge dataset, contains 10,015 images from 7 classes of skin lesions, 5 benign and 2 cancerous. Actinic keratosis (AKIEC), dermatofibroma (DF), benign keratosis (BKL), melanocytic nevus (NV), and vascular lesions (VASC) are among the benign groups. Melanoma (MEL), basal cell carcinoma (BCC), and squamous cell carcinoma (SCC) are among the malignant classes. This dataset also comes with ground truth masks for lesion segmentation. ISIC2019 is made up of 25,331 images taken from the HAM10000, BCN20000, and MSK datasets, all of which are well-established collections of dermoscopic cancer images from renowned cancer centers worldwide. For this experiment, we acquired only the BCN20000 and MSK sections of the ISIC2019 challenge, which consisted of 15,316 images and related metadata. In addition to the categories from ISIC2018, ISIC2019 also has an extra category for squamous cell carcinoma (SCC). ISIC2020 challenge dataset is a comprehensive dataset of dermoscopic images of skin lesions from more than 25,000 patients comprising 33,126 diagnostic images belonging to one of two classes, benign or malignant. ISIC2020 resembles the diagnosis cases in a medical setting where the diagnosis of fatal malignant cancers is sparse.
Table 2.
Distribution of images in selected datasets
| Dataset | Benign | Malignant | ||||||
|---|---|---|---|---|---|---|---|---|
| ISIC2020 | 32543 | 584 | ||||||
| Classes | AKIEC | BKL | DF | NEVI | VASC | BCC | MEL | SCC |
| HAM10000 | 130 | 1099 | 115 | 6705 | 142 | 512 | 1113 | 197 |
| BCN20000 | 737 | 1138 | 124 | 4206 | 111 | 2809 | 2857 | 431 |
| MSK | - | 387 | - | 1964 | - | - | 552 | - |
The images come in the.jpeg format, with storage sizes ranging from 100 through 600 KB and dimensions from 600 × 450 to 1024 × 1024. We divided the datasets into a 90:10 proportion for training, and testing. The train set was subjected to threefold cross-validations to avoid any chances of over-fitting. An immense discrepancy between the two datasets was noticed, with more than 50% of the data falling within the category of melanocytic nevus (NEVI). 66.6% of HAM10000 comprises the NEVI benign data, while it was 50.7% in BCN20000 + MSK. In ISIC2020, the benign lesions covered 98.12% data. This implies that a model that classifies the entire test data as the most frequent class would still be misinterpreted as an accurate system, when it is not.
Analysis of Metadata
All datasets have patient details and specifics of the lesion associated with the dataset. There are many null values in the metadata since there are no standards for gathering information. For the model to operate well, we took steps to identify and pre-process such dispensed data. Figure 1 illustrates the proportion of cancer cases under various categories of attribute values for the three datasets. Patients of all ages, regardless of gender, develop skin cancer in various anatomical sites on the body. We have observed that most of the cancerous cases belonged to the age group of adults, specifically those above 35 years of age. Gender dominance was least noted irrespective of the category they belong to (Fig. S2). Although not with great confidence, most cases in HAM10000 occurred in the back site. A similar observation from the BCN20000 + MSK and ISIC2020 dataset was deduced where most lesions appeared in anterior torso or simply torso in ISIC2020, where the site is equivalent to the attribute back. A noticeable set of unknown values representing missing values was also observed.
Fig. 1.

Influence of age and anatomical locations on the classification of patients in the HAM10000, BCN20000 + MSK, and ISIC2020 metadata
Research has demonstrated the great potential of combining patient information with images. Networks can take a whole image and shrink it into its most basic components, while textural features are more analogous to how humans approach issues. Metadata from the patient, however, adds an entirely different dimension. This metadata helps avoid over-fitting, which can result from the extensive training of only the image data. Furthermore, a doctor’s diagnosis would always involve patient information, so it stands to reason that the metadata would improve the functioning of machine learning models.
Methodology
An integrated ensemble approach is proposed combining signal processing techniques of feature extraction and deep neural learning into a unified system. Textural characteristics from skin lesion images and the clinical patient information from the dataset were trained together with the corresponding images as a single unit.
A schematic outline of the integrated skin lesion diagnosis model is presented in Fig. 2. EfficientNets are used to convert the images into abstract representations known as feature maps, which are then pooled and processed with batch normalization and dropout layers to prevent over-fitting. The classification layers further receive the flattened feature maps. Simultaneously, the raw images are processed to handcraft textural features globally and locally from segmented regions of interest. The GLCM (gray level co-occurrence matrix) statistics and LBP (local binary pattern) values are acquired from the lesions segmented using a UNet segmentation architecture. Each image had a total of 21 distinct characteristics extracted from it. Additionally, we identified and pre-processed significant attributes from the patient-centric metadata file. A custom generator combines the three feature extractors to produce representation feature maps and a single vector of feature values. The neural network classifier takes in the shuffled data generated by the custom generator and processes them separately in parallel. The output representation vectors are combined to a single vector and passed across a two-layered, fully linked multi-layer network. The softmax activation of the last layer yields the probability with which the data belongs to a particular category. The estimates from several models that employed various EfficientNets backbones were fused with the weighted voting ensemble method.
Fig. 2.

Architecture of the proposed integrated ensemble machine learning model
Deep Feature Extractor
To extract deep features from raw images, we utilized the pre-trained convolutional neural network EfficientNets [24], published by Google in 2019. They were fine-tuned for each of the three specific datasets HAM10000, BCN20000 + MSK, and ISIC2020. The EfficientNets models come in different sizes, depths, widths, resolutions, and compute requirements, with the larger models having more layers and parameters than the smaller models.
The model’s size, depth, width, resolution, and compute all affect its performance. This network utilizes a compound scaling technique to adjust the depth d, width w, and resolution r scaling factors of the network, which is represented by a single coefficient θ. The value of θ is determined such that , where 1. The final layers of EfficientNetB4, EfficientNetB5, EfficientNetB6, and EfficientNetB7 were removed, replacing them with a global averaging layer, followed by regularizations with batch normalization and dropout layers. The higher variations of EfficientNets showed an increase in space and temporal complexity.
Texture Feature Extractor
Lesion-specific textural features were extracted from the dermoscopic images to assist the learning procedure. This process entailed locating and pulling out significant global and local textural patterns from the identified region-of-interest (RoI).
RoI Segmentation
The images were initially pre-processed to diminish distortions and improve those features essential to the application. The dull razor hair removal was utilized to eliminate skin hair that might obstruct efficient feature extraction [25]. This method begins with a black hat transformation to detect small components in the image. After that, a morphological closing is performed with a 5 × 5 structuring element, and the outcome is then subtracted from the original image. The result is employed to find a threshold that will be used to differentiate the highlighted objects from the background. The black hat transformed output is then subjected to a binary threshold with binary 1 s indicating the hair segments and binary 0 s denoting skin portions and affected regions. Lastly, using a 3 × 3 mask, the nearby pixels from the raw image are inpainted to patch in the masked portions. This technique was used to extract lesion-specific textural features which can help the classification process.
We trained a UNet model [26] with an encoder and decoder, having five blocks of convolution and pooling layers, each followed by rectified linear units. Also, skip connections were employed to bring past encoder layer knowledge into the decoder levels. Adam optimizer was used at a learning rate = 0.001 to optimize the network. The binary cross-entropy cost function was used to compute the error between the predicted intensity masks and the ground truth masks. We used the masks associated with HAM10000 in an 80:20 split to train the custom UNet. Since the other datasets had no corresponding ground truth masks, we used the trained UNet model to construct masks for the other datasets. To evaluate the performance of the UNet, intersection over union (IoU) was tracked. IoU is calculated as the ratio of correctly predicted pixels to the entire prediction mask area.
Gray Level Co-occurrence Matrix (GLCM)
The algorithm assesses an image’s textural properties [27]. It is a histogram of gray level pixel elements that occur at a predefined offset. Relationships between the co-occurring pixel pairs are evaluated as the statistical feature values. Since non-cancerous skin lesions exhibit similar textural characteristics, we set the offset distance as 1, and the angle at which the pixel correlations are investigated is set to 0, π/2, π, and 3π/2. The correlation matrices corresponding to all four directions of the gray-converted image were computed. The regularity that a pixel intensity x co-occurs with pixel intensity y in the axis φ at dist represents (x, y). The size of GLCM is G × G provided the gray level scale is [0, 2G]. For the 8-bit skin lesion images, the grayscale was [0, 255].
| 1 |
Further, the matrix was normalized such that the sum of cell values in the matrix adds up to 1 (Eq. 1). Five second-order statistics were measured from the normalized co-occurrence matrix P. Contrast measures the degree of difference in intensities among all pixels and their pairs. While dissimilarity is the value corresponding to the difference in distance between a pixel and its pair, homogeneity is the compactness of the value distribution in the co-occurrence matrix towards the matrix diagonal. Energy defines the sum of squared elements in the co-occurrence matrix. Correlation is a metric for how closely a pixel connects to its pair throughout the image.
| 2 |
| 3 |
| 4 |
| 5 |
| 6 |
where represents the average occurrence of pixel intensities over the image. is the variance of value distribution in the GLCM matrix about the mean . The mean and standard deviation could be calculated separately with reference to the initial pixel x and the pair pixel y as , , , and . Due to the symmetric nature of GLCM, the mean and standard deviations calculated for x and y are equal.
| 7 |
where ,, ,, and were separately computed using Eqs. (2) to (6) for all the co-occurrence matrices (i.e., about the angles φ = 0, π/2, π, 3π/2). Averaging the statistics over all co-occurrence matrices recorded the approximation of each attribute (Eq. 7).
Local Binary Pattern (LBP)
Local binary patterns [28] are a textural feature extraction method used to describe and characterize various features in an image. LBP uses a binary image to capture the texture of an image by analyzing the spatial relationships between pixels. The method is based on local patterns in the binary form, a set of binary codes generated from the neighborhood of a single pixel.
| 8 |
The basic idea behind LBP is to compare the intensity values of a pixel to its surrounding pixels in a specified window. A binary code l(pos) is assigned to each pixel in the window to extract the LBP features. If the intensity of a pixel x(pos) is greater than that of the central pixel x(c) in the window, a “1” is assigned to the pixel position l(pos), while a “0” is assigned if the intensity is less than x(c). Sliding the window over the input image generates a decimal value LBP(c) for each pixel in the image.
Once the codes are assigned to all pixels in the image to produce a pattern map LBP of the exact resolution as that of the input image, a histogram is generated to represent the distribution of the binary codes. To reduce the number of frequency bins in the histogram, LBP is quantized and thresholded to 16 grayscales.
Likewise, each pixel represents one of 16 grayscales uniformly ranging from [0,255]. The histogram is a representation of the textural features of the image, which can then be used for further analysis. As all the outputs have been determined, the results are combined into a single binary pattern. The bin values were further normalized to [0, 1].
The binary pattern can then describe various textural features in the image. For example, if there is a lot of contrast between the surrounding pixels and the central pixel, the pattern will be more complex, and the textural feature will be more pronounced. On the other hand, if the surrounding pixels have similar intensities to the central pixel, then the pattern will be simpler, and the textural feature will be less pronounced.
Metadata Feature Extractor
Various data wrangling, cleaning, and pre-processing techniques were employed to prepare metadata for the training and testing phases. This included feature selection, handling of missing values, and metadata encoding. Unimportant characteristics were eliminated from the metadata of the three datasets, including lesion_id, gender, and diagnosis type. Maximum frequency imputation and mean substitution [29] procedures were used to address null data in categorical and numerical attributes, respectively. While the former replaces null members with the most frequently occurring attribute value, the latter is assigned through mean replacement of the average of all attribute values in the missing cells. When it came to categorical data, one-hot encoding was utilized, which resulted in the creation of extra columns depending on the distinct categories. One-hot encoding codes a binary 1 denoting the presence of an attribute value and 0 denoting the absence of all other categories.
Custom Data Generator
The human brain attempts to link data gathered from different senses in order to assess a given situation. A network design that can process numerous input data from the same origin is applied using a similar concept. It is anticipated to perform better than similar systems using a single input. Consequently, we designed a multiple input model receiving image content together with quantitative values such as textural and metadata to give out specific lesion classifications.
The specific classifier required scripting of a custom data generator that accepted a data file comprising paths to data and generated batches of images, their corresponding feature vectors, and the ground truth labels. Algorithm 1 ensured the simultaneous and robust flow of data through the classifier and enabled a steady learning curve with a multitude of shuffled and varied data. The generator could infinitely produce batches of size batch size by utilizing the path_file and raw metadata file containing paths to each image data point and patient-specific data such as lesion id and age. Each sample was processed, texture features were extracted, and the metadata file was manipulated simultaneously, with the treated information being added to designated data structures. These data structures were subsequently passed to the classifier. Since the generating process was never-ending, the training and testing stages had to be limited by a certain number of steps to cover all the data files at least once.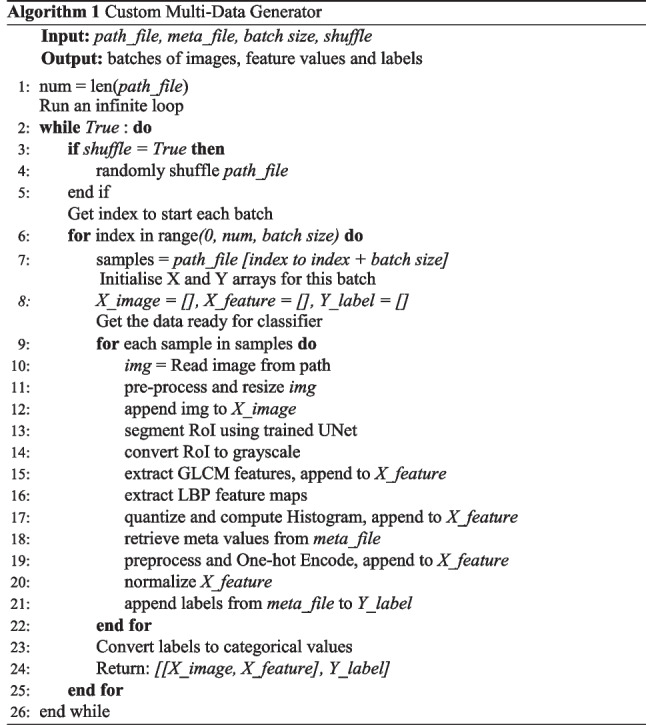
The textural descriptors were merged along with the pre-processed metadata to yield vectors of 36 values and 30 values for HAM10000 and BCN20000 + MSK, respectively, whereas ISIC2020 produced a vector of 28 features. The disparity in values is attributed to the inclusion of additional anatomical sites in the datasets. A model could be biased in favour of attributes with a broad range. To guarantee the equal contribution of all features, we normalized the feature set using min–max normalization.
The EfficientNets variants were trained with the pre-processed dermoscopic images to produce 1280 feature maps of resolution 7 × 7. A total of 1280 representation features were produced on passing through the global average pooling layer. The metadata was then converted to latent representations by a multi-layer perceptron with 512 neurons. To eliminate over-fitting mishaps, a 25% dropout was employed to generalize the metadata through to the trainable parameters. For the purpose of training the network, the customized generator created small batches of pre-processed and segmented images of skin lesions and the related feature descriptors. By setting shuffle to False and batch size to 1, a comparable custom test data generator was also initiated.
The feature vectors from the image training and feature vector branches were combined to train a pair of classifier layers. The first fully connected dense layer, with a 4% dropout rate, converted the (1280 + 512) input representations into 1024 lower representations. A subsequent dense layer activated by softmax was utilized to compute confidence scores for every class. Predictions were expressed in probability values and showed how likely the supplied data belonged to a certain class of skin lesions.
Weighted Grid-Search Voting Technique
The variance of neural networks can be high as the hyperparameters keep changing as the network is trained. To reduce variance and enhance the accuracy of the predictions, a weighted prediction ensemble is adapted to ensure the performance of the model by combining the predictions of multiple experiments through a voting procedure.
In the majority voting method, the prediction of an input data point is determined by the label with the greatest combined probability values of m models for n class labels. Weighted majority voting ensemble takes this one step further by assigning weights to each model based on the accuracy of their predictions. This is different from the regular majority voting since the prediction scores produced by each model are scaled with a weight factor (Eq. 9).
| 9 |
| 10 |
Before the voting procedure, a grid search is conducted to find the optimal set of model weights. All possible combinations of weights for the models are examined in a vector format, and the one that produces predictions with the highest confidence is identified. In addition, the weight combination that exhibits the best sensitivity or recall on validation data is evaluated and recorded (Eq. 10). The effectiveness of the ensemble strategy is determined during the model evaluation on the test set by weighing and combining the final predictions on .
Evaluation Metrics
We evaluated our model by computing the mean values of precision, recall, specificity, and balanced accuracy metrics across each lesion class as it is a multi-class problem (Eqs. 11 to 14). Confusion matrices determine the actual vs. predicted lesion classes determining true and false positives, as well as true and false negatives. In a binary categorization tasks, correctly predicted lesion classes are true positives and true negatives, while incorrectly predicted classes are false positives and false negatives. Accuracy is not an ideal metric due to the high imbalance in data. While precision determines the ratio of accurate positive predictions to the total number of positive predictions made, sensitivity, also known as recall or true positive rate, provides insight into the number of true positives misclassified as negatives.
| 11 |
| 12 |
| 13 |
| 14 |
Results
The proposed integrated ensemble approach was separately trained and tested on the 90:10 splits of HAM10000, BCN20000 + MSK, and ISIC2020. The validation splits were picked randomly from the train set, in threefold cohorts of cross-validation, so as to maintain variability and training consistency in the data seen and unseen during each epoch. The architecture comprising three distinct feature extraction modules was conjoined by the customized data generator and supplied to the classification entity. All experiments were developed and tested utilizing Python scripts version 3.11.1 running on NVIDIA Tesla V100-PCIE GPUs, hosted on a computing cluster with 1 Teraflop.
The training parameters of each model were set such that the hyperparameters were tuned for a total of 40 epochs with a 32 batch size. Initially, the model was transfer-learned for 10 epochs at a learning rate of 0.001 by freezing all layers except the classifier add-on layers. Thereafter, the preset number of layers is unfrozen as indicated in Table 3, and the network is further fine-tuned for yet another 30 epochs to capture data-intrinsic information within the neural network parameters. We changed the learning rate to half its original value if the validation loss failed to improve after three successive epochs. The Adam optimizer was adjusted with a starting step size of descent (α) of 0.001, and the beta_1 and beta_2 exponential decay rates were set to 0.9 and 0.999, respectively. Learning was monitored by minimizing the categorical cross-entropy loss function that measures the distance between the real and the estimated probability distributions.
Table 3.
Number of layers unfroze during fine-tuning
| Backbone network | Total layers | Unfreeze layers |
|---|---|---|
| EfficientNetB4 | 493 | 490 |
| EfficientNetB5 | 595 | 590 |
| EfficientNetB6 | 685 | 680 |
| EfficientNetB7 | 832 | 827 |
We used data augmentation to regularize the model and prevent over-fitting by applying a 0.1 factor of random translation, rotation, and horizontal flipping to each image. Class weights are introduced during the architecture training to address the enormous data imbalance in all datasets to balance the data as per Table 4. The model assigns a greater weight to the minority classes, keeping the data well-balanced.
Table 4.
Categorical class weights off the datasets
| Dataset → | HAM10000 | BCN20000 + MSK | ISIC2020 |
|---|---|---|---|
| Classes ↓ | |||
| AKIEC | 4.384 | 2.613 | - |
| BCC | 2.784 | 0.679 | - |
| BKL | 1.301 | 1.258 | - |
| DF | 12.437 | 15.705 | - |
| MEL | 1.285 | 0.559 | 28.552 |
| NV | 0.213 | 0.311 | 0.509 |
| SCC | - | 4.467 | - |
| VASC | 10.126 | 18.135 | - |
Model Learning and Evaluation
All of the images were altered to a size of 224 × 224 to make sure that comparisons between the different forms of EfficientNets were as accurate as possible. The dull razor hair removal technique pre-processed images before they were segmented using a personalized UNet architecture. We achieved an 83.27% IoU when training the UNet on the images and ground truth masks of HAM10000. The corresponding segmented masks were laid over the original image to get the RoI (i.e., infected areas).
Figure 3 illustrates the sequence of steps transpiring in the texture feature extractor segment of the custom generator. The raw images were initially altered using the black hat transform, from which a binary mask was generated by thresholding the intensified regions. This mask was subsequently inpainted onto the original images produced. This was then input to the trained custom UNet creating segmentation RoI masks, which, when superimposed on, created the segmented RoIs. In due course, 5 GLCM and 16 LBP textural features of the segmented RoIs were also extracted and stored along with the pre-processed metadata, resulting in 36, 30, and 28 meta-features for HAM10000, BCN20000 + MSK, and ISIC2020, respectively.
Fig. 3.

Pre-processing and segmentation procedures of skin lesions: (left to right) a raw dermoscopic images, b dull razor masks, c pre-processed and cleansed images, d estimated segmentation masks, e segmented regions of interest
We trained multiple models, each with a different variant of pre-trained EfficientNets, and observed their training and validation accuracies across all subsets of cross-validation. We used EfficientNets B4 to B7 variants as the backbone network and evaluated the models with data from each dataset separately.
The accuracy and loss curves in Fig. 4 illustrate how effectively the network generalizes on the training split and its behavior on unseen data as indicated by the validation accuracy. The individual train and validation curves across each of the three folds of cross-validation are presented in Figs. S3, S4 and S5 of the supplementary material. The results demonstrate that the validation aligns with the training, demonstrating that the model is not over-fitted to the train data. After 10 epochs, the model improved, indicating that the lesion images are effectively captured during fine-tuning. Additionally, the model has converged at around 30 epochs since the validation curve has stopped improving, after which any more training is likely unnecessary and would only increase the computational complexity.
Fig. 4.

Loss and accuracy curves from training of HAM10000, BCN20000 + MSK and ISIC2020 datasets
While the trade-off between the train and validation curves is fairly higher in the HAM10000 and BCN20000 + MSK experiments, the extreme curvature of the validation and train curves in the ISIC2020 experiment could be attributed to the 98% representation of the benign class in the dataset. The mean values of precision, recall, specificity, and the balanced accuracy of all experiments performed over the three datasets as well as the ideal weights for the individual models have been reported in Table 5. The confusion matrices corresponding to each of the three cohorts of cross-validation are illustrated in the supplementary file (Fig. S6).
Table 5.
Evaluation of the proposed integrated ensemble network
| W | Ensemble model | Mean precision | Mean recall | Mean specificity | Balanced accuracy | |
|---|---|---|---|---|---|---|
| HAM10000 | ||||||
| 0.2 | EfficientNetB4 + meta + texture | 86.81 | 84.31 | 96.99 | 90.65 | |
| 0.4 | EfficientNetB5 + meta + texture | 88.06 | 84.91 | 97.31 | 91.11 | |
| 0.5 | EfficientNetB6 + meta + texture | 86.79 | 84.70 | 96.97 | 90.84 | |
| 0.6 | EfficientNetB7 + meta + texture | 86.55 | 85.10 | 96.96 | 91.03 | |
| Majority voting | 94.07 | 90.57 | 97.02 | 93.79 | ||
| Weighted ensemble | 97.29 | 94.15 | 99.24 | 96.69 | ||
| BCN20000 + MSK | ||||||
| 0.7 | EfficientNetB4 + meta + texture | 84.67 | 82.39 | 97.40 | 89.89 | |
| 0.2 | EfficientNetB5 + meta + texture | 84.15 | 80.74 | 97.36 | 89.05 | |
| 0.1 | EfficientNetB6 + meta + texture | 83.83 | 81.34 | 97.31 | 89.35 | |
| 0.1 | EfficientNetB7 + meta + texture | 82.44 | 77.54 | 97.08 | 87.31 | |
| Majority Voting | 85.11 | 82.59 | 97.46 | 90.03 | ||
| Weighted ensemble | 86.63 | 86.69 | 97.73 | 92.21 | ||
| ISIC2020 | ||||||
| 0.1 | EfficientNetB4 + meta + texture | 99.31 | 62.06 | 97.23 | 79.64 | |
| 0.2 | EfficientNetB5 + meta + texture | 99.41 | 67.24 | 98.46 | 82.85 | |
| 0.0 | EfficientNetB6 + meta + texture | 99.34 | 63.79 | 97.69 | 80.74 | |
| 0.7 | EfficientNetB7 + meta + texture | 99.41 | 75.86 | 93.35 | 84.61 | |
| Majority Voting | 99.53 | 74.13 | 98.24 | 86.19 | ||
| Weighted ensemble | 99.64 | 86.48 | 98.51 | 92.49 | ||
In the HAM10000 dataset, the weighted ensemble model based on maximum tpr (sensitivity) achieved a mean precision of 97.29%, mean recall of 94.15%, and balanced accuracy of 96.69%. At the same time, the straightforward voting procedure was already better compared to the individual models. Greater sensitivity implies that the lesion classes with the least representations could be classified accurately. It is evident that the weighted ensemble model significantly outperforms the traditional voting approach and individual models, achieving greater than 3% improvement in all estimated measures of model performance. This implies that the network drastically impacts the identification of each class. Figure 5 shows the normalized and normal confusion matrix of the weighted majority voting technique based on maximum sensitivity. This matrix displays the percentage of predicted class labels of each category compared to the ground truth class labels. The most important criterion for a skin cancer detection model is detecting the cancerous classes (MEL and BCC). The model correctly classified 103 out of 112 Melanoma cases and 50 out of 52 BCC cases.
Fig. 5.

Normalized and normal confusion matrices and ROC curves of classification predictions on HAM10000 and BCN20000 + MSK test data
This framework also kept consistency in generalization, where all 7 classes could be identified with over-the-top precision and did not bias itself to the highest representing class (i.e., NV). The receiver operating characteristic (ROC) curve for the predictions using ensemble models as a one vs. all classes case is also graphed in Fig. 5. All curves crowd at the upper left corner indicating minimum trade-off between sensitivity and specificity in detection. The average area under curve (AUC) was computed to be about 99.32%.
For the experiments conducted on BCN20000 + MSK dataset, the maximum sensitivity ensemble strategy outscores the rest of the approaches by a small margin according to Table 5. The dataset is more challenging and varied with data from different centers around the world. This could be a reason for the deteriorating performance compared to the HAM10000 experiment. However, the results are more reliable, as it has a higher representation of the cancerous classes, covering ∼44% of the entire dataset. The sensitivity with which the ensemble model identifies the benign and malign classes of lesions are better and high compared to the individual experiments. In contrast, the simple ensemble voting strategy projected results quite close to the investigation using EfficientNetB4 as the backbone.
The normal and normalized confusion matrices, as well as the ROC curves of the ideal model, are represented in Fig. 5. Despite the reduced sensitivity towards Melanoma (MEL), the model revealed great promise in diagnosing cancerous skin conditions with 87.33% accuracy over the three malignant classes. Interestingly, it was noted how the model captures the dynamics of the categories with fewest representations (VASC and DF) in the dataset and the ones with huge representations (NEVI and MEL).
An average AUC was computed to be 98.76% across all classes. Overall, the model has demonstrated impressive capabilities in recognizing skin lesions of all categories with 92.21% balanced accuracy.
When training and testing the proposed strategy on the ISIC2020 dataset, which has the most imbalance and least variance, it was observed to generalize to a certain extent, however, much more than anticipated (Table 5). The dataset has a miniature representation of only 1.76% of the malignant class, with the rest being benign. The evaluation metrics of the model exhibit consistent values equivalent to the BCN20000 + MSK experiment. The reasonably high sensitivity or recall value of 86.48% shows the significance of the method in an actual medical setting where malignant cases are few during diagnosis. Figure 6 is an impression of the model predictions on the test data. Fifty two out of 58 malignant cases of a total of 3311 data points were rightly diagnosed with having the disease. The model has converged to generalize well on both classes with a balanced accuracy of 92.49% and AUC of 97.20%.
Fig. 6.

Normalized and normal confusion matrices and ROC curves of classification predictions on ISIC2020 test data
Discussion
The integrated multi-modal ensemble approach proposed in this model could potentially be an effective skin lesion classification method. On benchmark datasets, the model’s performance was considerably consistent. The discrepancy in performance may have been due to the different characteristics of the datasets, with BCN20000 + MSK and ISIC2020 being vastly varied, compared to the more uniform HAM10000.
To demonstrate the integrity of our work, we studied the model in comparison with pertinent literature by analyzing successful solutions submitted to the ISIC2018, ISIC2019, and ISIC2020 challenge in terms of sensitivity, specificity, accuracy, and the AUC metrics (Table 6). In [11], a score of 85.10% was achieved by utilizing a metadata combined ensemble model. The authors also excelled in the ISIC2019 scoreboard with an impressive tpr-tnr rate using a stacked EfficientNets ensemble [13].
Table 6.
Comparative study of proposed model with state-of-the-arts
| Technique | Dataset | Sensitivity | Specificity | Bal. Acc/AUC |
|---|---|---|---|---|
| HAM10000 | Bal. Acc | |||
| DenseNet + SENet + ResNeXt [11] | ISIC2018 | - | - | 85.10 |
| ResNet + Inceptionv3 [30] | ISIC2018 | 86.00 | - | 82.91 |
| Vision Transformer [12] | HAM10000 | 94.20 | - | 94.10 |
| MobileNet + handcrafted fea- | HAM10000 | 86.41 | 90.00 | 88.21 |
| tures [31] | ||||
| Proposed ensemble | 94.15 | 99.24 | 96.69 | |
| BCN20000 + MSK | Bal. Acc | |||
| EfficientNets + SENet + ResNeXt [13] | ISIC2019 | 74.20 | 98.31 | - |
| XceptionNet [9] | BCN20000 | - | 89.99 | 89.64 |
| ResNet + EfficientNetB3-B4 [32] | ISIC2019 | 50.20 | 96.40 | 90.50 |
| Proposed ensemble | 86.69 | 97.73 | 92.21 | |
| ISIC2020 | AUC | |||
| EfficientNets + SEResNeXt [15] | ISIC2020 | - | - | 94.90 |
| EfficientNetB2 + B5 [17] | ISIC2020 | 80.87 | - | 92.95 |
| CNN + SVM [16] | ISIC2020 | - | - | 85.25 |
| Proposed ensemble | 86.48 | 98.51 | 92.49 |
Xin et al. [12] utilized the attention mechanism of vision transformers in a contrastive learning environment for the study. The study conducted in [31] emphasized the need of incorporating lesion-specific information with a convolution neural learning model. The datasets were observed to be immensely cropped or replicated as a balancing strategy. However, Guissous [32] did not involve data balancing techniques. It is also essential to pre-process images before the feature extraction and augmentation steps. Experiments conducted without the pre-processing step on the HAM10000 had a drastic impact on extracting the global and local textural patterns from the images, as hair strands interfered with the segmented skin lesion portion. Results of the model showed a decline of over 4%, with a sensitivity, specificity, and accuracy of 89.34%, 97.12%, and 93.23%. The model still performed fairly well due to the support from EfficientNets and the pre-processed metadata during the training phase.
The winning solution achieved an AUC of 96%, being the evaluation criteria of the ISIC2020 challenge. Our solution also has a higher AUC of 97.20% compared to [17] and [16]. In [16], the authors attempted to learn features from multiple custom-made CNNs using an SVM machine learning classifier. Again, the lack of data balancing strategies was a downside to the method. The huge imbalance is an issue in the challenge that most entries could not address.
The results show that our model outperformed existing detection models. The addition of patient- and lesion-centric data to the model was significant in achieving higher accuracy in classification. It was remarkable to observe how metadata and custom features could be utilized to differentiate between skin cancer and non-cancerous lesions. We also noticed that the methodology scored higher on small datasets, precisely ISIC2018, which could be attributed to its heterogeneous composition. The model could predict the malignant classes with an impressive accuracy of 94%, 87.33%, and 89% on each dataset, respectively, which is much better than the rate at which melanoma is recognized clinically. The only downside is that some of the benign NEVI are wrongly classified as melanoma. Nevertheless, physicians can use the model as a helping tool for initial diagnosis.
Conclusion
This article discusses an integrated AI-based classification model for detecting skin cancers by harnessing the power of ensembles of networks with extracted textural components. The model combines transfer-learned image features, global and local textural information from the images, and pre-processed patient metadata using a custom generator. It was trained and tested on extremely unbalanced lesion-specific datasets, namely, HAM10000, BCN20000 + MSK, and ISIC2020. We have successfully implemented segmentation and texture feature extraction algorithms to extract strong representations from infected regions. Transfer learning and fine-tuning were performed in threefold cross-validation to further enhance performance. The weighted voting ensemble strategy outperformed existing models and shall be improved by experimenting with other ensemble techniques, such as integrated stacking and prediction blending. Also, testing the effectiveness of the suggested model using several imaging modalities, such as CT and MRI scans requiring a similar task, would be intriguing. This is a promising approach for skin lesion detection and classification, and further research should be conducted to further improve the model. Recently, there has been a risk of creating fraudulent medical information with the intention of defrauding insurance companies and causing misdiagnoses of patient ailments. Dermoscopy images are the most vulnerable to manipulation because of their imaging qualities. This is a major concern with severe legal and social consequences, making it a field that needs to be heavily researched.
Supplementary Information
Below is the link to the electronic supplementary material.
Acknowledgements
The authors would like to extend gratitude to all researchers and doctors affiliated with the Machine Intelligence Research (MIR) Laboratory for their support during each phase of this work. The authors also thank University of Kerala for providing the infrastructure required for the study.
Author Contribution
All authors contributed to the study conception and design. Material preparation, data collection, and analysis were performed by Misaj Sharafudeen. The first draft of the manuscript was written by Misaj Sharafudeen. Vinod Chandra SS reviewed and commented on previous versions of the manuscript. All authors read and approved the final manuscript.
Funding
This work was supported by University Grants Commission, India with NTA Ref. No.: 200510450932.
Availability of Data and Materials
The datasets are downloaded from the ISIC repository https://challenge.isic-archive.com/data/.
Code Availability
Declarations
Ethics Approval
This article does not contain any studies with human participants or animals performed by the author.
Consent to Participate
Not applicable.
Consent for Publication
Not applicable.
Competing Interests
The authors declare no competing interests.
Footnotes
Publisher's Note
Springer Nature remains neutral with regard to jurisdictional claims in published maps and institutional affiliations.
Contributor Information
Misaj Sharafudeen, Email: misaj@keralauniversity.ac.in.
Vinod Chandra S S, Email: vinod@keralauniversity.ac.in.
References
- 1.De Giorgi, V., Papi, F., Giorgi, L., Savarese, I., Verdelli, A.: Skin self-examination and the abcde rule in the early diagnosis of melanoma: is the game over? British Journal of Dermatology (1951) 168(6), 1370–1371 (2013) [DOI] [PubMed]
- 2.Henning JS, Dusza SW, Wang SQ, Marghoob AA, Rabinovitz HS, Polsky D, Kopf AW. The cash (color, architecture, symmetry, and homogeneity) algorithm for dermoscopy. Journal of the American Academy of Dermatology. 2007;56(1):45–52. doi: 10.1016/j.jaad.2006.09.003. [DOI] [PubMed] [Google Scholar]
- 3.Argenziano G, Fabbrocini G, Carli P, De Giorgi V, Sammarco E, Delfino M. Epiluminescence microscopy for the diagnosis of doubtful melanocytic skin lesions: comparison of the abcd rule of dermatoscopy and a new 7-point checklist based on pattern analysis. Archives of dermatology. 1998;134(12):1563–1570. doi: 10.1001/archderm.134.12.1563. [DOI] [PubMed] [Google Scholar]
- 4.Monika MK, Vignesh NA, Kumari CU, Kumar M, Lydia EL. Skin cancer detection and classification using machine learning. Materials Today: Proceedings. 2020;33:4266–4270. [Google Scholar]
- 5.Zghal NS, Derbel N. Melanoma skin cancer detection based on image processing. Current Medical Imaging. 2020;16(1):50–58. doi: 10.2174/1573405614666180911120546. [DOI] [PubMed] [Google Scholar]
- 6.Ghalejoogh GS, Kordy HM, Ebrahimi F. A hierarchical structure based on stacking approach for skin lesion classification. Expert Systems with Applications. 2020;145:113127. doi: 10.1016/j.eswa.2019.113127. [DOI] [Google Scholar]
- 7.Hameed N, Shabut AM, Ghosh MK, Hossain MA. Multi-class multi-level classification algorithm for skin lesions classification using machine learning techniques. Expert Systems with Applications. 2020;141:112961. doi: 10.1016/j.eswa.2019.112961. [DOI] [Google Scholar]
- 8.Kassem MA, Hosny KM, Fouad MM. Skin lesions classification into eight classes for isic 2019 using deep convolutional neural network and transfer learning. IEEE Access. 2020;8:114822–114832. doi: 10.1109/ACCESS.2020.3003890. [DOI] [Google Scholar]
- 9.Yilmaz A, Gencoglan G, Varol R, Demircali AA, Keshavarz M, Uvet H. Mobileskin: Classification of skin lesion images acquired using mobile phone-attached hand-held dermoscopes. Journal of Clinical Medicine. 2022;11(17):5102. doi: 10.3390/jcm11175102. [DOI] [PMC free article] [PubMed] [Google Scholar]
- 10.Nahata, H., Singh, S.P.: Deep learning solutions for skin cancer detection and diagnosis. Machine Learning with Health Care Perspective, 159–182 (2020)
- 11.Gessert, N., Sentker, T., Madesta, F., Schmitz, R., Kniep, H., Baltruschat, I., Werner, R., Schlaefer, A.: Skin lesion diagnosis using ensembles, unscaled multi-crop evaluation and loss weighting. arXiv preprint arXiv:1808.01694 (2018)
- 12.Xin C, Liu Z, Zhao K, Miao L, Ma Y, Zhu X, Zhou Q, Wang S, Li L, Yang F, et al. An improved transformer network for skin cancer classification. Computers in Biology and Medicine. 2022;149:105939. doi: 10.1016/j.compbiomed.2022.105939. [DOI] [PubMed] [Google Scholar]
- 13.Gessert N, Nielsen M, Shaikh M, Werner R, Schlaefer A. Skin lesion classification using ensembles of multi-resolution efficientnets with meta data. MethodsX. 2020;7:100864. doi: 10.1016/j.mex.2020.100864. [DOI] [PMC free article] [PubMed] [Google Scholar]
- 14.Benyahia, S., Meftah, B., L´ezoray, O.: Multi-features extraction based on deep learning for skin lesion classification. Tissue and Cell 74, 101701 (2022) [DOI] [PubMed]
- 15.Ha, Q., Liu, B., Liu, F.: Identifying melanoma images using efficient net ensemble: Winning solution to the siimisic melanoma classification challenge. arXiv preprint arXiv:2010.05351 (2020)
- 16.Qureshi, A.S., Roos, T.: Transfer learning with ensembles of deep neural networks for skin cancer detection in imbalanced data sets. Neural Processing Letters, 1–19 (2022)
- 17.Adepu AK, Sahayam S, Jayaraman U, Arramraju R. Melanoma classification from dermatoscopy images using knowledge distillation for highly imbalanced data. Computers in Biology and Medicine. 2023;154:106571. doi: 10.1016/j.compbiomed.2023.106571. [DOI] [PubMed] [Google Scholar]
- 18.Teodoro, A.A., Silva, D.H., Rosa, R.L., Saadi, M., Wuttisittikulkij, L., Mumtaz, R.A., Rodriguez, D.Z.: A skin cancer classification approach using gan and roi-based attention mechanism. Journal of Signal Processing Systems, 1–14 (2022)
- 19.Kumar KS, Suganthi N, Muppidi S, Kumar BS. Fspbodqn: Segan based segmentation and fractional student psychology optimization enabled deep q network for skin cancer detection in iot applications. Artificial Intelligence in Medicine. 2022;129:102299. doi: 10.1016/j.artmed.2022.102299. [DOI] [PubMed] [Google Scholar]
- 20.Tschandl P, Rosendahl C, Kittler H. The ham10000 dataset, a large collection of multi-source dermatoscopic images of common pigmented skin lesions. Scientific data. 2018;5(1):1–9. doi: 10.1038/sdata.2018.161. [DOI] [PMC free article] [PubMed] [Google Scholar]
- 21.Combalia, Marc, Noel CF Codella, Veronica Rotemberg, Brian Helba, Veronica Vilaplana, Ofer Reiter, Cristina Carrera et al. "Bcn20000: Dermoscopic lesions in the wild." arXiv preprint arXiv:1908.02288 (2019) [DOI] [PMC free article] [PubMed]
- 22.Codella, N.C., Gutman, D., Celebi, M.E., Helba, B., Marchetti, M.A., Dusza, S.W., Kalloo, A., Liopyris, K., Mishra, N., Kittler, H., et al.: Skin lesion analysis toward melanoma detection: A challenge at the 2017 international symposium on biomedical imaging (isbi), hosted by the international skin imaging collaboration (isic). In: 2018 IEEE 15th International Symposium on Biomedical Imaging (ISBI 2018), pp. 168–172 (2018). IEEE
- 23.Rotemberg V, Kurtansky N, BetzStablein B, Caffery L, Chousakos E, Codella N, Combalia M, Dusza S, Guitera P, Gutman D, et al. A patient-centric dataset of images and metadata for identifying melanomas using clinical context. Scientific data. 2021;8(1):34. doi: 10.1038/s41597-021-00815-z. [DOI] [PMC free article] [PubMed] [Google Scholar]
- 24.Koonce, B., Koonce, B.: Efficientnet. Convolutional Neural Networks with Swift for Tensorflow: Image Recognition and Dataset Categorization, 109– 123 (2021)
- 25.Lee T, Ng V, Gallagher R, Coldman A, McLean D. Dullrazor®: A software approach to hair removal from images. Computers in biology and medicine. 1997;27(6):533–543. doi: 10.1016/S0010-4825(97)00020-6. [DOI] [PubMed] [Google Scholar]
- 26.Ronneberger, O., Fischer, P., Brox, T.: U-net: Convolutional networks for biomedical image segmentation. In: Medical Image Computing and Computer-Assisted Intervention–MICCAI 2015: 18th International Conference, Munich, Germany, October 5–9, 2015, Proceedings, Part III 18, pp. 234–241 (2015). Springer
- 27.Haralick RM, Shanmugam K, Dinstein IH. Textural features for image classification. IEEE Transactions on systems, man, and cybernetics. 1973;6:610–621. doi: 10.1109/TSMC.1973.4309314. [DOI] [Google Scholar]
- 28.Ahonen, T., Hadid, A., Pietikainen, M.: Face description with local binary patterns: Application to face recognition. IEEE transactions on pattern analysis and machine intelligence 28(12), 2037–2041 (2006) [DOI] [PubMed]
- 29.Kang H. The prevention and handling of the missing data. Korean journal of anesthesiology. 2013;64(5):402–406. doi: 10.4097/kjae.2013.64.5.402. [DOI] [PMC free article] [PubMed] [Google Scholar]
- 30.Shahin, A.H., Kamal, A., Elattar, M.A.: Deep ensemble learning for skin lesion classification from dermoscopic images. In: 2018 9th Cairo International Biomedical Engineering Conference (CIBEC), pp. 150–153 (2018). IEEE
- 31.Almaraz-Damian JA, Ponomaryov V, Sadovnychiy S, Castillejos-Fernandez H. Melanoma and nevus skin lesion classification using handcraft and deep learning feature fusion via mutual information measures. Entropy. 2020;22(4):484. doi: 10.3390/e22040484. [DOI] [PMC free article] [PubMed] [Google Scholar]
- 32.Guissous, A.E.: Skin lesion classification using deep neural network. arXiv preprint arXiv:1911.07817 (2019)
Associated Data
This section collects any data citations, data availability statements, or supplementary materials included in this article.
Supplementary Materials
Data Availability Statement
The datasets are downloaded from the ISIC repository https://challenge.isic-archive.com/data/.