Abstract
Circulating genetically abnormal cells (CACs) constitute an important biomarker for cancer diagnosis and prognosis. This biomarker offers high safety, low cost, and high repeatability, which can serve as a key reference in clinical diagnosis. These cells are identified by counting fluorescence signals using 4-color fluorescence in situ hybridization (FISH) technology, which has a high level of stability, sensitivity, and specificity. However, there are some challenges in CACs identification, due to the difference in the morphology and intensity of staining signals. In this concern, we developed a deep learning network (FISH-Net) based on 4-color FISH image for CACs identification. Firstly, a lightweight object detection network based on the statistical information of signal size was designed to improve the clinical detection rate. Secondly, the rotated Gaussian heatmap with a covariance matrix was defined to standardize the staining signals with different morphologies. Then, the heatmap refinement model was proposed to solve the fluorescent noise interference of 4-color FISH image. Finally, an online repetitive training strategy was used to improve the model’s feature extraction ability for hard samples (i.e., fracture signal, weak signal, and adjacent signals). The results showed that the precision was superior to 96%, and the sensitivity was higher than 98%, for fluorescent signal detection. Additionally, validation was performed using the clinical samples of 853 patients from 10 centers. The sensitivity was 97.18% (CI 96.72–97.64%) for CACs identification. The number of parameters of FISH-Net was 2.24 M, compared to 36.9 M for the popularly used lightweight network (YOLO-V7s). The detection speed was about 800 times greater than that of a pathologist. In summary, the proposed network was lightweight and robust for CACs identification. It could greatly increase the review accuracy, enhance the efficiency of reviewers, and reduce the review turnaround time during CACs identification.
Keywords: Circulating genetically abnormal cell, Fluorescence in situ hybridization, Deep learning, Object detection
Introduction
Lung cancer (LC) is the leading cause of cancer morbidity and mortality worldwide, with 2.09 million new cases and 1.76 million deaths estimated in 2020 [1]. Since no symptom occurs in the early stage of LC, most patients with LC are diagnosed with terminal illness [2]. The 5-year survival rate of patients in the early stages (stage I) of lung cancer is as high as 83%, whereas this rate decreases to 15% in the late stages (stages III and IV) [3]. Therefore, early diagnosis is essential to improve patient survival rate.
Low-dose computed tomography (LDCT) has emerged as a promising mass screening method for the early diagnosis of lung neoplasms. However, it usually has a high false-positive rate (i.e., it detects indeterminate pulmonary nodules, 96% of which are ultimately benign) [4]. Therefore, a new auxiliary diagnostic tool is needed urgently. Liquid biopsy helps to confirm the diagnosis of a LC [5–7], e.g., when a blood sample of 100 (with at least 40,000 peripheral blood mononuclear cells) had at least three circular abnormal cells (CACs), stage-I and stage-II non-small cell LC patients can be identified with high precision (94.2%), sensitivity (89%), and specificity (100%) [8]. To facilitate the enumeration of CAC, Katz et al. used 4-Color Fluorescence in Situ Hybridization (FISH) images to evaluate circulating genetic abnormalities in 10q22/CEP10 and 3p22.1/3q39 of 207 patients. It was performed by detecting and counting 4-color FISH-staining signals in the nuclei, followed by CAC identification using common pathological criteria. These studies demonstrated that LC could be diagnosed with high precision using the FISH technique. However, the FISH technique-based CAC identification is very labor-intensive and time-consuming.
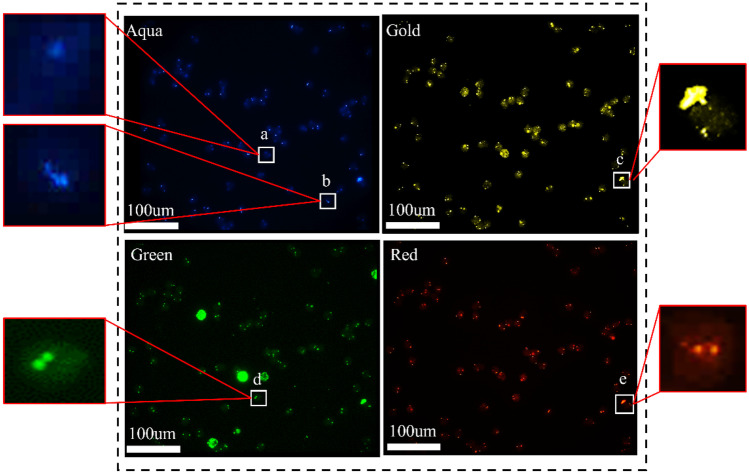
With the development of deep learning (DL) for medical applications, many studies have highlighted new techniques based on the FISH technique for automatic CAC identification [9–14]. Xu et al. proposed a DL-based CAC identification scheme that offered good accuracy (93.86%) and sensitivity (90.57%) [13]. This scheme performed nucleus segmentation by Mask R-CNN, and then detected the 4-color FISH images using a multi-scale MobileNet-YOLO-V4 network. Xu et al. proposed CACNET for CAC identification with accuracy as 94.06% and sensitivity as 92.1% [14]. CACNET solved overlapping nuclei segmentation based on FISH images using a non-local operator and an edge constraint head algorithm. However, these studies encountered the following problems when identifying difficult samples of CAC identification: (1) the model was not refined based on the morphology and dimension of staining signal (Fig. 1e), resulting in large amount of parameters and low identification efficiency; (2) the model identified fracture signal (Fig. 1b) and fluorescent noise (Fig. 1c) as multiple signals, resulting in an increase in the false positive rate and a decrease in precision; (3) the model unidentified weak signals (Fig. 1a) and identified adjacent signals (Fig. 1d) as a single signal, resulting in an increase in the false negative rate and a decrease in sensitivity. Therefore, there is an urgent requirement for developing and identifying techniques that would enable the accurate, efficient identification of CACs based on 4-color FISH images.
Fig. 1.
Dark-field microscopic images of FISH-stained cells. Aqua: aqua signal image representing the copy of CEP10. Green: green signal image representing the copy of 3q29. Gold: gold signal image representing the copy of 10q22.3. Red: red signal image representing the copy of 3p22.1. a The weak signal; b the fracture signal; c the fluorescent noise; d adjacent signals; e the signal with nonuniformity morphologies and dimensions
To tackle with the challenge, this paper proposed a lightweight and robust model (FISH-Net) based on 4-color FISH images for CAC identification. The FISH-Net had four major contributions. Firstly, we designed a lightweight feature extraction structure using statistical information from different signal sizes to improve the efficiency of CAC identification. Secondly, the rotated Gaussian heatmap with a covariance matrix was defined to standardize the staining signals with different morphologies. Thirdly, the heatmap refinement model (HRM) was proposed to solve the fluorescent noise interference of 4-color FISH image. Fourthly, an online repetitive training for hard samples (ORTHS) strategy was developed to enhance the feature extraction performance for fracture signals, weak signals, and adjacent signals. The experimental results showed that our proposed scheme was efficient and robust for FISH image-based detection. The proposed method could provide insights into other diagnostic applications with FISH technique, as identification for chromosomal aberrations associated with bladder cancer [15], and detection for FGF19 amplifications in hepatocellular carcinoma [16].
Materials and Methods
Dataset Preparation
This study trained and validated network using data from 479 LC patients acquired from 29 hospitals. Patients’ peripheral blood (10 mL) were collected in tubes containing ethylenediaminetetraacetic acid. These samples were immediately separated using the Ficoll-Hypaque density gradient separation method and deposited onto microscope glass slides with the Cytospin system (Thermo Fisher, Massachusetts, USA). Subsequently, the cells were fixed using the 4-color FISH probe set (Sanmed Biotechnology Inc., Zhuhai, China), i.e., subtelomeric 3q29 (196F4, green), the locus-specific identifier 3p22.1 (red), centromere 10 (CEP10, aqua), and the locus-specific identifier 10q22.3 (gold). The FISH samples were digitalized using Duet System (BioView Ltd., Allegro plus, ISR) to visualize chromosomes 3 and 10 (Fig. 1). As such, five-channel images (i.e., DAPI, Aqua, Gold, Green, and Red) were acquired by different fluorescent dye with each imaging consisting of 2048 × 2448 pixels.
Ten experienced pathologists were appointed to segment the nuclei and staining signals using CellProfiler. The labeled results were rechecked by three pathologists. Then, we extracted information regarding the mask of each nucleus in a frame and the boundaries of the stained signals in each nucleus. The criteria for selecting the images were used: (1) the number of the nucleus in a frame was 70–200; (2) both the independent and the clustering nuclei were contained in a frame; (3) the signal intensity was 800–30,000. Finally, we obtained 10,162 images with each channel for the experiment.
To explore the generalization ability of our model, 853 patients’ clinical samples were collected from ten medical centers, including Sanmed Biotech Ltd., the First Affiliated Hospital of Zhengzhou University, West China Hospital of Sichuan University, Ningbo Huamei Hospital, Shanghai General Hospital, Wuhan Union Hospital, the Fourth Hospital of Hebei Medical University, the Second Affiliated Hospital of Sun Yat-sen University, Liaocheng People’s Hospital, and the First Affiliated Hospital of Nanchang University (Fig. 2). They were used to validate the performance of the network for data from different centers and these data was not included in the data for training and validating the network.
Fig. 2.
Multicenter data distribution. The number and percentage from multi-center are shown in the figure
CAC Identification Workflow
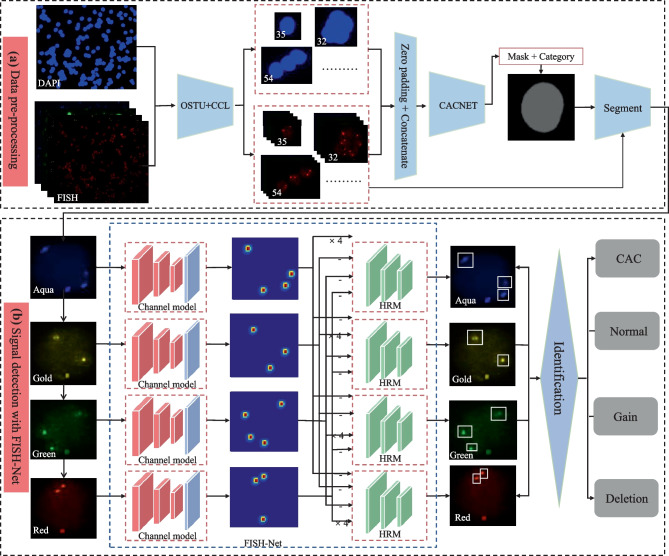
The workflow of CAC identification mainly includes data pre-processing and signal detection (Fig. 3). Figure 3a presents the data pre-processing workflow. Firstly, the maximum between-cluster variance algorithm [17] was used to remove the background noise from each DAPI channel image. The Connected Components Labelling algorithm [18] was used to label the mask of DAPI channel image. Then, based on the mask of the connected nuclei, FISH and DAPI channel images were converted into connected domain images, respectively, to discern the overlapping nuclei by setting a pre-defined threshold of mask. Considering that the location of 4-color FISH-staining signal could provide spatial information for nuclear segmentation, the domain images of five channels (DAPI, Aqua, Gold, Green, and Red) were zero-padded and concatenated to form the feature input of 512 × 512 × 5. Following that, the class and binary mask of each nucleus were obtained through an improved Mask R-CNN, which was demonstrated to perform well for overlapping nuclei segmentation [14]. Finally, the 4-color FISH images in each nucleus were obtained by multiplying with the corresponding binary masks. The pre-processed data was used for signal detection by FISH-Net (Fig. 3b). The channel model was used to obtain the heatmap, position, and offset of the signals. Then, the location of FISH-staining signal was refined by HRM. As consequence, the cell type was determined by the classification rules as shown in Table 1.
Fig. 3.
The workflow of CAC identification. CCL Connected Components Labelling algorithm, HRM heatmap refinement model
Table 1.
FISH-based cell type identification criteria
| Cell type | Description |
|---|---|
| Normal cell | 2 signals in each of the four channels |
| Deletion cell | ≤ 2 signals in 1 or more channels and all the others have 2 signals |
| Gain cell | ≥ 2 signals in 1 channel |
| CAC | ≥ 2 signals in 2 or more channels |
Signal Detection with FISH-Net
Channel Model
The object detection models can be categorized as one-stage network (e.g., You Only Look Once (YOLO) [19]) and two-stage network (e.g., Fast R-CNN [20]). With the improvements of one-stage network in recent years, it is possible to improve efficiency while maintaining accuracy compared to the two-stage networks. YOLO-V5 is a well-known one-stage object detection model, which mainly extracts multi-scale features by convolution kernels and obtains the confidence of candidate bounding boxes [21]. An optimized model based on the YOLO-V5 was developed according to the image characteristics [19, 21]. By the method, the dimensions of multi-scale features were determined based on the long diameters of signals to enhance the efficiency. In addition, the heatmap with angular information was used as ground truth to improve the performance of detecting the adjacent signals and the fracture signal.
Figure 4 illustrates the architecture of the channel model, which can be divided into four parts: Input, Backbone, Neck, and Prediction. The original image was resized to 320 × 320 × 1 as an input data. The Backbone part was mainly composed of cross-stage partial (CSP) modules, which performed feature extraction through the CSPDarknet53 [22]. At the part of Neck, the image feature was aggregated using the Path Aggregation Network [23]. Therefore, the network can detect the staining signals using the heatmap, offset, and size.
Fig. 4.
The architecture of the channel model. Conv convolution layer, BN batch normalization, ReLU rectified linear unit. The dimensions of the feature maps are shown below each module
During training, we defined the loss function of FISH-Net as follows:
| 1 |
The loss function of the heatmap was expressed as follows:
| 2 |
where and are hyperparameters, and N represents the number of key points in the image. The heatmap of signal can be expressed as , where R represents the output stride relative to the original image.
Assuming that the coordinate of the signal was expressed as , the center of object was , and the size of the object is . The loss function of length and width was expressed as follows:
| 3 |
where is defined as the network output.
The loss function of the offset value was expressed as follows:
| 4 |
where represents the central point of the target frame; represents the down-sampling times; represents the offset value.
The study [24] experimentally proved that the with weight factor as 0.1 and with weight factor as 1 showed a good trade-off between the detection of the objects’ size and offset. Thus, was set to 0.1 and was set to 1 in the present study.
The multi-scale features extraction is a common method to improve the detection performance for objects with various sizes [19]. To determine the feature sizes for the study, the long diameters of the staining signals from all acquired datasets were analyzed as shown in Fig. 5. The minimum long diameter of the staining signal was 4 pixels. This indicated that the model should include 1/4 scale feature, which used 1 pixel to represent the minimum signal. Since finer scales corresponded to higher computational cost, it was necessary to weight over the minimum scale and the resultant computational efficiency.
Fig. 5.
The distribution of the long diameter of the staining signals from all acquired datasets
Gaussian heatmap, which can provide more information, including object confidence, size, and location information, has been used in the object detection [25]. In the present study, the rotated Gaussian kernel was proposed to represent the various morphological signals, such as adjacent and fracture signals. Mathematically, a FISH-staining signal is defined as:
| 5 |
where represents the rotated Gaussian kernel:
| 6 |
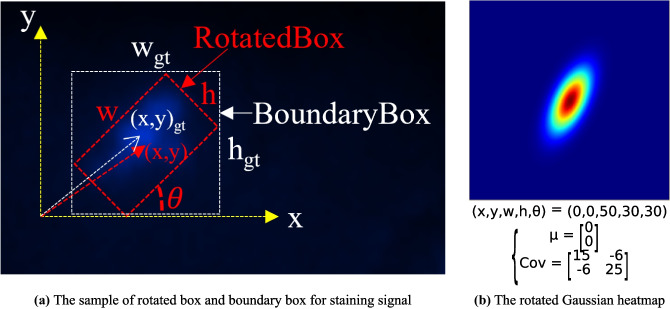
where represent the information of rotated Gaussian heatmap [26]. To reduce the parameters of the model, we transformed the model prediction parameters into the boundary box of the signals ((Fig. 6a). The heatmap was generated by the signals which were processed through the rotated Gaussian kernel (Fig. 6b). The input images were resized into 320 pixels so that the rotational information of the smallest signal can be included in the heatmap.
Fig. 6.
The representation of the staining signal based on the rotated Gaussian kernel
Heatmap Refinement Model
To eliminate the impact of the fluorescent noise at the same position in different channels, a differential refinement module was suggested to inhibit noise interference:
| 7 |
where and belong to four FISH staining channels, represents the primary distribution of Gaussian kernels extracted by the model, and corresponds to the weight of the channel . The following displays the function :
| 8 |
By optimizing the weight of the different channels, the fluorescent noise could be removed at the same position of different channels.
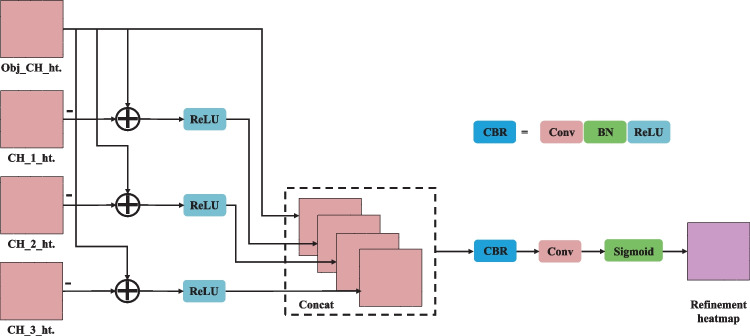
Figure 7 illustrates the architecture of HRM. Firstly, the heatmap of the target channel was subtracted from those of the other channels to remove the interference of the highlighted background at the same position. The rectified linear unit activation function was used to remove the influence of the other channel signals on the feature map. Next, the obtained features on the four-layer heatmap were concatenated and passed through the CBR (convolution + batch normalization + rectified linear unit) and the convolution layer. Finally, the sigmoid activation function was used to normalize the output results.
Fig. 7.
The architecture of HRM. Conv, convolution layer; BN, batch normalization; ReLU, rectified linear unit
ORTHS Strategy
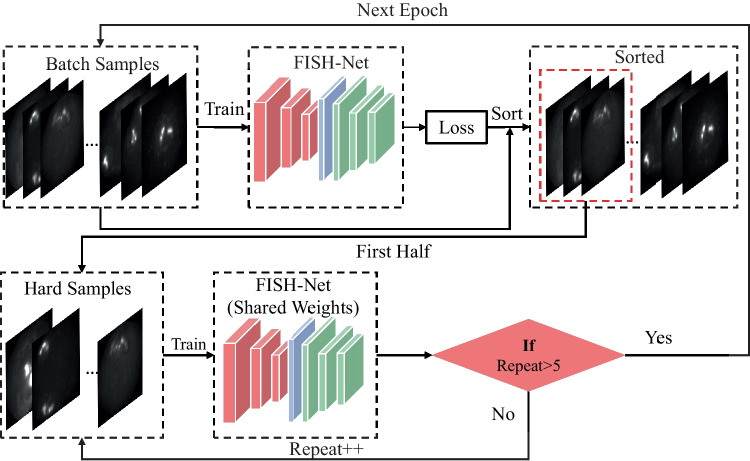
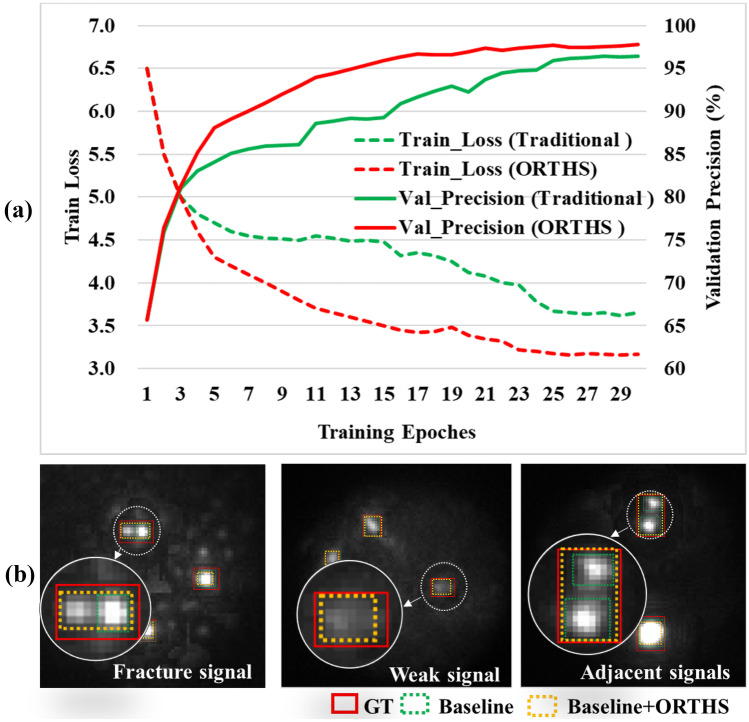
As introduced previously, two of the five challenges, i.e., signal with nonuniformity morphologies and dimensions (Fig. 1e) and fluorescent noise at the same position in different channels (Fig. 1c), could be solved by channel model (the “Channel Model” section) and HRM (the “Heatmap Refinement Model” section). Our study resolved the rest 3 challenges (i.e., fracture signal, weak signal, and adjacent signals) by introducing ORTHS strategy based on repeated training. The ORTHS strategy abided by the principle of “practice makes perfect.” Its workflow is shown in Fig. 8. In each training epoch, the loss of each batch sample was recorded and sorted in descending order. The first half of the batch samples was selected as hard samples to retrain the model. This procedure was repeated five times in each epoch to improve the model’s ability for hard samples detection.
Fig. 8.
The workflow of the ORTHS strategy
Experimental Setup
In the experiment, tenfold cross validation was used to randomize the datasets to 10 parts, and each time, one part was used as testing sets, while the remaining nine parts as training sets. The training datasets included 9146 images and the test dataset included 1016 images with each channel. The training and test datasets were common to all experiments for fair comparison. Our experiment was mainly divided into three parts. Firstly, to evaluate the performance of the model on object detection, we compared FISH-Net with 2 typical object detection networks (i.e., YOLO-V7s [19] and CenterNet2 [25]). Secondly, to validate the performance of the scheme on CAC identification, we compared the proposed scheme with the peer studies (i.e., Experienced pathologists [8], Multi-scale MobileNet-YOLO-V4 [13], CACNET [14]). For each medical center, we divided the data into training and validation sets with the ratio of 1:9. The FISH-Net was trained and tested on each of the centers based on the transfer learning strategy, which was to validate the model robustness with data from different medical centers. Thirdly, the ablation experiment of the four contributes to FISH-Net was investigated.
In the study, the workstation was configured with dual CPUs (Intel(R) Xeon(R) Gold 5218 CPU) and 4 NVIDIA T4 GPUs for model training and prediction. All models were implemented using PyTorch. The optimal parameter configuration for training model is listed in Table 2. For FISH-Net, the input size for model training was 320 × 320. The optimizer used Adam and the weight decay was 0.0001. The batch size was 64, the initial learning rate was 0.001, and the momentum was 0.9.
Table 2.
Optimized parameters of the model
| Model | Input size | Batch size | Epoch | Optimizer | Learning rate | Weight decay | Momentum |
|---|---|---|---|---|---|---|---|
| FISH-Net | 320 × 320 | 64 | 30 | Adam | 0.01 | 0.0001 | 0.9 |
| YOLO-V7s | 320 × 320 | 32 | 100 | SGD | 0.01 | 0.0001 | 0.9 |
| CenterNet2 | 320 × 320 | 32 | 50 | SGD | 0.01 | 0.0001 | 0.9 |
| Multi-scale MobileNet-YOLO-V4 | 416 × 416 | 24 | 200 | SGD | 0.001 | 0.0001 | 0.9 |
| CACNET | 512 × 512 | 1 | 1000 | Adam | 0.01 | 0.001 | 0.8 |
Evaluating Metrics
Precision, sensitivity, specificity, F1, accuracy, average precision (AP), 95% confidence intervals (CI), and coefficient of variation (CV) were utilized to evaluate the model’s performance. In particular, CI and CV measured the robustness of the model in multicenter data validation.
| 9 |
| 10 |
| 11 |
| 12 |
| 13 |
| 14 |
| 15 |
| 16 |
where true positive (TP), true negative (TN), false positive (FP), and false negative (FN) denote the number of correctly identified signal points, correctly predicted non-signal points, falsely detected signal points, and missed signal points, respectively. denotes sensitivity, and denotes precision. and represent the standard error and standard deviation, respectively.
Results
Performance of Signal Detection
Table 3 shows the signal detection performance of different models on the testing set, which includes YOLO-V7s, CenterNet2, and FISH-Net. The results for the four channels, Aqua, Gold, Green, and Red, were presented. FISH-Net outperformed the other networks applied in signal detection. Also, the number of parameters of FISH-Net was only 2.24 M, which was 1/15 of YOLO-V7s and CenterNet2. It indicated that FISH-Net was a lightweight model.
Table 3.
Signal detection performance of different deep learning models
| Model | Channel | Accuracy (%) | Sensitivity (%) | F1 (%) | AP50 (%) | No. parameters (million) |
|---|---|---|---|---|---|---|
| YOLO-V7s | Aqua | 94.3 ± 1.6 | 95.3 ± 1.6 | 95.6 ± 1.7 | 95.4 ± 1.3 | 36.9 |
| CenterNet2 | 94.1 ± 1.8 | 95.2 ± 1.6 | 95.6 ± 1.7 | 95.8 ± 1.4 | 37.6 | |
| FISH-Net | 97.5 ± 1.2 | 97.1 ± 1.1 | 97.2 ± 1.0 | 96.4 ± 1.3 | 2.24 | |
| YOLO-V7s | Gold | 95.5 ± 1.5 | 95.7 ± 1.3 | 95.4 ± 1.6 | 96.4 ± 1.2 | 36.9 |
| CenterNet2 | 95.9 ± 1.5 | 95.0 ± 1.7 | 94.9 ± 1.7 | 96.5 ± 1.3 | 37.6 | |
| FISH-Net | 99.1 ± 0.2 | 98.6 ± 0.4 | 98.9 ± 0.3 | 98.0 ± 1.0 | 2.24 | |
| YOLO-V7s | Green | 95.4 ± 1.5 | 95.3 ± 1.6 | 95.1 ± 1.7 | 96.3 ± 1.3 | 36.9 |
| CenterNet2 | 94.5 ± 1.7 | 94.6 ± 1.6 | 94.9 ± 1.5 | 96.1 ± 1.2 | 37.6 | |
| FISH-Net | 99.5 ± 0.2 | 98.5 ± 0.4 | 98.6 ± 0.5 | 97.9 ± 0.5 | 2.24 | |
| YOLO-V7s | Red | 95.4 ± 1.6 | 95.8 ± 1.5 | 96.4 ± 1.2 | 96.6 ± 1.1 | 36.9 |
| CenterNet2 | 92.3 ± 1.8 | 93.2 ± 1.7 | 94.4 ± 1.6 | 96.2 ± 1.2 | 37.6 | |
| FISH-Net | 98.4 ± 0.6 | 98.8 ± 0.5 | 98.9 ± 0.2 | 97.5 ± 1.0 | 2.24 |
Data are presented as mean ± standard deviation. The best results are shown in bold
Performance of CAC Identification
The comparison experiments of the proposed algorithm with the peer studies have been implemented, and the results are listed in Table 4. The accuracy (98.43%) and sensitivity (97.40%) obtained in this study reached the level of experienced pathologists (accuracy 94.2% and sensitivity 89%) [8]. Furthermore, the method used in this study was significantly faster than manual identification by a factor of approximately 800. The proposed model also outperformed the other state-of-the-art FISH-based automatic method on identification of CACs utilizing multi-scale YOLO-V4 algorithm (accuracy 93.96% and sensitivity 91.82%), and the CACNET (accuracy 94.06% and sensitivity 92.1%)] [13, 14] (Table 4).
Table 4.
Performance comparison of the proposed method and the counterparts
| Scheme | Accuracy (%) | Sensitivity (%) | Specificity (%) | Times per frame (s) |
|---|---|---|---|---|
| Experienced pathologists [8] | 94.20 ± 3.52 | 89.00 ± 4.87 | 100.00 | 300.00 ± 10.00 |
| Multi-scale MobileNet-YOLO-V4 [13] | 93.96 ± 1.62 | 91.82 ± 1.55 | 98.50 ± 0.48 | 0.67 |
| CACNET [14] | 94.06 ± 1.52 | 92.10 ± 1.61 | 99.80 ± 0.10 | 0.22 |
| The proposed method | 98.43 ± 0.92 | 97.40 ± 1.22 | 99.95 ± 0.05 | 0.31 |
Data are presented as mean ± standard deviation. The best results are shown in bold
Table 5 shows the evaluation metrics of the proposed method for multicenter data validation. We found that the proposed method yielded an accuracy of 97.18% (CI 96.72–97.64%), scored 97.11% (CI 96.63–97.60%) and 99.06% (CI 98.73–99.39%) in terms of sensitivity and specificity, and scored 97.37% (CI 96.92–97.82%) in terms of specificity, averaged over the performance from all channels. The evaluation metrics of CV were less than 0.8%. Upon pathological evaluation by experts, less than 4.2% of the results by the proposed method need to be rechecked manually.
Table 5.
Performance of the proposed method on multicenter data
| Accuracy (%) | Sensitivity (%) | Specificity (%) | F1 (%) | |
|---|---|---|---|---|
| Sanmed Biotech Ltd | 98.23 | 98.30 | 99.80 | 98.62 |
| The First Affiliated Hospital of Zhengzhou University | 97.43 | 97.42 | 99.10 | 97.56 |
| West China Hospital of Sichuan University | 96.52 | 96.24 | 98.50 | 96.74 |
| Huamei Hospital | 96.46 | 96.10 | 98.46 | 96.61 |
| Shanghai General Hospital | 96.56 | 96.24 | 98.52 | 96.76 |
| Wuhan Union Hospital | 97.43 | 97.40 | 99.50 | 97.64 |
| The Fourth Hospital of Hebei Medical University | 97.84 | 97.83 | 99.61 | 97.83 |
| The Second Affiliated Hospital of Sun Yat-sen University | 96.53 | 96.74 | 98.91 | 96.95 |
| Liaocheng People’s Hospital | 96.43 | 96.72 | 98.45 | 96.55 |
| The First Affiliated Hospital of Nanchang University | 98.39 | 98.19 | 99.72 | 98.45 |
| Mean (%) | 97.18 | 97.11 | 99.06 | 97.37 |
| 95% CI (%) | 96.72–97.64 | 96.63–97.60 | 98.73–99.39 | 96.92–97.82 |
| CV (%) | 0.76 | 0.80 | 0.54 | 0.74 |
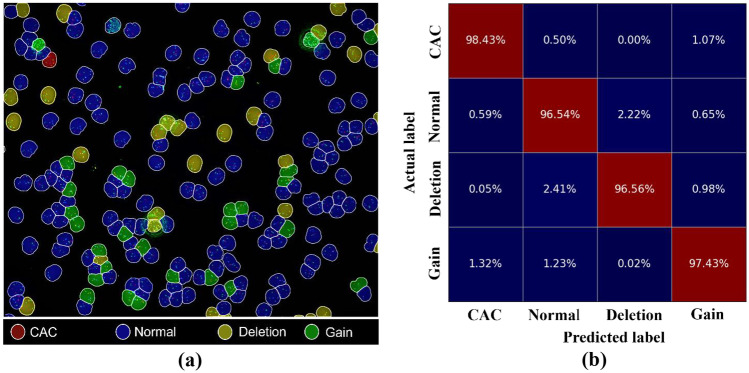
Figure 9a illustrates the identification of cell types in a single field of view (FOV) based on the proposed method. It indicated that the CACs were rare in clinical images. Figure 9b describes the performance of CAC identification by confusion matrix. The identification accuracy of our proposed method for normal cells, deletion cells, gain cells, and CACs was 98.43%, 96.54%, 96.56%, and 97.43%, respectively, which seemed not to be influenced by the unbalanced number of cells of different types. Moreover, the error rate of the proposed method in identifying CAC as gain and normal cells was 1.07% and 0.5%, respectively.
Fig. 9.
Cell type identification results based on FISH-Net. a An example of the distribution of identified cell types in one FOV. Blue, yellow, green, and red areas indicate normal cell, deletion cell, gain cell, and CAC, respectively. b The confusion matrix of the proposed method for cell identification
Ablation Experiment
Contribution of Multi-scale Features
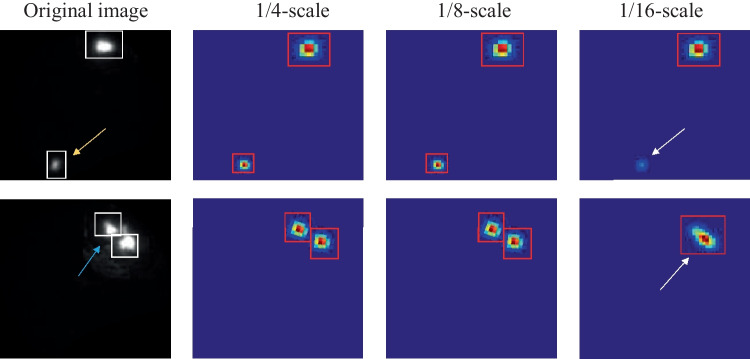
Three scale (i.e., 1/4-scale, 1/8-scale, and 1/16-scale) features were evaluated in the ablation experiments. Table 6 shows that the performance of model with different multi-scale features. The model with 1/4 and 1/8-scale (FISH-Net) yielded sensitivity as 97.40 ± 1.22% and specificity as 99.95 ± 0.05%. Compared to the model with all three scale features, FISH-Net had a 0.02% decrease in accuracy. However, the amount of the model parameters was reduced from 26.9 to 2.24 M. The slight reduction in accuracy was acceptable in comparison to the enhanced computational efficiency.
Table 6.
Performance of ablation experiment on multi-scale feature
| 1/4-scale | 1/8-scale | 1/16-scale | Accuracy (%) | Sensitivity (%) | Specificity (%) | No. parameters (million) |
|---|---|---|---|---|---|---|
| √ | 96.96 ± 1.64 | 94.82 ± 1.23 | 98.60 ± 0.49 | 1.98 | ||
| √ | √ | 98.43 ± 0.92 | 97.40 ± 1.22 | 99.95 ± 0.05 | 2.24 | |
| √ | √ | √ | 98.45 ± 0.52 | 97.37 ± 1.24 | 99.70 ± 0.10 | 26.9 |
√: keeping the scale; × : deleting the scale
Data are presented as mean ± standard deviation. The best results are shown in bold
Figure 10 illustrates the performance of signal detection by FISH-Net with different scale features. The yellow and red arrow points to the small and fracture signals, respectively. The location and size information could be provided by the 1/4 and 1/8-scale features. In comparison, the 1/16-scale feature was incapable of detecting the small signals (top right subfigure of Fig. 10), and the adjacent signals (last right subfigure of Fig. 10).
Fig. 10.
The performance of signal detection by different scale features. The red box is the model prediction box. The white box is the ground truth box. The white arrow points to error prediction box. The heatmap is resized to the same dimensions as the original image
Contribution of Rotated Gaussian Heatmap
Figure 11 compares the performance of the model with rotated Gaussian heatmap and Gaussian heatmap. For adjacent and fracture signals, the model using the Gaussian heatmap would detect them as one signal and multiple signals, respectively (Fig. 11a, b). In contrast, the model based on the rotated Gaussian heatmap can accurately detect the adjacent signals and fracture signal (Fig. 11a, c). In summary, the rotated Gaussian heatmap could represent the different morphological staining signals effectively.
Fig. 11.
Performance of the heatmaps generated by different Gaussian kernels. The red box is the ground truth box; the white box is the model prediction box; the white arrow points to the area where the fracture signal was predicted. GH, Gaussian heatmap; RGH, rotated Gaussian heatmap
Contribution of Heatmap Refinement Model
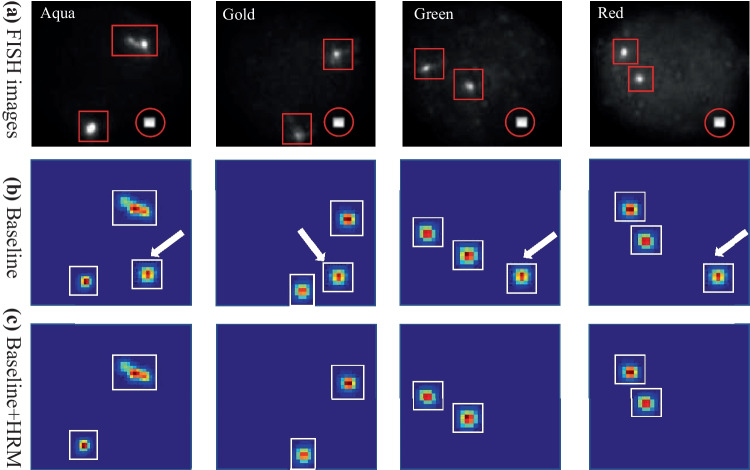
Figure 12 shows the contribution of HRM to the model. It was clear from the figure that the refinement model could significantly reduce the noise that appears in different channels at the same location.
Fig. 12.
Performance of the HRM on the feature heatmaps. The red box is the ground truth box, the red circle is the noise signal, and the white box is the model prediction box
Contribution of ORTHS Strategy
The training loss and validation precision of models with different training strategies are presented in Fig. 13a. The green and red curve plots the training results of the FISH-Net with and without ORTHS strategy, respectively. Compared with the traditional training method, the model with ORTHS strategy had a smoother decrease in training loss and a higher final validation precision. Figure 13b shows the predicted results compared with different training strategies. These results showed that hard samples (i.e., fracture signal, weak signal, and adjacent signals) could be effectively identified using the model with ORTHS strategy.
Fig. 13.
The training loss, validation precision, and predicted results of the model with different training strategies. a The training loss and validation precision with different training strategies, b the predicted results compared with different training strategies. GT, ground truth
Discussion
Morphology-based approaches for the automatic identification of CACs have three major drawbacks. Firstly, for machine learning classifiers based on cell morphology approaches, a large amount of training data is necessary to train the model [27]. For example, the detection accuracy of the model is greatly compromised due to the insufficient number of CACs. However, CACs are extremely rare, often leading to data deficiency and severe data imbalance. Secondly, morphological analysis of CACs revealed that they varied widely in morphology and size. Furthermore, CACs have similar size as other cells (e.g., nucleated blood cells in prostate cancer and leukocytes in some cases). Therefore, the use of morphological features for CAC identification may lead to an increased false positive rate. Therefore, the applicability of methods based on the morphology of CACs is limited. Finally, these methods are end-to-end prediction and do not integrate with clinically interpretable methods. The 4-color FISH method for identifying CACs has the potential to achieve indisputable detection results, by analyzing the number of fluorescent signals in different channels in accordance with identification rules. This method can accurately identify patients with lung cancer, allowing for less frequent biopsies of nonmalignant nodules, and has been used in clinical practice.
It is straightforward to improve a CNN’s learning capability by deepening the structure of the network (i.e., introducing more scale features). However, there is a tradeoff between the network complexity and processing speed. He et al. [28] demonstrated that introducing more scale features into the network does not guarantee better prediction performance. This is in agreement with the results of Table 6. Our results indicated that a suitable selection of scale features based on the size of the target could significantly reduce the number of network parameters as well as ensuring a good prediction performance. The standardized data acquisition procedure was employed, which ensured that the proposed model could be generalized to all possible scenarios in this task. The proposed method was applied to the data from ten medical centers with transfer learning. The experimental results proved that it is a robust and efficient CAC identification scheme (Table 5).
Our study has several limitations. Firstly, the model may identify the noise due to dye absorption by eosinophils as a signal, resulting in a decrease in precision for CAC identification. The future work can include the design of the diffusion models to reduce highlighted noise [29]. Secondly, multicenter data training and validation was performed offline. Some recent studies have highlighted new technologies for DL-based clinic applications. For example, integration of DL algorithm into 6G-enabled Internet of Things (IoT) to realize an online diagnosis [30, 31] or developing novel framework for salient object detection in modern IoT [32, 33]. Our future works will also investigate the possibility to deploy the system on cloud to facilitate practical applications [34].
Conclusions
CAC was used for early diagnosis of LC to reduce the impact of observer bias when identifying and counting cells with abnormal chromosomes. To improve CAC identification precision and efficiency, we proposed a lightweight model based on a rotated Gaussian kernel. Furthermore, a heatmap refinement network was developed to reduce fluorescent noise at the same position of different channels. Moreover, we developed the ORTHS strategy during training to improve the model’s ability for processing hard samples. The experimental results indicate that the precision and F1 was superior to 96% and 98%, respectively. Meanwhile, 853 samples from ten centers were gathered to verify the robustness of the model. As a result, the sensitivity was higher than 97%, and less than 4.2% of nuclei needed to be checked manually. It took an average of about 0.31 s/frame to analyze a clinical sample, and a detection speed about 800 times greater than that of a pathologist. The proposed method outperformed the existing CAC identification methods. Therefore, the present study would provide insights into the major challenges encountered in CACs identification.
Author Contribution
All authors contributed to the study conception and design. Material preparation, data collection, and analysis were performed by Xianjun Fan, Xinjie Lan, Xin Ye, and Xing Lu. Methodology and validation were performed by Xu Xu and Congsheng Li. Review and editing were performed by Tongning Wu. The first draft of the manuscript was written by Xu Xu and all authors commented on previous versions of the manuscript. All authors read and approved the final manuscript.
Funding
This work was supported by the National Natural Science Foundation of China [grant number 61971445 & 62271508].
Data Availability
Due to the nature of this research, participants of this study did not agree for their data to be shared publicly, so supporting data is not available.
Declarations
Ethics Approval
Not applicable.
Consent to Participate
Not applicable.
Consent for Publication
Not applicable.
Competing Interests
The authors declare no competing interests.
Footnotes
Publisher's Note
Springer Nature remains neutral with regard to jurisdictional claims in published maps and institutional affiliations.
References
- 1.Sung H, Ferlay J, Siegel RL, Laversanne M, Soerjomataram I, Jemal A, Bray F. Global cancer statistics 2020: Globocan estimates of incidence and mortality worldwide for 36 cancers in 185 countries. Clin Cancer Res. 2021;71(3):209–249. doi: 10.3322/caac.21660. [DOI] [PubMed] [Google Scholar]
- 2.Birring SS, Peake MD. Symptoms and the early diagnosis of lung cancer. Thorax. 2005;60(4):268–269. doi: 10.1136/thx.2004.032698. [DOI] [PMC free article] [PubMed] [Google Scholar]
- 3.International Early Lung Cancer Action Program Investigators Survival of patients with stage I lung cancer detected on CT screening. NEW ENGL J MED. 2006;355(17):1763–1771. doi: 10.1056/NEJMoa060476. [DOI] [PubMed] [Google Scholar]
- 4.Dziedzic R, Rzyman W. Non-calcified pulmonary nodules detected in low-dose computed tomography lung cancer screening programs can be potential precursors of malignancy. QUANT IMAG MED SURG. 2020;10(5):1179. doi: 10.21037/qims.2020.04.01. [DOI] [PMC free article] [PubMed] [Google Scholar]
- 5.Habli Z, AlChamaa W, Saab R, Kadara H, Khraiche ML. Circulating tumor cell detection technologies and clinical utility: Challenges and opportunities. Cancers. 2020;12(7):1930. doi: 10.3390/cancers12071930. [DOI] [PMC free article] [PubMed] [Google Scholar]
- 6.Freitas MO. Gartner J, Rangel-Pozzo A, Mai S: Genomic instability in circulating tumor cells. Cancers. 2020;12(10):3001. doi: 10.3390/cancers12103001. [DOI] [PMC free article] [PubMed] [Google Scholar]
- 7.Katz RL, Zaidi TM, Pujara D, Shanbhag ND, Truong D, Patil S, Kuban JD. Identification of circulating tumor cells using 4-color fluorescence in situ hybridization: Validation of a noninvasive aid for ruling out lung cancer in patients with low-dose computed tomography–detected lung nodules. CANCER CYTOPATHOLOGY. 2020;128(8):553–562. doi: 10.1002/cncy.22278. [DOI] [PubMed] [Google Scholar]
- 8.Katz RL, Zaidi TM, Ni X. Liquid Biopsy: Recent Advances in the Detection of Circulating Tumor Cells and Their Clinical Applications. Modern Techniques in Cytopathology. 2020;25:43–66. doi: 10.1159/000455780. [DOI] [Google Scholar]
- 9.Chen C, Xing D, Tan L, Li H, Zhou G, Huang L, Xie XS. Single-cell whole-genome analyses by Linear Amplification via Transposon Insertion (LIANTI) Science. 2017;356(6334):189–194. doi: 10.1126/science.aak9787. [DOI] [PMC free article] [PubMed] [Google Scholar]
- 10.Agashe R, Kurzrock R. Circulating tumor cells: from the laboratory to the cancer clinic. Cancers. 2020;12(9):2361. doi: 10.3390/cancers12092361. [DOI] [PMC free article] [PubMed] [Google Scholar]
- 11.He B, Lu Q, Lang J, Yu H, Peng C, Bing P, Tian G. A new method for CTC images recognition based on machine learning. FRONT BIOENG BIOTECH. 2020;8:897. doi: 10.3389/fbioe.2020.00897. [DOI] [PMC free article] [PubMed] [Google Scholar]
- 12.Guo Z, Lin X, Hui Y, Wang J, Zhang Q, Kong F: Circulating tumor cell identification based on deep learning. Front Oncol: 359, 2022. [DOI] [PMC free article] [PubMed]
- 13.Xu C, Zhang Y, Fan X, Lan X, Ye X, Wu T. An efficient fluorescence in situ hybridization (FISH)-based circulating genetically abnormal cells (CACs) identification method based on Multi-scale MobileNet-YOLO-V4. Quant Imaging Med Surg. 2022;12(5):2961–2976. doi: 10.21037/qims-21-909. [DOI] [PMC free article] [PubMed] [Google Scholar]
- 14.Xu X, Li C, Fan X, Lan X, Lu X, Ye X, Wu T: Attention Mask R‐CNN with edge refinement algorithm for identifying circulating genetically abnormal cells. Cytom Part A, 2022. [DOI] [PubMed]
- 15.Ke C, Liu Z, Zhu J, Zeng X, Hu Z, Yang C. Fluorescence in situ hybridization (FISH) to predict the efficacy of Bacillus Calmette-Guérin perfusion in bladder cancer. TRANSL CANCER RES. 2022;11(10):3448–3457. doi: 10.21037/tcr-22-1367. [DOI] [PMC free article] [PubMed] [Google Scholar]
- 16.Kang HJ, Haq F, Sung CO, Choi J, Hong SM, Eo SH, Yu E. Characterization of hepatocellular carcinoma patients with FGF19 amplification assessed by fluorescence in situ hybridization: a large cohort study. Liver cancer. 2019;8(1):12–23. doi: 10.1159/000488541. [DOI] [PMC free article] [PubMed] [Google Scholar]
- 17.Ostu N. A threshold selection method from gray-histogram. IEEE T SYST MAN CY-S. 1979;9(1):62–66. doi: 10.1109/TSMC.1979.4310076. [DOI] [Google Scholar]
- 18.He L, Ren X, Gao Q, Zhao X, Yao B, Chao Y. The connected-component labeling problem: A review of state-of-the-art algorithms. PATTERN RECOGN. 2017;70:25–43. doi: 10.1016/j.patcog.2017.04.018. [DOI] [Google Scholar]
- 19.Wang CY, Bochkovskiy A, Liao HYM: YOLOv7: Trainable bag-of-freebies sets new state-of-the-art for real-time object detectors. arXiv preprint arXiv:2207.02696, 2022.
- 20.Ren S, He K, Girshick R, Sun J: Faster r-cnn: Towards real-time object detection with region proposal networks. Advances in neural information processing systems 28, 2015. [DOI] [PubMed]
- 21.Wang Z, Jin L, Wang S, Xu H. Apple stem/calyx real-time recognition using YOLO-v5 algorithm for fruit automatic loading system. POSTHARVEST BIOL TEC. 2022;185:111808. doi: 10.1016/j.postharvbio.2021.111808. [DOI] [Google Scholar]
- 22.Alexey Bochkovskiy C-YW, Hong-Yuan Mark Liao: Yolov4: Optimal Speed and Accuracy of Object Detection. Computer Vision and Pattern Recognition, 2020.
- 23.Liu S, Qi L, Qin H, Shi J, Jia J: Path Aggregation Network for Instance Segmentation. 2018 IEEE/CVF Conference on Computer Vision and Pattern Recognition 8759–68, 2018.
- 24.Duan K, Bai S, Xie L, Qi H, Huang Q, Tian Q: Centernet: Keypoint triplets for object detection. In Proceedings of the IEEE/CVF international conference on computer vision 6569–6578, 2019.
- 25.Zhou X, Krähenbühl P: Joint COCO and LVIS workshop at ECCV 2020: LVIS challenge track technical report: CenterNet2, 2020.
- 26.Yang X, Yan J, Ming Q: Rethinking rotated object detection with gaussian wasserstein distance loss. In International Conference on Machine Learning (PMLR) 11830–11841, 2021.
- 27.Qiu X, Zhang H, Zhao Y, Zhao J, Wan Y, Li D, Lin D. Application of circulating genetically abnormal cells in the diagnosis of early-stage lung cancer. J CANCER RES CLIN. 2022;148(3):685–695. doi: 10.1007/s00432-021-03648-w. [DOI] [PMC free article] [PubMed] [Google Scholar]
- 28.Ho J, Jain A, Abbeel P. Denoising diffusion probabilistic models. Advances in Neural Information Processing Systems. 2020;33:6840–6851. [Google Scholar]
- 29.He K, Zhang X, Ren S, Sun J: Deep Residual Learning for Image Recognition. In Proceedings of the IEEE Computer Society Conference on Computer Vision and Pattern Recognition 770–778, 2015.
- 30.Wang W, Liu F, Zhi X, Zhang T, Huang C. An integrated deep learning algorithm for detecting lung nodules with low-dose ct and its application in 6g-enabled internet of medical things. IEEE INTERNET THINGS. 2020;8(7):5274–5284. doi: 10.1109/JIOT.2020.3023436. [DOI] [Google Scholar]
- 31.Zhou X, Liang W, Li W, Yan K, Shimizu S, Kevin I, Wang K. Hierarchical adversarial attacks against graph-neural-network-based IoT network intrusion detection system. IEEE INTERNET THINGS. 2021;9(12):9310–9319. doi: 10.1109/JIOT.2021.3130434. [DOI] [Google Scholar]
- 32.Wang C, Dong S, Zhao X, Papanastasiou G, Zhang H, Yang G. SaliencyGAN: Deep learning semisupervised salient object detection in the fog of IoT. IEEE T IND INFORM. 2019;16(4):2667–2676. doi: 10.1109/TII.2019.2945362. [DOI] [Google Scholar]
- 33.Zhang D, Meng D, Han J. Co-saliency detection via a self-paced multiple-instance learning framework. IEEE T PATTERN ANAL. 2016;39(5):865–878. doi: 10.1109/TPAMI.2016.2567393. [DOI] [PubMed] [Google Scholar]
- 34.Evangelista L, Panunzio A, Scagliori E, Sartori P: Ground glass pulmonary nodules: their significance in oncology patients and the role of computer tomography and 18F–fluorodeoxyglucose positron emission tomography. Eur J Hybrid Imaging 2(1):1–13, 2018. [DOI] [PMC free article] [PubMed]
Associated Data
This section collects any data citations, data availability statements, or supplementary materials included in this article.
Data Availability Statement
Due to the nature of this research, participants of this study did not agree for their data to be shared publicly, so supporting data is not available.


