

Abstract
Measurement of angles on foot radiographs is an important step in the evaluation of malalignment. The objective is to develop a CNN model to measure angles on radiographs, using radiologists’ measurements as the reference standard. This IRB-approved retrospective study included 450 radiographs from 216 patients (< 3 years of age). Angles were automatically measured by means of image segmentation followed by angle calculation, according to Simon’s approach for measuring pediatric foot angles. A multiclass U-Net model with a ResNet-34 backbone was used for segmentation. Two pediatric radiologists independently measured anteroposterior and lateral talocalcaneal and talo-1st metatarsal angles using the test dataset and recorded the time used for each study. Intraclass correlation coefficients (ICC) were used to compare angle and paired Wilcoxon signed-rank test to compare time between radiologists and the CNN model. There was high spatial overlap between manual and CNN-based automatic segmentations with dice coefficients ranging between 0.81 (lateral 1st metatarsal) and 0.94 (lateral calcaneus). Agreement was higher for angles on the lateral view when compared to the AP view, between radiologists (ICC: 0.93–0.95, 0.85–0.92, respectively) and between radiologists’ mean and CNN calculated (ICC: 0.71–0.73, 0.41–0.52, respectively). Automated angle calculation was significantly faster when compared to radiologists’ manual measurements (3 ± 2 vs 114 ± 24 s, respectively; P < 0.001). A CNN model can selectively segment immature ossification centers and automatically calculate angles with a high spatial overlap and moderate to substantial agreement when compared to manual methods, and 39 times faster.
Supplementary Information
The online version contains supplementary material available at 10.1007/s10278-023-00824-x.
Keywords: CNN, U-NET, Foot, Pediatric, Malalignment, Clubfoot, Radiographs
Introduction
Foot malalignment encompasses a wide spectrum of clinical deformities that vary in severity and reducibility and can involve a combination of bones, particularly those in the hindfoot (talus and calcaneus) and midfoot (tarsal bones) [1]. One of the most common patterns of foot malalignment that presents in early childhood is congenital talipes equinovarus (clubfoot), which has an estimated incidence of 1 per 1,000 births. Other well-recognized pediatric foot malalignments include vertical talus, calcaneovalgus (flatfoot), and metatarsus adductus, all of which can have variable phenotypic expression and clinical severity [2–4]. Early identification and prompt treatment are the cornerstones for optimizing long-term function because treatment is typically less invasive and more effective in younger feet that are still flexible and before the development of secondarily acquired anatomic and soft tissue deformity from remodeling and adaption [4, 5]. While patient screening starts prenatally and postnatal diagnosis relies heavily on clinical assessment, imaging is obtained not only in ambiguous and equivocal cases to problem-solve and in confirmed cases to monitor treatment response, but also in patients who present for imaging for unrelated indications to identify previously unrecognized foot malalignment [6].
Radiography remains the imaging modality of choice for the initial screening of foot pathology in children. While a diversity of angles on anteroposterior (AP) and lateral radiographic views have been proposed in the published literature [7], the talocalcaneal and talo-1st metatarsal angles are most widely utilized during routine clinical practice to identify foot malalignment and to monitor post-treatment correction [8–13]. However, performing these angle measurements can be time-consuming and is subject to inter-rater variability, particularly in infants and toddlers, who have relatively small ossification centers [4]. The latter can lead to occasional misdiagnoses and delay diagnoses, hindering longitudinal and serial comparisons that can impact patient care.
In recent years, deep learning algorithms such as convolutional neural networks (CNNs) have emerged as a complementary tool that can improve clinical workflow—decreasing radiologists’ interpretation time [14] and eliminating measurement variability [4]. CNNs have been developed to identify and stratify various medical diseases, and some CNNs performed at a level that was comparable to board-certified physicians [15–17]. However, there is a relative paucity of machine-learning algorithms that are specific to the pediatric foot and with performance validated against board-certified and subspecialty-trained radiologists. In this vulnerable younger patient population, the development of CNNs that can automate quantitative measures can complement the qualitative clinical judgment and serve as a screening tool to identify cases that benefit from additional evaluation and orthopedic follow-up. Thus, the purpose of this study is to develop a CNN model that can segment bones of the foot and measure angles on radiographs from infants and toddlers, using radiologists’ measurements as the reference standard.
Material and Methods
Study Cohort
The institutional review board (IRB) approved this retrospective Health Insurance Portability and Accountability Act (HIPAA) compliant study. The requirement to obtain informed and parental consent was waived. Foot radiographs performed between October 2000 and December 2020 on children under 3 years of age were identified using Illuminate Insights (Softek, Overland Park, KS) and Montage (Nuance, Burlington, MA), which identified patients without and with diagnoses of foot malalignment, respectively, based on radiology reports and clinical history. Younger patients were chosen because early identification and intervention are more effective with surgical intervention often reserved for those who have failed a trial of conservative management. Radiographic studies were excluded if either AP or lateral radiographic views were missing (n = 9), greater than 50% of talus or calcaneus were obscured (n = 14), absent ossification centers due to extreme skeletal immaturity (n = 2), or a history of prior instrumentation (n = 20). All radiographs were acquired using clinically available imaging systems.
Radiographic studies were randomly divided into training, validation, and test data on an approximate 60%, 12%, and 28% split using the following criteria: (a) patients with multiple studies were restricted to the training set and the split was carried out at patient level to ensure that the AP and lateral radiographs from the same patient were kept in the same train, test or validation splits to prevent data leakage, (b) relatively equal distribution of genders were present in both validation and test sets, and (c) both validation and test sets contained approximately 25% abnormally aligned foot radiographs, which is representative of the patients clinically referred for concerns of foot malalignment at a tertiary referral children’s hospital (Table 1). The training data were used to train the CNN models for image segmentation and the validation data to identify the optimal models. The latter was then applied to the test data to generate automatic angle measures.
Table 1.
Summary of demographic information for training, validation, and test sets
| Demographic parameters |
Total (n) |
Training (n) |
Validation (n) |
Test (n) |
|---|---|---|---|---|
| Patients (boys/girls) | 164 (93/71) | 79 (55/24) | 25 (13/12) | 60 (26/34) |
| Age: median [IQR] (mo) | 14.0 [5,24] | 14.0 [4,23.5] | 14.0 [10,26] | 15.0 [6,23.5] |
|
Radiographic studies (mal-/normal alignment)* |
216 (104/112) |
131 (79/52) |
25 (6/19) |
60 (19/41) |
|
Radiographic views (AP/lateral)** |
450 (226/224) |
270 (136/134) |
50 (25/25) |
130 (65/65) |
AP anteroposterior, mo month, IQR interquartile range [25%, 75%]
*Two hundred and sixteen studies included 120 patients who underwent 1 study, 40 patients who underwent 2 studies, and 4 patients who underwent 4 studies. One hundred and four (48%) studies had clinical diagnoses of foot malalignment: 79 clubfoot, 16 hindfoot valgus, 4 vertical talus, 2 hindfoot varus, 2 metatarsus adductus with hindfoot varus, 1 forefoot adductus. One hundred and twelve (52%) studies had no clinical diagnosis of foot malalignment: 101 normal, 7 polydactyly, 2 healing fracture, 1 syndactyly, and 1 osteogenesis imperfecta; **One study with 2 AP views, five studies with 2 AP and 2 lateral views (bilateral imaging), one study with 4 AP and 4 lateral views (repeat imaging, bilateral views), and the reminder of the studies contained single AP and lateral views
CNN Segmentation Models
Three segmentation models were trained separately and end-to-end: (a) coarse segmentation on both AP and lateral views, (b) fine segmentation on AP, and (c) fine segmentation on lateral views (Fig. 1). All CNN models were trained using the training data with Python 3.7.0 and Pytorch 1.8 (Facebook, Menlo Park, Ca) on a GeForce GTX 1080Ti 11.0 GB graphics processing unit (NVIDIA, Pittsburgh, PA). Hyperparameter tuning was performed for each CNN, using a random grid search. All code is publicly available (https://github.com/daniella-patton/ClubfootProject).
Fig. 1.

Schematic of the deep learning pipeline where the original input image is preprocessed and passed through a CNN with mixed residual connections. The CNN with mixed residual connections contains a convolutional layer (Conv) and four residual connections (ResBlock) with a stride of 2 max pooling (Pooling) in the down-sampling path and four up-sampling deconvolutional layers (Deconv) with four ResBlocks in the up-sampling path. A residual block comprises of a convolutional layer, batch normalization, and rectified linear unit (ReLU). The number of feature maps is specified in the parentheses (where n represent the feature maps from the previous layer). Long residual connections were integrated, and the loss function is equal to the addition of the loss value as the output of the four layers specified as the circles and arrow outlined in red. The output binary segmentation map is remapped on to the original input image and the image is cropped to focus on the identified foot region. This processed image is passed through a U-Net trained to segment the bones in AP (1st metatarsal, calcaneus, and talus) and lateral radiographs (1st metatarsal, calcaneus, talus, and tibia) [22]
Coarse (Foot) Segmentation: A CNN model with mixed residual connections, a previously described architecture [18], was trained to segment the foot. This model simplifies the input data for the subsequent fine segmentation. The CNN was trained with an Adam optimizer for 150 epochs, a batch size of 8, a learning rate of 1e − 3 with a reduced learning rate on plateau (factor = 0.5, patience = 10), and model weights saved when the loss function was minimized relative to the validation set. A loss function, which combines both the dice coefficient loss (D) and binary cross entropy loss (BCE), was used, because this function has been previously shown to efficiently segment medical imaging data [19, 20]. The loss function L(X, Y) is defined below, where X denotes the output of a network, Y defines the corresponding ground-truth mask, and N represents the number of channels (Eq. 1).
| 1 |
Input images were resized to 272 × 256 pixels, which maintained the average aspect ratio of the input data; intensities were scaled to be in the range [0,1]; and data augmentation including random rotate [0°, 360°] and random flip were applied with a probability of 0.5 to reduce overfitting.
Fine (Bone) Segmentation: First, Contrast Limited Adaptive Histogram Equalization (CLAHE) scikit-image v.0.18.1 was applied to the input image to maximize contrast between overlapping bone regions [21]. Next, the binary output mask from the coarse (foot) segmentation model was remapped to input image following postprocessing (binary closing and largest connected component with scikit-image v.0.18.1 [21]) and cropped to the minimum size that still contained all pixels of the bone mask. Image data was then resized to 256 × 256 pixels with padding to maintain the aspect ratio (Fig. 1). Finally, two separate CNNs were trained using the same base model architecture, training parameters, preprocessing, and augmentation to segment selective bones on AP and lateral radiographs. A U-net architecture [22] with a ResNet-34 encoder backbone, which has been previously trained on the ImageNet dataset [23], was used for multiclass semantic segmentation of the talus, calcaneus, and 1st metatarsal bones on the AP view and with the addition of the distal tibia on the lateral view [24], yielding three- and four-channel feature maps, respectively. These CNNs were trained with an Adam optimizer for 150 epochs, a batch size of 12, an initial learning rate of 1e − 3 with a reduced learning rate on plateau, combined with loss function (described above, Eq. 1), and model weights saved when the loss function was minimized using the validation set.
Data augmentation, including random rotate [0°, 360°], random flip, random zoom [0.75, 1.25], and random speckle noise with a Poisson distribution (to represent the noise distribution present in radiographic images more accurately [21]), was applied with a probability of 0.5 to reduce overfitting.
Automatic Angle Calculation
Based on Simon’s approach for angle measurements in pediatric feet [12], the AP talocalcaneal, AP, and lateral talo-1st metatarsal angles were calculated using the fine bone segmentation masks (binary closing with a disk of 5 pixels using scikit-image v.0.18.1 [21] was filtered by the largest connect component) and partial principal component analysis (PCA, best fit line along the longitudinal axis of each bone). The lateral talocalcaneal angle was calculated between a line drawn along the longitudinal axis of the talus (using the above parameters) and a line drawn along the plantar surface of the calcaneus. The latter was computationally derived by defining the surface that is furthest from the tibia and finding the maximum perpendicular distance between the longitudinal axis and the plantar cortex within 10–35% and 65–90% along the length of the ossification center, which defined the plantar surface vector (Fig. 2). We recorded the time required by our algorithm to segment the bones and calculate the angles for all 60 test studies; the average time per study was calculated and reported.
Fig. 2.

Example of binary fine segmentation maps and vectors for angle calculations on foot radiographs. Fine segmentations maps denote each bone (calcaneus = red; talus = blue-purple; 1st metatarsal = green; and tibia = light blue) with overlap between calcaneus and talus (yellow) on AP (A) and lateral (C) views. Using these maps, vectors are generated for each bone on both AP (B) and lateral (D) views using the PCA method except for the lateral calcaneus where the contour of plantar surface (light blue) was used. All angles were calculated by taking the arccosine of the dot product between unit vectors
Reference Standards
Manual segmentation served as the ground truth for both coarse and fine segmentation models. The coarse segmentation of the foot was performed by a postdoctoral fellow (D.P.) and mask accuracy confirmed by a fellowship-trained radiologist (A.G., 7 years of experience) and the fine segmentation of selective bones was performed by the same fellow (n = 47) and radiologist (n = 168), and mask accuracy confirmed by a pediatric radiology fellow (A.F.) under the supervision of a pediatric musculoskeletal radiologist (J.C.N., 8 years of experience).
Two board-certified pediatric radiologists (R.W.S., 21 years of experience; and J.C.N., with additional fellowship training in musculoskeletal radiology) independently measured all angles on the test set. A macro-enabled workbook (Microsoft Excel (Office 365)) was used to determine the time each radiologist used to calculate all angles for each study (supplementary file 1). The mean value for each angle served as the reference standard and the time to measure all angles on each study was also recorded. Angle measurements for the entire test set was repeated by the pediatric musculoskeletal radiologist (J.C.N.) 1 month later to determine intra-rater reliability.
Statistical Analysis
Quantitative values are presented as mean and standard deviation (SD). Unpaired t-test and chi-square test were used to compare age and gender, respectively, between studies with and without foot malalignment. The dice coefficient (Eq. 2), which measures the spatial overlap between ground-truth and model segmentations, was used to assess model performance on the validation and test sets [25]. Dice coefficients [26] were also calculated for each coarse bone mask on AP and lateral radiographs using Python 3.7.0.
| 2 |
All remaining results were reported from the test dataset. Intraclass correlation coefficients (ICC) with 95% confidence interval (CI) were used to calculate inter-rater (two-way random effects) and intra-rater (two-way mixed effects) reliability between radiologists for all angle measures [27]. ICC with 95% CI (two-way random effects) was also used to calculate reliability between radiologists' mean angle measures to the computationally derived angles from ground-truth segmentation and model segmentations [28]. Bland–Altman bias (β) with limits of agreements and visual plots with 95% CIs were used to visualize differences in angle measures between radiologists' mean and computationally derived angles [29]. Agreement based on ICC values can be categorized [30, 31]. Paired Wilcoxon signed-rank test was used to compare time required to measure all angles for each study manually and automatically by the CNN model. ICC calculations were conducted using the psych package, Bland–Altman analysis and plots with the blandr package, and Wilcoxon signed-rank test with the MASS package in R 4.0.5 software [32–34]. A p value < 0.05 was considered significant. Additionally, root mean squared error was used to determine the algorithm’s performance and evaluate deviation from mean values recorded by the radiologists' measures.
Results
Study Participants
The study group included 164 unique patients (93 boys, mean age: 14.6 ± 10.7 months; 71 girls, mean age: 16.1 years ± 11.0 months), who underwent 216 radiographic studies (44 patients with multiple studies), yielding a total of 450 images (226 AP and 224 lateral views) (one study with repeat imaging in the AP view, five studies with both feet, one study with repeat imaging of both feet, and the reminder of the studies contained single AP and lateral views). Table 1 summarizes the demographic data and its distribution between training, validation, and test sets. No significant difference was found in age (p = 0.188) or sex (p = 0.610) between studies with and without foot malalignment.
Foot and Bone Segmentation
There was high spatial overlap between manual and automatic methods for both coarse and fine segmentations (Fig. 3). Coarse segmentation had mean dice coefficients of 0.98 ± 0.03 and 0.98 ± 0.01, using the validation and test sets, respectively. The mean percent of pixels that represent the foot in each radiograph are 25.2% (SD: 10.8; range: 4.1–55.7%). Fine segmentation had mean dice coefficients of 0.93 ± 0.07 and 0.89 ± 0.15 on AP and 0.92 ± 0.07 and 0.90 ± 0.06 on lateral views, using the validation and test sets, respectively. Table 2 and Fig. 3 summarize the dice coefficients for each bone, which was the highest for the calcaneus on the lateral view (0.94 ± 0.04) and lowest for the 1st metatarsal on the lateral view (0.81 ± 0.14). The mean percent of pixels that represent combination of the bones (talus, calcaneus, 1st metatarsal, and tibia) in each radiograph are 3.9% (SD: 2.1; range: 0.5–10.1%).
Fig. 3.

Spatial overlap for fine segmentation between manual and automatic methods. Boxplots illustrate the dice coefficients for each bone on AP (A) and lateral radiographs (B). Example of corresponding maps generated using manual (C) and automatic methods (D) on lateral (top) and AP (bottom) radiographs (scale bar = 10 mm). Calcaneus = red; 1st metatarsal = green; talus = blue-purple, tibia = light blue
Table 2.
Dice coefficients for fine segmentation on AP and lateral radiographic views using the test set
| View | Calcaneus | Talus | 1st Metatarsal | Tibia |
|---|---|---|---|---|
| AP | 0.89 ± 0.17 | 0.85 ± 0.19 | 0.92 ± 0.12 | N/A |
| Lateral | 0.94 ± 0.04 | 0.87 ± 0.18 | 0.81 ± 0.14 | 0.87 ± 0.21 |
Values are presented as mean ± SD
AP anteroposterior, N/A not applicable, SD standard deviation
Foot Angles
Table 3 summarizes radiologists’ agreement on angle measurements. ICC values were overall high (inter-rater: 0.85–0.95; intra-rater: 0.92–0.97), higher on the lateral radiographic view overall when compared to AP view. Table 4 summarizes agreement between radiologists (using mean angle measures) and CNN-based automated angle calculations. Agreement was higher when automated angles were calculated using manual segmentations (ICC range: 0.71–0.97) than using trained model-derived fine segmentations (ICC range: 0.41 to 0.73). Root mean squared error of the angle measures from the algorithm ranged between 10° and 17° (10.4° for lateral talocalcaneal, 13.5° for lateral talo-1st metatarsal, 16.5° for the AP talocalcaneal angle, and 16.8° for the AP talo-1st metatarsal angles). For both sets of segmentations, higher agreement was also found with angle measurements using the lateral radiographic view when compared to the AP view. Bland–Altman plots values also showed highest and lowest mean bias values for angles measured on the AP view when comparing radiologists' mean to angle calculations using the ground-truth and model segmentations (Figs. 4 and 5). Mean time for the radiologists to measure these angles on each study was 114 s (SD: 24; range: 81–186 s). Mean time for automated angle calculation was 3 s (SD: 2; range: 1–8 s), which is 39-fold faster when compared to the radiologists (p < 0.001).
Table 3.
Radiologists’ agreement on pediatric foot angle measures on AP and lateral radiographic views
| View and angle | Inter-rater | Intra-rater |
|---|---|---|
| ICC [95% CI] | ICC [95% CI] | |
| AP talocalcaneal | 0.85 [0.77, 0.89] | 0.92 [0.87, 0.94] |
| AP talo-1st metatarsal | 0.92 [0.88, 0.95] | 0.95 [0.94, 0.97] |
| Lateral talocalcaneal | 0.93 [0.89, 0.96] | 0.95 [0.92, 0.96] |
| Lateral talo-1st metatarsal | 0.95 [0.92, 0.96] | 0.97 [0.95, 0.98] |
AP anteroposterior, CI confidence interval, ICC intraclass corelation coefficient
Table 4.
Agreement between radiologists' mean and automated angle measurements, using either ground-truth manual segmentation or model-derived automatic segmentation
| View and angle | Ground-truth manual segmentation | Model-derived automatic segmentation | ||
|---|---|---|---|---|
|
ICC [95% CI] |
β [LLOA, ULOA] |
ICC [95% CI] |
β [LLOA, ULOA] |
|
| AP talocalcaneal |
0.71 [0.53, 0.83] |
−4.65 [−21.39, 12.10] |
0.41 [0.19, 0.59] |
−7.40 [−34.59, 19.78] |
| AP talo-1st metatarsal |
0.78 [0.68, 0.85] |
−3.54 [−23.81, 16.71] |
0.52 [0.35, 0.66] |
−3.70 [−35.59, 28.18] |
| Lateral talocalcaneal |
0.95 [0.92, 0.97] |
−0.81 [−10.82, 9.19] |
0.71 [0.59, 0.80] |
−1.11 [−26.47, 26.25] |
| Lateral talo-1st metatarsal |
0.97 [0.96, 0.98] |
−0.65 [−23.81, 16.71] |
0.73 [0.62, 0.82] |
−0.44 [−25.58, 24.69] |
AP anteroposterior, β Bland–Altman mean bias, CI confidence interval ICC intraclass corelation coefficient, LLOA lower limits of agreement, ULOA upper limits of agreement
Fig. 4.

Bland–Altman plots comparing the difference in angle measures (°) between radiologists' mean measurements and automated angle calculations with ground-truth segmentations. Bias (purple) and 95% confidence interval with upper (green) and lower limit of agreement (red) are presented for the AP talocalcaneal (A) and talo-1st metatarsal angles (B), and lateral talocalcaneal (C) and talo-1st metatarsal angles (D)
Fig. 5.

Bland–Altman plots comparing the difference in angle measures (°) between mean radiologist measurements and automated angle calculations with model. Bias (purple) and 95% confidence interval with upper (green) and lower limit of agreement (red) are presented for the AP talocalcaneal (A) and talo-1st metatarsal angles (B), and lateral talocalcaneal (C) and talo-1st metatarsal angles (D)
Discussion
There is a growing interest in the use of CNNs to complement and supplement the clinical and imaging evaluation of patients, identifying and triaging those who need additional assessment and subspecialty referral [15–17]. In this unique patient population of infants and toddlers where foot angle measures are more difficult and often time-consuming because of the smaller size and variable appearance of the ossification centers, an automated system which provides angle measures on foot radiographs at the time of radiological interpretation can positively impact the clinical decision-making by facilitating more objective and reproducible measurements. We automated the segmentation of these early ossification centers by using a 2-phase approach, which achieved overall high spatial overlap when compared to manual segmentation (serving as the ground truth). We also automated the commonly clinically utilized angle measurements, which achieved slightly higher performance with manually segmented bones and on lateral radiographic views when compared to automatically segmented bones and AP views, respectively.
Imaging assessment of various congenital foot malalignments is particularly challenging in younger children. While magnetic resonance imaging (MRI) provides a more comprehensive osteochondral assessment, radiographs remain the most cost-effective and clinically utilized imaging modality that is readily available and can be performed without patient sedation [4, 35–37]. However, discrepancies in angle measurements on radiographs are worse in younger children [38] which has been attributed to a variety of factors including the small size and changing morphology of the early ossification centers, their eccentric positioning within the cartilaginous anlage, and delayed appearance in feet with malalignment [35, 37]. At birth, only the calcaneus, talus, cuboid, and metatarsal ossification centers are present while the navicular ossification center does not appear until 2–3 years of life [12, 37]. Thus, although alignment across the talonavicular joint has the greatest clinical accuracy in predicting the type and severity of forefoot malalignment, in younger children, the talo-1st metatarsal alignment often serves as the surrogate for assessing the presence or absence of abnormal varus and valgus alignment of the forefoot relative to the hindfoot [36, 37]. Moreover, results from cadaveric studies on infant feet have shown that the longitudinal axes of these early ossification centers may differ slightly from their respective cartilaginous anlage, ranging between 0.8 and 1.3° for the calcaneus and 7.6 and 9.6° for the talus [39]; and this difference is greater for the calcaneus in clubfeet when compared to the talus, on both AP and lateral views [40]. These findings may in part be attributed to a more rounded appearance of the newly formed ossification centers, making the determination of its longitudinal axis more subjective. The ossification centers in children with clubfeet often appear later in life and are smaller in size when compared to contralateral unaffected foot, which further contributes to this difficulty in identifying the longitudinal axes that can directly impact the resulting angle measurements. Therefore, a more reproducible automatic method for angle measurements in these younger patients is critically important and is fundamental for diagnosing and facilitating serial evaluations, as well as for allowing comparisons between patients with different malalignment severities and between treatment methods [5, 35, 38].
Our study used a two-phase segmentation approach that has been previously described [18, 41]. This approach required a CNN model to first coarsely segment the foot, followed by fine segmentation of individual bones on AP and lateral radiographs, which was developed and tested over a wide spectrum of osseous morphologies that can present during early development, between 0 and 3 years of age. The upper range of 3 years was selected for our study, because at this age, the unossified growth cartilage of the foot has mostly been replaced by bone and the morphology of the ossification centers are more reflective and less variable from the underlying cartilaginous anlage. Additionally, depending on the severity of the malalignment and the family and surgeon’s preference, most patients undergo more definitive surgical correction between 3 months and 4 years of age [5, 12, 37]. In our study, the coarse segmentation of the foot was a necessary first step because the bones identified in the relatively small size of the feet of these younger children represent 4% of all pixels within the field of view for a radiograph. Thus, the trained CNN reframed the region of interest around the foot, which, additionally, frequently removed metal artifacts or other aids used for patient positioning. Using these reframed images, the fine segmentation was trained to segment selective bones, which had the highest performance with the lateral calcaneus and lower performance with the lateral 1st metatarsal. The lower performance on the lateral 1st metatarsal may be attributed to the increased osseous overlap of the 1st metatarsal with the other metatarsals on the lateral view [36], which reduces regional tissue penetration (lower signal-to-background pixel distinction) and partially obscures osseous margins. Although these factors may also hinder the precise determination of the longitudinal axis of the 1st metatarsal; the lateral talo-1st metatarsal angle measurements had the highest agreement between radiologists and between manual and automatic methods. These latter findings suggest that a minor degree of imperfection in segmentation may not negatively impact the subsequent angle calculation.
Our automated algorithm for measuring foot angles in these younger children demonstrated moderate to substantial agreement when compared to pediatric radiologists, which is slightly lower when compared to agreement between radiologists and other published reports [4, 35], but is on par with other studies that reported agreement between clinicians and orthopedists [38]. Our study found that agreement was consistently slightly better on angles measured using lateral radiographic views when compared to AP views for both manual measurements by radiologists and automated calculations by CNN. This trend was also observed when automated calculations were derived using both manually and automatically segmented bones. Although one might expect the algorithm to perform similarly and independently of the radiographic view, this differential agreement between radiographic views has been previously observed among orthopedic residents and surgeons [5, 8]. This highlights the need for higher scrutiny of these AP angles prior to medical decision-making. Our current study design derived angles indirectly using segmentation masks rather than directly from a CNN. This approach of using partial PCA and centroid calculations has been previously described in other systems [18, 42, 43], but may be more sensitive to minor imperfection of the segmentation masks as reduced agreement was observed with automatically segmented masks when compared to manually segmented masks (Fig. 6). An alternative approach, as a future research direction, may instead calculate output angles directly and train a dataset curated with all reference standards so that an optimized model will more directly derive the outcome measure of interest [44].
Fig. 6.
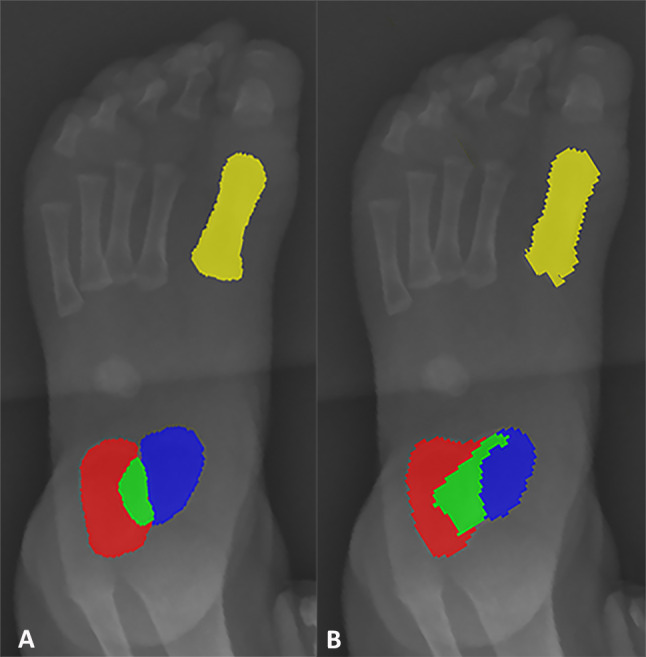
Example of imprecise automatic segmentation. AP radiographic example, comparing between manual (A) and automatic methods (B) for segmentation. Calcaneus = red; 1st metatarsal = yellow; talus = blue; overlap = green
Our study has several limitations. First, although our dataset of 450 infant and toddler radiograph images is not small when compared to the existing published literature on pediatric foot malalignment [5, 38, 45], this size is relatively small for optimal CNN development. However, the objective of the current project was to demonstrate the feasibility of automating angle measurements using a diversity of immature ossific morphologies. Additional and follow-up studies are necessary to further optimize this model and validate these results using images obtained from other institutions, to increase and confirm generalizability. Second, the retrospective nature of this study prevented standardization of patient positioning and image acquisition parameters and prohibited the acquisition of additional weight-bearing or better positioned images. The latter is often difficult, particularly in younger and uncooperative patients. However, this also makes these images more reflective of routine clinical practice at most pediatric centers where patients may not be optimally positioned, and repeat images were typically avoided due to concerns over the unnecessary additional ionizing radiation. These factors, along with the lack of direct correlation between angle measures and patient function, have led some authors to suggest the avoidance in the use of absolute angle cut-off values to define different types and severity of foot malalignments [12, 35, 38] whereas other authors suggest the use of mean values rather than the range to define alignment [12]. In our study, we used the mean values from the radiologists as the reference standard; however, it is worth noting that although these radiologists were blinded to the clinical diagnoses and are well-qualified to measure these angles, they are not blinded by the findings visible on the images and the process of measuring a large set of angles (4 angles per study for a total of 60 studies) may produce measurement fatigue [5]. Additionally, our study only attempted to automate the measurements of the talocalcaneal and the talo-1st metatarsal angles. A wide range of angles can be measured as part of the workup for assessing foot alignment and future studies are necessary to further advance along this line of investigation as better and novel new measurements are developed. Finally, our study does not address the cartilaginous and soft tissue components, which are not resolved on radiographs and our study did not include an exhaustive list of all published angles, but rather focused on the angles most used clinically to screen patients for malalignment.
Conclusion
In conclusion, our study has documented the feasibility of using a deep learning approach to automate foot and bone segmentations as well as to calculate talocalcaneal and talo-1st metatarsal angles, performing at a speed that is 39 times faster than manual angle measures. Our study purposely utilized radiographic images from younger children with variable ossification centers to generate the best fitted CNN model that produced the highest spatial overlap for bone segmentation and yielded moderate to substantial agreement with angle calculations when compared to manual methods. Future work should focus on improving model performance by evaluating a larger and more diverse dataset, subcategorizing various age ranges, and evaluating new methods that combine and directly automate angle calculations. Exploring other less commonly utilized and more complex angle measures and osseous overlaps may be feasible using CNN, which may more directly correlate with functional status and clinical change, predicting recovery or disease progression over time.
Supplementary Information
Below is the link to the electronic supplementary material.
Author Contribution
All authors contributed to the study conception and design. Material preparation, data collection, and analysis were performed by Daniella Patton, Adarsh Ghosh, and Saurav Bose. The first draft of the manuscript was written by Adarsh Ghosh and Daniella Patton and all authors commented on previous versions of the manuscript. All authors read and approved the final manuscript.
Declarations
Ethical Approval
All procedures performed in studies involving human participants were in accordance with the ethical standards of the institutional and/or national research committee and with the 1964 Helsinki declaration and its later amendments or comparable ethical standards.
Consent to Participate
Ethical approval was waived by the local Ethics Committee of the Children’s Hospital of Philadelphia in view of the retrospective nature of the study and all the procedures being performed were part of the routine care.
Consent for Publication
This material has not been published elsewhere.
Conflict of interest
The authors declare no competing interests.
Footnotes
Publisher's Note
Springer Nature remains neutral with regard to jurisdictional claims in published maps and institutional affiliations.
Daniella Patton and Adarsh Ghosh contributed equally to this work.
References
- 1.Widhe T, Aaro S, Elmstedt E. Foot deformities in the newborn–incidence and prognosis. Acta Orthop Scand. 1988;59(2):176–179. doi: 10.3109/17453678809169703. [DOI] [PubMed] [Google Scholar]
- 2.Widhe T, Aaro S, Elmstedt E. Foot deformities in the newborn — incidence and prognosis. Acta Orthop. 1988;59(2):176–179. doi: 10.3109/17453678809169703. [DOI] [PubMed] [Google Scholar]
- 3.Gore AI, Spencer JP. The newborn foot. Am Fam Physician. 2004;69(4):865–872. [PubMed] [Google Scholar]
- 4.Kamath SU, Austine J. Radiological assessment of congenital talipes equinovarus (clubfoot): Is it worthwhile? Foot (Edinb). 2018;37:91–94. doi: 10.1016/j.foot.2018.06.001. [DOI] [PubMed] [Google Scholar]
- 5.Thometz J, Manz R, Liu X-C, Klein J, Manz-Friesth B. Reproducibility of radiographic measurements in assessment of congenital talipes equinovarus. Am J Orthop. 2009;38(12):617–620. [PubMed] [Google Scholar]
- 6.Raj MA, Tafti D, Kiel J. Pes Planus. StatPearls. Treasure Island (FL): StatPearls Publishing; 2023. [PubMed]
- 7.Gibboney MD, LaPorta GA, Dreyer MA. Interobserver analysis of standard foot and ankle radiographic angles. J Foot Ankle Surg. 2019;58(6):1085–1090. doi: 10.1053/j.jfas.2018.12.037. [DOI] [PubMed] [Google Scholar]
- 8.Radler C, Manner HM, Suda R, Burghardt R, Herzenberg JE, Ganger R, et al. Radiographic evaluation of idiopathic clubfeet undergoing Ponseti treatment. J Bone Joint Surg Am. 2007;89(6):1177–1183. doi: 10.2106/00004623-200706000-00004. [DOI] [PubMed] [Google Scholar]
- 9.Aboelenein AM, Fahmy ML, Elbarbary HM, Mohamed AZ, Galal S. Calcaneal lengthening for the pes planovalgus foot deformity in children with cerebral palsy. J Clin Orthop Trauma. 2020;11(2):245–250. doi: 10.1016/j.jcot.2018.07.021. [DOI] [PMC free article] [PubMed] [Google Scholar]
- 10.Li J, Liu Y, Li Y, Yuan Z, Xu H, Canavese F. Early radiographic changes in the lateral talocalcaneal angle following achilles tenotomy in children with idiopathic clubfoot. Foot Ankle Int. 2020;41(3):350–355. doi: 10.1177/1071100719895211. [DOI] [PubMed] [Google Scholar]
- 11.Zhang G, Zhang Y, Li M. A modified ponseti method for the treatment of rigid idiopathic congenital clubfoot. J Foot Ankle Surg. 2019;58(6):1192–1196. doi: 10.1053/j.jfas.2019.04.003. [DOI] [PubMed] [Google Scholar]
- 12.Simons GW. Analytical radiography of club feet. J Bone Joint Surg Br. 1977 Nov;59-B(4):485–9. [DOI] [PubMed]
- 13.Simons GW. A standardized method for the radiographic evaluation of clubfeet. Clin Orthop Relat Res. 1978;135:107–118. [PubMed] [Google Scholar]
- 14.Chea P, Mandell JC. Current applications and future directions of deep learning in musculoskeletal radiology. Skeletal Radiol. 2020;49(2):183–197. doi: 10.1007/s00256-019-03284-z. [DOI] [PubMed] [Google Scholar]
- 15.Esteva A, Kuprel B, Novoa RA, Ko J, Swetter SM, Blau HM, et al. Dermatologist-level classification of skin cancer with deep neural networks. Nature. 2017;542(7639):115–118. doi: 10.1038/nature21056. [DOI] [PMC free article] [PubMed] [Google Scholar]
- 16.Larson DB, Chen MC, Lungren MP, Halabi SS, Stence NV, Langlotz CP. Performance of a Deep-Learning Neural Network Model in Assessing Skeletal Maturity on Pediatric Hand Radiographs. Radiology. 2018;287(1):313–322. doi: 10.1148/radiol.2017170236. [DOI] [PubMed] [Google Scholar]
- 17.Gulshan V, Peng L, Coram M, Stumpe MC, Wu D, Narayanaswamy A, et al. Development and validation of a deep learning algorithm for detection of diabetic retinopathy in retinal fundus photographs. JAMA. 2016;316(22):2402–2410. doi: 10.1001/jama.2016.17216. [DOI] [PubMed] [Google Scholar]
- 18.Zheng Q, Shellikeri S, Huang H, Hwang M, Sze RW. Deep learning measurement of leg length discrepancy in children based on radiographs. Radiology. 2020;296(1):152–158. doi: 10.1148/radiol.2020192003. [DOI] [PubMed] [Google Scholar]
- 19.Isensee F, Jaeger PF, Kohl SAA, Petersen J, Maier-Hein KH. nnU-Net: a self-configuring method for deep learning-based biomedical image segmentation. Nat Methods. 2021;18(2):203–211. doi: 10.1038/s41592-020-01008-z. [DOI] [PubMed] [Google Scholar]
- 20.Kholiavchenko M, Sirazitdinov I, Kubrak K, Badrutdinova R, Kuleev R, Yuan Y, et al. Contour-aware multi-label chest X-ray organ segmentation. Int J Comput Assist Radiol Surg. 2020;15(3):425–436. doi: 10.1007/s11548-019-02115-9. [DOI] [PubMed] [Google Scholar]
- 21.van der Walt S, Schönberger JL, Nunez-Iglesias J, Boulogne F, Warner JD, Yager N, et al. scikit-image: image processing in Python. PeerJ. 2014;19(2):e453. doi: 10.7717/peerj.453. [DOI] [PMC free article] [PubMed] [Google Scholar]
- 22.Ronneberger O, Fischer P, Brox T. U-Net: Convolutional Networks for Biomedical Image Segmentation. In: Navab N, Hornegger J, Wells WM, Frangi AF, editors. Medical Image Computing and Computer-Assisted Intervention (MICCAI) Cham: Springer International Publishing; 2015. pp. 234–241. [Google Scholar]
- 23.Deng J, Dong W, Socher R, Li L-J, Li K, Fei-Fei L. ImageNet: A large-scale hierarchical image database. 2009 IEEE Conference on Computer Vision and Pattern Recognition. IEEE; 2009. p. 248–55.
- 24.GitHub- qubvel/segmentation_models.pytorch: Segmentation models with pretrainedbackbones. PyTorch. [Internet]. [cited 2021 Jun 24]. Available from: https://github.com/qubvel/segmentation_models.pytorch [Internet]. GitHub - qubvel/segmentation_models.pytorch: Segmentation models with pretrained backbones. PyTorch. [cited 2021 Jun 24]. Available from: https://github.com/qubvel/segmentation_models.pytorch.
- 25.Taha AA, Hanbury A. Metrics for evaluating 3D medical image segmentation: analysis, selection, and tool. BMC Med Imaging. 2015;15(1):29. doi: 10.1186/s12880-015-0068-x. [DOI] [PMC free article] [PubMed] [Google Scholar]
- 26.Zou KH, Warfield SK, Bharatha A, Tempany CMC, Kaus MR, Haker SJ, et al. Statistical validation of image segmentation quality based on a spatial overlap index. Acad Radiol. 2004;11(2):178–189. doi: 10.1016/S1076-6332(03)00671-8. [DOI] [PMC free article] [PubMed] [Google Scholar]
- 27.Gisev N, Bell JS, Chen TF. Interrater agreement and interrater reliability: key concepts, approaches, and applications. Res Social Adm Pharm. 2013;9(3):330–338. doi: 10.1016/j.sapharm.2012.04.004. [DOI] [PubMed] [Google Scholar]
- 28.Warfield SK, Zou KH, Wells WM. Simultaneous truth and performance level estimation (STAPLE): an algorithm for the validation of image segmentation. IEEE Trans Med Imaging. 2004;23(7):903–921. doi: 10.1109/TMI.2004.828354. [DOI] [PMC free article] [PubMed] [Google Scholar]
- 29.Popović ZB, Thomas JD. Assessing observer variability: a user’s guide. Cardiovasc Diagn Ther. 2017;7(3):317–324. doi: 10.21037/cdt.2017.03.12. [DOI] [PMC free article] [PubMed] [Google Scholar]
- 30.Landis JR, Koch GG. The measurement of observer agreement for categorical data. Biometrics. 1977;33(1):159–174. doi: 10.2307/2529310. [DOI] [PubMed] [Google Scholar]
- 31.Koo TK, Li MY. A guideline of selecting and reporting intraclass correlation coefficients for reliability research. J Chiropr Med. 2016;15(2):155–163. doi: 10.1016/j.jcm.2016.02.012. [DOI] [PMC free article] [PubMed] [Google Scholar]
- 32.CRAN - Package psych [Internet]. [cited 2021 Jul2]. Available from: https://CRAN.R-project.org/package=psych [Internet]. CRAN. [cited 2021 Jul 2]. Available from: https://CRAN.R-project.org/package=psych.
- 33.GitHub - deepankardatta/blandr: blandr: aBland-Altman Method Comparison package for R [Internet]. [cited 2021 Jul 2].Available from: https://github.com/deepankardatta/blandr [Internet]. GitHub. [cited 2021 Jul 2]. Available from: https://github.com/deepankardatta/blandr.
- 34.R Core Team (2020) R: A Language and Environment for Statistical Computing. R Foundation for Statistical Computing, Vienna, Austria. https://www.r-project.org/ [Internet]. [cited 2021 Jul 2]. Available from: https://www.r-project.org/.
- 35.Herbsthofer B, Eckardt A, Rompe JD, Küllmer K. Significance of radiographic angle measurements in evaluation of congenital clubfoot. Arch Orthop Trauma Surg. 1998;117(6–7):324–329. doi: 10.1007/s004020050259. [DOI] [PubMed] [Google Scholar]
- 36.Thapa MM, Pruthi S, Chew FS. Radiographic assessment of pediatric foot alignment: review. AJR Am J Roentgenol. 2010;194(6 Suppl):S51–S58. doi: 10.2214/AJR.07.7143. [DOI] [PubMed] [Google Scholar]
- 37.Harty MP, Hubbard AM. MR imaging of pediatric abnormalities in the ankle and foot. Magn Reson Imaging Clin N Am. 2001 Aug;9(3):579–602, xi. [PubMed]
- 38.Radler C, Egermann M, Riedl K, Ganger R, Grill F. Interobserver reliability of radiographic measurements of contralateral feet of pediatric patients with unilateral clubfoot. J Bone Joint Surg Am. 2010;92(14):2427–2435. doi: 10.2106/JBJS.I.01444. [DOI] [PubMed] [Google Scholar]
- 39.Itohara T, Sugamoto K, Shimizu N, Ohno I, Tanaka H, Nakajima Y, et al. Assessment of the three-dimensional relationship of the ossific nuclei and cartilaginous anlagen in congenital clubfoot by 3-D MRI. J Orthop Res. 2005;23(5):1160–1164. doi: 10.1016/j.orthres.2005.02.004. [DOI] [PubMed] [Google Scholar]
- 40.Howard CB, Benson MK. The ossific nuclei and the cartilage anlage of the talus and calcaneum. J Bone Joint Surg Br. 1992;74(4):620–623. doi: 10.1302/0301-620X.74B4.1624527. [DOI] [PubMed] [Google Scholar]
- 41.Oh Y, Park S, Ye JC. Deep Learning COVID-19 Features on CXR Using Limited Training Data Sets. IEEE Trans Med Imaging. 2020;39(8):2688–2700. doi: 10.1109/TMI.2020.2993291. [DOI] [PubMed] [Google Scholar]
- 42.Tu Y, Wang N, Tong F, Chen H. Automatic measurement algorithm of scoliosis Cobb angle based on deep learning. J Phys: Conf Ser. 2019;1187(4):042100. [Google Scholar]
- 43.Rouzrokh P, Wyles CC, Philbrick KA, Ramazanian T, Weston AD, Cai JC, et al. A deep learning tool for automated radiographic measurement of acetabular component inclination and version after total hip arthroplasty. J Arthroplasty. 2021;36(7):2510–2517.e6. doi: 10.1016/j.arth.2021.02.026. [DOI] [PMC free article] [PubMed] [Google Scholar]
- 44.Nitris L, Varfolomeeva A, Blinov D, Kamishanskaya I, Lobishcheva A, Dydykin S, et al. Purpose: To develop promising approach for longitudinal flatfoot determination on a base of neural network, which effectively affects. Imaging Med [Internet]. 2019 [cited 2023 Mar 23];11(5):67–75. Available from: https://www.openaccessjournals.com/abstract/artificial-intelligencebased-solution-for-xray-longitudinal-flatfoot-determination-and-scaling-13133.html.
- 45.Vanderwilde R, Staheli LT, Chew DE, Malagon V. Measurements on radiographs of the foot in normal infants and children. J Bone Joint Surg Am. 1988;70(3):407–415. doi: 10.2106/00004623-198870030-00013. [DOI] [PubMed] [Google Scholar]
Associated Data
This section collects any data citations, data availability statements, or supplementary materials included in this article.