

Abstract
If lung cancer is not detected in its initial phases, it can be fatal. However, because of the quantity and structure of its nodules, lung cancer is difficult to detect early. For accurate detections, radiologists require assistance from automated tools. Numerous expert methods have been created over time to assist radiologists in the diagnosis of lung cancer. However, this requires accurate research. Therefore, in this article, we propose a framework to precisely detect lung cancer by categorizing it between benign and malignant nodules. To achieve this objective, an efficient deep-learning algorithm is presented. The presented technique consists of four stages, namely pre-processing, segmentation, classification, and severity stage analysis. Initially, the collected image is given to the pre-processing stage to eliminate the distortion present in the image. Then, the noise-free image is given to the segmentation stage. For segmentation, in this paper, modified regularized K-means (MRKM) clustering algorithm is presented. After the segmentation process, the segmented nodule image is fed to the classification stage to categorize the nodule as benign or malignant (risk nodule). For classification, an improved convolution neural network (ICNN) is presented. The proposed ICNN is designed by modifying CNN with the integration of the adaptive tree seed optimization (ATSO) algorithm. Finally, the stage identification is carried out based on the size of the nodule and we classify the malignant nodule as S1–S4. The presented technique attained the maximum accuracy of 96.5% and performance compared with existing state-of-art methods.
Keywords: Lung nodule, Modified regularized K-means, Improved convolution neural network, Adaptive tree seed optimization, Severity
Introduction
A total of 9.6 million people died from cancer in 2018, making it the second largest cause of death [1]. According to the World Health Organization (WHO), 2.09 million new cases of lung cancer are diagnosed annually, and 1.76 million individuals pass away from the condition [2, 3]. Lung cancer incidence decreased by 2% annually in males over the preceding 10 years, whereas it nearly stabilized in women [4]. However, if cancer is detected in its early stages, the mortality rate can be reduced [5]. Smoking, exposure to toxic chemicals, air pollution, etc. are causes of lung cancer [6]. Depending on the type, stage, and molecular characteristics of cancer [7], surgery or radiation therapy will be given to the patient. The difficulty in identifying malignant lung nodules is one of the primary reasons for the high death rate [8]. Typically, it is already too late when nodules are discovered. To adequately treat the nodules, they must either be too massive or too far along [9]. To identify a malignant lung nodule early, when it can still be efficiently addressed, there is a need for lung screening [10]. Chest X-rays are taken traditionally (CXR) and have been used for many years. However, CXR is of limited benefit because it can only be used to detect big lung nodules [11].
Due to the development of X-ray computed tomography (CT) techniques, there is an opportunity to evaluate potentially cancerous nodules [12]. Measuring the severity of the condition and planning a course of medication or surgery is also beneficial [13]. Technological advances in imaging techniques have made computerized investigation automated and free from human effort [14, 15]. Physicians and radiologists generally prefer several auxiliary modules to aid in diagnostic procedures. Robust image processing technologies are essential for radiology-based analyses of the lung segmentation process to effectively extract features linked to lung disease and lung shape [16]. Once the lungs are located on a chest CT scan, the segment containing the disease is further identified by using a classification system to produce reliable results [17].
In recent years, many techniques have been utilized for lung nodule-based segmentation and classification such as support vector machines (SVMs) [18, 19], artificial neural networks (ANNs) [20], recurrent neural networks (RNNs) [21], long short-term memory (LSTM) [22], and other deep and machine-learning techniques [23, 24]. Similarly, some of the segmentation techniques, namely level set [25], graph cut [26], convolution neural network [27], and U-Net [28], are used for segmentation, even though lung cancer classification needs improvement. So, in this paper, a novel approach is proposed. The main objective of the proposed technique is to effectively classify a nodule as malignant or benign. To achieve this concept, initially, we segment the nodules from input lung images using MRKM clustering. After the segmentation process, classification is carried out based on the ICNN classifier. The main contribution of the presented approach is listed below:
An efficient clustering technique, i.e., MRKM clustering approach is proposed to effectively segment the nodules present in the input lung image. The proposed MRKM clustering algorithm effectively reduces the drawbacks of the traditional k-means clustering algorithm.
An efficient deep learning model called ICNN is proposed to automatically classify the segmented nodules as malignant or benign. The presented ICNN is a hybridization of CNN and ATSO algorithms.
The efficiency of the presented technique is investigated based on different metrics and performance compared with different state-of-art techniques.
Literature Review
Many of the researchers had developed lung nodule segmentation and classification. Among them, some of the works are analyzed in this section. Meraj et al. [29] have analyzed that CNN-based identification of lung nodules was used to identify arteries and potential nodules in the lung region. The LIDC dataset was utilized for the investigation, and the technique produced an accuracy score of 96.23% utilizing tenfold cross-validation having a loss of 0.77%. The complexity of the system should be removed. In 2017, Deen [30] analyzed the multimodal grayscale lung CT scan segmentation. The distinction between normal cells and pathological cells was made using a classification procedure depending on the CNN classifier. The Interstitial Lung Disease (ILD) database was used for the empirical analysis, and the technique’s accuracy is 95%. However, the accuracy of the classification model is to be improved. Dutande et al. [31] have developed employing 2D-3D cascaded CNN, separate and classify lung nodules. The sensitivity of the approach is 92%, and the empirical outcome uses clinical datasets from the Indian Lung CT Image Database (ILCID), the LNDb challenge dataset, and the publically accessible Lung Image Database Consortium- Image Database Resource Initiative (LIDC). In 2017, Sarker et al. [32] analyzed a 3D lung tumor identification, mass estimation, and tumor staging utilizing morphological image analysis and the k-means clustering algorithm. The SPIEAAPM Lung CT challenge dataset through the Cancer Imaging Archive (TCIA) was utilized. The method’s accuracy, as determined by the empirical results, is 95.68%. This technique adds value by detecting 3D tumor nodules utilizing CT data having 98% specificity.
In [33], Keetha and Annavarapu have proposed that U-Net is a resource-efficient model architecture that uses deep learning from beginning to finish solving a given problem. Among the encoder and decoder, it uses a Bi-FPN (bidirectional feature network). On the LUNA-16 dataset, which consists of 1186 lung nodules and is accessible to the public, the suggested model is thoroughly tested and developed. With a dice similarity coefficient (DSC) of 82.82%, the U-Det construction exceeds the current U-Net model in terms of performance. In 2019, Nasrullah et al. [34] analyzed the cancerous nodules’ exact diagnosis. Deep CNN is used in image processing to identify and classify lung nodules. The system’s LIDC-IDRI datasets evaluation showed that its sensitivity is 94% and specificity is 91%. In 2017, Ganesan and Merline [26] analyzed lung nodules of the image using FCM clustering segmentation and classify an image as normal tissue or abnormal tissue. Using the ILD database, they investigate the experimental results. However, the segmentation section should be improved for better output.
In 2022, Pfeffer and Ling [25] analyzed to optimize the classification of pulmonary nodules using CNNs with a genetic algorithm. The system’s ILDC database evaluation showed that its accuracy was 91.3%. This system attained the minimum accuracy, so it should be improved. In 2022, Halder et al. [27] developed classification using CNN for lung nodules. Experiments have been trained and evaluated on the LIDC-IDRI dataset and achieved a sensitivity, specificity, and accuracy of 96.85%, 95.17%, and 96.10%. In 2021, Khan [28] analyzed deep CNN for lung cancer classification using CT images based LIDC dataset for detecting cancerous and noncancerous lung nodules for measuring the accuracy of classification above 90%.
From the survey, we understand that some classification approaches cannot be considered automatically. Furthermore, most pulmonary nodule classification works in the literature do not provide a robust evaluation of their tests. Some of them evaluated their approach using only small samples. These problems are the focus of this proposed work.
Proposed Lung Nodule Detection and Classification
Malignant lung nodules are one of the leading causes of mortality worldwide. Early diagnosis lowers the patient mortality rate. The main issue with these techniques is the presence of false positive results, which might outcome in an incorrect diagnosis. To avoid an inaccurate diagnosis system, in this paper, automatic lung nodule detection system using a deep learning technique is proposed. The proposed lung nodule classification system consists of four stages, namely pre-processing, segmentation, classification, and severity analysis. Initially, the captured images are pre-processed using a Gaussian filter. Then, the images are given to the segmentation process. For segmentation, in this paper, a modified regularized k-means clustering algorithm is proposed. After the segmentation process, the segmented nodule is given to the classification process. For classification, an ICNN is presented. ICNN is a hybridization of CNN and ATSO. After the classification process, the severity of the image is identified using the area of the affected portion. The system architecture of the suggested technique is given in Fig. 1.
Fig. 1.
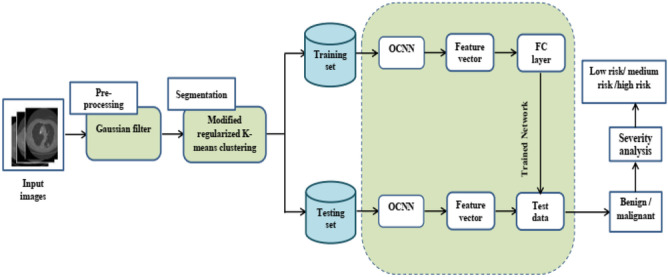
System architecture of proposed methodology
Pre-Processing
Image pre-processing is necessary to improve the integrity of lung images since poor-quality images can reduce the system’s effectiveness. To enhance the image, in this paper, a Gaussian filter is applied. The Gaussian filter is a conventional linear filter that is widely used for image denoising. In Gaussian filters, the weight of pixels decays with distance from the center of the filter. The mathematical expression of the Gaussian filter is given in Eq. (1).
| 1 |
| 2 |
where, horizontal distance from the origin is represented as , the vertical distance from the origin is represented as b, and the standard deviation of Gaussian distribution is represented as σ. This filter is effectively reducing the noise and preserves the edges. The pre-processed images are given for further processing.
Segmentation Using Modified Regularized K-Means
After the pre-processing, the images are fed to the segmentation phase to separate the nodules from the input images. To achieve this concept, the MRKM algorithm is presented. The k-means clustering algorithm is the most popular algorithm for segmentation; however, the traditional k-means clustering algorithm treats different data equally and falls on local centroid value. This technique effectively segments the nodule and overcomes the difficulties present in conventional KM clustering. Consider a dataset , n is the total quantity of images present in the dataset, , m is the number of attributes; the membership matrix is represented as M, which depicts that the pixel is allocated to the cluster, else, if the pixel is not allocated to the cluster. W is an adaptive weight vector , that depicts the weight of the image ; F represents an adaptive feature weight matrix.
| 3 |
In above equation, row demonstrates the weight vector of all m attributes in the cluster , , the number of clusters is represented as c. The cluster center is given in Eq. (4).
| 4 |
In the above equation, row demonstrates the cluster center. The impartial purpose of the suggested MRKM cluster is given in Eq. (5).
| 5 |
Subjected to the constraint:
To minimize the objective function of k-means clustering, an iterative rule is applied. We may obtain the equivalent Lagrangian function from the objective function as shown below:
| 6 |
To reduce the impartial function (4), we update the parameters M, G, W, and R using iterative rules.
A. The Iterative Rule of M
To update the membership function , we fix , , and and the updation formula is given in Eq. (7).
| 7 |
B. Iterative Rule of W
Set the derivatives of the Lagrangian function to zero for the data to update the data weight:
| 8 |
| 9 |
| 10 |
| 11 |
Because :
We can get:
| 12 |
| 13 |
C. The Iterative Rules of F
To update the feature weight Fij, we derivate the Lagrangian function for zero. The updating function is given in below equations:
| 14 |
| 15 |
D. The Iterative Rules of G
The cluster center Gij is updated based on the below Eq. (16):
| 16 |
On k iterations, the clustering procedure is repeated. We discovered the n-number of clusters following the clustering procedure. The clustering output is given to the input of the classification process.
Classification Using Improved Convolution Neural Network
After the segmentation process, the segmented ROI part is fed to the input of the classifier to classify an image as Benign or malignant. For classification, in this paper, an improved CNN classifier is used. In CNN, along with the CNN-created feature map, handcrafted features are also combined. To enhance the CNN classification performance, the fully connected layer parameters are optimally selected using the ATSO algorithm.
Convolution Neural Network
A multi-layer neural network called CNN is made up of several convolutional layers, followed by pooling layers and one or more fully linked layers. The basic principle of CNN is that it can extract local features from inputs in higher layers and pass them to lower layers for more complex features. Figure 2 illustrates CNN’s main organizational structure. The basic structure of CNN can be divided into five parts, namely the input layer, convolution layer, pooling layer, fully connected layer, and output layer.
Fig. 2.
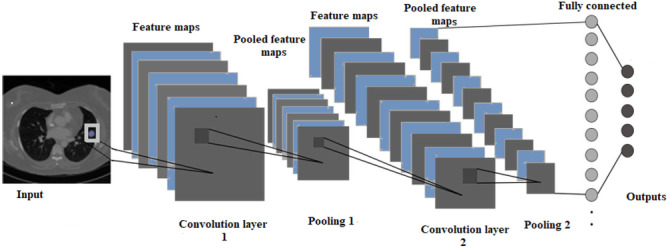
Basic structure of CNN
Input Layer
The input of the classification process is given in this layer. The initial input information may be immediately acted upon by the convolution input stage. The input information from the input image is the image’s pixel value.
Convolution Layer
The convolution layer generates the feature map of the input image. A collection of kernels are included in the convolutional phase to create a tensor of attribute mappings. These kernels use “stride(s)” to concatenate the complete input, changing the output volume’s lengths to numbers. Following the striding procedure, the convolutional layer’s proportions of an input volume shrink. Equation (17) describes how the convolutional layer operates:
| 17 |
where:
The feature graph of layer
Weight matrix Bias term
The activation function used in this paper is rectified linear unit (ReLU) which is utilized to maximize nonlinearity in feature maps. ReLU calculates activating by maintaining a zero threshold parameter. It is written theoretically as follows:
| 18 |
Pooling Layer
The pooling layer is used to minimize the feature map. For the pooling layer, downsampling is used. The most popular technique, max pooling, generates the greatest value in an input area. The pooling process is given in Fig. 3.
Fig. 3.
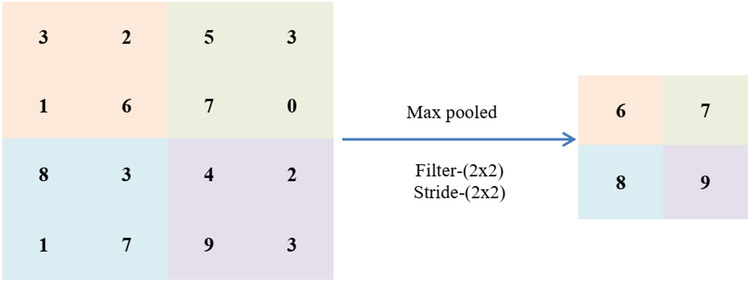
Pooling process
Fully Connected Layer
It performs the classification process which consists of several connection layers. This layer is a hidden layer of multilayer perceptron.
Output Layer
Depending on particular application requirements, the output layer’s neural node count is determined. The output layer of a CNN is often a classifier if the task is one of classification.
Weight Optimization Using Adaptive Tree Seed Optimization Algorithm
In this section, the weight values present in the fully connected layer are optimally selected using the ATSO algorithm. The interaction between trees and their seeds served as the basis for this algorithm’s construction. As these seeds mature throughout the period, new trees are created from them. The placement of trees and seeds can be taken into consideration as a potential optimum issue solution if the surface of these trees is thought of as the search space for the optimal solution. To enhance the tree seed algorithm, crossover and mutation operators are included in the updation function, which is avoiding the local optimum. The step-by-step process of optimal weight value selection process is explained below:
Step 1: Solution Encoding
Initialization is a significant procedure for finding the optimal solution. The solution consists of weight values of a fully connected layer. In this paper, the solution is called a tree and the weight value is called seeds. Initially, the tree values are generated randomly. The initial tree format is given in Eq. (19).
| 19 |
| 20 |
In Eq. (20), Pi represents the total population, T1 represents the solution, and w11 represents the weight values.
Step 2: Fitness Calculation
After the solution initialization process, the fitness of each solution is calculated. In this paper, the accuracy value is considered a fitness function. A good classification system should have maximum accuracy. The fitness function is given in Eq. (21).
| 21 |
Step 3: Updation Using the ATSO Algorithm
Two search equations—the global search equation and the local search equation—are used to update data since they both answer the optimization issue in terms of both exploration and exploitation. Moreover, by altering search inclination (ST), the two search stages can be alternated.
The seed is updated in its position based on ST and Rij value. If the value of Rij appears to be less than the ST value, using Eq. (22), the solution is updated.
| 22 |
Otherwise, the solution is updated using Eq. (23).
| 23 |
where:
Value of seed
Value of tree
Best tree location
jth dimension of tree chosen from the population
Scaling factor in the range of [-1,1]
Step 4: Crossover Operation
After the updation function, solutions are updated using a cross-over of the operation. Using this operation, we can get a new set of solutions.
Step 5: Mutation Operation
After the crossover operation, the solutions are mutated. Using this mutation process, we can get a new set of solutions.
Step 6: Termination Criteria
The aforementioned actions are kept going till the ideal solution or ideal weight value is discovered. The algorithm will be stopped when the best fitness has been attained. The CNN classifier receives the chosen weight value. The pseudo-code of the ATSO algorithm is presented in Table 1.
Table 1.
Pseudocode of proposed ATSO algorithm-based weight optimization

Prediction Using Optimized CNN Classifier
This section aims to effectively detect the image as benign or malignant using an optimized CNN classifier. Here, the classifier is trained with handcrafted features and automatic features. The handcrafted features are used to impose the domain knowledge that increases the performance of CNN architecture. Here, the GLCM features are extracted manually. In total, twenty-two features are used for handcrafted features. The optimized CNN classifier-based prediction structure is given in Fig. 4.
Fig. 4.
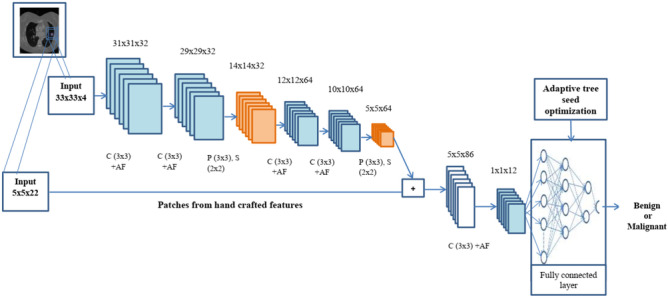
Optimized CNN classifier-based lung nodule prediction
Here, 33 × 33 patches from the input image are used in this architecture along with 5 × 5 patches from the handcrafted features. In these patches, different numbers of convolution layers and pooling layers are used. Finally, the patches (5 × 5) from the manually created features are mixed with the retrieved feature maps from the CNN. To obtain the final classification output, the combined feature maps are fed through two convolutional layers and one fully connected layer. The ReLU function activates the convolutional layer, which has a 3 × 3 kernel size, for feature extraction. The max-pooling layer, which has a kernel size of 3 × 3, is utilized to decrease an input image’s dimensions. The parameter details of each layer are given in Table 2.
Table 2.
Parameter details of ICNN
| Layer number | Layer type | Input | Kernel size | Activation function | Output |
|---|---|---|---|---|---|
| 1 | Convolution | 33 × 33 × 4 | 3 × 3 | - | 31 × 31 × 32 |
| 2 | Activation | 31 × 31 × 32 | - | ReLU | 31 × 31 × 32 |
| 3 | Convolution | 31 × 31 × 32 | 3 × 3 | 29 × 29 × 32 | |
| 4 | Activation | 29 × 29 × 32 | - | ReLU | 29 × 29 × 32 |
| 5 | Max-pooling | 29 × 29 × 32 | 3 × 3 | 14 × 14 × 32 | |
| 6 | Convolution | 14 × 14 × 32 | 3 × 3 | 12 × 12 × 64 | |
| 7 | Activation | 12 × 12 × 64 | - | ReLU | 12 × 12 × 128 |
| 8 | Convolution | 12 × 12 × 128 | 3 × 3 | 10 × 10 × 64 | |
| 9 | Activation | 10 × 10 × 64 | - | ReLU | 10 × 10 × 64 |
| 10 | Max-pooling | 10 × 10 × 64 | 2 × 2 | 5 × 5 × 64 | |
| 11 | convolution | 5 × 5(64 + 22) | 3 × 3 | 3 × 3 × 512 | |
| 12 | activation | 3 × 3 × 512 | - | ReLU | 3 × 3 × 512 |
| 13 | Convolution | 3 × 3 × 512 | 3 × 3 | 1 × 1 × 12 | |
| 14 | Activation | 1 × 1 × 12 | - | ReLU | 1 × 1 × 12 |
| 15 | Fully connected | 1 × 1 × 12 | - | Softma × | - |
| 16 | Output | - | - | - | 2 |
Severity Analysis
Depending on the location of the malignant nodule, the cancer’s phase is determined. It will demonstrate the extent of the illness and aid in determining whether it has migrated to other parts of our bodies. The ability to determine cancer’s stage is crucial since it enables the clinician to categorize it as confined or extensive. The stage is identified based on the threshold value [35]. The threshold value is presented in Table 3.
Table 3.
Stage prediction threshold value range
| Staging | Sub-staging | Nodule size |
|---|---|---|
| S1 | S1(a) | Between 3 and 10 mm |
| S1(b) | Between 10 and 20 mm | |
| S1(c) | Between 20 and 30 mm | |
| S2 | S2(a) | Between 30 and 40 mm |
| S2(a) | Between 40 and 50 mm | |
| S3 | No staging | Between 50 and 70 mm |
| S4 | No staging | Greater than 70 mm |
Results and Discussion
In this section, the performance of the proposed lung cancer classification is analyzed. The presented technique is implemented using MATLAB. Computer used as Intel Core i7 and 4 GB memory. In this paper, the ICNN classifier for classification and MRKM clustering algorithm for segmentation process are presented. We compare our proposed algorithm with different state-of-art techniques.
Dataset Description
For experimental analysis, we used Lung Image Database Consortium (LIDC) [1]. This dataset includes 2610 CT images of patients, which were gathered from eight international medical imaging businesses and seven academic research institutions. The dataset contains lung nodule images and ground truth images. The size of the input image is 512 × 512. The dataset contains a total of 2610 images. During the classification, 80% of images are utilized for the training process and 20% of images are utilized for the testing process. The experimental used sample images are listed in Fig. 5.
Fig. 5.

Experimental used sample images
Performance Analysis Based on Segmentation Stage
The efficiency of the segmentation stage is evaluated based on two metrics as Jaccard index (JI) and the dice similarity coefficient (DSC). These metrics are calculated based on segmented output and ground truth images. The DSC is calculated using Eq. (24).
| 24 |
where:
Binary mask generated by the proposed approach
Binary mask of ground truth
The Jaccard index is calculated using Eq. (25):
| 25 |
The graphical representation of the segmentation output is given in Figs. 6 and 7 and Table 4.
Fig. 6.

Experimental results of segmentation stage. a Input image, b ground truth image, c output image, and d final output
Fig. 7.

Segmentation output for three varied positions. a Input image, b ground truth, c output image, and d final output image
Table 4.
Visual representation of different segmentation algorithms

In Table 5, the efficiency of the segmentation stage is discussed based on DSC and JI. Here, we compare MRKM clustering-based segmentation with different state-of-the-art methods, namely graph cut [18], level set [19], CNN [20], and U-Net [23]. And also, we compare our work with two traditional segmentation algorithms, namely k-means clustering and fuzzy c-means clustering (FCM). The above methods are mainly focused on nodule segmentation based on the DSC measures. So, we compare our performance with these works. According to Table 5, our suggested technique obtained the maximum DSC of 94.5% and JI of 87.5 ± 12% which is an expressively greater value than the other state-of-the-art methods. Compared to the traditional k-means clustering algorithm, our enhanced version attained better results, because the traditional k-means clustering algorithm falls on the local centroid value. This presented method can segment all challenging nodule cases which are given in Fig. 7.
Table 5.
Comparison of the proposed method with other state-of-the-art methods
Performance Analysis Based on Classification Stage
In this section, the classification stage performance is analyzed. For classification, in this paper, the ICNN classifier is used. Here, the proposed CNN classifier is enhanced by using the ATSO algorithm. To prove the efficiency of the recommended technique, we compare our work with different classifiers and state-of-the-art works. The confusion matrix of the suggested technique is analyzed in Fig. 8.
Fig. 8.
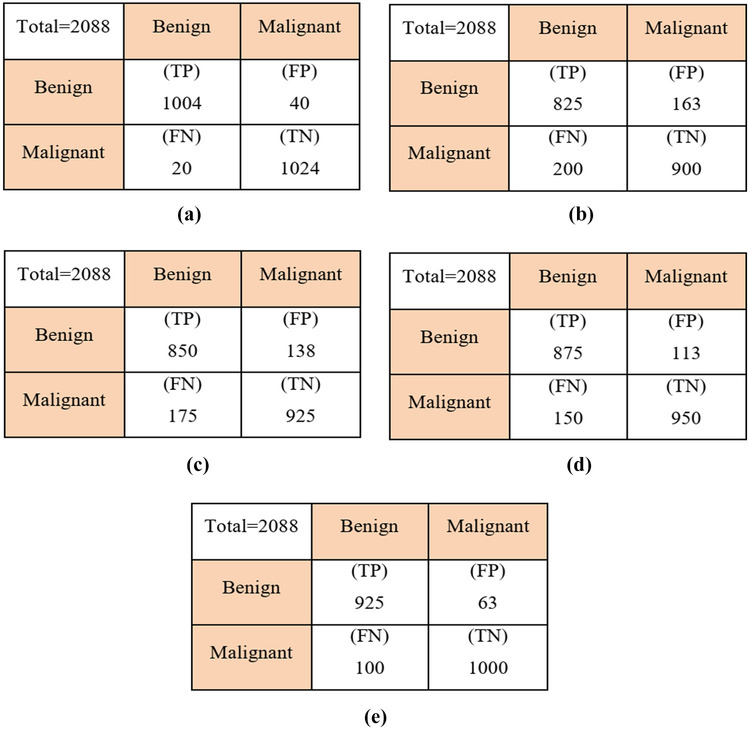
Confusion matrix. a ICNN, b KNN, c ANN, d SVM, and e CNN
In Table 6, the efficiency of the suggested technique is analyzed based on different metrics. Here, we compare our proposed ICNN classifier performance with different classifiers, namely K-nearest neighbor (KNN), artificial neural network (ANN), support vector machine (SVM), and CNN-based classification. The proposed method achieved a higher accuracy of 96.5% while analyzing Table 7, which is 4.5% better than CNN-based classification, 8.5% better than SVM-based classification, 13.7% better than ANN-based classification, and 16.3% better than KNN-based classification. Due to ATSO algorithm-based parameter optimization on CNN, this method gives better results compared to other algorithms. Similarly, our technique obtained a maximum sensitivity of 98.0%, specificity of 96.41%, and 97.07% of PPV which is a significantly higher value than other algorithms.
Table 6.
Comparative analysis based on different metrics
| Method | Accuracy (%) | Sensitivity (%) | Specificity (%) | PPV (%) |
|---|---|---|---|---|
| KNN | 82.61 | 80.48 | 84.66 | 83.50 |
| ANN | 85.25 | 82.29 | 87.01 | 86.0 |
| SVM | 87.45 | 85.36 | 90.4 | 88.5 |
| CNN | 92.1 | 91.32 | 94.05 | 93.6 |
| ICNN | 96.5 | 98.0 | 96.41 | 97.07 |
Table 7.
Comparison of the proposed method with other state-of-the-art methods
Figures 9 and 10 display the loss and accuracy of the training and validation data for 80 epochs. Following the testing system on test information, we acquired a loss of 0.05% and an accuracy of 96.5%. Figure 11 shows the convergence graph for the ICNN technique by changing the number of epochs (1 to 80). The fitness graph linearly increases from 0.3 to 0.965 for iterations 1 to 80.
Fig. 9.

Loss vs epochs
Fig. 10.

Accuracy vs epochs
Fig. 11.

Epochs vs fitness
Table 7 shows the comparative results of proposed and state-of-the-art methods based on the accuracy measures. The effectiveness of the proposed technique is demonstrated by performing a comparison between different approaches. Here, we compare our proposed approach with different works such as Madero et al. [24], Vijh et al. [36], Kuruvilla and Gunavathi [37], Yan et al. [38], and Veronica [39]. Madero et al. [24] developed an SVM classifier based on lung nodule classification. Here, for feature extraction, a wavelet feature descriptor was used. Vijh et al. [36] developed a lung tumor diagnosis system using a whale optimization algorithm and support vector machine. Here, they extract the statistical and texture feature for classification. To reduce the complexity, important features were selected using whale optimization, and finally, the classification was carried out using an SVM classifier. Kuruvilla and Gunavathi [20] developed a neural network-based nodule classification. For classification, they used the following features such as mean, standard deviation, skewness, kurtosis, fifth central moment, and sixth central moment. Moreover, Yan et al. [38] developed CNN-based nodule classification. Here, the features are generated automatically. Veronica [39] developed lung nodule classification using an effective neural network with the optimal fuzzy model. The above-mentioned methods are well in lung nodule classification. Therefore, we choose these works for the comparative analysis part.
When analyzing Table 7, our presented technique obtained a higher accuracy of 96.5% which is 86.6% for Veronica [39], 87.3% for Yan et al. [38], 92.5% for Kuruvilla and Gunavathi [37], 94% for Vijh et al. [36], and 90.9% for Madero et al. [24]. It is evident from the results that the proposed strategy outperformed state-of-the-art methodologies. This is due to the ATSO algorithm-based parameter optimization and efficient segmentation approach. The proposed ICNN method eliminates the problem in the critical images and increases the accuracy classification stage. Lung issues patients can be easily identified using this method. Early detection reduces mortality. Therefore, this method is recommended for medicine. The obtained accurate results help the patient with further treatment.
Conclusion
In this study, we presented a novel deep-learning model and analyzed its ability to automatically detect nodules in lung CT images. This method concentrates on nodule segmentation and classification. For segmentation, MRKM clustering has been introduced which effectively segments the nodules on lung images as compared with the previous technique presented on lung nodule segmentation. Also, for nodule classification, an improved CNN classifier has been presented. To improve the classification accuracy, the parameter present in the CNN classifier is optimally selected using the ATSO algorithm. Finally, the severity of the patient was evaluated. The efficiency of the suggested technique is analyzed based on different metrics. The results show proposed approach attained the maximum classification accuracy of 96.5% and dice similarity coefficient of 94.5% which is significantly high compared to the state-of-the-art method. The proposed model attained preferred outcomes on the presently available dataset, which can be further enhanced by different sets of diseases and hybridization approaches. The presented model can help doctors to diagnose and treat lung cancer patients easily.
Data Availability
Based upon the request, the data will be share.
Declarations
Conflict of Interest
The authors declare no competing interests.
Footnotes
Publisher's Note
Springer Nature remains neutral with regard to jurisdictional claims in published maps and institutional affiliations.
Contributor Information
Dhasny Lydia M, Email: dhasnylydia@gmail.com.
Dr. Prakash M, Email: prakashm2@srmist.edu.in.
References
- 1.Kumar, S. and Raman, S., 2020. Lung nodule segmentation using 3-dimensional convolutional neural networks. In Soft Computing for Problem Solving (pp. 585–596). Springer, Singapore.
- 2.Tyagi S, Talbar SN. CSE-GAN: A 3D conditional generative adversarial network with concurrent squeeze-and-excitation blocks for lung nodule segmentation. Computers in Biology and Medicine. 2022;147:105781. doi: 10.1016/j.compbiomed.2022.105781. [DOI] [PubMed] [Google Scholar]
- 3.Chen, Q., Xie, W., Zhou, P., Zheng, C. and Wu, D., 2021. Multi-Crop Convolutional Neural Networks for Fast Lung Nodule Segmentation. IEEE Transactions on Emerging Topics in Computational Intelligence.
- 4.Wang C, Elazab A, Wu J, Hu Q. Lung nodule classification using deep feature fusion in chest radiography. Computerized Medical Imaging and Graphics. 2017;57:10–18. doi: 10.1016/j.compmedimag.2016.11.004. [DOI] [PubMed] [Google Scholar]
- 5.Halder A, Chatterjee S, Dey D, Kole S, Munshi S. An adaptive morphology based segmentation technique for lung nodule detection in thoracic CT image. Computer Methods and Programs in Biomedicine. 2020;197:105720. doi: 10.1016/j.cmpb.2020.105720. [DOI] [PubMed] [Google Scholar]
- 6.Singadkar G, Mahajan A, Thakur M, Talbar S. Deep deconvolutional residual network based automatic lung nodule segmentation. Journal of digital imaging. 2020;33(3):678–684. doi: 10.1007/s10278-019-00301-4. [DOI] [PMC free article] [PubMed] [Google Scholar]
- 7.Cao H, Liu H, Song E, Ma G, Xu X, Jin R, Liu T, Hung CC. A two-stage convolutional neural networks for lung nodule detection. IEEE journal of biomedical and health informatics. 2020;24(7):2006–2015. doi: 10.1109/JBHI.2019.2963720. [DOI] [PubMed] [Google Scholar]
- 8.Suresh, S. and Mohan, S., 2019. NROI based feature learning for automated tumor stage classification of pulmonary lung nodules using deep convolutional neural networks. Journal of King Saud University-Computer and Information Sciences.
- 9.de Carvalho Filho AO, Silva AC, de Paiva AC, Nunes RA, Gattass M. Lung-nodule classification based on computed tomography using taxonomic diversity indexes and an SVM. Journal of Signal Processing Systems. 2017;87(2):179–196. doi: 10.1007/s11265-016-1134-5. [DOI] [Google Scholar]
- 10.Zhao D, Zhu D, Lu J, Luo Y, Zhang G. Synthetic medical images using F&BGAN for improved lung nodules classification by multi-scale VGG16. Symmetry. 2018;10(10):519. doi: 10.3390/sym10100519. [DOI] [Google Scholar]
- 11.Zhang X, Li S, Zhang B, Dong J, Zhao S, Liu X. Automatic detection and segmentation of lung nodules in different locations from CT images based on adaptive α-hull algorithm and DenseNet convolutional network. International Journal of Imaging Systems and Technology. 2021;31(4):1882–1893. doi: 10.1002/ima.22580. [DOI] [Google Scholar]
- 12.Al-Shabi M, Lee HK, Tan M. Gated-dilated networks for lung nodule classification in CT scans. IEEE Access. 2019;7:178827–178838. doi: 10.1109/ACCESS.2019.2958663. [DOI] [Google Scholar]
- 13.Pezzano G, Ripoll VR, Radeva P. CoLe-CNN: Context-learning convolutional neural network with adaptive loss function for lung nodule segmentation. Computer Methods and Programs in Biomedicine. 2021;198:105792. doi: 10.1016/j.cmpb.2020.105792. [DOI] [PubMed] [Google Scholar]
- 14.Yuan J, Liu X, Hou F, Qin H, Hao A. Hybrid-feature-guided lung nodule type classification on CT images. Computers & Graphics. 2018;70:288–299. doi: 10.1016/j.cag.2017.07.020. [DOI] [Google Scholar]
- 15.Liu Y, Hao P, Zhang P, Xu X, Wu J, Chen W. Dense convolutional binary-tree networks for lung nodule classification. IEEE Access. 2018;6:49080–49088. doi: 10.1109/ACCESS.2018.2865544. [DOI] [Google Scholar]
- 16.Harsono, I.W., Liawatimena, S. and Cenggoro, T.W., 2020. Lung nodule detection and classification from Thorax CT-scan using RetinaNet with transfer learning. Journal of King Saud University-Computer and Information Sciences.
- 17.Sathiya T, Sathiyabhama B. Fuzzy relevance vector machine based classification of lung nodules in computed tomography images. International Journal of Imaging Systems and Technology. 2019;29(3):360–373. doi: 10.1002/ima.22339. [DOI] [Google Scholar]
- 18.Boykov Y, Kolmogorov V. An experimental comparison of mincut/max- flow algorithms for energy minimization in vision. IEEE Trans Pattern Anal Mach Intell. 2004;26(9):1124–1137. doi: 10.1109/TPAMI.2004.60. [DOI] [PubMed] [Google Scholar]
- 19.Chan TF, Vese LA. Active contours without edges. IEEE Trans Image Process. 2001;10(2):266–277. doi: 10.1109/83.902291. [DOI] [PubMed] [Google Scholar]
- 20.Wang S, Zhou M, Liu Z, Liu. Z, Gu D, Zang Y, Dong D, Gevaert O, Tian J: Central focused convolutional neural networks: developing a data-driven model for lung nodule segmentation. Med Image Anal 40:172–183, 2017 [DOI] [PMC free article] [PubMed]
- 21.Simranjit Singh and Singara Singh Kasana, Quantitative Estimation of Soil Properties using Hybrid Features and RNN Variants, Chemosphere, Vol. 287, pp. 1–10, Impact Factor : 8.943, 2022 [DOI] [PubMed]
- 22.Simranjit Singh and Singara Singh Kasana, “Estimation of Soil Properties from the EU Spectral Library using Long Short Term Memory Networks”, Geoderma Regional, Vol.18, pp. 1–12(e00233), 2019.
- 23.Ronneberger O, Fischer P, Brox T. U-net: convolutional networks for biomedical image segmentation. In: Navab N, Hornegger J, Wells WM, Frangi AF, editors. Medical image computing and computer-assisted intervention – MICCAI 2015. Cham: Springer International Publishing; 2015. pp. 234–241. [Google Scholar]
- 24.Madero Orozco H, Vergara Villegas OO, Cruz Sánchez VG, Ochoa Domínguez HDJ, Nandayapa Alfaro MDJ. Automated system for lung nodules classification based on wavelet feature descriptor and support vector machine. Biomedical engineering online. 2015;14(1):1–20. doi: 10.1186/s12938-015-0003-y. [DOI] [PMC free article] [PubMed] [Google Scholar]
- 25.Pfeffer MA, Ling SH. Evolving Optimised Convolutional Neural Networks for Lung Cancer Classification. Signals. 2022;3(2):284–295. doi: 10.3390/signals3020018. [DOI] [Google Scholar]
- 26.Ganesan R, Merline A. Fuzzy-C-means clustering based segmentation and CNN-classification for accurate segmentation of lung nodules. Asian Pacific Journal of Cancer Prevention: APJCP. 2017;18(7):1869. doi: 10.22034/APJCP.2017.18.7.1869. [DOI] [PMC free article] [PubMed] [Google Scholar]
- 27.Halder A, Chatterjee S, Dey D. Adaptive morphology aided 2-pathway convolutional neural network for lung nodule classification. Biomedical Signal Processing and Control. 2022;72:103347. doi: 10.1016/j.bspc.2021.103347. [DOI] [Google Scholar]
- 28.Khan A. Identification of Lung Cancer Using Convolutional Neural Networks Based Classification. Turkish Journal of Computer and Mathematics Education (TURCOMAT) 2021;12(10):192–203. [Google Scholar]
- 29.Meraj T, Rauf HT, Zahoor S, Hassan A, Lali MI, Ali L, Bukhari SAC, Shoaib U. Lung nodules detection using semantic segmentation and classification with optimal features. Neural Computing and Applications. 2021;33(17):10737–10750. doi: 10.1007/s00521-020-04870-2. [DOI] [Google Scholar]
- 30.Deen K, J. Fuzzy-C-means clustering based segmentation and CNN-classification for accurate segmentation of lung nodules. Asian Pacific Journal of Cancer Prevention. 2017;18(7):1869–1874. doi: 10.22034/APJCP.2017.18.7.1869. [DOI] [PMC free article] [PubMed] [Google Scholar]
- 31.Dutande P, Baid U, Talbar S. LNCDS: A 2D–3D cascaded CNN approach for lung nodule classification, detection and segmentation. Biomedical Signal Processing and Control. 2021;67:102527. doi: 10.1016/j.bspc.2021.102527. [DOI] [Google Scholar]
- 32.Sarker, P., Shuvo, M.M.H., Hossain, Z. and Hasan, S., 2017, September. Segmentation and classification of lung tumor from 3D CT image using K-means clustering algorithm. In 2017 4th International Conference on Advances in Electrical Engineering (ICAEE) (pp. 731–736). IEEE.
- 33.Keetha, N.V. and Annavarapu, C.S.R., 2020. U-Det: A modified U-Net architecture with bidirectional feature network for lung nodule segmentation. arXiv preprint arXiv:2003.09293.
- 34.Nasrullah N, Sang J, Alam MS, Mateen M, Cai B, Hu H. Automated lung nodule detection and classification using deep learning combined with multiple strategies. Sensors. 2019;19(17):3722. doi: 10.3390/s19173722. [DOI] [PMC free article] [PubMed] [Google Scholar]
- 35.Prakash, V., & Smitha, V. P. (2020). Stage Identification and Classification of Lung Cancer using Deep Convolutional Neural Network. International Journal of Advanced Computer Science and Applications, 11(7).
- 36.Vijh S, Gaur D, Kumar S. An intelligent lung tumor diagnosis system using whale optimization algorithm and support vector machine. International Journal of System Assurance Engineering and Management. 2020;11(2):374–384. [Google Scholar]
- 37.Kuruvilla J, Gunavathi K. Lung cancer classification using neural networks for CT images. Computer methods and programs in biomedicine. 2014;113(1):202–209. doi: 10.1016/j.cmpb.2013.10.011. [DOI] [PubMed] [Google Scholar]
- 38.Yan, X., Pang, J., Qi, H., Zhu, Y., Bai, C., Geng, X., ... & Ding, X. (2016, November). Classification of lung nodule malignancy risk on computed tomography images using convolutional neural network: A comparison between 2d and 3d strategies. In Asian Conference on Computer Vision (pp. 91–101). Springer, Cham.
- 39.Veronica BK. An effective neural network model for lung nodule detection in CT images with optimal fuzzy model. Multimedia Tools and Applications. 2020;79(19):14291–14311. doi: 10.1007/s11042-020-08618-x. [DOI] [Google Scholar]
Associated Data
This section collects any data citations, data availability statements, or supplementary materials included in this article.
Data Availability Statement
Based upon the request, the data will be share.