

This cohort study examines the prospective associations of different combinations of moderate aerobic physical activity, vigorous aerobic physical activity, and muscle-strengthening activity with all-cause, cardiovascular, and cancer mortality.
Key Points
Question
What is the optimal combination of moderate aerobic physical activity (MPA), vigorous aerobic physical activity (VPA), and muscle-strengthening activity (MSA) to reduce the risk of all-cause, cardiovascular, and cancer mortality?
Findings
In this cohort study of 500 705 participants, balanced amounts of MPA, VPA, and MSA combined were associated with a lower risk of mortality. These risk reductions may be greater with aerobic physical activity at higher vigorous and moderate intensities than current recommendations for all-cause and cancer mortality, respectively.
Meaning
Balanced levels of MPA, VPA, and MSA combined may be associated with optimal reductions of mortality risk.
Abstract
Importance
Studies examining the associations of different combinations of intensity-specific aerobic and muscle strengthening activity (MSA) with all-cause and cause-specific mortality are scarce; the few available estimates are disparate.
Objective
To examine the prospective associations of different combinations of moderate aerobic physical activity (MPA), vigorous aerobic physical activity (VPA), and MSA with all-cause, cardiovascular (CVD), and cancer mortality.
Design, Setting, and Participants
This nationwide prospective cohort study used data from the US National Health Interview Survey. A total of 500 705 eligible US adults were included in the study and followed up during a median of 10.0 years (5.6 million person-years) from 1997 to 2018. Data were analyzed from September 1 to September 30, 2022.
Exposures
Self-reported cumulative bouts (75 weekly minutes) of MPA and VPA with recommended MSA guidelines (yes or no) to obtain 48 mutually exclusive exposure categories.
Main Outcomes and Measures
All-cause, CVD, and cancer mortality. Participants were linked to the National Death Index through December 31, 2019.
Results
Overall, 500 705 participants (mean [SD] age, 46.4 [17.3] years; 210 803 [58%] female; 277 504 [77%] White) were included in the study. Compared with the reference group (doing no MPA or VPA and less than recommended MSA), the category associated with the lowest hazard ratio (HR) for all-cause mortality was more than 0 to 75 minutes of MPA combined with more than 150 minutes of VPA and 2 or more MSA sessions per week (HR, 0.50; 95% CI, 0.42-0.59). The optimal combinations for CVD and cancer mortality risk reduction were more than 150 to 225 minutes of MPA, more than 0 to 75 minutes of VPA, and 2 or more MSA sessions per week (HR, 0.30; 95% CI, 0.15-0.57), and more than 300 minutes of MPA, more than 0 to 75 minutes of VPA, and 2 or more MSA sessions per week (HR, 0.44; 95% CI, 0.23-0.82), respectively. Adjusted mortality rates represented an approximately 50% lower mortality rate for all-cause and cancer mortality and an approximately 3-fold lower mortality rate for CVD mortality.
Conclusions and Relevance
This cohort study demonstrated that balanced levels of MPA, VPA, and MSA combined may be associated with optimal reductions of mortality risk. Higher-than-recommended levels of MPA and VPA may further lower the risk of cancer and all-cause mortality, respectively.
Introduction
Compelling evidence supports the beneficial effects of moderate to vigorous aerobic physical activity (MVPA) to reduce all-cause, cardiovascular disease (CVD), and cancer mortality in adults.1,2 These benefits can be enhanced when adding muscle-strengthening activity (MSA) on a weekly basis.3,4 In this regard, the 2018 Physical Activity Guidelines for Americans5 and the 2020 World Health Organization guidelines on physical activity6 recommend at least 150 to 300 weekly minutes of moderate aerobic physical activity (MPA), 75 to 150 weekly minutes of vigorous aerobic physical activity (VPA), or an equivalent combination of physical activity of both intensities together with MSA on 2 days or more each week for adults.
Nevertheless, the optimal combination of weekly MPA, VPA, and MSA to reduce all-cause, CVD, and cancer mortality remains unknown. Prior research conducted in US adults7 observed that, for the same amount of MVPA, a higher proportion of VPA was associated with a lower risk of all-cause mortality but not with CVD or cancer mortality.7 A study by Coleman et al8 suggested that the associations of MPA and VPA with all-cause mortality was dose dependent such that an increment of 1 h/wk and up to 3 h/wk of either intensity was associated with a lower risk of all-cause mortality. The same study reported additional all-cause mortality risk reductions with 1 to 2 times/wk of MSA. These previous studies seem to point out the existence of unique associations among different combinations of MPA, VPA, and MSA with all-cause mortality. However, the associations of MPA, VPA, and MSA with CVD or cancer mortality have been much less explored. To our knowledge, the only existing study on the topic9 found both independent and joint associations of MVPA and MSA with a lower risk for all-cause and CVD mortality but failed to find statistically significant associations with cancer mortality.
Thus, detailed investigation accounting for shorter bouts of weekly minutes of MPA and VPA combined with MSA is currently lacking. Capitalizing on a large representative sample of US adults, the current study aimed to examine the detailed associations of different combinations of MPA, VPA, and MSA with all-cause and CVD- and cancer-specific mortality.
Methods
Study Design and Population
This prospective cohort study pooled publicly deidentified data from 22 consecutive rounds of the US National Health Interview Survey (NHIS; 1997-2018). The NHIS is a nationally representative survey of the noninstitutionalized population in the US and is conducted annually by the Centers for Disease Control and the Prevention’s National Center for Health Statistics, which also provides the ethical approval for the surveys and the procedures for informed consent.10,11 More details on the methodology, ethics approval, and informed consent of the NHIS are publicly available.10 Briefly, trained interviewers conducted personal interviews in the households selected from random clusters through a stratified, complex, multistage sampling procedure.
From an eligible sample of 646 201 participants, we excluded those with current chronic conditions such as cancer (n = 41 486), heart disease (n = 30 183), emphysema (n = 5008), or stroke (n = 8114) at baseline. Those with either missing data on or who were unable to do aerobic activity (n = 27 127) or MSA (n = 1464) were also removed from the analyses. Additionally, we removed individuals with missing data on covariates including chronic conditions (n = 829), functional limitations (n = 481), marital status (n = 1049), education (n = 2554), alcohol consumption (n = 4870), smoking status (n = 468), and body mass index (BMI; n = 14 094). To circumvent reverse causation bias, we excluded mortality outcomes during the first 2 years of follow-up (n = 7769). Thus, the present study retrieved data from a final cohort of 500 705 adults 18 years and older. We also followed the Strengthening the Reporting of Observational Studies in Epidemiology (STROBE) reporting guidelines.12
All-Cause and Cause-Specific Mortality
Participants were linked to the National Death Index records through December 31, 2019. The causes of death were defined based on the International Statistical Classification of Diseases and Related Health Problems, Tenth Revision. To determine the vital status of the participants, we conducted a probabilistic record-matching method with the National Death Index records.13 We grouped the specific mortality outcomes using the following codes: all-cause mortality (all available codes), CVD mortality (codes I00-I09, I11, I13, I20-I51, and I60-I69), and cancer mortality (codes C00-C97).14
Leisure-Time Aerobic Physical Activity and MSA
Information on leisure-time physical activity was measured through the following questions tested in the Questionnaire Design Research Laboratory of the Centers for Disease Control and Prevention’s National Center for Health Statistics and subsequently checked in a field pretest15: (1) frequency of light-intensity physical activity or MPA: “How often do you do light or moderate leisure-time physical activities for at least 10 minutes that cause only light sweating or a slight to moderate increase in breathing or heart rate?” (20 minutes for participants of the 1997 NHIS); (2) duration of MPA: “About how long do you do these light or moderate leisure-time physical activities each time?”; (3) frequency of VPA: “How often do you do vigorous leisure-time physical activities for at least 10 minutes that cause heavy sweating or large increases in breathing or heart rate?” (20 minutes for participants of the 1997 NHIS); and (4) duration of VPA: “About how long do you do these vigorous leisure-time physical activities each time?” Similar single-item questions assessing physical activity have shown strong validity and reproducibility.16 We estimated the total amount of MPA and VPA (weekly minutes) by multiplying frequency and duration.
Muscle-strengthening activity was ascertained by training frequency (times/wk) through the following question: “How often do you do physical activities specifically designed to strengthen your muscles, such as lifting weights or doing calisthenics?” According to current guidelines, MSA was categorized into 2 groups: (1) recommended (≥2 times/wk) and (2) lower than recommended (<2 times/wk).5,6 We then calculated an exposure with 48 mutually exclusive categories that included all possible combinations between 6 MPA categories (ie, 0 min/wk, >0-75 min/wk, >75-150 min/wk, >150-225 min/wk, >225-300 min/wk, and >300 min/wk), 4 VPA categories (ie, 0 min/wk, >0-75 min/wk, >75-150 min/wk, >150 min/wk), and 2 MSA categories (no or yes meeting recommendation).
Covariates
We adjusted the models with the following set of potential self-reported covariates: age (years), sex (male or female), race (categorized as Black, White, or other, which was grouped together owing to small sample sizes and included American Indian or Alaska Native, Asian, Native Hawaiian or Other Pacific Islander, more than 1 race, or unknown race), marital status (married/living with partner, divorced/separated/widowed, or never married), educational attainment (lower than high school degree, high school degree, or more than high school degree), smoking status (never, former, or current smoker), alcohol consumption (abstainer, former, or current drinker), chronic condition (hypertension, diabetes, both, or none), body mass index (calculated as weight in kilograms divided by height in meters squared), functional limitation (no or yes), survey year (year when the survey was conducted), and weekly minutes of MVPA (sum of weekly minutes of MPA and VPA).
Statistical and Sensitivity Analyses
Statistical analysis was conducted from September 1, 2022, to September 30, 2022. We used proportional Cox regression to model the association between the exposure categories and mortality from the interview date to either the date of death or censoring (December 31, 2019), whichever came first. Time on study in quarter-years was used as the time scale. The analyses accounted for the complex multistage sampling design of NHIS using weights, primary sampling units, and strata to obtain hazard ratios (HRs) and 95% CIs, as well as adjusted mortality rates. We examined the proportional hazards assumption using log-log survival plots for each specific category of the exposure and observed no violation of such assumption. We conducted a Wald test using the nestreg command in Stata (StataCorp) and found no evidence of an age or sex interaction with the exposure categories; thus, results are presented for all participants (ie, age and sex combined).
To obtain adjusted mortality rates we based the estimations on the Mokdad procedure,17 which calculates attributable deaths indirectly through population attributable fractions (PAFs). We obtained PAFs using the Stata punafcc user command18 after conducting adjusted Cox proportional hazard regression models, which provided the proportion of the deaths attributable to living in scenario 0 (ie, real levels of MPA, VPA, and MSA of the study population) compared with living in scenario 1 (ie, each of the categories in the exposure). We then calculated 1-PAF to estimate the proportion of deaths in each exposure category and multiplied these by the total annual weighted mortality rates (ie, per 1000 adults/y) of the study population to obtain the adjusted mortality rates associated with each exposure category. Additionally, we estimated between-group adjusted differences of mortality rates using fully adjusted Poisson regression and predicted mortality rates for each exposure category.
We conducted the following sensitivity analyses: (1) for all-cause mortality we removed participants who died due to accidents, (2) for cause-specific mortality we used weighted Fine-Gray models to account for competing risks (ie, mortality due to causes other than CVD or cancer), and (3) to further reduce the possibility of reverse causation bias we excluded the first 5 years of observation time.19 We conducted all analyses using Stata, version 16.1 (StataCorp). A 2-sided P < .05 was considered statistically significant.
Results
Study Population
The final study cohort comprised 500 705 adults (mean [SD] age, 46.4 [17.3] years; 210 803 [58%] female; 277 504 [77%] White) and a median follow-up of 10.0 years (5 575 096 person-years). Of these, a total of 56 148 participants died due to all causes, of which 17 213 died of CVD and 12 839 died of cancer.
Table 1 summarizes the baseline sample characteristics stratified by current physical activity guidelines for US adults. A total of 35% of the participants in the study did no MVPA combined with lower than 2 weekly MSA sessions (Table 2).
Table 1. Baseline Characteristics of US Adults (N = 500 705) Engaging in Physical Activities Stratified By Specific Aerobic and Muscle-Strengthening Physical Activity Guidelines as Recorded by National Health Interview Surveys, 1997-2018.
| Characteristic | Types of physical activity, No. (%) | |||
|---|---|---|---|---|
| MPA <150 min/wk or VPA <75 min/wk and MSA<2 sessions/wk (n = 361 962) | MPA ≥150 min/wk or VPA ≥75 min/wk and MSA<2 sessions/wk (n = 27 504) | MPA <150 min/wk or VPA <75 min/wk and MSA ≥2 sessions/wk (n = 78 134) | MPA ≥150 min/wk or VPA ≥75 min/wk and MSA ≥2 sessions/wk (n = 33 105) | |
| Age, mean (SD), y | 46.4 (17.3) | 42.7 (15.6) | 41.6 (16.1) | 39.3 (15.0) |
| Sex | ||||
| Female | 210 803 (58.2) | 12 949 (47.1) | 36 843 (47.2) | 14 060 (42.5) |
| Male | 151 159 (41.8) | 14 555 (52.9) | 41 291 (52.9) | 19 045 (57.5) |
| Race | ||||
| Black | 56 824 (15.7) | 2906 (10.6) | 11 030 (14.1) | 3848 (11.6) |
| White | 277 504 (76.7) | 22 813 (82.9) | 61 258 (78.4) | 27 138 (82.0) |
| Othera | 27 634 (7.6) | 1785 (6.5) | 5846 (7.5) | 2119 (6.4) |
| Education | ||||
| <High school | 72 391 (20.0) | 2940 (10.7) | 6236 (8.0) | 1896 (5.7) |
| High school | 45 490 (12.6) | 2924 (10.6) | 6085 (7.8) | 2172 (6.6) |
| >High school | 244 081 (67.4) | 21 640 (78.7) | 65 813 (84.2) | 29 037 (87.7) |
| Marital status | ||||
| Married or living with a partner | 193 353 (53.4) | 15 376 (55.9) | 38 500 (49.3) | 16 209 (49.0) |
| Widowed, divorced, or separated | 89 761 (24.8) | 5140 (18.7) | 15 491 (19.8) | 5562 (16.8) |
| Never married | 78 848 (21.8) | 6988 (25.4) | 24 143 (30.9) | 11 334 (34.2) |
| Alcohol consumption | ||||
| Never drinker | 92 011 (25.4) | 4018 (14.6) | 10 592 (13.6) | 3776 (11.4) |
| Former drinker | 53 663 (14.3) | 3017 (11.0) | 7875 (10.1) | 2680 (8.1) |
| Current drinker | 216 288 (59.8) | 20 469 (74.4) | 59 667 (76.4) | 26 649 (80.5) |
| Smoking status | ||||
| Never smoker | 211 922 (58.6) | 15 138 (55.0) | 49 493 (63.3) | 21 131 (63.8) |
| Former smoker | 71 462 (19.7) | 6036 (22.0) | 16 475 (21.1) | 6935 (21.0) |
| Current smoker | 78 578 (21.7) | 6330 (23.0) | 12 166 (15.6) | 5039 (15.2) |
| Chronic condition | ||||
| None | 251 026 (69.4) | 21 258 (77.3) | 61 513 (78.3) | 27 533 (83.2) |
| Hypertension | 77 948 (21.5) | 4653 (16.9) | 12 677 (16.2) | 4421 (13.4) |
| Diabetes | 11 516 (3.2) | 702 (2.6) | 1644 (2.1) | 548 (1.7) |
| Hypertension and diabetes | 21 472 (5.9) | 891 (3.2) | 2300 (2.9) | 603 (1.8) |
| BMI, mean (SD) | 27.6 (6.2) | 26.8 (5.4) | 26.4 (5.2) | 26.0 (4.8) |
| Functional limitation | ||||
| No | 242 844 (67.1) | 21 270 (77.3) | 59 661 (76.4) | 27 549 (83.2) |
| Yes | 119 118 (32.9) | 6234 (22.7) | 18 473 (23.6) | 5556 (16.8) |
| Survey year | ||||
| 1997 | 23 758 (6.7) | 1483 (5.4) | 4503 (5.8) | 1574 (4.8) |
| 1998 | 21 122 (5.8) | 1285 (4.7) | 3691 (4.7) | 1215 (3.7) |
| 1999 | 19 945 (5.5) | 1242 (4.5) | 3351 (4.3) | 1303 (3.9) |
| 2000 | 20 212 (5.6) | 1506 (5.5) | 3475 (4.5) | 1383 (4.2) |
| 2001 | 20 212 (5.6) | 1510 (5.5) | 3928 (5.0) | 1588 (4.8) |
| 2002 | 18 422 (5.1) | 1308 (4.8) | 3752 (4.8) | 1351 (4.1) |
| 2003 | 15 320 (4.2) | 1210 (4.4) | 3190 (4.1) | 1337 (4.0) |
| 2004 | 16 203 (4.5) | 992 (3.6) | 3136 (4.0) | 1214 (3.7) |
| 2005 | 15 941 (4.4) | 970 (3.5) | 3140 (4.0) | 1194 (3.6) |
| 2006 | 12 996 (3.6) | 769 (2.8) | 2517 (3.2) | 933 (2.8) |
| 2007 | 12 442 (3.4) | 722 (2.6) | 2444 (3.1) | 898 (2.7) |
| 2008 | 11 225 (3.1) | 738 (2.7) | 2487 (3.2) | 975 (3.0) |
| 2009 | 14 534 (4.0) | 1064 (3.9) | 3183 (4.1) | 1366 (4.1) |
| 2010 | 14 084 (3.9) | 979 (3.6) | 3447 (4.4) | 1391 (4.2) |
| 2011 | 16 746 (4.6) | 1387 (5.0) | 4095 (5.2) | 1821 (5.5) |
| 2012 | 17 564 (4.9) | 1578 (5.7) | 4074 (5.2) | 1896 (5.7) |
| 2013 | 17 417 (4.8) | 1600 (5.8) | 4182 (5.4) | 2008 (6.1) |
| 2014 | 18 182 (5.0) | 1656 (6.0) | 4357 (5.6) | 2194 (6.6) |
| 2015 | 16 821 (4.7) | 1416 (5.2) | 4205 (5.4) | 1922 (5.8) |
| 2016 | 15 168 (4.2) | 1624 (5.9) | 4156 (5.3) | 2115 (6.4) |
| 2017 | 12 052 (3.3) | 1223 (4.5) | 3527 (4.5) | 1752 (5.3) |
| 2018 | 11 347 (3.1) | 1242 (4.5) | 3294 (4.2) | 1675 (5.1) |
| Aerobic physical activity, mean (SD), min/wk | 115.8 (270.6) | 837.0 (898.5) | 257.8 (289.1) | 779.7 (707.1) |
Abbreviations: BMI, body mass index (calculated as weight in kilograms divided by height in meters squared); MPA, moderate aerobic physical activity; MSA, muscle-strengthening activity; VPA, vigorous aerobic physical activity.
Other category includes individuals self-reporting as American Indian or Alaska Native, Asian, Native Hawaiian or Other Pacific Islander, more than 1 race, or unknown race. This category was grouped together owing to small sample sizes.
Table 2. Percentage of Participants in Each of the Physical Activity Categories (N = 500 705)a.
| MPA, min/wk | VPA, min/wk | |||
|---|---|---|---|---|
| 0 | >0-75 | >75-150 | >150 | |
| MSA, <2 sessions/wk | ||||
| 0 | 35.0 | 1.7 | 1.7 | 2.8 |
| >0-75 | 6.7 | 3.0 | 1.4 | 1.1 |
| >75-150 | 5.5 | 1.5 | 1.8 | 1.4 |
| >150-225 | 3.0 | 0.7 | 0.6 | 1.2 |
| >225-300 | 1.2 | 0.2 | 0.3 | 0.5 |
| >300 | 3.3 | 0.7 | 0.7 | 1.9 |
| MSA, ≥2 sessions/wk | ||||
| 0 | 1.2 | 0.4 | 0.8 | 2.2 |
| >0-75 | 0.7 | 0.9 | 1.2 | 1.5 |
| >75-150 | 1.0 | 0.6 | 1.6 | 2.2 |
| >150-225 | 0.6 | 0.2 | 0.6 | 1.7 |
| >225-300 | 0.3 | 0.1 | 0.2 | 0.8 |
| >300 | 0.6 | 0.2 | 0.5 | 2.4 |
Abbreviations: MPA, moderate aerobic physical activity; MSA, muscle-strengthening activity; VPA, vigorous aerobic physical activity.
Estimations accounted for the National Health Interview Survey complex design and weights.
All-Cause, CVD, and Cancer Mortality Risk
Table 3 summarizes the associations of each physical category with all-cause, CVD, and cancer mortality. For all-cause mortality, the highest statistically significant risk reduction was observed for the exposure category corresponding to more than 0 to 75 minutes of MPA combined with more than 150 minutes of VPA and 2 or more MSA sessions per week (HR, 0.50; 95% CI, 0.42-0.59; reference: no MVPA and <2 MSA sessions per week) (Table 3). For CVD mortality, the combination associated with the greatest risk reduction was more than 150 to 225 minutes of MPA, more than 0 to 75 minutes of VPA, and 2 or more MSA sessions per week (HR, 0.30; 95% CI, 0.15-0.57) compared with the reference group (Table 3). The corresponding exposure category associated with the lowest cancer mortality risk was a combined more than 300 minutes of MPA, more than 0 to 75 minutes of VPA, and 2 or more MSA sessions per week (HR, 0.44; 95% CI, 0.23-0.82) (Table 3).
Table 3. Joint Associations of MPA, VPA, and MSA With All-Cause, Cardiovascular, and Cancer Mortalitya.
| MPA, min/wk | VPA, min/wk | |||
|---|---|---|---|---|
| 0 | >0-75 | >75-150 | >150 | |
| All-cause mortality, HR (95% CI) | ||||
| MSA, <2 sessions/wk | ||||
| 0 | 1 [Reference] | 0.78 (0.72-0.85) | 0.75 (0.69-0.82) | 0.76 (0.71-0.82) |
| >0-75 | 0.84 (0.80-0.87) | 0.66 (0.60-0.72) | 0.62 (0.55-0.71) | 0.66 (0.58-0.75) |
| >75-150 | 0.81 (0.77-0.84) | 0.70 (0.62-0.79) | 0.64 (0.58-0.71) | 0.64 (0.56-0.72) |
| >150-225 | 0.83 (0.79-0.87) | 0.73 (0.63-0.85) | 0.75 (0.63-0.88) | 0.63 (0.56-0.71) |
| >225-300 | 0.75 (0.69-0.81) | 0.68 (0.51-0.91) | 0.73 (0.56-0.94) | 0.67 (0.55-0.82) |
| >300 | 0.79 (0.75-0.83) | 0.71 (0.62-0.82) | 0.72 (0.62-0.83) | 0.74 (0.67-0.81) |
| MSA, ≥2 sessions/wk | ||||
| 0 | 0.94 (0.87-1.02) | 0.76 (0.60-0.96) | 0.60 (0.50-0.71) | 0.63 (0.55-0.71) |
| >0-75 | 0.84 (0.73-0.96) | 0.61 (0.51-0.72) | 0.53 (0.45-0.63) | 0.50 (0.42-0.59) |
| >75-150 | 0.81 (0.73-0.89) | 0.66 (0.54-0.80) | 0.56 (0.48-0.64) | 0.56 (0.49-0.64) |
| >150-225 | 0.78 (0.70-0.86) | 0.64 (0.48-0.87) | 0.55 (0.43-0.70) | 0.57 (0.50-0.65) |
| >225-300 | 0.71 (0.57-0.87) | 0.63 (0.42-0.95) | 0.59 (0.43-0.81) | 0.57 (0.47-0.70) |
| >300 | 0.71 (0.63-0.80) | 0.61 (0.47-0.78) | 0.64 (0.55-0.74) | 0.61 (0.55-0.68) |
| Cardiovascular mortality, HR (95% CI) | ||||
| MSA, <2 sessions/wk | ||||
| 0 | 1 [Reference] | 0.79 (0.67-0.94) | 0.73 (0.61-0.88) | 0.69 (0.60-0.79) |
| >0-75 | 0.84 (0.78-0.91) | 0.78 (0.66-0.93) | 0.53 (0.41-0.69) | 0.58 (0.46-0.74) |
| >75-150 | 0.77 (0.72-0.83) | 0.69 (0.55-0.88) | 0.69 (0.57-0.85) | 0.55 (0.44-0.69) |
| >150-225 | 0.77 (0.70-0.84) | 0.79 (0.58-1.09) | 0.62 (0.45-0.86) | 0.61 (0.49-0.75) |
| >225-300 | 0.77 (0.66-0.88) | 0.80 (0.49-1.29) | 0.51 (0.30-0.85) | 0.61 (0.43-0.87) |
| >300 | 0.73 (0.67-0.80) | 0.74 (0.57-0.97) | 0.65 (0.49-0.85) | 0.63 (0.53-0.77) |
| MSA, ≥2 sessions/wk | ||||
| 0 | 0.91 (0.79-1.06) | 0.56 (0.35-0.89) | 0.73 (0.54-0.99) | 0.54 (0.43-0.68) |
| >0-75 | 0.85 (0.68-1.05) | 0.50 (0.34-0.75) | 0.31 (0.21-0.46) | 0.45 (0.32-0.63) |
| >75-150 | 0.88 (0.74-1.06) | 0.61 (0.39-0.96) | 0.47 (0.37-0.62) | 0.49 (0.39-0.63) |
| >150-225 | 0.75 (0.61-0.92) | 0.30 (0.15-0.57) | 0.56 (0.36-0.87) | 0.57 (0.44-0.74) |
| >225-300 | 0.52 (0.35-0.77) | 0.36 (0.12-1.09) | 0.90 (0.55-1.49) | 0.65 (0.43-0.98) |
| >300 | 0.64 (0.52-0.77) | 0.73 (0.45-1.19) | 0.51 (0.37-0.71) | 0.54 (0.43-0.68) |
| Cancer mortality, HR (95% CI) | ||||
| MSA, <2 sessions/wk | ||||
| 0 | 1 [Reference] | 0.82 (0.69-0.97) | 0.83 (0.69-0.99) | 0.88 (0.77-1.01) |
| >0-75 | 0.94 (0.86-1.01) | 0.70 (0.59-0.82) | 0.70 (0.56-0.89) | 0.83 (0.65-1.07) |
| >75-150 | 0.91 (0.83-0.99) | 0.79 (0.64-0.97) | 0.69 (0.56-0.85) | 0.85 (0.70-1.05) |
| >150-225 | 0.91 (0.82-1.01) | 0.84 (0.62-1.14) | 1.09 (0.82-1.44) | 0.67 (0.53-0.85) |
| >225-300 | 0.86 (0.73-1.02) | 0.94 (0.58-1.52) | 1.19 (0.76-1.88) | 0.80 (0.57-1.14) |
| >300 | 0.91 (0.82-1.02) | 0.62 (0.47-0.83) | 0.76 (0.58-1.00) | 0.87 (0.73-1.03) |
| MSA, ≥2 sessions/wk | ||||
| 0 | 0.87 (0.73-1.04) | 0.90 (0.54-1.49) | 0.64 (0.46-0.89) | 0.76 (0.55-1.06) |
| >0-75 | 1.05 (0.72-1.54) | 0.77 (0.58-1.03) | 0.68 (0.51-0.92) | 0.52 (0.39-0.71) |
| >75-150 | 0.78 (0.64-0.96) | 0.80 (0.56-1.14) | 0.72 (0.56-0.92) | 0.65 (0.52-0.82) |
| >150-225 | 0.93 (0.73-1.18) | 0.57 (0.33-0.99) | 0.70 (0.44-1.11) | 0.54 (0.42-0.70) |
| >225-300 | 0.97 (0.65-1.45) | 0.88 (0.43-1.81) | 0.70 (0.41-1.21) | 0.54 (0.34-0.85) |
| >300 | 0.84 (0.66-1.06) | 0.44 (0.23-0.82) | 0.75 (0.54-1.05) | 0.73 (0.58-0.91) |
Abbreviations: HR, hazard ratio; MPA, moderate aerobic physical activity; MSA, muscle-strengthening activity; VPA, vigorous aerobic physical activity.
Hazard ratios were adjusted for age, sex, race, marital status, educational attainment, smoking status, alcohol consumption, chronic condition, body mass index, functional limitation, survey year, and moderate to vigorous physical activity. Models accounted for the National Health Interview Survey complex design and weights.
All-Cause, CVD, and Cancer Mortality Rates
The Figure shows adjusted mortality rates. For all-cause mortality, the category of more than 0 to 75 minutes of MPA, more than 150 minutes of VPA, and 2 or more MSA sessions per week (4.9 per 1000 person-years [ie, the lowest all-cause mortality rate observed]) was associated with a 50% lower mortality rate when compared with the reference category (ie, no MVPA and <2 MSA sessions per week; 9.8 per 1000 person-years) (Figure, A). Compared with no MVPA and less than 2 MSA sessions per week, engaging in more than 150 to 225 minutes of MPA, more than 0 to 75 minutes of VPA, and 2 or more MSA sessions per week or more than 0 to 75 minutes of MPA, more than 75 to 150 minutes of VPA, and 2 or more MSA sessions per week (0.9 per 1000 person-years) was associated with a 3-fold lower CVD mortality rate (Figure, B). Similar to all-cause mortality, the category of more than 300 minutes of MPA, more than 0 to 75 minutes of VPA, and 2 or more MSA sessions per week was associated with a 50% lower cancer mortality rate (1 per 1000 person-years) compared with the referent category (ie, no MVPA and <2 MSA sessions per week; 2.2 per 1000 person-years) (Figure, C).
Figure. Adjusted Mortality Rates for All-Cause, Cardiovascular, and Cancer Mortality Among US Adults by Physical Activity Combination.
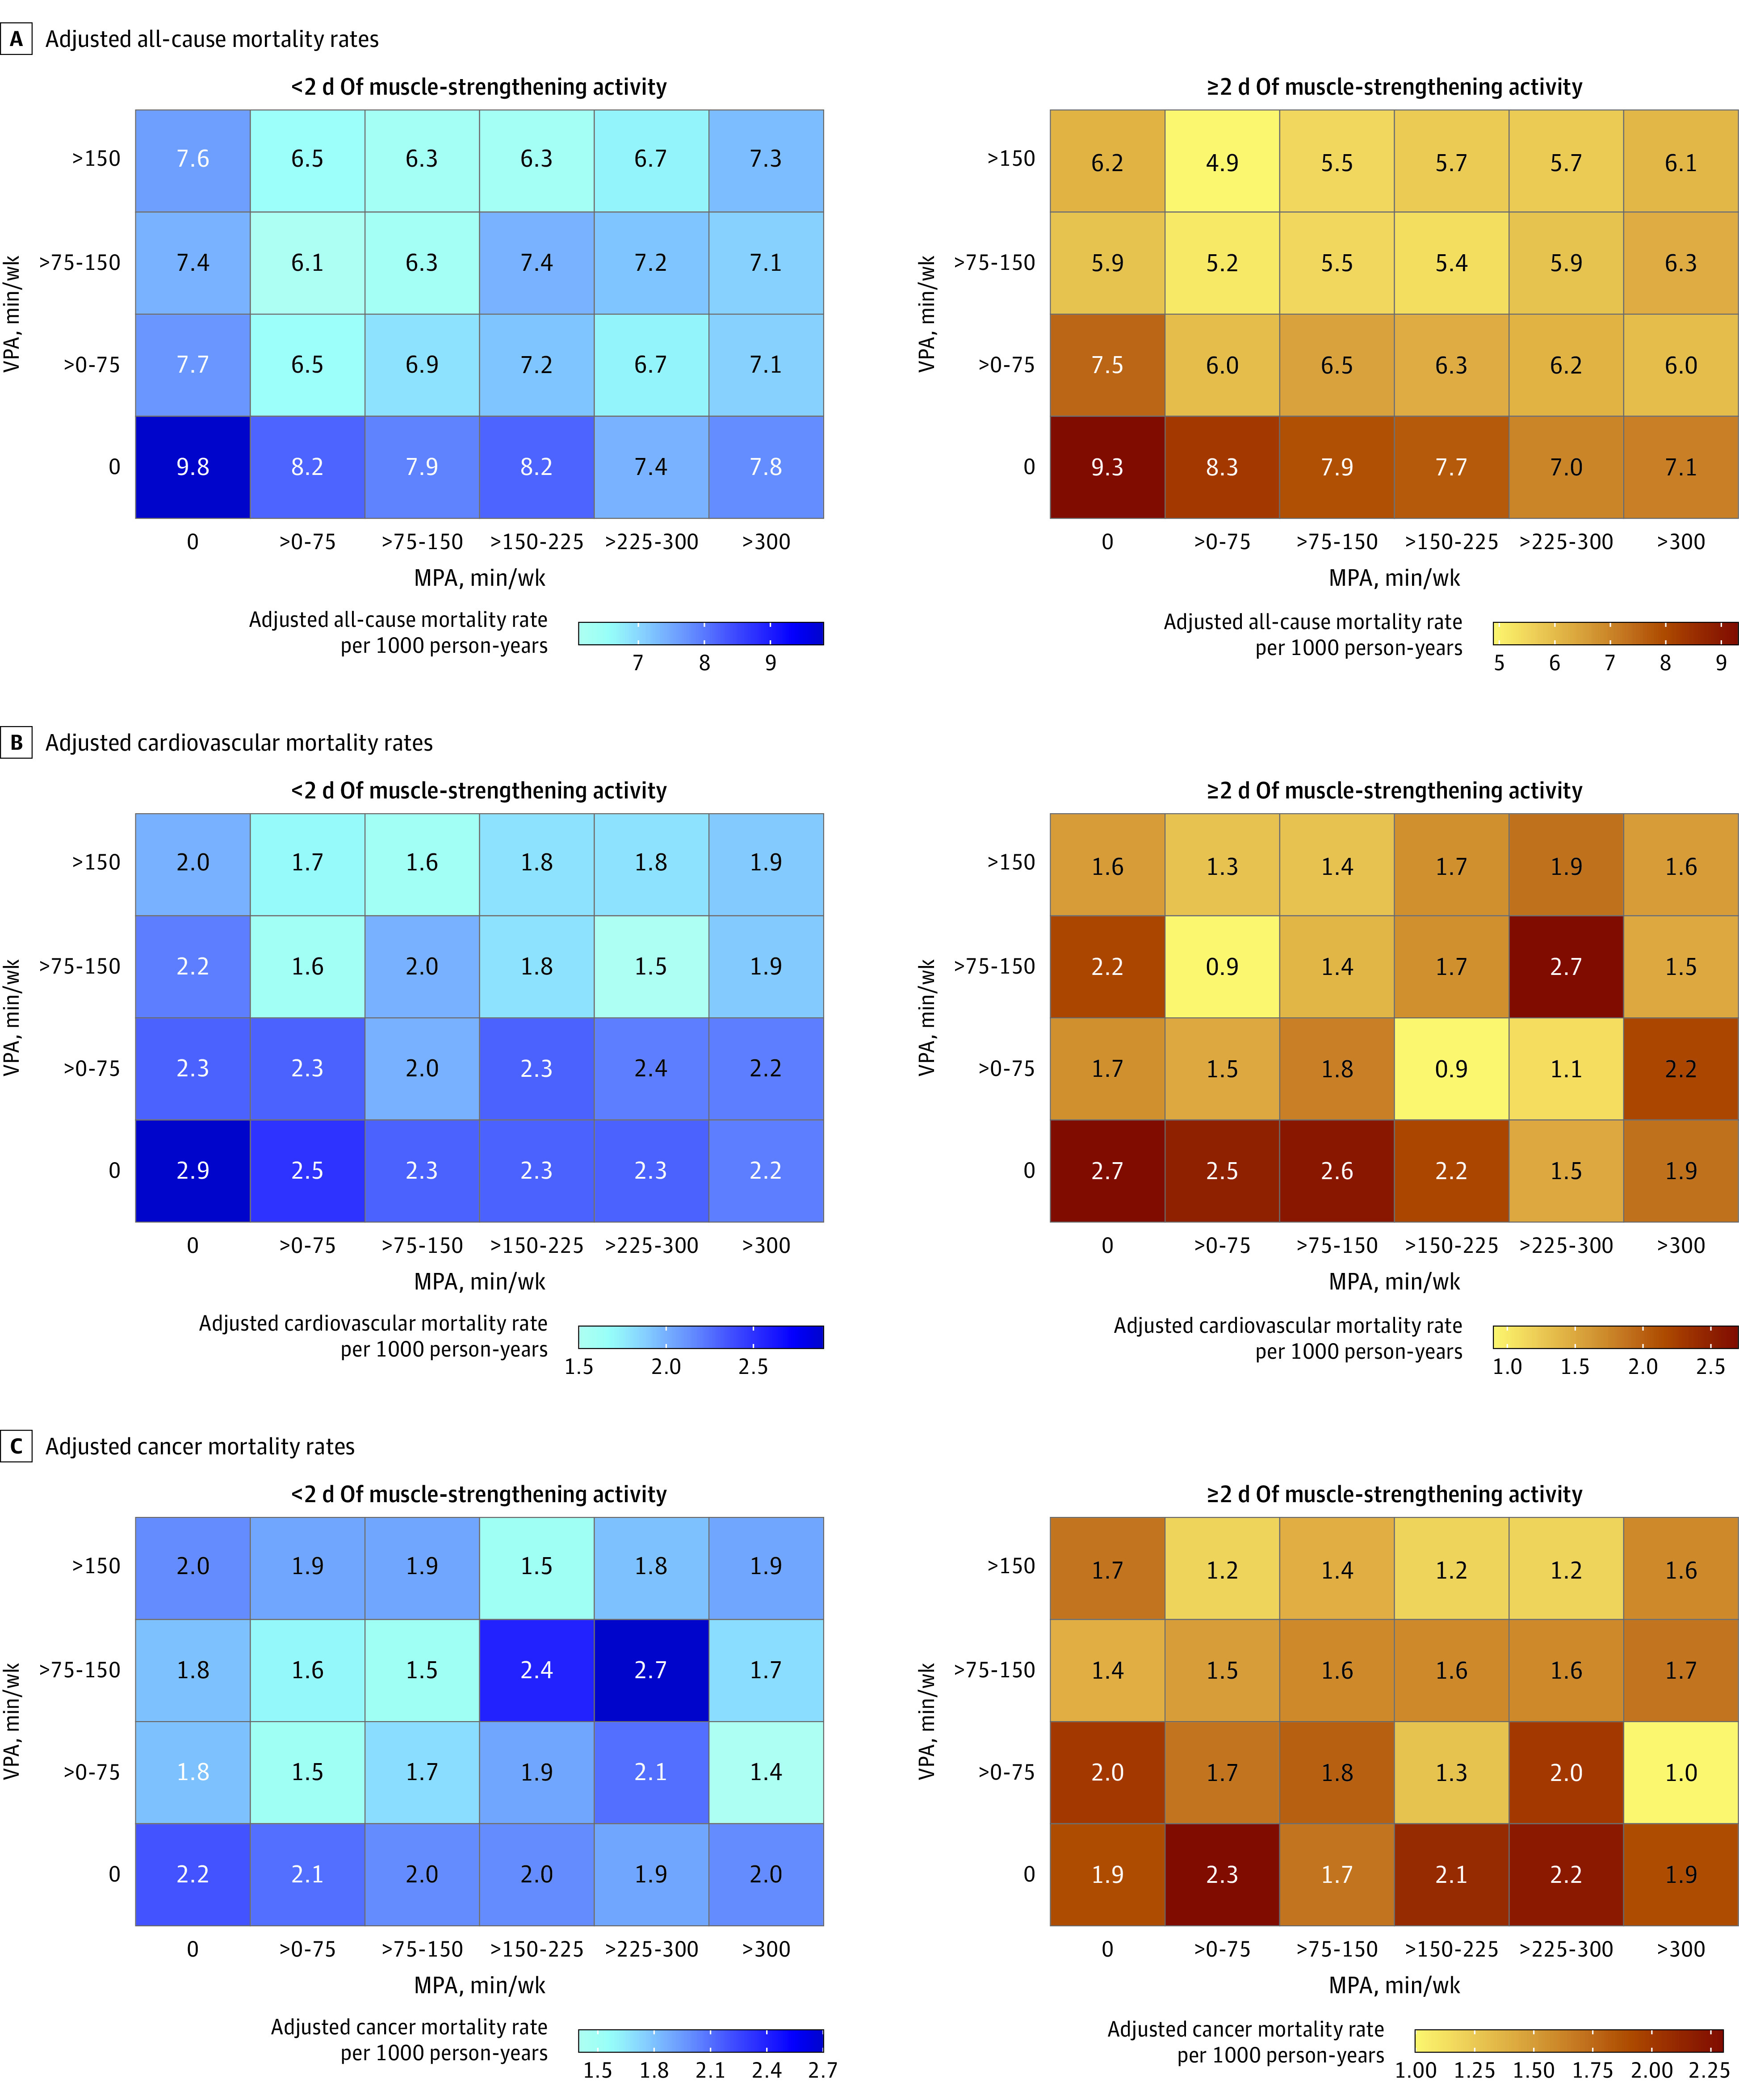
Mortality rates were adjusted for age, sex, race, marital status, educational attainment, smoking status, alcohol consumption, chronic condition, body mass index, functional limitation, survey year, and moderate physical activity (MPA) to vigorous physical activity (VPA). Rates were computed using the estimated weighted mortality rates of the study cohort (8.4, 2.5, and 2.0 deaths per 1000 adults aged ≥18 years per year for all-cause, cardiovascular, and cancer mortality, respectively). Models accounted for the National Health Interview Survey complex design and weights.
Between-group adjusted differences of mortality rates for all-cause mortality ranged between 1.5 (95% CI, 0.8-2.2) and 4.7 (95% CI, 3.9-5.5) prevented deaths per 1000 person-years (reference: no MVPA and <2 MSA sessions per week) (eTable 1 in Supplement 1). Between-group adjusted difference of mortality rates showed a maximum of 2.0 (95% CI, 1.6-2.4) and 1.2 (95% CI, 0.5-1.9) prevented deaths per 1000 person-years for CVD and cancer mortality, respectively (eTables 2 and 3 in Supplement 1).
Sensitivity Analyses
Estimations did not substantially differ when removing deaths due to accidents (eTable 4 in Supplement 1). Also, accounting for competing risks, the category associated with the lowest CVD mortality risk reduction in the main analyses (>150-225 minutes of MPA, >0-75 minutes of VPA, and ≥2 MSA sessions per week) remained the second most optimal exposure category (eTable 5 in Supplement 1). In contrast, the exposure category associated with the lowest risk of cancer mortality (>300 minutes of MPA, >0-75 minutes of VPA, and ≥2 MSA sessions per week) remained the same as in the main analyses when accounting for competing risks (eTable 6 in Supplement 1). Excluding the first 5 years of follow-up yielded similar estimates to those shown in the main analyses (eTables 7-9 in Supplement 1).
Discussion
Using a large representative cohort of US adults, this prospective study sheds novel insights into the associations among different combinations of MPA, VPA, and MSA with all-cause, CVD, and cancer mortality by providing estimates on more detailed exposures and adjusted mortality rates. These findings showed that each optimal combination of MPA, VPA, and MSA associated with lower mortality risk of all-cause, CVD, or cancer requires a contribution of a minimum of each of these 3 different types of physical activity. These findings support the notion that each type of physical activity may provide independent benefits for reducing the risk for all-cause, CVD, and cancer mortality. Importantly, these results also suggest that higher levels than recommended of MPA and VPA may be necessary to optimally lower the risk of cancer and all-cause mortality, respectively.
All-Cause Mortality
These results support those reported in prior research and confirm the independent associations between meeting the current guidelines for either of the physical activity type recommendations (ie, MPA, VPA, and MSA) and a lower risk of all-cause mortality.3 Interestingly, we observed greater risk reductions for individuals who met or were above the VPA recommended levels. The importance of VPA to reduce the risk of all-cause mortality has been previously highlighted. Wang et al7 observed that a higher proportion of VPA to total MVPA was associated with a lower risk of all-cause mortality. A different study concluded that, for the same amount of MVPA, a higher proportion of VPA may provide additional benefits compared with MPA.20 These findings are also consistent with the results observed in a recent UK Biobank study that highlighted the relevance of higher intensity stepping to lower the risk of all-cause mortality.21 The superior benefits of VPA have also been observed in studies with device-based physical activity exposures as well as in longitudinal studies with consistent repeated measures of both MPA and VPA.22,23 The present findings and those from previous studies using self-reported measures point to the plausibility that higher-than-recommended levels of VPA in combination with MPA and meeting MSA guidelines may optimally lower the risk of all-cause mortality in adults.
Cardiovascular Mortality
A higher-than-current-recommendations portion of time spent in MPA was associated with lower CVD mortality risk. Prior research has also observed that a higher proportion of VPA to MPA does not add additional benefits in terms of CVD mortality risk, although Wang et al did not consider the MSA component in their analyses.7 The importance of the independent contributions of MSA to reduce the risk of CVD mortality is relevant and has been previously observed in a study by Gorzelitz et al,9 which reported a lower risk of CVD mortality when combining more MVPA than the recommended levels with any MSA (ie, weight lifting less than once a month). In contrast, we found that MVPA does not need to exceed the recommended levels outlined in the current physical activity guidelines to obtain optimal mortality risk reductions since moderate amounts of both MPA and VPA combined to a duration within or even slightly below the current recommendations (eg, >150-225 min/wk of MPA combined with >0-75 min/wk of VPA and ≥2 MSA trainings/wk) may be enough to maximize such benefits. This might be due to the fact that CVD mortality derives from multifactorial causes, each of which may reduce the risk through different pathways such as reduced incidence of major cardiovascular events (ie, coronary heart disease and heart failure) among older adults when doing regular MVPA (ie, 20 min/d early in late adulthood) and/or MSA.24,25,26
Cancer Mortality
The present results are partly in agreement with those previously reported in a systematic review, which concluded that meeting the current physical activity guidelines meaningfully reduces mortality risk for the most common types of cancer, including bladder, breast, colon, endometrial, esophageal adenocarcinoma, kidney, and gastric cancers.27 However, we also observed that MPA levels higher than recommended (ie, >300 min/wk) in conjunction with low levels of VPA (ie, >0-75 min/wk) and recommended MSA (≥2 sessions/wk) was the combination associated with the lowest risk of cancer mortality. The importance of MPA to reduce cancer mortality has been previously observed in a dose-response meta-analysis by Li et al,28 which showed a risk reduction of 13% in adults who engaged in minimum recommended levels of MPA (ie, a minimum of 150 min/wk). The evidence also suggested additional cancer mortality risk reductions through MSA (ie, ≥2 vs <2 sessions/wk) both independently or in combination with aerobic activities.29
Strengths and Limitations
The present study used a large and representative sample of 22 baseline collections of US adults followed for a median of 10 years. However, we acknowledge several limitations. First, MPA, VPA, and MSA were assessed using a single self-reported measure, which is prone to recall bias and possibly differential misclassification, contributing to a lack of dose-response associations observed with mortality. Second, residual confounding due to unmeasured variables cannot be discarded. Third, because repeated measures of the exposure and covariates are not available in NHIS, we assumed data from the baseline as fixed during follow-up, although variations are possible.23
Conclusions
This cohort study demonstrated that the ideal combination of physical activity for reducing the risk of death from various causes varied. However, to lower the risk of all-cause, CVD, and cancer mortality, at least some amount of both MPA and VPA as well as the recommended levels MSA were necessary. Increasing VPA while maintaining any amount of MPA and recommended levels of MSA may result in greater reduction of all-cause mortality risk, while more MPA than currently recommended, combined with any VPA and recommended MSA, may lead to lower risk of cancer mortality.
eTable 1. Between-group adjusted differences of mortality rates for all-cause mortality among US adults
eTable 2. Between-group adjusted differences of mortality rates for cardiovascular mortality among US adults
eTable 3. Between-group adjusted differences of mortality rates for cancer mortality among US adults
eTable 4. Joint associations of moderate aerobic, vigorous aerobic, and muscle strengthening activity with all-cause mortality excluding participants who died due to an accident
eTable 5. Joint associations of moderate aerobic, vigorous aerobic, and muscle strengthening activity with cardiovascular mortality accounting for mortality causes other than cardiovascular as competing risk
eTable 6. Joint associations of moderate aerobic, vigorous aerobic, and muscle strengthening activity with cancer mortality accounting for mortality causes other than cancer as competing risk
eTable 7. Joint associations of moderate aerobic, vigorous aerobic, and muscle strengthening activity with all-cause mortality excluding first five years of follow-up
eTable 8. Joint associations of moderate aerobic, vigorous aerobic, and muscle strengthening activity with cardiovascular mortality excluding first five years of follow-up
eTable 9. Joint associations of moderate aerobic, vigorous aerobic, and muscle strengthening activity with cancer mortality excluding first five years of follow-up
Data Sharing Statement
References
- 1.Gebel K, Ding D, Chey T, Stamatakis E, Brown WJ, Bauman AE. Effect of moderate to vigorous physical activity on all-cause mortality in middle-aged and older Australians. JAMA Intern Med. 2015;175(6):970-977. doi: 10.1001/jamainternmed.2015.0541 [DOI] [PubMed] [Google Scholar]
- 2.Saint-Maurice PF, Coughlan D, Kelly SP, et al. Association of leisure-time physical activity across the adult life course with all-cause and cause-specific mortality. JAMA Netw Open. 2019;2(3):e190355. doi: 10.1001/jamanetworkopen.2019.0355 [DOI] [PMC free article] [PubMed] [Google Scholar]
- 3.Zhao M, Veeranki SP, Magnussen CG, Xi B. Recommended physical activity and all cause and cause specific mortality in US adults: prospective cohort study. BMJ. 2020;370:m2031. doi: 10.1136/bmj.m2031 [DOI] [PMC free article] [PubMed] [Google Scholar]
- 4.Webber BJ, Piercy KL, Hyde ET, Whitfield GP. Association of muscle-strengthening and aerobic physical activity with mortality in US adults aged 65 years or older. JAMA Netw Open. 2022;5(10):e2236778. doi: 10.1001/jamanetworkopen.2022.36778 [DOI] [PMC free article] [PubMed] [Google Scholar]
- 5.Physical Activity Guidelines for Americans: 2nd edition. US Department of Health and Human Services . 2018. Accessed June 30, 2023. https://health.gov/sites/default/files/2019-09/Physical_Activity_Guidelines_2nd_edition.pdf
- 6.Bull FC, Al-Ansari SS, Biddle S, et al. World Health Organization 2020 guidelines on physical activity and sedentary behaviour. Br J Sports Med. 2020;54(24):1451-1462. doi: 10.1136/bjsports-2020-102955 [DOI] [PMC free article] [PubMed] [Google Scholar]
- 7.Wang Y, Nie J, Ferrari G, Rey-Lopez JP, Rezende LFM. Association of physical activity intensity with mortality: a national cohort study of 403 681 US adults. JAMA Intern Med. 2021;181(2):203-211. doi: 10.1001/jamainternmed.2020.6331 [DOI] [PMC free article] [PubMed] [Google Scholar]
- 8.Coleman CJ, McDonough DJ, Pope ZC, Pope CA. Dose-response association of aerobic and muscle-strengthening physical activity with mortality: a national cohort study of 416 420 US adults. Br J Sports Med. 2022;bjsports-2022-105519. doi: 10.1136/bjsports-2022-105519 [DOI] [PMC free article] [PubMed] [Google Scholar]
- 9.Gorzelitz J, Trabert B, Katki HA, Moore SC, Watts EL, Matthews CE. Independent and joint associations of weightlifting and aerobic activity with all-cause, cardiovascular disease and cancer mortality in the Prostate, Lung, Colorectal and Ovarian Cancer Screening Trial. Br J Sports Med. 2022;56(22):1277-1283. doi: 10.1136/bjsports-2021-105315 [DOI] [PMC free article] [PubMed] [Google Scholar]
- 10.Parsons VL, Moriarity C, Jonas K, Moore TF, Davis KE, Tompkins L. Design and estimation for the National Health Interview Survey, 2006-2015. Vital Health Stat 2. 2014;(165):1-53. [PubMed] [Google Scholar]
- 11.Health care surveys. National Center for Health Statistics . Accessed June 30, 2023. https://www.cdc.gov/nchs/ahcd/ahcd_confidentiality.htm
- 12.von Elm E, Altman DG, Egger M, Pocock SJ, Gøtzsche PC, Vandenbroucke JP; STROBE Initiative . The Strengthening the Reporting of Observational Studies in Epidemiology (STROBE) Statement: guidelines for reporting observational studies. Int J Surg. 2014;12(12):1495-1499. doi: 10.1016/j.ijsu.2014.07.013 [DOI] [PubMed] [Google Scholar]
- 13.Linkage methods and analytical support for NCHS linked mortality data. National Center for Health Statistics . Accessed June 30, 2023. https://www.cdc.gov/nchs/data-linkage/ mortality-methods.htm
- 14.Xu J, Murphy SL, Kochanek KD, Bastian BA. Deaths: final data for 2013. Natl Vital Stat Rep. 2016;64(2):1-119. [PubMed] [Google Scholar]
- 15.Overview of topics. National Center for Health Statistics . Accessed June 30, 2023. https://www.cdc.gov/nchs/nhis/physical_activity/pa_overview.htm.
- 16.Milton K, Bull FC, Bauman A. Reliability and validity testing of a single-item physical activity measure. Br J Sports Med. 2011;45(3):203-208. doi: 10.1136/bjsm.2009.068395 [DOI] [PubMed] [Google Scholar]
- 17.Mokdad AH, Marks JS, Stroup DF, Gerberding JL. Actual causes of death in the United States, 2000. JAMA. 2004;291(10):1238-1245. doi: 10.1001/jama.291.10.1238 [DOI] [PubMed] [Google Scholar]
- 18.Newson RB. Attributable and unattributable risks and fractions and other scenario comparisons. Stata J. 2013;13(4):672-698. doi: 10.1177/1536867X1301300402 [DOI] [Google Scholar]
- 19.Tarp J, Hansen BH, Fagerland MW, Steene-Johannessen J, Anderssen SA, Ekelund U. Accelerometer-measured physical activity and sedentary time in a cohort of US adults followed for up to 13 years: the influence of removing early follow-up on associations with mortality. Int J Behav Nutr Phys Act. 2020;17(1):39. doi: 10.1186/s12966-020-00945-4 [DOI] [PMC free article] [PubMed] [Google Scholar]
- 20.Rey Lopez JP, Gebel K, Chia D, Stamatakis E. Associations of vigorous physical activity with all-cause, cardiovascular and cancer mortality among 64 913 adults. BMJ Open Sport Exerc Med. 2019;5(1):e000596. doi: 10.1136/bmjsem-2019-000596 [DOI] [PMC free article] [PubMed] [Google Scholar]
- 21.Del Pozo Cruz B, Ahmadi MN, Lee IM, Stamatakis E. Prospective associations of daily step counts and intensity with cancer and cardiovascular disease incidence and mortality and all-cause mortality. JAMA Intern Med. 2022;182(11):1139-1148. doi: 10.1001/jamainternmed.2022.4000 [DOI] [PMC free article] [PubMed] [Google Scholar]
- 22.Saint-Maurice PF, Troiano RP, Berrigan D, Kraus WE, Matthews CE. Volume of light versus moderate-to-vigorous physical activity: similar benefits for all-cause mortality? J Am Heart Assoc. 2018;7(7):e008815. doi: 10.1161/JAHA.118.008815 [DOI] [PMC free article] [PubMed] [Google Scholar]
- 23.Lee DH, Rezende LFM, Joh HK, et al. Long-term leisure-time physical activity intensity and all-cause and cause-specific mortality: a prospective cohort of US adults. Circulation. 2022;146(7):523-534. doi: 10.1161/CIRCULATIONAHA.121.058162 [DOI] [PMC free article] [PubMed] [Google Scholar]
- 24.Shailendra P, Baldock KL, Li LSK, Bennie JA, Boyle T. Resistance training and mortality risk: a systematic review and meta-analysis. Am J Prev Med. 2022;63(2):277-285. doi: 10.1016/j.amepre.2022.03.020 [DOI] [PubMed] [Google Scholar]
- 25.Länsitie M, Kangas M, Jokelainen J, et al. Cardiovascular disease risk and all-cause mortality associated with accelerometer-measured physical activity and sedentary time—a prospective population-based study in older adults. BMC Geriatr. 2022;22(1):729. doi: 10.1186/s12877-022-03414-8 [DOI] [PMC free article] [PubMed] [Google Scholar]
- 26.Barbiellini Amidei C, Trevisan C, Dotto M, et al. Association of physical activity trajectories with major cardiovascular diseases in elderly people. Heart. 2022;108(5):360-366. doi: 10.1136/heartjnl-2021-320013 [DOI] [PubMed] [Google Scholar]
- 27.McTiernan A, Friedenreich CM, Katzmarzyk PT, et al. ; 2018 Physical Activity Guidelines Advisory Committee . Physical activity in cancer prevention and survival: a systematic review. Med Sci Sports Exerc. 2019;51(6):1252-1261. doi: 10.1249/MSS.0000000000001937 [DOI] [PMC free article] [PubMed] [Google Scholar]
- 28.Li T, Wei S, Shi Y, et al. The dose-response effect of physical activity on cancer mortality: findings from 71 prospective cohort studies. Br J Sports Med. 2016;50(6):339-345. doi: 10.1136/bjsports-2015-094927 [DOI] [PubMed] [Google Scholar]
- 29.Nascimento W, Ferrari G, Martins CB, et al. Muscle-strengthening activities and cancer incidence and mortality: a systematic review and meta-analysis of observational studies. Int J Behav Nutr Phys Act. 2021;18(1):69. doi: 10.1186/s12966-021-01142-7 [DOI] [PMC free article] [PubMed] [Google Scholar]
Associated Data
This section collects any data citations, data availability statements, or supplementary materials included in this article.
Supplementary Materials
eTable 1. Between-group adjusted differences of mortality rates for all-cause mortality among US adults
eTable 2. Between-group adjusted differences of mortality rates for cardiovascular mortality among US adults
eTable 3. Between-group adjusted differences of mortality rates for cancer mortality among US adults
eTable 4. Joint associations of moderate aerobic, vigorous aerobic, and muscle strengthening activity with all-cause mortality excluding participants who died due to an accident
eTable 5. Joint associations of moderate aerobic, vigorous aerobic, and muscle strengthening activity with cardiovascular mortality accounting for mortality causes other than cardiovascular as competing risk
eTable 6. Joint associations of moderate aerobic, vigorous aerobic, and muscle strengthening activity with cancer mortality accounting for mortality causes other than cancer as competing risk
eTable 7. Joint associations of moderate aerobic, vigorous aerobic, and muscle strengthening activity with all-cause mortality excluding first five years of follow-up
eTable 8. Joint associations of moderate aerobic, vigorous aerobic, and muscle strengthening activity with cardiovascular mortality excluding first five years of follow-up
eTable 9. Joint associations of moderate aerobic, vigorous aerobic, and muscle strengthening activity with cancer mortality excluding first five years of follow-up
Data Sharing Statement