

Abstract
Determining bacterial identity at the strain level is critical for public health to enable proper medical treatments and reduce antibiotic resistance. Herein, we used liquid chromatography, ion mobility, and tandem MS (LC-IM-MS/MS) to distinguish Escherichia coli (E. coli) strains. Numerical multivariate statistics (principal component analysis, followed by linear discriminant analysis) showed the capability of this method to perform strain-level discrimination with prediction rates of 96.1% and 100% utilizing the negative and positive ion information, respectively. The tandem MS and LC separation proved effective in discriminating diagnostic lipid isomers in the negative mode, while IM separation was more effective in resolving lipid conformational biomarkers in the positive ion mode. Because of the clinical importance of early detection for rapid medical intervention, a faster technique, paper spray (PS)-IM-MS/MS, was used to discriminate the E. coli strains. The achieved prediction rates of the analysis of E. coli strains by PS-IM-MS/MS were 62.5% and 73.5% in the negative and positive ion modes, respectively. The strategy of numerical data fusion of negative and positive ion data increased the classification rates of PS-IM-MS/MS to 80.5%. Lipid isomers and conformers were detected, which served as strain-indicating biomarkers. The two complementary multidimensional techniques revealed biochemical differences between the E. coli strains confirming the results obtained from comparative genomic analysis. Moreover, the results suggest that PS-IM-MS/MS is a rapid, highly selective, and sensitive method for discriminating bacterial strains in environmental and food samples.
Keywords: ion mobility, tandem mass spectrometry, ambient ionization, E. coli strain differentiation, direct CCS measurements
INTRODUCTION
Infections caused by Escherichia coli (E. coli), a frequent causative agent of many common bacterial diseases such as urinary tract infections, foodborne illnesses, etc. present an increasing public health burden worldwide because of high mortality rates (between 10% and 30% for bloodstream infections)1 and increasing antimicrobial resistance.2 Each year in the United States, E. coli infections cause approximately 265,000 illnesses, 3,600 hospitalizations,3 and about 100 deaths.4 Different E. coli strains share a close genetic identity but are associated with different diseases and antibiotic susceptibility profiles.5 Therefore, effective treatments would depend on rapid and accurate identification of the causative strain, leading to strain-specific therapy that would shorten hospitalization periods, improve patient recovery, and lower antibiotic resistance. Traditional methods used in microbiology diagnostic laboratories include enzyme immunoassays (EIA), polymerase chain reaction (PCR), and pulsed-field gel electrophoresis (PFGE).6–7 EIA and PCR methods are sensitive, often eliminating the need for cultural enrichment, but lacking the required specificity to be considered confirmatory at the strain level.7 While PFGE is the gold standard for providing strain-level discrimination of bacteria,7–8 it is labor intensive, not easily automated, and requires a minimum of 2 days of post-culture time.6–7 Hence, alternative analytical methods that ensure minimal time consumption, and provide high sensitivity and specificity at the strain level are needed.
Matrix-assisted laser desorption/ionization time-of-flight mass spectrometry (MALDI-TOF MS) has emerged as an invaluable tool in today’s routine clinical microbiology for accurate and cost-effective identification of microorganisms because of its relatively simple sample preparation and extremely rapid data acquisition and analysis.9–10 Identification using MALDI-TOF MS is most reliable at the species level; however, it has a reduced discriminatory power at the strain level due to limiting factors such as (i) dependence on comparing the mass spectral profiles of the bacteria and the reference library,11–12 (ii) reduced dynamic sensitivity, i.e., lowered detectability of protein signals over a wide concentration range,9, 13 and (iii) relatively low selectivity due to the inability of MS to separate isomers.14 In contrast to MALDI-TOF MS, front-end separations with MS, such as liquid chromatography-mass spectrometry (LC-MS), have high dynamic sensitivity, i.e., increased protein signals with a concomitant increase in taxonomic resolution, and high selectivity due to the ability of LC to provide isomer separation.9, 15 In fact, LC-MS methods have differentiated strains of Enterobacter sakazakii,16 Shiga-toxigenic Escherichia coli,17 Vibrio parahaemolyticus,18 and Bacillus cereus.19
Lipids, important cellular constituents, can be used as diagnostic biomarkers for microbial identification.12 However, lipids display high structural diversity and complexity, such as variations in headgroup, chain length, sn-position, double bond position, and geometry.15, 20 LC-MS alone cannot resolve all the lipid isomer types and does not provide comprehensive structural annotation of lipid isomers in untargeted analyses.19 These challenges limit the application of LC-MS for strain-level differentiation since the identity of the isomeric lipid biomarkers that distinguish the bacteria strains is unknown. Tandem mass spectrometry (MS/MS) doesn’t only provide structural information about the isomeric lipid biomarkers but also serves as a “fingerprint” used to confirm the identity of each microorganism.15, 20 However, the problem of similar fragmentation patterns in some isomer types (e.g., geometric isomers) limits the discriminatory power of tandem MS for strain-level differentiation.21 Clear separation between diagnostic lipid isomer biomarkers is required to discriminate and identify bacteria strains reliably.
Ion mobility spectrometry (IMS) is particularly suited to address the structural challenges endemic to lipid isomers. In IM, structurally different lipid ions rapidly separate in the gas phase due to numerous collisions between lipid ions and inert buffer gas molecules under the influence of an electric field.22 Lipid isomers separated by IM can be further identified using collision cross section (CCS) values, a rotationally averaged surface area of ions, which significantly improves the accuracy of lipid annotations.23 IM has been explored clinically for the differentiation of Bacillus species21 and Klebsiella pneumoniae strains.24 IM separations occur on a millisecond timescale and can therefore be readily nested into conventional LC-MS/MS workflows.25 Several studies have concluded that an integrated approach is successful in bacterial identification.7, 26–27 Hence, interfacing IM with LC-MS/MS will provide additional power as complementary separations from these orthogonal techniques which would enable multidimensional characterization of diagnostic lipid isomer biomarkers differentiating the bacteria strains as a result of enhanced peak capacity.28
The clinical importance of early detection highlights the need for rapid diagnostic techniques for prompt medical intervention and treatment. In contrast to the LC methods, ambient ionization techniques provide rapid means of bacterial analysis with little or no sample preparation.12 Several ambient ionization techniques have been developed and rapidly utilized to effectively distinguish microorganisms, including desorption electrospray ionization (DESI),29 rapid evaporative ionization MS (REIMS),30 touch spray (TS),31 and paper spray (PS).32 Moreover, PS has been previously coupled with ion mobility - tandem mass spectrometry (PS-IM-MS/MS) to distinguish bacterial species rapidly and accurately.21
In this study, we used LC-IM-MS/MS and PS-IM-MS/MS separately as multidimensional analytical techniques combined with chemometric data analysis methods to discriminate seven E. coli strains. The integrated techniques were used to provide complementary separations and multidimensional characterizations of various isomer types needed for accurate identification of lipid isomer biomarkers and clear discrimination of E. coli strains. Lipid isomers’ annotation based on experimental CCS values was validated using computational approaches such as molecular dynamics and lipid CCS predictor.33 Due to the high dimensionality of the LC-IM-MS /MS and PS-IM-MS/MS data, classification was performed using the multivariate analysis methods of principal component analysis (PCA), which reduced the dimensionality of the data, followed by linear discriminant analysis (LDA), which classified all PCA-reduced spectra into independent categories according to the similarities and differences in the molecular composition of the bacterial strains.
EXPERIMENTAL METHODS
Materials.
Ultrapure acetonitrile (ACN) and water (H2O) solvents were purchased from Agilent Technologies (Santa Clara, CA). LC-MS grade isopropanol (IPA) and ammonium acetate, were purchased from Sigma-Aldrich (St. Louis, MO USA). LC-MS grade chloroform (CHCl3) was purchased from VWR Chemicals (Radnor, PA) while LC-MS grade methanol (MeOH) was purchased from Honeywell (Muskegon, MI). 1,2-dioleoyl-sn-glycero-3-phospho-(1’-rac-glycerol) (sodium salt) PG (18:1(Δ9)/18:1 (Δ9))-Cis, 1,2-dielaidoyl-sn-glycero-3-phospho-(1’-rac-glycerol) (sodium salt) PG (18:1(Δ9)/18:1 (Δ9))-Trans, and E. coli Polar Lipid Extract (ATCC 11303) were purchased from Avanti Polar Lipids, Inc. (Alabaster, AL). Moreover, a low-concentration ESI tuning mix was purchased from Agilent Technologies (Santa Clara, CA). All reagents and chemicals were used without additional purification.
Stock solutions of these standards (1 µg µL−1) were prepared in CHCl3: MeOH (2:1, v/v) and stored at −20 ℃. Then, the stock solutions were diluted in IPA: ACN: H2O (2:1:1, v/v/v) to a final concentration of 5 ng µL−1 for the E. coli Polar Lipid Extract and 0.5 ng µL−1 for the geometric lipids’ isomers.
Culturing conditions and lipid extraction of bacteria.
Isolates of seven non-pathogenic E. coli strains (K-12, C41, BL21, CSH23, DH10B, DH5α, and S17–1 λpir) were gifted by Dr. Steven Mansoorabadi (Department of Chemistry and Biochemistry, Auburn University) and Dr. Mark Liles (Department of Biological Sciences, Auburn University) and stored at −80 ℃. The bacteria were aliquoted from frozen glycerol stocks into Luria broth (LB) using sterile pipette tips. The liquid cultures were incubated in a forced air incubator (VWR, Chicago, IL) under shaking conditions (220 rpm) at 37 ℃ for 16 h. The number of bacterial cells was measured through absorbance measurements to be 8.10 ± 0.35 × 10⁸ CFU/mL (Table S1).34 All bacterial culturing activities were performed in a biological safety cabinet (Labconco, Kansas City, MO), and biohazardous materials were autoclaved.
Lipids were extracted from bacterial cells according to the Folch method.35 Briefly, 2 mL of chilled CHCl3/MeOH (2:1) was added to the bacterial suspension and vortexed for 3 minutes. Then, 0.5 mL of chilled water was added to the suspension to induce phase separation, followed by another 1 minute of vortexing followed by centrifugation at 2,800 rpm for 8 minutes. The CHCl3-rich (bottom) phase containing the phospholipids (PLs) was then removed with a sterile pipette tip. The extraction step was repeated twice, and the collected organic phase was diluted with IPA: ACN: H2O (2:1:1, v/v/v) for analysis.
LC–IM–MS/MS Analyses.
All experiments were performed using the Agilent 1290 Infinity LC system and the Agilent 6560 IM-QTOF MS (Agilent Technologies, Santa Clara) instruments.36 The separations of the lipid isomers using the reversed-phase (RP) LC were performed by injecting 3 µL of the sample onto a Zorbax RRHD Extend C18 column ((50.0 mm × 2.1 mm i.d., 1.8 µm particle size; Agilent Technologies, Santa Clara, CA) at 45 ℃). Mobile phase A consisted of ACN/H2O (60:40, v/v), while mobile phase B comprised IPA/ACN (90:10, v/v). Both mobile phases A and B contained 10 mM ammonium acetate for increased signal intensity.37 Gradient elution was maintained at 55% B for the first 5 minutes and gradually increased to 98% B over the next 5 minutes at a flow rate of 0.4 mL/min, after which the column was equilibrated to baseline conditions for 2 minutes before the next injection, resulting in a total run time of 12 minutes. The same chromatographic conditions were used for both positive and negative ion modes.
The effluent from the RPLC separation was directed to the ESI source of the Agilent 6560 IM-QTOF MS. The instrument has been described in detail elsewhere,38 and the conditions for the ESI source were as follows: Drying gas temperature and flow rate, 325 ℃, and 5 L/min; nebulizer gas pressure, 30 psi; sheath gas temperature and flow rate, 275 ℃, and 12 L/min; capillary voltage, 3500 V; nozzle voltage, 1000 V; fragmentor, 400 V; octopole RF, 750 V. The instrument was operated in all-ion IM-MS/MS mode, with ion mobility spectra acquired using a pseudorandom 5-bit sequence (multiplexing mode). In the multiplexing mode, several ion packets are pulsed into the drift tube during each data acquisition cycle, increasing the efficiency of ion utilization within the same dwell time.39 Ions exiting the drift tube are refocused through the rear funnel into the quadrupole mass filter, allowing total ion transmission into the collision cell for fragmentation. Ion mobility and product ion (MS/MS) scans were acquired in two alternating frames: the low fragmentation frame at 0 V and the high fragmentation frame at 35 V. The overlapping spectra of the IM data files were deconvoluted using the PNNL PreProcessor software package, version 4.0 (2021.10.27),40 and further processed using the High-Resolution Demultiplexing (HRdm) tool (v2.0.118) to increase the IM resolving power from ~60 to ~250.21, 39 Both low (IM) and high fragmentation (MS/MS) data were exported from the IM-MS Browser (v10.0.1) after averaging the ion mobility tandem mass spectrum, while the LC data were analyzed with Mass Hunter qualitative software (v10.0) and further processed with Mass Profiler (v10.0.2) to export the relevant LC information (retention time, abundance, m/z) for multivariate analysis. The LC-IM-MS/MS data were acquired in positive and negative ion modes in the range of m/z 100 – 1700, with the TOF operated in high sensitivity mode at ∼20,000 resolution. The IM-MS/MS settings are listed in Table S2. CCS measurements of abundant lipid isomers were performed using the single-field method (calibrant-dependent) with a drift field of 18.5 V/cm.36
Lipid Identification.
The LC-IM all ions fragmentation data were annotated to specific lipids using MS/MS in silico spectra matching with Mass Hunter Lipid Annotator software (Agilent Technologies, Santa Clara, CA).41 Glycerophospholipid classes searched for in positive and negative ion modes included phosphatidylethanolamines (PE), phosphatidylglycerols (PG), and cardiolipins (CL) using the data processing parameters given in Table S3. Molecular lipids were annotated with the number of carbon atoms and double bonds of the fatty acid in the sn-1 position, followed by the number of carbon atoms and double bonds of the fatty acid in the sn-2 position. The confidence level of the tentative annotation list was increased by using the lipid CCS predictor to reduce false identifications based on CCS values.33 The SMILES structure of the molecular lipid was inputted into the CCS predictor and CCS values for [M+H]+, [M+Na]+, and [M+NH4]+ were searched in positive ion mode and for [M−H]− in negative ion mode.
Paper spray ambient ionization.
We recently reported that the PS ambient ionization method can be used to successfully discriminate various bacteria species rapidly and accurately.21 In the current study, 8 mL of the cultured bacteria in LB were filtered through a glass fiber filter paper using a Buchner funnel, and the filter paper was allowed to dry at ambient temperatures for about 15 minutes. Then, the filter papers were cut into several triangles of approximately 8 mm base width and 10 mm height and placed at an optimal distance (~6 mm) from the IM-MS inlet. Spray solvent and high voltage were then applied to generate an electrospray-like plume.38 Forty microliters of the spray solvent were added, which enabled the extraction of various analytes and efficient paper spray ionization. Afterward, the ions were transported into the IM-MS inlet because of the pressure and voltage gradients, followed by data acquisition in all-ion IM-MS/MS mode, with IM spectra acquired using a pseudorandom 5-bit sequence (multiplexing mode). Post-processing of the IM and MS/MS data for multivariate statistical analysis is performed as in the steps described above for the LC-IM all-ion fragmentation data.
Multivariate statistics.
Linear scaling was employed to normalize all tandem mass spectra, and high-resolution IM, LC, and PS data from each replicate. The range of mass is 0~1400 m/z, 0~60 ms for drift time, and 0~10 minutes for retention time. Our multivariate statistical analysis was performed on the spectra obtained from LC-IM-MS/MS and PS-IM-MS/MS experiments. The MS data associated with LC-IM-MS/MS experiments were compiled into a matrix (56 by 100561 for positive ion mode, 56 by 808806 for negative ion mode). To reduce the redundant information, m/z and drift time selections were successively carried out from IM data. Specifically, for each dataset with IM data, we performed peak identification for mass spectra over all 56 replicates by extracting the most abundant 100 peaks and recorded the corresponding “m/z” values. Then, we kept all the ions that were identified in at least 4 replicates. For each selected mass spectrum, we removed the drift time when the abundance was extremely small, i.e., less than 5% of the largest abundance value. For each selected mass spectra and drift time, we recorded the corresponding abundance values. Therefore, each value in the reconstructed IM data matrix denotes the intensities of bacteria strains with specific drift spectra and mass spectra (56 by 18380 for positive ion mode, 56 by 18011 for negative ion mode). Similarly, peak identification, mass selection, and elimination of extremely small abundance peaks were performed on LC data. Each value in the reconstructed LC data matrix denotes the intensity of bacteria strains with specific retention times and m/z (56 by 2421 for positive ion mode, 56 by 2318 for negative ion mode).
PCA was applied to the datasets listed in Table S4. PCA compressed the original data matrix into a set of independent PCs, which were linear combinations of variables in the original datasets. The similarities among the seven E. coli strains and the importance of the original variables in each PC were visualized by a biplot, which overlays a score plot with a loading plot. Besides, based on the proportion of variance explained by each PC, the first three PCs were selected as new variables for subsequent classification. LDA is a widely used statistical classification method, which attempts to differentiate classes using a linear combination of independent variables. In this study, LDA was implemented to distinguish different strains using the new variables generated by PCA in the previous step. To avoid overfitting, we used stratified cross-validation (CV), a popular resampling technique for evaluating models’ performance. In this study, one replicate was chosen at random from each strain to form the testing set (approximately 13% of the dataset), and the rest formed the training set (approximately 87% of the dataset). The LDA model was trained on the training set and tested on the testing set. Furthermore, the stratified CV was repeated 400 times to avoid sampling bias, and the classification accuracies were averaged across all stratified CVs. The model performance was summarized in the confusion matrices (Tables S5–S6). To improve the classification of strains with the PS-IM-MS/MS method, the positive and negative ion mode data were used in conjunction via data fusion. Specifically, the fusion data (56 by 6) was constructed by the combination of extracted PCs from positive and negative ion mode data.
RESULTS AND DISCUSSION
Complementary separations of lipid isomers and conformers.
Since lipids are significant disease biomarkers, effective separation of lipid isomers is crucial to knowing the lipid isomer composition for accurate diagnosis of diseases. Geometric isomers, particularly trans isomers, unlike cis isomers, are associated with metabolic disease and colon cancer, highlighting the need for efficient separation. Since MS cannot distinguish geometric isomers, we interfaced a complementary separation method, LC, with the MS technique to provide orthogonal separation. A mixture of PG (18:1(9Z)/18:1 (9Z))-Cis and PG (18:1(9E)/18:1 (9E))-Trans isomers was analyzed (Figure 1A). The LC dimension provided a baseline separation of the cis and trans isomers (resolution (r) ~ 2.1, Figure 1B). The cis double bond geometry causes more kinks in the lipid backbone than the trans configuration, resulting in reduced surface hydrophobicity of the cis isomer. This results in the cis isomer being more polar than the trans isomer. Since the separation mechanism in reversed-phase LC (RPLC) depends on polarity, the cis and trans isomers were effectively separated.
Figure 1.
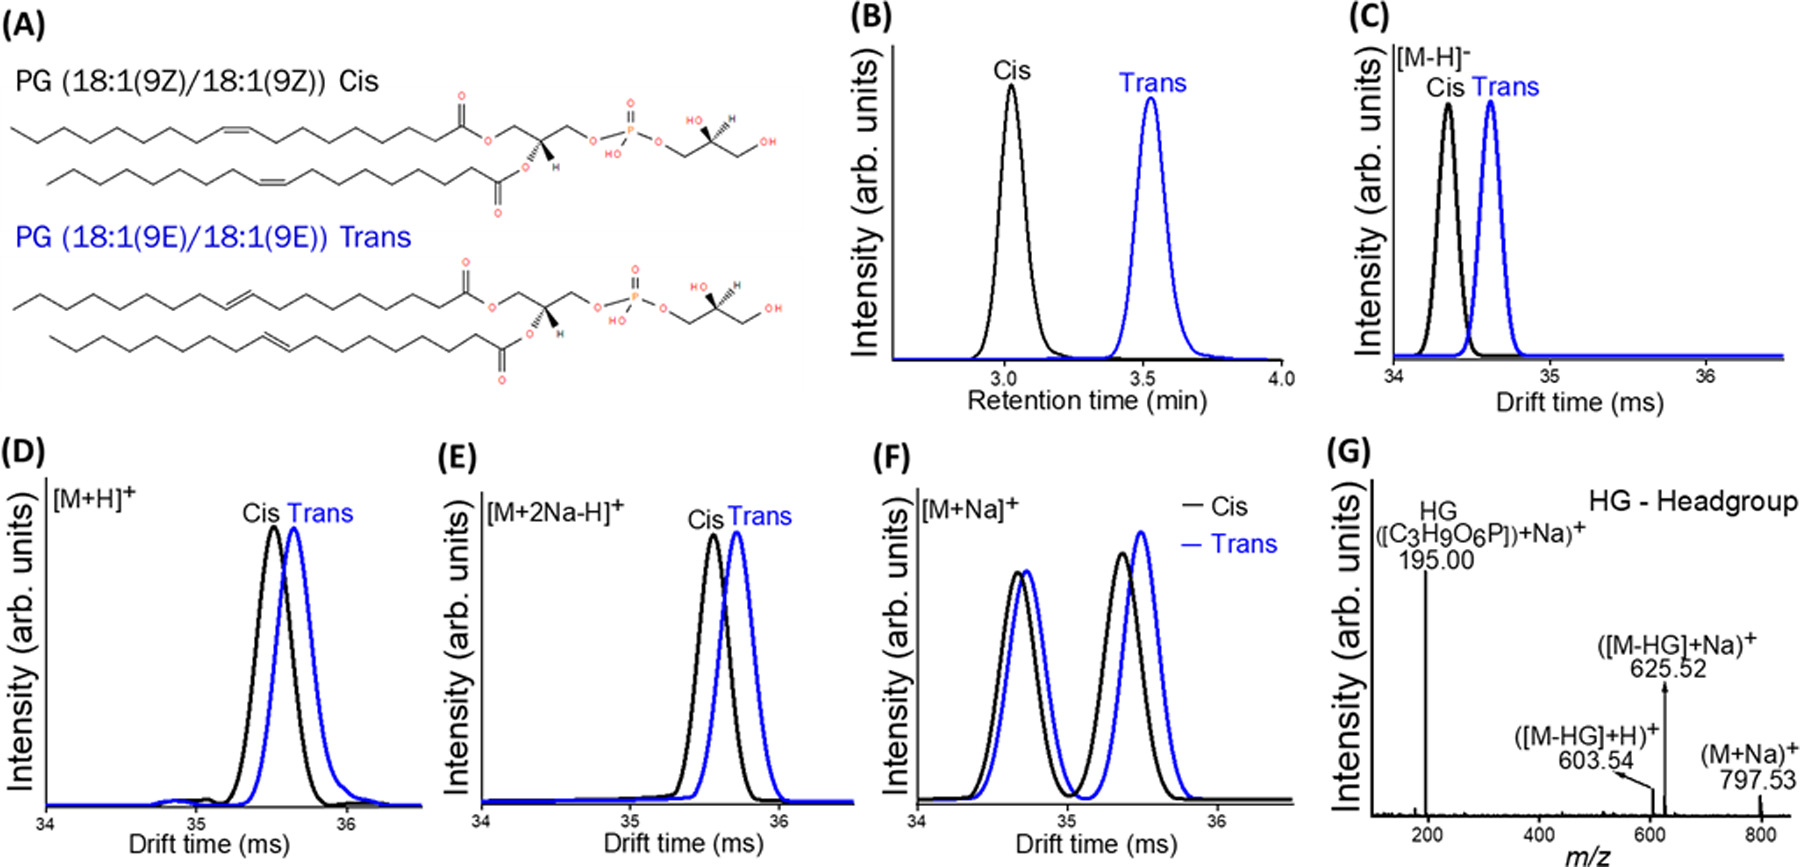
(A) Structure of PG (36:2) cis and trans geometric isomers. Separation of a mixture of PG (36:2) cis and trans isomers with (B) LC separation and Ion mobility using (C) [M−H]− (D) [M+H]+ (E) [M+2Na−H]+ (F) [M+Na]+ ions. (G) Tandem MS spectrum of PG 36:2 cis and trans [M+Na]+ adducts.
IM, a post-ionization separation technique, in contrast to LC, a pre-ionization separation technique, provides the ability to use ionization adducts to influence separation to different degrees. The cis/trans isomers were observed predominantly in the negative ion mode as the deprotonated species, [M−H]−. The two isomers were nearly baseline resolved. They showed a drift time difference (which reflects the degree of separation) of 0.72%, as observed in Figure 1C. The double bonds with cis orientation curved the backbone more than those with trans orientation, resulting in a difference in the corresponding size and shape leading to an effective IM separation of the two geometric isomers. In the positive ion mode, the predominantly observed ions include [M+H]+, [M+Na]+, and [M+2Na−H]+. Cationization with alkali metals such as sodium and potassium has been reported to improve the separation of isomeric compounds.42–43 As illustrated by the arrival time distributions (ATDs) presented in Figures 1D and E, the drift time differences between the two geometric isomers were 0.36% and 0.42% for their [M+H]+ and [M+2Na−H]+ adducts, respectively. The effect of metal adduction is more pronounced in the [M+Na]+ adducts of the geometric isomers as two new conformations of the cis and trans isomers were revealed and baseline separated. The drift time difference between the two new conformers of the cis isomer is 2.0% (figure 1F, black trace). Similar observations were made with the trans isomer, as shown in the extracted ion mobilogram (EIM) (Figure 1F, blue trace). These observations suggest that the sodium adduct interacts with the fatty acid moieties of the geometric isomers,43 and consequently leads to a more pronounced change in lipid ion structure, resulting in each isomer adopting two new conformations that are more easily distinguished by their drift times. As shown in Table S7, the experimental CCS values of the two conformations of the [cis + Na]+ are Ω1 = 279.8 ± 0.5 Å2 and Ω2 = 284.5 ± 0.6 Å2 and the [trans + Na]+ are Ω1 = 280.3 ± 0.4 Å2 and Ω2 = 285.5 ± 0.5 Å2. We performed MD simulations to assign theoretical structures to the experimental CCS values of the cis and trans conformers (Supporting Information). As shown in Figure 1, two new conformers of cis and trans isomers revealed by IM separation were inseparable with LC and undistinguishable with tandem MS (Figure 1G). These results demonstrate the advantage of using complementary separation methods for the complete characterization and separation of lipid isomers and conformers.
Multidimensional characterization and separation of lipid isomers in E. coli lipid extract.
The lipidome of bacteria exhibits an abundance of lipid isomers that serve as biomarkers for accurate disease diagnosis. Due to the structural complexity associated with lipid isomers, we used a complementary LC- IM-all ions fragmentation method to provide multidimensional separation to resolve various lipid isomers in E. coli extracts. The LC separation shown in Figure 2A indicates that the major lipid species in E. coli membranes are phosphatidylethanolamines (PEs, rt: 3.5 – 6.5 min), followed by phosphatidylglycerols (PGs, rt: 2 – 4 min) and cardiolipins (CLs, rt: 2–4 min, Figure S3). We structurally annotate the lipids using MS/MS in silico spectra matching with further manual identification using fragmentation mechanisms of glycerophospholipids (PEs, PGs, CLs) described in detail in previous studies.15, 44 For instance, the CID spectrum of m/z 730.54 shown in Figure 2B revealed characteristics of fragment ions at m/z 255.23, 269.24, 281.25, and 295.26, corresponding to the carboxylate anions of C16:0, C17:0, C18:1, and Ccy19:0 respectively.15 The characteristic ion at m/z 140.01 is [C2H7O4NP]−, which is a head group, confirmed the identity of the lipid as PE. Therefore, we confidently annotated the lipid ion m/z 730.54 as PE (16:0/cy19:0) and PE (17:0/18:1). Moreover, tandem mass spectrometry measurement was used to accurately annotate the isomers of PGs and CLs, while their sum composition was reported in the LC chromatogram. To confidently improve the identification of the lipid isomers in the E. coli extract, we utilized single-field measurements to estimate the CCS of the lipid isomers. The CCS of five ions of the lipid isomers were experimentally estimated, which include [M−H]− for negative ionization and [M+H]+, [M+Na]+, [M+NH4]+, and [M+2Na−H]+ for positive ionization (Table S8). For instance, the CCS values of [M−H]−, [M+H]+, [M+Na]+, and [M+NH4]+ of PE (17:0/18:1) are 269.1, 278.8, 282.5, and 281.2 Å2, respectively, which differ less than 0.6% from the theoretical CCS values, 267.6, 279.2, 280.8, and 280.5 Å2 respectively (Table S8). Not only do the CCS values support the annotation of the lipid structures, but they also effectively remove potential false identifications from m/z, retention time, and MS/MS matches. Using the four-dimensional data of retention time (LC), CCS (IM), m/z, and MS/MS, 34 acyl chain lipid isomers containing 18 PEs, 13 PGs, and 3 CLs were identified confidently in the E. coli lipid extract.
Figure 2.

(A) RPLC separation of lipids in E. coli polar lipid extract (B) Tandem MS spectrum of [PE 35:1−H]− showing 2 lipid isomers: PE (16:0/cy19:0) and PE (17:0/18:1) (C) IM separation of PE (32:0), PE (34:1), and PE (36:2) (D) Tandem MS spectrum of [PG 32:1−H]− showing 2 lipid isomers: PG (16:0/16:1) and PG (14:0/18:1). Drift spectra of (E) of PG (32:1) ([M−H]− top panel) and ([M+H]− bottom panel) (F) [M+Na]+ of PG (32:1). (G) Tandem MS spectrum of PG (32:1) cis and trans [M+Na]+ adducts.
After comprehensive characterization of the lipid isomers, we used the orthogonal separation from the complementary LC-IM-MS/MS method to resolve co-eluting lipid isomers and conformers in the E. coli extract. PE (32:0), PE (34:1), and PE (36:2) differ respectively by one ethylene unit co-eluted in the LC dimension (rt: ~5.2 min, Figure 2A). Increasing double bonds has been shown in previous studies to increase lipid polarity and consequently decrease their retention times, whereas increasing side chain length increases lipid hydrophobicity and therefore increases their retention times.15 From PE (32:0) to PE (34:1), there is an increase in both double bond and side chain length. Hence, the increasing lipid polarity (decreasing rt) nullifies the increasing lipid hydrophobicity (increasing rt), resulting in the co-elution of these LC peaks. However, the IM dimension was very effective, providing a baseline separation of the three LC co-eluted peaks (Figure 2C). The lipid species PE (32:0), PE (34:1), and PE (36:2) differ respectively by one ethylene unit, which corresponds to a drift time difference of 2.0%. Consequently, they are baseline-resolved since IM separation depends on structure and size in contrast to LC which depends on polarity. We further demonstrate the integrated method, LC-IM-MS/MS, to provide complementary and multidimensional separation of acyl chain lipid isomers and conformers in E. coli extract. The [M−H]− adduct of PG (32:1) (m/z 719.49) was annotated as PG (14:0/18:1) and PG (16:0/16:1) using tandem MS (Figure 2D). The characteristic fragment ions at m/z 227.20 and 281.25 correspond to the carboxylate anions of C14:0 (sn-1) and C18:1 (sn-2), while m/z 255.23 and 253.22 correspond to the carboxylate anions of C16:0 (sn-1) and C16:1 (sn-2). However, the two PG acyl chain isomers were unresolved in the LC dimension (rt: 2.0 min, Figure 2A) and IM dimension (drift time: 32.96 ms, negative ion mode, Figure 2E, top panel). In the positive ionization mode, the [M+H]+ adduct of the PG (32:1) (m/z 721.51) shows a single IM peak indicating that the two PG acyl chain isomers are unresolved (Figure 2E, bottom panel). However, the [M+Na]+ spectrum shows two major IM peaks which were suggested to present two isomers or conformers of the acyl chain isomers due to the interaction of the sodium adduct with the fatty acyl moieties (Figure 2F). We could not distinguish the two conformations using tandem mass spectrometry as their MS/MS show similar fragmentation patterns (Figure 2G). The predominant product ions observed from the tandem MS spectrum at m/z 549.48 and 195.00 correspond to the protonated diglyceride-like ion and sodiated polar head group ion, respectively. The ion at m/z 571.79 corresponds to a sodium ion attached to the diglyceride-like ion. This result demonstrates the advantage of complementary separation techniques in an integrated fashion to resolve and characterize lipid isomers as diagnostic biomarkers for bacterial diseases.
Differentiation of E. coli strains by LC–IM–MS/MS.
The close biological relationship between the E. coli strains is strongly reflected in their lipidomic profiles, showing high similarity in their mass spectral profiles, as observed in Figures S4 and S5. This challenge highlights the need for a highly selective method, in this case, LC–IM–MS/MS for accurate discrimination of the strains. We utilized seven E. coli strains, including BL21, C41, CSH23, DH10B, DH5α, K12, and S17–1 λpir, to demonstrate the high discriminatory power of this integrated technique. In the negative ionization mode, the predominant ionic species observed was the deprotonated [M−H]− species. The most abundant [M−H]− ions observed across the seven E. coli strains are m/z 674.48, 688.49, 702.51, 716.53, 728.53, 730.54, 733.51, and 742.54 assigned to be [PE (31:1)−H]−, [PE (32:1)−H]−, [PE (33:1)−H]−, [PE (34:1)−H]−, [PE (35:2)−H]−, [PE (35:1)−H]−, [PG (33:1)−H]−, and [PE (36:2)−H]−, respectively (Figure S4). The annotation of these lipids was confirmed by CCS measurements, isotopic abundances, and exact mass measurements. For instance, using single-field measurements, the experimental CCS values of m/z 716.53 [PE (34:1)−H]− is 265.6 Å2 which differs by 0.23% from the Lipid CCS predictor value, 265.0 Å2 (Table S8). Careful examination of the drift time spectra of the E. coli strains reveals a single IM peak for PE (34:1) across all seven E. coli strains. However, LC separation revealed different isomeric forms of PE (34:1), as shown in Figure 3A. The number of resolved LC peaks observed for PE (34:1) across the seven strains was 1 for E. coli BL21 and C41 and 2 for E. coli CSH23, DH10B, DH5α, K12, and S17–1 λpir. Using tandem mass spectrometry, we were able to confirm the isomer types in these LC peaks based on fragmentation patterns. By examining the tandem MS analysis of E. coli BL21 and C41 (Figure 3B, top panel), the CID spectrum of the LC peak at a retention time of 5.9 min (m/z 716.53, PE (34:1)) shows abundant product ions at m/z 255.23 and 281.25 corresponding to C16:0 and C18:1, respectively. These fragment ions indicate the presence of PE (16:0/18:1). In E. coli CSH23, DH10B, DH5α, K12, and S17–1 λpir, the CID spectra of the LC peak at retention time 6.3 min (m/z 716.53, PE 34:1) (Figure 3B, bottom panel) reveals characteristic fragment ions at m/z 241.22, 267.23, 269.25, and 295.27 corresponding to carboxylate anions of C15:0, C17:1, C17:0, and C19:1, respectively. These product ions confirm the presence of PE (15:0/19:1) and PE (17:0/17:1). In addition, the presence of abundant product ions at m/z 255.23 and 281.25 corresponding to C16:0 and C18:1, respectively indicate the presence of PE (16:0/18:1). These results indicate that PE (16:0/18:1) was present in all the E. coli strains, while PE (15:0/19:1) and PE (17:0/17:1) were unique to E. coli CSH23, DH10B, DH5α, K12, and S17–1 λpir. Another example of discriminating lipid isomers between the E. coli strains is m/z 688.49 (PE (32:1)), which was present as PE (16:0/16:1) and PE (14:0/18:1) in all the seven E. coli strains, and PE (15:0/17:1) in five of the strains, as shown in Figure S6.
Figure 3.

LC-IM-MS/MS spectra obtained in the negative ion mode of the seven E. coli strains where (A) liquid chromatography and ion mobility spectra revealed the presence of various lipid isomers of m/z 716.53 (PE (34:1)) and (B) Tandem mass spectra of m/z 716.53 which support the identification of the lipid isomers by the LC and IM spectra. The spectra associated with the analysis of E. coli BL21 and C41 are presented in the top panels while those associated with the analysis of E. coli CSH23, DH10B, DH5α, K12, and S17–1 λpir are presented in the bottom panels.
The positive ionization MS spectra of the seven E. coli strains also show high spectral similarity like the negative ionization mode as observed in Figure S5. Four positive ionization adducts [M+H]+, [M+Na]+, [M+NH4]+, and [M+2Na−H]+ were detected across the spectra, however, the most predominant ion was the protonated [M+H]+ adducts. As shown in Figure S5, the m/z at 676.49, 690.50, 692.52, 704.52, 716.52, 718.53, 730.53, 732.54, 744.55, and 758.56 were characterized as [PE (31:1)+H]+, [PE (32:1)+H]+, [PE (32:0)+H]+, [PE (33:1)+H]+, [PE (34:2)+H]+, [PE (34:1)+H]+, [PE (35:2)+H]+, [PE (35:1)+H]+, [PE (36:2)+H]+, and [PE (37:2)+H]+, respectively. The identification of these lipid ions was confirmed by CID, isotopic abundances, and exact mass measurements. For example, the product ion spectrum of m/z 716.51 [PE (34:2)+H]+ (Figure 4B) shows a base peak of m/z 575.51 [M+H-141]+ corresponding to the neutral loss of the polar head group (C2H8O4NP), confirming the identity of the lipid as PE. The fragment ions at m/z 237.22 and 265.25 correspond to C16:1 and C18:1, which are sn-1 and sn-2 fatty acids (FAs), respectively, of [PE (34:2)+H]+, identifying the lipid as PE (16:1/18:1). The successive neutral loss of sn-1 (m/z 236) and sn-2 (m/z 264) FAs from the base peak ion (m/z 575.50) leads to the fragment ions at m/z 338.28 (M+H-141-sn-1)+ and 311.26 (M+H-141-sn-2)+, respectively, which further support the identification of the lipid as PE (16:1/18:1). This indicates that [PE (34:2)+H]+ is present in all seven E. coli strains as PE (16:1/18:1). Careful examination of the extracted ion chromatogram (EIC) of PE (16:1/18:1) showed a single LC peak at a retention time of 4.6 min in all seven E. coli strains (Figure 4A). However, the EIM revealed different conformers of PE (16:1/18:1), as shown in the drift spectra of the seven E. coli strains (Figure 4A). This implies that neither LC nor tandem MS can distinguish the lipid conformers revealed by IM since PE (16:1/18:1) has a single LC peak and the same fragmentation pattern in all seven E. coli strains (Figure S7). Using single-field CCS measurement, we measured the IM protonated peaks of PE (16:1/18:1) at 33.17, 33.57, and 33.82 ms, as shown in Figure 4A, yielding CCS values of 271.1, 273.9, and 275.6 Å2, respectively. Remarkably, these experimental CCS values showed good agreement (less than 1% difference) with the theoretical values obtained by the Lipid CCS predictor (273.2 Å2). Of the three conformers of PE (16:1/18:1) detected, two conformers (conformers 1 and 2 (IM peaks at 33.17 and 33.57 ms) are present in all seven E. coli strains, while the conformer with the IM peak at 33.83 ms (conformer 3) is present in only three of the E. coli strains (DH10B, K12, and S17–1 λpir). PE (18:1/18:1) like PE (16:1/18:1), has a single LC peak and the same product ion spectrum in all the E. coli strains, as shown in Figure S8, but exist as three different conformers in BL21, C41, and DH10B strains. This shows that lipid conformers revealed by IM analysis can be used to distinguish the E. coli strains. Moreover, these results demonstrate that multidimensional techniques such as LC-IM-MS/MS provide high selectivity and discriminatory power for accurate discrimination of bacteria strains.
Figure 4.

LC-IM-MS/MS spectra obtained in the positive ion mode of the seven E. coli strains where (A) liquid chromatography and ion mobility revealed the presence of various lipid conformers of m/z 716.51 (PE (34:2). The spectra associated with the analysis of E. coli BL21, C41, CSH23, and DH5α are presented in the top panel while those associated with the analysis of E. coli DH10B, K12, and S17–1 λpir are presented in the bottom panel. (B) Tandem mass spectra of m/z 716.50 [PE (34:2)+H]+.
Discrimination of E. coli strains by paper spray–IM–MS/MS.
Although the LC-IM-MS/MS could accurately distinguish the seven E. coli strains, this method is labor-intensive and time-consuming, primarily because of the extensive sample preparation and long LC acquisition times. Therefore, alternative techniques with minimal sample preparation and rapid analysis are needed as early detection of bacteria allows quick clinical intervention. For this purpose, we used paper spray (PS)-IM-MS/MS, in which the bacterial culture was filtered through a glass filter paper, and after applying spray voltage and solvent, the IM and tandem MS spectra of the seven E. coli strains were recorded in both ionization modes.21 In the negative ionization mode, the deprotonated [M−H]− adduct of lipid isomers in the seven E. coli strains was characterized by CCS and exact mass measurements. For instance, m/z 733.51 in Figure S9 was characterized as PG (33:1) because the experimental CCS value, 268.1 Å2, shows good agreement (less than 2% difference) with the theoretical CCS value, 265.6 Å2 (Table S8). Interestingly, careful examination of the EIM of the [PG (33:1)−H]− across the seven E. coli strains revealed a single IM peak at the drift time of 35.04 ms (Figure S9A). However, its CID spectrum showed several characteristic fragment ions that can serve as diagnostics biomarkers for distinguishing the seven E. coli strains (Figure S9B). The fragment ions at m/z 255.23 and 267.23 in the CID spectrum of [PG (33:1)−H]− in E. coli BL21, C41, DH10B, and DH5α correspond to C16:0 and C17:1, respectively. The additional product ions at m/z 241.22, 253.22, 269.24, and 281.25 in E. coli CSH23, K12, and S17–1 λpir correspond to C15:0, C16:1, C17:0, and C18:1, respectively. This result indicates that PG (16:0/17:1) is present in all seven E. coli strains, while PG (15:0/18:1) and PG (16:1/17:0) are present only in three of the E. coli strains (CSH23, K12, and S17–1 λpir).
In the positive ionization mode, IM effectively separates diagnostic lipid conformers indistinguishable in tandem mass spectrometry. For example, m/z 726.51, characterized as [PE(33:1)+Na]+, has multiple IM peaks in the drift spectra of the seven E. coli strains (Figure S10A). Meanwhile, its CID spectrum is similar in all seven E. coli strains (Figure S10B). The product ion scan of m/z 726.51 [PE(33:1)+Na]+ in the E. coli strains shows a characteristic ion at m/z 164.00 ([C2H8O4NP]+Na)+ corresponding to the polar head group, ethanolamine, confirming the identity of the lipid as PE. The neutral loss of the polar head group leads to the fragment ions at m/z 563.50 [M+H-141]+ and 585.49 [M+Na-141]+ corresponding to a proton and sodium attached to the diglyceride-like ion. The product ions at m/z 239.24 and 251.25 correspond to C16:0 and C17:1, which represent the sn-1 and sn-2 FAs of the [PE(33:1)+Na]+, respectively, and accurately characterize the lipid as PE (16:0/17:1). However, the IM dimension revealed different conformers of [PE(33:1)+Na]+, which can serve as fingerprints to distinguish the seven E. coli strains. The two conformers of [PE(33:1)+Na]+ at drift time of 34.61 and 35.13 ms (conformers 1 and 2), as shown in Figure S10A, have CCS values of 273.0 and 275.8 Å2, respectively, showing good agreement (less than 1% difference) with the theoretical CCS value of 274.1 Å2. Of the two conformers of PE (16:0/17:1) detected, the IM peak at 35.13 ms (conformer 1) is present in all seven E. coli strains, whereas the conformer at the IM peak of 34.61 ms (conformer 2) is present in only two of the E. coli strains (K12 and S17–1 λpir). The complementary separation of IM and tandem MS was effectively used to reveal lipid isomers and conformers that serve as diagnostic biomarkers to distinguish E. coli strains, while the paper spray was used to rapidly analyze each bacteria strain in less than 2 minutes. These findings demonstrate PS-IM-MS/MS can act as an effective analytical technique to provide rapid detection and accurate discrimination of bacteria strains.
Multivariate statistics.
Integration of two orthogonal separation methods (LC and IM) with tandem mass analysis, as demonstrated in our bacterial strain discrimination, allowed multidimensional complementary separation, and increased peak capacity. Isomeric lipid biomarkers discriminating E. coli strains were resolved in at least one separation dimension. Therefore, using multivariate statistical analysis, spectral information from LC, IM, and MS/MS was used to reveal biochemical differences and group E. coli strains based on their corresponding spectral fingerprints. The high selectivity of LC-IM-MS/MS is reflected in the PCA score plots, which show a clear separation between the seven E. coli strains in negative and positive ion modes (Figures 5A and B, respectively). Quantification of separation using LDA resulted in 96.1% and 100% prediction rates in the negative and positive ion modes, respectively, as shown in the CV confusion matrix (Table S5), which shows a high classification rate of the strains. These rates show that the multidimensional LC-IM-MS/MS is very effective in discriminating closely related bacteria strains. As depicted in Figures 5A–B, two and three clusters were observed along the PC1 axis of the negative and PC3 axis of the positive ion data, respectively. One of the clusters in both modes contains DH10B, DH5α, K12, and S17–1 λpir indicating biochemical similarity between these strains. In the positive ion data, as shown in Figure 5B, BL21 and C41 appeared separated by the cluster group (DH10B, DH5α, K12, and S17–1 λpir), suggesting that they share several lipid conformation biomarkers with the other strains.
Figure 5.

PCA plots of the seven E. coli strains in the (A) negative and (B) positive ion modes of the LC-IM-MS/MS method. (C) Data fusion of the extracted PCs of the negative and positive ion modes of the PS-IM-MS/MS. The E. coli strains are indicated by color and shape as follows: BL21 (Black circles), C41(Red triangles pointing up), CSH23 (Blue triangles pointing down), DH10B (Green diamonds), DH5α (Magenta squares), K12 (Orange stars), and S17–1 λpir (Wine hexagons).
To theoretically investigate the genomic relatedness of the E. coli strains, we used genome assemblies of the strains for comparative genome analysis. The genome assemblies of six strains (BL21, C41, DH10B, DH5α, K-12, and S17–1 λpir) available in the NCBI reference sequence database45 were downloaded and compared for genetic variability by counting the single nucleotide polymorphisms (SNPs) between the strains using the CSIPhylogeny webtool.46 SNP calling was performed with default settings, using the E. coli K12 strain as a reference. The results show the highest variation between strains K12 and C41, followed by strains K12 and BL21 based on the SNP count between strains (Table S9). Interestingly, the variation in SNP counts between strains DH10B, DH5α, K12, and S17–1 λpir, is lower, indicating the high genetic similarity of these four E. coli strains. Comparative genomic analysis shows good agreement with our experimental findings, as DH10B, DH5α, K12, and S17–1 λpir clustered in the PCA score plot in both ion modes (Figures 5A and B), and with less variation in SNP number. However, the proximity of these four strains to each other differs in the negative and positive ion modes. BL21 and C41 appear to have high SNP counts based on comparative genomic analysis. The bulk of our experimental analysis is supported by comparative genome analysis. Therefore, our results show that multidimensional LC-IM-MS/MS is a highly selective and sensitive discrimination technique for bacterial strains.
The PS-IM-MS/MS rapidly discriminates the seven E. coli strains with a prediction rate of 62.5% and 73.5% in the negative and positive ion modes, respectively, as quantified by LDA. The negative ion mode PCA score plot shows a clear separation between BL21, C41, and K12 highlighting the high genomic disparities between these strains (Figure S11A). CSH23, DH10B, DH5α, and S17–1 λpir appear unseparated in the negative PCA score plot, however, the positive mode PCA plot showed improved separation of these four strains along the PC3 axis (Figure S11B). The separation along the PC1 axis of the positive mode of the PS-IM-MS/MS indicates that DH10B, DH5α K12, and S17–1 λpir, are highly genetically similar to one another in comparison to BL21 and C41 as confirmed by the LC-IM-MS/MS PCA score plots and the comparative genome analysis. The low predictive ability of the PS-IM-MS/MS in comparison to LC-IM-MS/MS can be attributed to the ionization suppression from matrix effects,47 and the absence of chromatographic separation. Previous studies have demonstrated that fusing the chemical information present in the negative ion mode with that of the positive ion mode can increase classification rates.12 The fusion of the extracted PCs from the negative and positive ion data increased the separation among the seven E. coli strains, as visible in the PC1 versus PC4 score plot (Figure 5C). Indeed, the prediction rates significantly increased to 80.5% as quantified through LDA. These results demonstrate PS-IM-MS/MS as a rapid, highly selective, and sensitive discrimination technique for bacterial strains.
CONCLUSION
This work demonstrates successful strain-level discrimination of bacteria using LC-IM-MS/MS and PS-IM-MS/MS. The complementary separations from the multidimensional LC-IM-MS/MS were used to reveal acyl chain lipid isomers and conformers in lipid standards, E. coli lipid extract, and strains. Prediction rates of 96.1% and 100% were achieved with LC-IM-MS/MS in negative and positive ion modes, respectively, highlighting the high accuracy and selectivity of the LC-IM-MS/MS method. Tandem MS and LC separation proved effective in discriminating lipid isomers in the negative ionization mode, while IM separation was more effective in resolving lipid conformational biomarkers in the positive ionization mode. Due to the clinical importance of early detection for rapid medical intervention, a faster technique, PS-IM-MS/MS, was used to discriminate E. coli strains with a prediction rate of 80.5% after the fusion of the negative and positive ion data. Lipid isomers and conformers were detected, which served as strain-indicating biomarkers.
Our results represent a proof of concept for PS-IM-MS/MS to rapidly identify and accurately distinguish clinically relevant strains based on isomeric lipid biomarkers. Finally, in situ analysis of bacteria without culturing will be pursued for the direct analysis of microorganisms due to environmental protection, food safety, and clinical studies. Future investigations should focus on methods to overcome matrix effects associated with environmental and food samples, with good improvement in sensitivity and minimal impact on analysis time. In addition, using IM platforms with higher resolution, such as structures for lossless ion manipulations (SLIM, separation power ~ 1860), will allow the identification of more biomarkers, which in turn will lead to the discrimination of wide sets of microorganisms.48
Supplementary Material
ACKNOWLEDGMENTS
Financial support for this work was provided by funds provided by Auburn University and the NIH grant 1R35GM147225. The authors thank Dr. Steven Mansoorabadi (Department of Chemistry and Biochemistry, Auburn University) and Dr. Mark Liles (Department of Biological Sciences, Auburn University) for providing them with the needed microorganisms to perform their studies.
Footnotes
ASSOCIATED CONTENT
Supporting Information
Complete data matrices, additional IM, MS, and MS/MS spectra, confusion matrices, principal component analysis plots, and experimental settings.
The authors declare no competing financial interest.
REFERENCES
- 1.Denamur E; Condamine B; Esposito-Farèse M; Royer G; Clermont O; Laouenan C; Lefort A; de Lastours V; Galardini M; the C; groups S, Genome wide association study of Escherichia coli bloodstream infection isolates identifies genetic determinants for the portal of entry but not fatal outcome. PLOS Genetics 2022, 18 (3), e1010112. [DOI] [PMC free article] [PubMed] [Google Scholar]
- 2.Mackinnon MC; McEwen SA; Pearl DL; Lyytikäinen O; Jacobsson G; Collignon P; Gregson DB; Valiquette L; Laupland KB, Increasing incidence and antimicrobial resistance in Escherichia coli bloodstream infections: a multinational population-based cohort study. Antimicrobial Resistance & Infection Control 2021, 10, 1 – 10. [DOI] [PMC free article] [PubMed] [Google Scholar]
- 3.(CDC) National Shiga toxin-producing Escherichia coli (STEC) surveillance overview Atlanta, Georgia: US Department of Health and Human Services, CDC. (accessed February 20th, 2023). [Google Scholar]
- 4.NCDHHS Escherichia coli (E. coli) Infections https://epi.dph.ncdhhs.gov/cd/diseases/ecoli.html (accessed February 9th, 2023).
- 5.Kaper JB; Nataro JP; Mobley HL, Pathogenic escherichia coli. Nature reviews microbiology 2004, 2 (2), 123–140. [DOI] [PubMed] [Google Scholar]
- 6.AlMasoud N; Muhamadali H; Chisanga M; AlRabiah H; Lima CA; Goodacre R, Discrimination of bacteria using whole organism fingerprinting: the utility of modern physicochemical techniques for bacterial typing. Analyst 2021, 146 (3), 770–788. [DOI] [PubMed] [Google Scholar]
- 7.Everley RA; Mott TM; Wyatt SA; Toney DM; Croley TR, Liquid Chromatography/Mass Spectrometry Characterization of Escherichia coli and Shigella Species. Journal of the American Society for Mass Spectrometry 2008, 19 (11), 1621–1628. [DOI] [PubMed] [Google Scholar]
- 8.Yeung EYH; Gorn I, Use of Pulsed-Field Gel Electrophoresis to Determine the Source of Methicillin-Resistant Staphylococcus aureus Bacteremia. Infect Dis Rep 2021, 13 (3), 602–610. [DOI] [PMC free article] [PubMed] [Google Scholar]
- 9.Fagerquist CK; Garbus BR; Miller WG; Williams KE; Yee E; Bates AH; Boyle S; Harden LA; Cooley MB; Mandrell RE, Rapid Identification of Protein Biomarkers of Escherichia coli O157:H7 by Matrix-Assisted Laser Desorption Ionization-Time-of-Flight-Time-of-Flight Mass Spectrometry and Top-Down Proteomics. Analytical Chemistry 2010, 82 (7), 2717–2725. [DOI] [PubMed] [Google Scholar]
- 10.Singhal N; Kumar M; Kanaujia PK; Virdi JS, MALDI-TOF mass spectrometry: an emerging technology for microbial identification and diagnosis. Frontiers in Microbiology 2015, 6, 791. [DOI] [PMC free article] [PubMed] [Google Scholar]
- 11.Berendsen EM; Levin E; Braakman R; van der Riet-van Oeveren D; Sedee NJA; Paauw A, Identification of microorganisms grown in blood culture flasks using liquid chromatography-tandem mass spectrometry. Future Microbiol 2017, 12 (13), 1135–1145. [DOI] [PubMed] [Google Scholar]
- 12.Hamid AM; Jarmusch AK; Pirro V; Pincus DH; Clay BG; Gervasi G; Cooks RG, Rapid discrimination of bacteria by paper spray mass spectrometry. Analytical chemistry 2014, 86 (15), 7500–7507. [DOI] [PubMed] [Google Scholar]
- 13.Camara JE; Hays FA, Discrimination between wild-type and ampicillin-resistant Escherichia coli by matrix-assisted laser desorption/ionization time-of-flight mass spectrometry. Analytical and Bioanalytical Chemistry 2007, 389 (5), 1633–1638. [DOI] [PubMed] [Google Scholar]
- 14.Jackson SN; Ugarov M; Egan T; Post JD; Langlais D; Albert Schultz J; Woods AS, MALDI‐ion mobility‐TOFMS imaging of lipids in rat brain tissue. Journal of Mass Spectrometry 2007, 42 (8), 1093–1098. [DOI] [PMC free article] [PubMed] [Google Scholar]
- 15.Oursel D; Loutelier-Bourhis C; Orange N; Chevalier S; Norris V; Lange CM, Lipid composition of membranes of Escherichia coli by liquid chromatography/tandem mass spectrometry using negative electrospray ionization. Rapid Communications in Mass Spectrometry 2007, 21 (11), 1721–1728. [DOI] [PubMed] [Google Scholar]
- 16.Williams TL; Monday SR; Edelson-Mammel S; Buchanan R; Musser SM, A top-down proteomics approach for differentiating thermal resistant strains of Enterobacter sakazakii. PROTEOMICS 2005, 5 (16), 4161–4169. [DOI] [PubMed] [Google Scholar]
- 17.Williams TL; Monday SR; Feng PC; Musser SM, Identifying new PCR targets for pathogenic bacteria using top-down LC/MS protein discovery. J Biomol Tech 2005, 16 (2), 134–42. [PMC free article] [PubMed] [Google Scholar]
- 18.Williams TL; Musser SM; Nordstrom JL; DePaola A; Monday SR, Identification of a protein biomarker unique to the pandemic O3 : K6 clone of Vibrio parahaemolyticus. Journal of Clinical Microbiology 2004, 42 (4), 1657–1665. [DOI] [PMC free article] [PubMed] [Google Scholar]
- 19.Almasoud N; Xu Y; Trivedi DK; Salivo S; Abban T; Rattray NJW; Szula E; Alrabiah H; Sayqal A; Goodacre R, Classification of Bacillus and Brevibacillus species using rapid analysis of lipids by mass spectrometry. Analytical and Bioanalytical Chemistry 2016, 408 (27), 7865–7878. [DOI] [PMC free article] [PubMed] [Google Scholar]
- 20.Cao W; Cheng S; Yang J; Feng J; Zhang W; Li Z; Chen Q; Xia Y; Ouyang Z; Ma X, Large-scale lipid analysis with C=C location and sn-position isomer resolving power. Nature Communications 2020, 11 (1), 375. [DOI] [PMC free article] [PubMed] [Google Scholar]
- 21.Olajide OE; Yi Y; Zheng J; Hamid AM, Species-level discrimination of microorganisms by high-resolution paper spray–Ion mobility–Mass spectrometry. International Journal of Mass Spectrometry 2022, 116871.
- 22.Borsdorf H; Mayer T; Zarejousheghani M; Eiceman GA, Recent Developments in Ion Mobility Spectrometry. Applied Spectroscopy Reviews 2011, 46 (6), 472–521. [Google Scholar]
- 23.Paglia G; Angel P; Williams JP; Richardson K; Olivos HJ; Thompson JW; Menikarachchi L; Lai S; Walsh C; Moseley A; Plumb RS; Grant DF; Palsson BO; Langridge J; Geromanos S; Astarita G, Ion Mobility-Derived Collision Cross Section As an Additional Measure for Lipid Fingerprinting and Identification. Analytical Chemistry 2015, 87 (2), 1137–1144. [DOI] [PMC free article] [PubMed] [Google Scholar]
- 24.Steppert I; Schönfelder J; Schultz C; Kuhlmeier D, Rapid in vitro differentiation of bacteria by ion mobility spectrometry. Applied Microbiology and Biotechnology 2021, 105 (10), 4297–4307. [DOI] [PMC free article] [PubMed] [Google Scholar]
- 25.Dodds JN; Baker ES, Ion Mobility Spectrometry: Fundamental Concepts, Instrumentation, Applications, and the Road Ahead. Journal of the American Society for Mass Spectrometry 2019, 30 (11), 2185–2195. [DOI] [PMC free article] [PubMed] [Google Scholar]
- 26.Alvarez AM, Integrated approaches for detection of plant pathogenic bacteria and diagnosis of bacterial diseases. Annu. Rev. Phytopathol 2004, 42, 339–366. [DOI] [PubMed] [Google Scholar]
- 27.Hines KM; Xu L, Lipidomic consequences of phospholipid synthesis defects in Escherichia coli revealed by HILIC-ion mobility-mass spectrometry. Chemistry and physics of lipids 2019, 219, 15–22. [DOI] [PMC free article] [PubMed] [Google Scholar]
- 28.Tsugawa H; Ikeda K; Takahashi M; Satoh A; Mori Y; Uchino H; Okahashi N; Yamada Y; Tada I; Bonini P; Higashi Y; Okazaki Y; Zhou Z; Zhu Z-J; Koelmel J; Cajka T; Fiehn O; Saito K; Arita M; Arita M, MS-DIAL 4: accelerating lipidomics using an MS/MS, CCS, and retention time atlas Cold Spring Harbor Laboratory: 2020. [Google Scholar]
- 29.Song YS; Talaty N; Tao WA; Pan ZZ; Cooks RG, Rapid ambient mass spectrometric profiling of intact, untreated bacteria using desorption electrospray ionization. Chemical Communications 2007, (1), 61–63. [DOI] [PubMed] [Google Scholar]
- 30.Strittmatter N; Jones EA; Veselkov KA; Rebec M; Bundy JG; Takats Z, Analysis of intact bacteria using rapid evaporative ionisation mass spectrometry. Chemical Communications 2013, 49 (55), 6188–6190. [DOI] [PubMed] [Google Scholar]
- 31.Kerian KS; Jarmusch AK; Cooks RG, Touch spray mass spectrometry for in situ analysis of complex samples. Analyst 2014, 139 (11), 2714–2720. [DOI] [PMC free article] [PubMed] [Google Scholar]
- 32.Hamid AM; Wei P; Jarmusch AK; Pirro V; Cooks RG, Discrimination of Candida species by paper spray mass spectrometry. International Journal of Mass Spectrometry 2015, 378, 288–293. [Google Scholar]
- 33.Zhou ZW; Tu J; Xiong X; Shen XT; Zhu ZJ, LipidCCS: Prediction of Collision Cross-Section Values for Lipids with High Precision To Support Ion Mobility-Mass Spectrometry-Based Lipidomics. Analytical Chemistry 2017, 89 (17), 9559–9566. [DOI] [PubMed] [Google Scholar]
- 34.Dalgaard P; Ross T; Kamperman L; Neumeyer K; McMeekin TA, Estimation of bacterial growth rates from turbidimetric and viable count data. International journal of food microbiology 1994, 23 (3–4), 391–404. [DOI] [PubMed] [Google Scholar]
- 35.Eggers LF; Schwudke D, Liquid Extraction: Folch. In Encyclopedia of Lipidomics, Wenk MR, Ed. Springer Netherlands: Dordrecht, 2016; pp 1–6. [Google Scholar]
- 36.Stow SM; Causon TJ; Zheng X; Kurulugama RT; Mairinger T; May JC; Rennie EE; Baker ES; Smith RD; McLean JA; Hann S; Fjeldsted JC, An Interlaboratory Evaluation of Drift Tube Ion Mobility–Mass Spectrometry Collision Cross Section Measurements. Analytical Chemistry 2017, 89 (17), 9048–9055. [DOI] [PMC free article] [PubMed] [Google Scholar]
- 37.Zhang Y-Y; Liu Y-X; Zhou Z; Zhou D-Y; Du M; Zhu B-W; Qin L, Improving Lipidomic Coverage Using UPLC-ESI-Q-TOF-MS for Marine Shellfish by Optimizing the Mobile Phase and Resuspension Solvents. Journal of Agricultural and Food Chemistry 2019, 67 (31), 8677–8688. [DOI] [PubMed] [Google Scholar]
- 38.Olajide OE; Donkor B; Hamid AM, Systematic Optimization of Ambient Ionization Ion Mobility Mass Spectrometry for Rapid Separation of Isomers. Journal of the American Society for Mass Spectrometry 2022, 33 (1), 160–171. [DOI] [PubMed] [Google Scholar]
- 39.May JC; Knochenmuss R; Fjeldsted JC; McLean JA, Resolution of Isomeric Mixtures in Ion Mobility Using a Combined Demultiplexing and Peak Deconvolution Technique. Analytical Chemistry 2020, 92 (14), 9482–9492. [DOI] [PubMed] [Google Scholar]
- 40.Bilbao A; Gibbons BC; Stow SM; Kyle JE; Bloodsworth KJ; Payne SH; Smith RD; Ibrahim YM; Baker ES; Fjeldsted JC, A Preprocessing Tool for Enhanced Ion Mobility–Mass Spectrometry-Based Omics Workflows. Journal of Proteome Research 2021, 21 (3), 798 – 807. [DOI] [PMC free article] [PubMed] [Google Scholar]
- 41.Koelmel JP; Li X; Stow SM; Sartain MJ; Murali A; Kemperman R; Tsugawa H; Takahashi M; Vasiliou V; Bowden JA; Yost RA; Garrett TJ; Kitagawa N, Lipid Annotator: Towards Accurate Annotation in Non-Targeted Liquid Chromatography High-Resolution Tandem Mass Spectrometry (LC−HRMS/MS) Lipidomics Using a Rapid and User-Friendly Software. Metabolites 2020, 10 (3), 101. [DOI] [PMC free article] [PubMed] [Google Scholar]
- 42.Huang Y; Dodds ED, Ion Mobility Studies of Carbohydrates as Group I Adducts: Isomer Specific Collisional Cross Section Dependence on Metal Ion Radius. Anal Chem 2013, 85 (20), 9728–9735. [DOI] [PubMed] [Google Scholar]
- 43.Groessl M; Graf S; Knochenmuss R, High resolution ion mobility-mass spectrometry for separation and identification of isomeric lipids. The Analyst 2015, 140 (20), 6904–6911. [DOI] [PubMed] [Google Scholar]
- 44.Pi JJ; Wu X; Feng YF, Fragmentation patterns of five types of phospholipids by ultra-high-performance liquid chromatography electrospray ionization quadrupole time-of-flight tandem mass spectrometry. Analytical Methods 2016, 8 (6), 1319–1332. [Google Scholar]
- 45.Pruitt KD; Tatusova T; Maglott DR, NCBI reference sequences (RefSeq): a curated non-redundant sequence database of genomes, transcripts and proteins. Nucleic acids research 2007, 35 (suppl_1), D61–D65. [DOI] [PMC free article] [PubMed] [Google Scholar]
- 46.Kaas RS; Leekitcharoenphon P; Aarestrup FM; Lund O, Solving the problem of comparing whole bacterial genomes across different sequencing platforms. PloS one 2014, 9 (8), e104984. [DOI] [PMC free article] [PubMed] [Google Scholar]
- 47.Shelley JT; Hieftje GM, Ionization matrix effects in plasma-based ambient mass spectrometry sources. Journal of Analytical Atomic Spectrometry 2010, 25 (3), 345–350. [Google Scholar]
- 48.Deng L; Webb IK; Garimella SV; Hamid AM; Zheng X; Norheim RV; Prost SA; Anderson GA; Sandoval JA; Baker ES; Ibrahim YM; Smith RD, Serpentine ultralong path with extended routing (SUPER) high resolution traveling wave ion mobility-MS using structures for lossless ion manipulations. Analytical chemistry 2017, 89 (8), 4628–4634. [DOI] [PMC free article] [PubMed] [Google Scholar]
Associated Data
This section collects any data citations, data availability statements, or supplementary materials included in this article.