

Abstract
Purpose:
Early detection and size quantification of renal calculi are important for optimizing treatment and preventing severe kidney stone disease. Volumetric measurements of kidney stones are more informative and reproducible than linear measurements. Deep learning based systems that use abdominal non-contrast CT scans may assist in detection and reduce workload by removing the need for manual stone volume measurement. Prior to this work no such system had been developed for use on noisy low-dose CT or tested on a large-scale external dataset.
Methods:
We used a dataset of 91 CT colonography (CTC) scans with manually marked kidney stones combined with 89 CTC scans without kidney stones. To compare with a prior work half the data was used for training and half for testing. A set of CTC scans from 6,185 patients from a separate institution with patient-level labels were used as an external validation set. A 3D U-Net model was employed to segment the kidneys, followed by gradient-based anisotropic denoising, thresholding, and region growing. A 13 layer convolutional neural network classifier was then applied to distinguish kidney stones from false positives.
Results:
The system achieved a sensitivity of 0.86 at 0.5 false positives per scan on a challenging test set of low-dose CT with many small stones, an improvement over an earlier work which obtained a sensitivity of 0.52. The stone volume measurements correlated well with manual measurements (r2 = 0.95). For patient level classification the system achieved an AUC of 0.95 on an external validation set (sensitivity = 0.88, specificity = 0.91 at the Youden point). A common cause of false positives were small atherosclerotic plaques in the renal sinus that simulated kidney stones.
Conclusions:
Our deep learning based system showed improvements over a previously developed system that did not use deep learning, with even higher performance on an external validation set.
I. Introduction
People living in the United States have approximately a 9% lifetime risk of developing kidney stone disease, also known as urolithiasis or nephrolithiasis1. While X-ray, ultrasound, and CT may all be used to detect kidney stones, CT is by far the most common imaging modality employed owing to its high sensitivity and specificity (reported at 96% or higher)2. Emergency room visits due to kidney stones are very common3 and nearly doubled from 1992 to 2009, when the number of visits reached around 1,000,000 per year in the United States4. The American College of Radiology’s Data Science Institute has identified “Kidney stone detection on CT” as an important AI use-case5. AI systems may have particular utility when it comes to detecting kidney stones on scans performed for other reasons, such as CT colonography6. A 2010 study found that 8% of patients who underwent CT colonography had asymptomatic urolithiasis6. Ultra lose dose CT (ULD-CT) protocols have also been developed specifically for kidney stone screening and surveillance7,8,9 and ULD-CT can be lower cost than renal ultrasound8.
A 2005 study estimated that the total direct and indirect costs of nephrolithiasis was approximately $4.5 billion in 2000 in the United States and growing each year10. There is not much work on the cost effectiveness of early stage interventions, however Saigal et al estimate that a 75% effective intervention that that costs less than $300 per patient per year would be cost effective at reducing health care expenditures10. They note that a shift away from expensive medications towards low cost treatment modalities such as increased water intake and lemon juice11 could increase cost effectiveness10. More work needs to be done but based on the work on screening cost-effectiveness reported so far10,12 it is not unreasonable to conclude that earlier detection of kidney stones using CT, especially when done opportunistically, could reduce healthcare expenditures.
Accurate measurement of stone volume is important to determine the optimal course of treatment. Stones which are small enough have a high likelihood of passing spontaneously on their own and therefore may not warrant costly treatment expenditures13,14. Selby et al found that stone volume but not stone diameter was a predictor of future symptomatic events (HR 1.35 per quartile)15. Statistical correlations have been also been found between stone volume and the chance of spontaneous passage13,14 and the risk of perioperative complications during percutaneous nephrolithotomy16. The rate at which stones grow over time may also inform treatment decisions as stones with a higher growth rate may be judged at greater risk of becoming symptomatic.
Despite the relevance of stone volume to making treatment decisions, accurate measurements of stone size and/or volume are not always performed owing to the added time required to make such measurements. A 2005 survey in the UK found that 15% of radiologists “guestimate” stone size rather than making a digital measurement17. It has been shown that stone volume measurement is a more reproducible measurement than stone diameter8,18,19. For instance, one study found an average of 26.3% inter-reader variation in stone diameter vs close to 0% inter-reader variation when using a semi-automated method for stone volume measurement19. Manual stone volume measurement is time consuming and subject to human error. One study found variation between radiologists depending on the windowing settings utilized while making the measurement, with a soft tissue window setting leading to overestimation of stone volume by an average of 57%20. It has also been found that taking a threshold for kidney stone segmentation at half the highest brightness level in the stone helps compensate for the effect of partial volume averaging21 and leads to a more accurate volume measurement compared to using a fixed threshold22. Automated stone volume may provide a more objective means for stone surveillance18.
Relatively few works have been published which tackle the challenge of computer-aided detection of kidney stones in CT. Lee et al. (2009) used texture and intensity based features to train an artificial neural network to distinguish kidney stones from vascular calcifications23. Liu et al. (2014) segmented the kidneys and then used total-variation flow denoising followed by the maximal stable extremal regions method to segment stones24. Features from the segmented stones were fed into an support vector machine (SVM) classifier to classify kidney stones vs false positives, achieving a sensitivity of 60.0% at an average of 2 false positives per scan24. Längkvist et al. (2018) performed thresholding at 250 HU and connected components analysis followed by application of a convolutional neural network (CNN) to classify ureteral stones vs false positive detections25. A limitation of this work is that their training data only consisted of cases with very large and bright uretral stones and no stone free cases were used in either training or testing. The system achieved a 100% sensitivity but at an unacceptably high false positive rate of 2.7 false positives per scan. Parakh et al. (2019) developed a dual CNN system for detecting stones in the kidney, ureter, and bladder26. The system achieved a sensitivity of 0.873 and AUC of 0.954 for patient level stone detection26. A limitation of their work is that their system does not report the number of stones detected or segment the stones to measure the stone volume. Most recently Cui et al. (2020) have utilized a dual stage 3D U-Net followed by simple thresholding and region growing to segment kidney stones. The first 3D U-Net segments the kidneys to allow a cropped box around each kidney to be generated. The cropped box is fed into a 2nd 3D U-Net which segments the renal sinus area, where most kidney stones are located. The system achieved a sensitivity of 96% with a false positive rate of 0.03 per patient for detecting stones > 2mm in diameter (volume > 4.18 mm3)27. A major weakness of their system is their threshold based detection system which leads to many false positives on low dose CT scans. In summary, all three existing deep learning systems have major limitations. Additionally none of the three prior works test their system on an external dataset25,26,27 and none of them utilize low-dose CT which are more representative of what may be used for kidney stone screening.
II. Dataset preparation
The dataset used for initial training and testing is the same used by Liu et al.24 (2014). The dataset, which we designate as NNMC-CTC, is a subset of a larger dataset of 1186 CT Colonography (CTC) scans from three institutions28. The images were selected as images containing kidney stones based on the extracolonic findings information, and the presence of stones was verified as described in24. Each patient was administered an oral contrast agent and scanned during a single breath hold using a four- or eight-channel CT scanner (General Electric Light Speed or Light Speed Ultra). CT scanning parameters included 1.25 – 2.5 mm section collimation, 1 mm reconstruction interval, and 120 kVp. Many of these images have a large amount of quantum noise. In prospective readings by experienced radiologists, 91 patients were reported to have renal calculi in the extracolonic findings. A radiologist with 6 years of experience (E.B.T) marked the coordinates for all the stones in these 91 cases and their findings were double checked by a second radiologist with 20 years of experience (R.M.S.). The renal calculi volumes were measured using a commercially available coronary artery calcium scoring tool (Vitrea Core fX v6, Vital Images, Minnetonka, MN). The settings employed for volume measurement were a lower threshold of 130 HU and a lower pixel threshold of 3 pixels, as recommended by Patel et al. to assess the volumes of calculi on non-contrast CT images19. In our literature survey we found that a lower threshold of 130 HU is the most common choice for measuring stone volume15,22,24, with a minority of studies using either 200 HU14 or 250 HU25,29.
In addition to the scans of 91 patients with kidney stones, 89 patients without kidney stones were chosen from the remaining CTC images as negative examples. The dataset of 180 images was split evenly into training (N = 90) and test (N = 90) sets. The splitting was done to replicate the splitting used previously by Liu et al. as closely as possible24. There were 97 kidney stones in the training dataset and 77 in the test dataset. The distribution of stone sizes in the test dataset is shown in figure 1. The average stone size was 44.69 mm3 and the range of stone sizes was 1 – 433 mm3.
Figure 1:

Stone volume distribution for the NNMC-CTC test set. The test set is challenging due to the combination of noisy images and 21 stones with volumes < 5 mm3.
To validate our system on a newer dataset we used a set of 12,351 CTC images from the University of Wisconsin Medical Center.30 The scans were helical CT (General Electric Discovery Series) taken with a 0.75 or 1 mm reconstruction interval, 1.25 mm slice thickness, and 120 kVp (a few scans had slice thicknesses of 1.5 or 3 mm). One scan was removed due to data corruption, 3 scans were removed for being decubitus or prone rather than supine, and 6,166 scans were removed due to lack of extracolonic findings information, leaving 6,185 scans. To isolate the scans with kidney stones we searched the extracolonic findings notes for at least one of the following keywords: “kidney stone”, “kid stone”, “nephrolithiasis”, “renal stone”, “renal calculi”, “renal calculus”, and “renal calc”. Among the patients with extracolonic findings information, 841 had E-RADS scores reported for at least one extracolonic finding of a kidney stone. For patients having multiple scans with extracolonic findings, we took the first scan and ignored the rest. Altogether we found 755 patients (12%) with keywords indicating a kidney stone and 5381 patients assumed to be without stones. Some extracolonic findings were categorized based on the criteria laid out in the CT Colonography Reporting and Data System (C-RADS)31. In particular, categories E3 (“Likely Unimportant Finding, Incompletely Categorized”) and E4 (“Potentially Important Finding”) were of interest7,31. Among those, there were 14 kidney stones with Category E3 and 7 kidney stones with category E4. Retrospective analysis of all images employed was approved by the local Institutional Review Board and the informed consent requirement was waived.
III. Methods
Conceptually the system is similar to the one developed by Liu et al. in 201424 but with several important updates and simplifications. A diagram comparing both systems is shown in figure 2. To segment the kidneys we use a 3D U-Net32 model developed previously33 which was trained on an in-house dataset of 56 cases with ground truth segmentations. Details of the 3D U-Net architecture and training procedure can be found in previous work33,34. A connected components analysis is applied to the 3D U-Net segmentation to isolate the two largest objects which helps remove spurious segmentations outside the kidneys. We use the original scan thickness (1.0 mm for the NNMC-CTC dataset and 1.0–1.25 mm for the UW-CTC dataset, even though resampling to thicker slices would reduce image noise. This decision was informed by a number of studies from 2000 and onward which have shown that thicker slices lead to less accurate size measurements due to the partial volume effect22,35,36,37. In studies with ground truth stones embedded in phantoms, larger slice thicknesses lead to a decrease in both the measured size and maximum intensity of stones35,36. Additionally, slice thicknesses greater than 3 mm can lead to small stones (<3 mm diameter) being missed36,38. On the basis of these findings, Kambadakone et al. recommend the use of thin slices (0.75 – 1.5 mm) for accurate kidney stone detection and size quantification39. To keep the radiation dose low with thinner slices, the tube current must be lowered, resulting in a noisier scan. However, for kidney stone detection it has been shown that the use of low dose CT does not hinder human diagnostic accuracy40.
Figure 2:
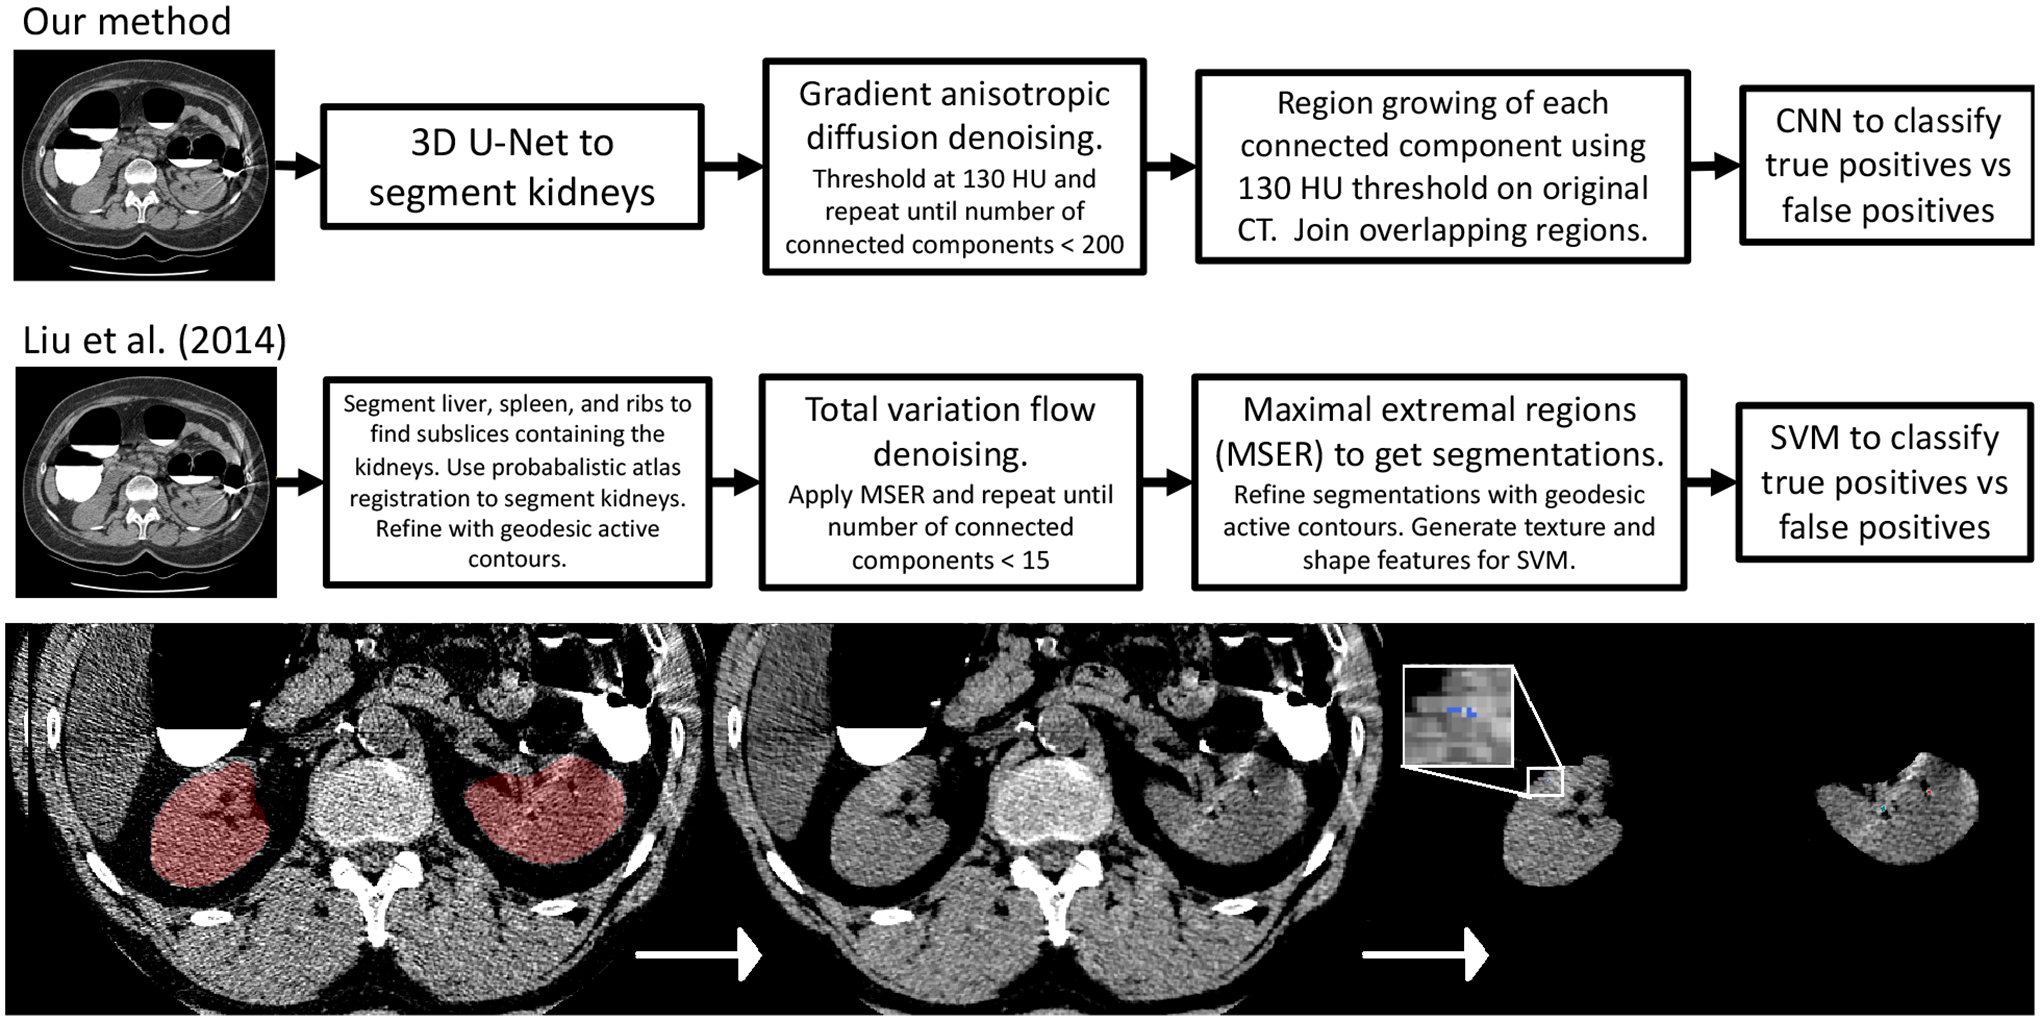
(top) Intermediate outputs from a randomly selected case with kidney stones. On the far left the kidney segmentation and CT is visualized with a window between - 50 to 150 HU. The middle panel shows the CT after denoising. The right panel shows the detections. The blue detection (magnified) is classified as a false positive by the CNN whereas the green and red detections are classified as true positives. (bottom) The kidney stone detection system utilized in this work (top) vs the 2014 system previously developed in our lab (below)24.
To denoise the images two methods were tested head-to-head on a few training data cases - denoise_tv_chambolle() as implemented in the Python library Scikit-Image and CurvatureAnisotropicDiffusionImageFilter() as implemented in ITK. For further elaboration on the pros and cons of different denoising methods, see our prior work24. Denoising is performed iteratively until the number of connected components is less than 200 (this lowers the computational burden at later steps as the CNN must be applied to each connected component). Then threshold (130 HU) is set on the denoised image, followed by connected components analysis. Next, region growing of each connected component is performed on the original CT with a lower threshold of 130 HU to replicate the manual method for segmentation. After region growing, any regions that are touching are joined together and a 24×24×24 voxel box centered around each region on the original CT is fed into a 13 layer CNN to classify kidney stones vs false positives. The CNN architecture is the same architecture developed by Perez et al. for lung nodule classification41 and features batch normalization and dropout (dropout rate = 0.65) in each layer. The source code for the architecture is available online42. The CNN was trained on a set of boxes generated by running the first stage on the training scans. The boxes are reprocessed by clipping to −200 – 1000 HU and rescaling so the distribution of intensities is centered at zero with standard deviation of ± 1. The CNN was trained using data augmentation (random xyz jitter, random rotation, random flipping), the rectified-Adam optimizer43, and a batch size of 8. Since false positives greatly outnumbered true positives, the true positives were reweighted in the training sample so there was a 50–50 mix during training. A validation set of 400 boxes was used to monitor the F1 score during training, and the training was stopped as soon as the validation F1 score plateaued.
IV. Results
Some initial hyperparameter studies and ablation studies were performed. Validation F1 score for several CNN architectures are shown in figure 3. Among the architectures studied, the CNN with box size 24×24×24 performed best in the validation set, so that architecture was used. We also tested several denoising methods. First we tested a variation flow denoising method very similar to the one utilized by Liu et al., as implemented in the scikit-image Python package (denoise_tv_chambolle()). We tested both 3D and 2D implementations, finding them to give very similar results visually on a few training cases. We found the method enhanced noise in a few situations and also artificially decreased the intensity of stones, often below the 130 HU threshold. We found that the anisotropic diffusion filtering method developed by Perona & Malik (1990)44, as implemented in ITK (GradientAnisotropicDiffusionImageFilter()), did not enhance noise and only reduced the maximal stone brightness slightly, so we used that method instead. Thresholds of 100, 130, and 150 HU were tested. The differences were small but the 130 HU threshold yielded the best FROC curve in the test set.
Figure 3:

Validation F1 score during training for four models that were tested to classify kidney stones vs false positive detections. The 13 layer CNN with box size 24×24×24 was chosen since it had the highest validation F1 score.
The FROC curve and precision-recall curve on the test set is shown in figure 4. FROC curves vs stone volume size are shown in figure 5. Not surprisingly, large stones (ie volumes > 27 mm3 / diameters > 3.7 mm) are much easier to detect, with a sensitivity of 0.91 at a false positive rate of < 0.05 per scan. A scatterplot comparing automated vs manual stone volume measurements is shown in figure 5 (Pearson’s r2 = 0.95). The relative average volume difference, defined as the average of R = (Vpredicted − Vtrue)/Vtrue, was 0.31 ± 0.92. This is an improvement over Liu et al., who obtained an average R of 1.15 ± 1.2724.
Figure 4:

(left) FROC curve on the NNMC-CTC dataset. (right) Precision-recall curve.
Figure 5:

(left) FROC curve vs stone volume. (right) Automated vs manual stone volume measurements (with threshold = 130 HU).
The per-patient ROC curve for the CTC validation set is shown in figure 6. 6,163 patients had extracolonic findings in at least one scan. For patient-level detection the system achieved an AUC of 0.95 with a sensitivity of 0.88 and specificity of 0.91 at the Youden point. At the threshold corresponding to the Youden point, the detector found 6/7 of the E4 stones (85%) and 11/14 (78%) of the E3 stones. The single E4 stone that was missed was an improper label (image had a uretral stone, not a kidney stone). Using the sensitivity for the E3 and E4 stones specifically and the specificity for the detector overall we find AUC of 0.86 for the E3 stones and 0.91 for the E4 stones. These results make sense given that E4 are more severe stones.
Figure 6:

ROC curve for patient-level kidney stone detection on the UW-CTC dataset (N=6,136). Also shown are the ROC curves with sensitivity computed specifically for the kidney stones with E3 (N=15) or E4 (N=7) E-RADS scores.
We performed an analysis of a randomly drawn sample of false positive and false negative detections in the NNMC-CTC test set, obtained using a CNN classification threshold of 0.5 (see random examples shown in fig. 7). Out of 15 false positives, 9 (50%) were due to plaque in the renal sinus, 1 was due to a beam hardening artifact from oral contrast, 2 were due to image noise, 2 were due to likely missing labels, and 1 was due to a metal object near the kidneys. The two that were due to missing labels appeared to be very small stones and possibly uric acid stones. Out of 5 false negatives that were reviewed, they all were kidney stones of distinct size (eg > 4–5 voxels) but less bright (ie max HU < 400). These stones were detected in the first stages of the detector but misclassified by the CNN. It appears that it is difficult for the CNN to distinguish plaques in the renal arteries from kidney stones and that this issue was responsible for the majority of both false positives and false negatives. We also looked at a few of the false negatives that were responsible specifically for the plateau in sensitivity at 0.92 observed in the FROC and precision-recall curves (fig. 4). The plateau is largely due to very a few small stones which are lost in the denoising stage and therefore are never fed into the CNN.
Figure 7:

(left) NMMC-CTC False positives: (a.) metal object. (b.-d.) plaque. (e.-f.) image noise. (right) NMMC-CTC False negatives: (a.) False negative where there were 4 stones close together. One stone was lost after denoising. (b.-d.) These false negatives were all relatively small and less bright stones (max HU < 400).
We also conducted an analysis of false positives and false negatives in the UW-CTC dataset, again using a threshold of 0.5, which corresponded to an operating point with a sensitivity of 0.95 and a false positive rate of 0.16 (see figure 9). Out of 15 false positives surveyed, 7/15 (47%) were actual kidney stones of varying size, 5/15 (33%) were due to image noise, 1 was due to a rib bordering the kidney that was mistaken for a kidney stone, 1 was due to beam hardening from oral contrast, and 1 was due to a large calcified tumor. Out of 10 false negatives that we looked at, 9/10 were in very noisy images where we determined the problem was with the stones being lost during the denoising iterations. The 10th false negative case was the missed E4 case mentioned above - it was a large ureteral stone causing complete blockage of the left renal collecting system. The uretral stone was improperly classified in the extracolonic findings as a kidney stone.
Figure 9:

(left) UW-CTC False positives. A random sample is shown. The detections are shown with the crosshairs. Top row - noise/rib, noise, unlabeled stone, noise. Middle row - noise, calcified tumor, noise, and unlabeled stone. Bottom row - unlabeled stone, noise, unlabeled stone, and bright region from beam hardening. (right) UW-CTC False negatives. A random sample is shown and visualized with a soft tissue window between −160 to 240 HU.
V. Discussion
We have developed a fully automated system for kidney stone detection and volume quantification on CT. We adopted a framework similar to the one previously developed in our lab in 201424, but with important updates to the algorithms used in each step and a few simplifications. The system achieved an AUC of 0.95 for patient-level classification (fig. 6) on a large external validation set with 6,185 scans, with many (≈ 50%) of the false positives corresponding to stones not reported in the extracolonic findings information. In the NNMC-CTC test set the improvement obtained over the 2014 work was substantial both in terms of sensitivity (0.86 vs 0.52 a false positive rate of 0.5/scan) and accuracy of volume measurement. A comparison of the failure modes of the two systems indicate this improvement is mainly due to the use of a CNN rather than a feature-based SVM for false positive detection. This replicates a wealth of other studies which show that CNN based classifiers can perform much better than classifiers which use hand-crafted features.
Systems such as the one developed and validated in this work may offer clinical utility, particularly by providing an automated measure of stone volume. Stone volume measurements are time consuming to obtain manually but studies show volume is more reproducible than measures such as stone diameter19.
The current system could likely be simplified further without loss in accuracy. For instance, the denoising algorithm could be removed and a patch-based 3D U-Net could be trained to segment kidney stones directly within the kidney region. Such an approach would be similar to the patch-based 3D U-Net that was recently demonstrated for segmenting small aortic plaques45.
Two challenges encountered in this work were dealing with large amounts of image noise and distinguishing plaques from kidney stones. The issue of plaques causing false positives and false negatives has also been noted in another recent work27. Solving this problem was outside the scope of this work but might be tackled by assembling a joint training dataset to train a multiclass deep learning system to detect and segment both plaque and kidney stones. By training directly on the task of discriminating the two types of objects, such a system would likely have a lower chance of mistaking plaque for kidney stones or vice-versa.
In conclusion, in this work we showed that deep learning algorithm can detect renal calculi in non-contrast CT scans with high sensitivity and specificity. The system was demonstrated to generalize to both a hold-out test set and a large external dataset. Systems such as this which can detect kidney stones and provide accurate volume measurements may have clinical utility.
Figure 8: NMMC-CTC True positives:

Four true positive examples are shown, with and without the segmentation overlay.
Acknowledgements
This research was funded in part by the Intramural Research Program of the National Institutes of Health, Clinical Center. The research used the high-performance computing facilities of the NIH Biowulf cluster. The authors thank Drs. Perry Pickhardt, J. Richard Choi, and William Schindler for providing CT colonography scans.
Conflicts of interest
Potential financial interest: Author RMS receives royalties from iCAD, Philips, Scan-Med, PingAn, and Translation Holdings and has received research support from Ping An (CRADA) and NVIDIA (GPU card donations). PJP is an adviser or consultant for Zebra Medical Vision and Bracco Diagnostics, and shareholder in Cellectar, Elucent, and SHINE.
References
- 1.Scales CD, Smith AC, Hanley JM, and Saigal CS, Prevalence of Kidney Stones in the United States, European Urology 62, 160–165 (2012). [DOI] [PMC free article] [PubMed] [Google Scholar]
- 2.Boulay I, Holtz P, Foley WD, White B, and Begun FP, Ureteral calculi: diagnostic efficacy of helical CT and implications for treatment of patients., American Journal of Roentgenology 172, 1485–1490 (1999). [DOI] [PubMed] [Google Scholar]
- 3.Scales CD, Lin L, Saigal CS, Bennett CJ, Ponce NA, Mangione CM, and and MSL, Emergency Department Revisits for Patients with Kidney Stones in California, Academic Emergency Medicine 22, 468–474 (2015). [DOI] [PMC free article] [PubMed] [Google Scholar]
- 4.Fwu C-W, Eggers PW, Kimmel PL, Kusek JW, and Kirkali Z, Emergency department visits, use of imaging, and drugs for urolithiasis have increased in the United States, Kidney International 83, 479–486 (2013). [DOI] [PMC free article] [PubMed] [Google Scholar]
- 5.Adair LB II, Kidney Stone Detection on CT, https://www.acrdsi.org/DSI-Services/Define-AI/Use-Cases/Kidney-Stone-Detection-on-CT (2020).
- 6.Boyce CJ, Pickhardt PJ, Lawrence EM, Kim DH, and Bruce RJ, Prevalence of Urolithiasis in Asymptomatic Adults: Objective Determination Using Low Dose Non-contrast Computerized Tomography, Journal of Urology 183, 1017–1021 (2010). [DOI] [PubMed] [Google Scholar]
- 7.Pooler BD, Lubner MG, Kim DH, Ryckman EM, Sivalingam S, Tang J, Nakada SY, Chen G-H, and Pickhardt PJ, Prospective Trial of the Detection of Urolithiasis on Ultralow Dose (Sub mSv) Noncontrast Computerized Tomography: Direct Comparison against Routine Low Dose Reference Standard, Journal of Urology 192, 1433–1439 (2014). [DOI] [PMC free article] [PubMed] [Google Scholar]
- 8.Planz VB, Posielski NM, Lubner MG, Li K, Chen G-H, Nakada SY, and Pickhardt PJ, Ultra-low-dose limited renal CT for volumetric stone surveillance: advantages over standard unenhanced CT, Abdominal Radiology 44, 227–233 (2018). [DOI] [PMC free article] [PubMed] [Google Scholar]
- 9.Moore CL, Bhargavan-Chatfield M, Shaw MM, Weisenthal K, and Kalra MK, Radiation Dose Reduction in Kidney Stone CT: A Randomized, Facility-Based Intervention, Journal of the American College of Radiology (2021). [DOI] [PubMed] [Google Scholar]
- 10.Saigal CS, Joyce G, Timilsina AR, and the Urologic Diseases in America Project, Direct and indirect costs of nephrolithiasis in an employed population: Opportunity for disease management?, Kidney International 68, 1808–1814 (2005). [DOI] [PubMed] [Google Scholar]
- 11.Kurtz MP and Eisner BH, Dietary therapy for patients with hypocitraturic nephrolithiasis, Nature Reviews Urology 8, 146–152 (2011). [DOI] [PubMed] [Google Scholar]
- 12.Hyams ES and Matlaga BR, Economic impact of urinary stones, Translational Andrology and Urology 3 (2014). [DOI] [PMC free article] [PubMed] [Google Scholar]
- 13.Coll DM, Varanelli MJ, and Smith RC, Relationship of Spontaneous Passage of Ureteral Calculi to Stone Size and Location as Revealed by Unenhanced Helical CT, American Journal of Roentgenology 178, 101–103 (2002). [DOI] [PubMed] [Google Scholar]
- 14.Jendeberg J, Geijer H, Alshamari M, and Lidén M, Prediction of spontaneous ureteral stone passage: Automated 3D-measurements perform equal to radiologists, and linear measurements equal to volumetric, European Radiology 28, 2474–2483 (2018). [DOI] [PMC free article] [PubMed] [Google Scholar]
- 15.Selby MG, Vrtiska TJ, Krambeck AE, McCollough CH, Elsherbiny HE, Bergstralh EJ, Lieske JC, and Rule AD, Quantification of Asymptomatic Kidney Stone Burden by Computed Tomography for Predicting Future Symptomatic Stone Events, Urology 85, 45–50 (2015). [DOI] [PMC free article] [PubMed] [Google Scholar]
- 16.Lai S, Jiao B, Jiang Z, Liu J, Seery S, Chen X, Jin B, Ma X, Liu M, and Wang J, Comparing different kidney stone scoring systems for predicting percutaneous nephrolithotomy outcomes: A multicenter retrospective cohort study, International Journal of Surgery 81, 55–60 (2020). [DOI] [PubMed] [Google Scholar]
- 17.Kampa RJ, Ghani KR, Wahed S, Patel U, and Anson KM, Size Matters: A Survey of How Urinary-Tract Stones are Measured in the UK, Journal of Endourology 19, 856–860 (2005). [DOI] [PubMed] [Google Scholar]
- 18.Patel SR, Wells S, Ruma J, King S, Lubner MG, Nakada SY, and Pickhardt PJ, Automated Volumetric Assessment by Noncontrast Computed Tomography in the Surveillance of Nephrolithiasis, Urology 80, 27–31 (2012). [DOI] [PubMed] [Google Scholar]
- 19.Patel SR, Stanton P, Zelinski N, Borman EJ, Pozniak MA, Nakada SY, and Pickhardt PJ, Automated Renal Stone Volume Measurement by Noncontrast Computerized Tomography is More Reproducible Than Manual Linear Size Measurement, Journal of Urology 186, 2275–2279 (2011). [DOI] [PubMed] [Google Scholar]
- 20.Danilovic A, Rocha BA, Marchini GS, Traxer O, Batagello C, Vicentini FC, Torricelli FCM, Srougi M, Nahas WC, and Mazzucchi E, Computed tomography window affects kidney stones measurements, International Brazilian Journal of Urology 45, 948–955 (2019). [DOI] [PMC free article] [PubMed] [Google Scholar]
- 21.Olcott EW, Sommer FG, and Napel S, Accuracy of detection and measurement of renal calculi: in vitro comparison of three-dimensional spiral CT, radiography, and nephrotomography., Radiology 204, 19–25 (1997). [DOI] [PubMed] [Google Scholar]
- 22.Demehri S, Kalra MK, Rybicki FJ, Steigner ML, Lang MJ, Houseman EA, Curhan GC, and Silverman SG, Quantification of Urinary Stone Volume: Attenuation Threshold–based CT Method—A Technical Note, Radiology 258, 915–922 (2011). [DOI] [PubMed] [Google Scholar]
- 23.Lee HJ, Kim KG, Hwang SI, Kim SH, Byun S-S, Lee SE, Hong SK, Cho JY, and Seong CG, Differentiation of Urinary Stone and Vascular Calcifications on Non-contrast CT Images: An Initial Experience using Computer Aided Diagnosis, Journal of Digital Imaging 23, 268–276 (2009). [DOI] [PMC free article] [PubMed] [Google Scholar]
- 24.Liu J, Wang S, Turkbey EB, Linguraru MG, Yao J, and Summers RM, Computeraided detection of renal calculi from noncontrast CT images using TV-flow and MSER features, Medical Physics 42, 144–153 (2014). [DOI] [PMC free article] [PubMed] [Google Scholar]
- 25.Längkvist M, Jendeberg J, Thunberg P, Loutfi A, and Lidén M, Computer aided detection of ureteral stones in thin slice computed tomography volumes using Convolutional Neural Networks, Computers in Biology and Medicine 97, 153–160 (2018). [DOI] [PubMed] [Google Scholar]
- 26.Parakh A, Lee H, Lee JH, Eisner BH, Sahani DV, and Do S, Urinary Stone Detection on CT Images Using Deep Convolutional Neural Networks: Evaluation of Model Performance and Generalization, Radiology: Artificial Intelligence 1, e180066 (2019). [DOI] [PMC free article] [PubMed] [Google Scholar]
- 27.Cui Y, Sun Z, Ma S, Liu W, Wang X, Zhang X, and Wang X, Automatic Detection and Scoring of Kidney Stones on Noncontrast CT Images Using S.T.O.N.E. Nephrolithometry: Combined Deep Learning and Thresholding Methods, Molecular Imaging and Biology (2020). [DOI] [PubMed] [Google Scholar]
- 28.Pickhardt PJ, Choi JR, Hwang I, Butler JA, Puckett ML, Hildebrandt HA, Wong RK, Nugent PA, Mysliwiec PA, and Schindler WR, Computed Tomographic Virtual Colonoscopy to Screen for Colorectal Neoplasia in Asymptomatic Adults, New England Journal of Medicine 349, 2191–2200 (2003). [DOI] [PubMed] [Google Scholar]
- 29.Ziemba JB, Li P, Gurnani R, Kawamoto S, Fishman EK, Fung G, Ludwig WW, Stoianovici D, and Matlaga BR, A User-Friendly Application to Automate CT Renal Stone Measurement, Journal of Endourology 32, 685–691 (2018). [DOI] [PubMed] [Google Scholar]
- 30.Pickhardt PJ, Graffy PM, Zea R, Lee SJ, Liu J, Sandfort V, and Summers RM, Automated CT biomarkers for opportunistic prediction of future cardiovascular events and mortality in an asymptomatic screening population: a retrospective cohort study, The Lancet Digital Health 2, e192–e200 (2020). [DOI] [PMC free article] [PubMed] [Google Scholar]
- 31.Zalis ME, Barish MA, Choi JR, Dachman AH, Fenlon HM, Ferrucci JT, Glick SN, Laghi A, Macari M, McFarland EG, Morrin MM, Pickhardt PJ, Soto J, and Yee J, CT Colonography Reporting and Data System: A Consensus Proposal, Radiology 236, 3–9 (2005). [DOI] [PubMed] [Google Scholar]
- 32.Çiçek Özgün, Abdulkadir A, Lienkamp SS, Brox T, Ronneberger O, 3D U-Net: Learning Dense Volumetric Segmentation from Sparse Annotation, in Medical Image Computing and Computer-Assisted Intervention – MICCAI 2016, pages 424–432, Springer International Publishing, 2016. [Google Scholar]
- 33.Sandfort V, Yan K, Pickhardt PJ, and Summers RM, Data augmentation using generative adversarial networks (CycleGAN) to improve generalizability in CT segmentation tasks, Scientific Reports 9 (2019). [DOI] [PMC free article] [PubMed] [Google Scholar]
- 34.Elton D, Sandfort V, Pickhardt PJ, and Summers RM, Accurately identifying vertebral levels in large datasets, in Medical Imaging 2020: Computer-Aided Diagnosis, edited by Hahn HK and Mazurowski MA, SPIE, 2020. [Google Scholar]
- 35.Saw KC, McAteer JA, Monga AG, Chua GT, Lingeman JE, and Williams JC, Helical CT of Urinary Calculi, American Journal of Roentgenology 175, 329–332 (2000). [DOI] [PubMed] [Google Scholar]
- 36.Ketelslegers E and Beers BEV, Urinary calculi: improved detection and characterization with thin-slice multidetector CT, European Radiology 16, 161–165 (2005). [DOI] [PubMed] [Google Scholar]
- 37.Umbach R, Müller J-K, Wendt-Nordahl G, Knoll T, and Jessen JP, In-vitro comparison of different slice thicknesses and kernel settings for measurement of urinary stone size by computed tomography, Urolithiasis 47, 583–586 (2019). [DOI] [PubMed] [Google Scholar]
- 38.Memarsadeghi M, Heinz-Peer G, Helbich TH, Schaefer-Prokop C, Kramer G, Scharitzer M, and Prokop M, Unenhanced Multi–Detector Row CT in Patients Suspected of Having Urinary Stone Disease: Effect of Section Width on Diagnosis, Radiology 235, 530–536 (2005). [DOI] [PubMed] [Google Scholar]
- 39.Kambadakone AR, Eisner BH, Catalano OA, and Sahani DV, New and Evolving Concepts in the Imaging and Management of Urolithiasis: Urologists’ Perspective, RadioGraphics 30, 603–623 (2010). [DOI] [PubMed] [Google Scholar]
- 40.Reimer RP, Salem J, Merkt M, Sonnabend K, Lennartz S, Zopfs D, Heidenreich A, Maintz D, Haneder S, and Hokamp NG, Size and volume of kidney stones in computed tomography: Influence of acquisition techniques and image reconstruction parameters, European Journal of Radiology 132, 109267 (2020). [DOI] [PubMed] [Google Scholar]
- 41.Perez G and Arbelaez P, Automated detection of lung nodules with three-dimensional convolutional neural networks, in 13th International Conference on Medical Information Processing and Analysis, edited by Brieva J, García JD, Lepore N, and Romero E, SPIE, 2017. [Google Scholar]
- 42.LungCancerDiagnosis-pytorch, https://github.com/BCV-Uniandes/LungCancerDiagnosis-pytorch/blob/master/models/model_nod3.py, 2018, Accessed: 2021-08-07.
- 43.Liu L, Jiang H, He P, Chen W, Liu X, Gao J, and Han J, On the Variance of the Adaptive Learning Rate and Beyond, in Proceedings of the 8th International Conference on Learning Representations (ICLR), 2020. [Google Scholar]
- 44.Perona P and Malik J, Scale-space and edge detection using anisotropic diffusion, IEEE Transactions on Pattern Analysis and Machine Intelligence 12, 629–639 (1990). [Google Scholar]
- 45.Summers RM, Elton DC, Lee S, Zhu Y, Liu J, Bagheri M, Sandfort V, Grayson PC, Mehta NN, Pinto PA, Linehan WM, Perez AA, Graffy PM, O’Connor SD, and Pickhardt PJ, Atherosclerotic Plaque Burden on Abdominal CT: Automated Assessment With Deep Learning on Noncontrast and Contrast-enhanced Scans, Academic Radiology (2020). [DOI] [PMC free article] [PubMed] [Google Scholar]