

Key Points
Question
How does performance of existing and newly developed machine learning stroke–specific algorithms compare with that of the atherosclerotic cardiovascular disease–focused pooled cohort equations for predicting new-onset stroke across Black and White race, sex, and age subgroups?
Findings
In this retrospective study of predictive accuracy that included 62 482 participants, existing stroke-specific risk prediction models and novel machine learning techniques did not significantly improve discriminative accuracy for new-onset stroke compared with the pooled cohort equations. All algorithms exhibited worse discrimination in Black individuals than in White individuals. Calibration was most accurate using the Reasons for Geographical and Racial Differences in Stroke (REGARDS) model based on self-reported risk factors.
Meaning
Results indicate the need to expand the pool of risk factors and improve modeling techniques to address observed racial disparities and improve model performance for predicting new-onset stroke.
Abstract
Importance
Stroke is the fifth-highest cause of death in the US and a leading cause of serious long-term disability with particularly high risk in Black individuals. Quality risk prediction algorithms, free of bias, are key for comprehensive prevention strategies.
Objective
To compare the performance of stroke-specific algorithms with pooled cohort equations developed for atherosclerotic cardiovascular disease for the prediction of new-onset stroke across different subgroups (race, sex, and age) and to determine the added value of novel machine learning techniques.
Design, Setting, and Participants
Retrospective cohort study on combined and harmonized data from Black and White participants of the Framingham Offspring, Atherosclerosis Risk in Communities (ARIC), Multi-Ethnic Study for Atherosclerosis (MESA), and Reasons for Geographical and Racial Differences in Stroke (REGARDS) studies (1983-2019) conducted in the US. The 62 482 participants included at baseline were at least 45 years of age and free of stroke or transient ischemic attack.
Exposures
Published stroke-specific algorithms from Framingham and REGARDS (based on self-reported risk factors) as well as pooled cohort equations for atherosclerotic cardiovascular disease plus 2 newly developed machine learning algorithms.
Main Outcomes and Measures
Models were designed to estimate the 10-year risk of new-onset stroke (ischemic or hemorrhagic). Discrimination concordance index (C index) and calibration ratios of expected vs observed event rates were assessed at 10 years. Analyses were conducted by race, sex, and age groups.
Results
The combined study sample included 62 482 participants (median age, 61 years, 54% women, and 29% Black individuals). Discrimination C indexes were not significantly different for the 2 stroke-specific models (Framingham stroke, 0.72; 95% CI, 0.72-073; REGARDS self-report, 0.73; 95% CI, 0.72-0.74) vs the pooled cohort equations (0.72; 95% CI, 0.71-0.73): differences 0.01 or less (P values >.05) in the combined sample. Significant differences in discrimination were observed by race: the C indexes were 0.76 for all 3 models in White vs 0.69 in Black women (all P values <.001) and between 0.71 and 0.72 in White men and between 0.64 and 0.66 in Black men (all P values ≤.001). When stratified by age, model discrimination was better for younger (<60 years) vs older (≥60 years) adults for both Black and White individuals. The ratios of observed to expected 10-year stroke rates were closest to 1 for the REGARDS self-report model (1.05; 95% CI, 1.00-1.09) and indicated risk overestimation for Framingham stroke (0.86; 95% CI, 0.82-0.89) and pooled cohort equations (0.74; 95% CI, 0.71-0.77). Performance did not significantly improve when novel machine learning algorithms were applied.
Conclusions and Relevance
In this analysis of Black and White individuals without stroke or transient ischemic attack among 4 US cohorts, existing stroke–specific risk prediction models and novel machine learning techniques did not significantly improve discriminative accuracy for new-onset stroke compared with the pooled cohort equations, and the REGARDS self-report model had the best calibration. All algorithms exhibited worse discrimination in Black individuals than in White individuals, indicating the need to expand the pool of risk factors and improve modeling techniques to address observed racial disparities and improve model performance.
This retrospective cohort study compares stroke-specific algorithms with pooled cohort equations developed for atherosclerotic cardiovascular disease for the prediction of new-onset stroke across different subgroups (race, sex, and age) and the added value of novel machine learning techniques.
Introduction
In 2021, stroke was the fifth-highest cause of death in the US at approximately 150 000 per year and a leading cause of serious long-term disability.1 Certain groups may bear a disproportionate burden of stroke. For example, according to the US Department of Health and Human Services Office of Minority Health, Black adults are 50% more likely to have a stroke than are White adults.2
The current American Heart Association/American Stroke Association prevention of stroke guidelines recommend use of risk prediction models to optimize screening and interventions.3,4 Beginning in 1991, the original Framingham Stroke Risk Profile (Framingham Stroke) estimated 10-year risk of developing stroke using key risk factors identified through epidemiological studies.5,6 Additional prediction tools have been introduced, including the revised Framingham Stroke,7 a risk stratification that only requires self-reported measures from the REGARDS study (Reasons for Geographic and Racial Differences in Stroke)8 and the pooled cohort equations.9 Although the pooled cohort equations model was designed to estimate 10-year risk of atherosclerotic cardiovascular disease (defined as myocardial infarction or any stroke or death from cardiovascular causes), it also has been suggested to estimate stroke risk. Yet there are limited data comparing the performance of these prediction tools in estimating stroke risk, especially among subgroups defined by sex, race, and age. Algorithms proposed to date have relied on traditional regression techniques, and there is paucity of information about the potential added predictive value offered by more complex machine learning algorithms.
This study compared the performance of the pooled cohort equations atherosclerotic cardiovascular disease model (hereafter pooled cohort equations) to that of 2 stroke-specific models (Framingham Stroke and REGARDS self-report) when applied to harmonized data from 4 large, National Institutes of Health (NIH)–funded cohort studies, with particular attention paid to different subgroups defined by sex, race (Black and White), and age. Moreover, the potential improvement in model performance offered by novel machine learning techniques was investigated.
Methods
Study Population
Cohort Characteristics
Details of the 4 US prospective cohort studies (Framingham Offspring, Atherosclerosis Risk in Communities [ARIC], Multi-Ethnic Study of Atherosclerosis [MESA], and REGARDS [eTable 1 in Supplement 1]) included in these analyses have been described.10,11,12,13 The studies were approved by institutional review boards of the participating institutions. All participants provided written informed consent at each examination. The deidentified data from the Framingham, ARIC, and MESA studies were obtained from the NIH dbGaP repository. The deidentified data from the REGARDS study were directly obtained from the REGARDS data coordinating center. This analysis included pooled, standardized, and harmonized individual participant data from the 4 cohorts. Participants who had multiple examinations within a given study could have contributed multiple data points if they had not developed stroke prior to the next baseline examination.14
The Framingham Offspring cohort included children of the predominantly White individuals participating in the Framingham Heart Study original cohort as well as their spouses. Framingham Offspring study began in 1971 with the enrollment of 5135 adults10 and subsequent examinations occurred every 3 to 8 years. The ARIC longitudinal study began between 1987 and 1999 with the enrollment of 15 792 adults aged 45 through 64 years in 4 communities: Forsyth County, North Carolina; Jackson, Mississippi (Black only); the northwestern suburbs of Minneapolis, Minnesota; and Washington County, Maryland. Three subsequent examinations were conducted approximately every 3 years (1990-1992, 1993-1995, and 1996-1998). The MESA study was initiated in July 2000 to investigate the prevalence, correlates, and progression of subclinical cardiovascular disease (CVD) in individuals without known CVD. This prospective cohort study included 6429 adults aged 45 to 84 years recruited from Baltimore, Maryland; Chicago, Illinois; Forsyth County, North Carolina; Los Angeles County, California; northern Manhattan, New York; and St Paul, Minnesota). The REGARDS data are derived from a population-based longitudinal study involving Black and White individuals who were at least 45 years of age. Recruited between 2003 and 2007, the sample was drawn from 1842 of the 3140 US counties (59%) using a combination of mail and telephone contact information. The study oversampled Black Americans and residents of the southeastern states (Alabama, Arkansas, Georgia, Louisiana, Mississippi, North Carolina, South Carolina, and Tennessee) and achieved a final sample of 30 239, more than 40% of whom were Black participants and more than 50% were residents of southeastern states.
Eligibility Criteria
Individuals were included in the analysis if they were at least 45 years of age; had no history of stroke or transient ischemic attack; and were Black or White race.
Data Harmonization
We included stroke risk factors as defined in previous stroke-risk model studies, including age, sex, race, smoking status, medical history of cardiovascular disease, atrial fibrillation, diabetes, hypertension medications, systolic blood pressure, total cholesterol and high-density lipoprotein cholesterol levels, prior myocardial infarction, educational level, and general health. We conducted data harmonization on stroke outcomes and their risk factors across the 4 cohorts. Because we worked with previously collected data, we needed to adapt data standards to what was already available. We found that the definitions of key stroke outcomes were not the same across the studies (eTable 2 in Supplement 1). Given the size and specific focus on stroke of the REGARDS study, we used its definitions as the starting point for the curation of stroke outcomes. Because the National Institute of Neurological Disorders and Stroke (NINDS) common data elements contain standards used by the ARIC study to define stroke and transient ischemic stroke, the curation of stroke outcome also relied on the NINDS common data elements where available. The curation of risk factors (listed in Table 1; eTable 3 in Supplement 1) followed a similar process, relying on NINDS common data elements where available. Given known differences in stroke risk by race, the race variable was included as a key exposure, understood as a social rather than biological construct. Race was self-reported in each study based on fixed categories. We conducted 2 steps to validate our data harmonization. In the first step, our clinical experts manually reviewed the definitions of common data elements and those of the study-specific and cohort-specific variables and verified that the definitions were sufficiently congruent. In the second step, we looked at summary statistics for each harmonized variable and various event rates adjusted for age, sex, race, and geography, and verified that the distributions of all variables were reasonable and consistent across cohorts. All definitions were recorded and stored in a publicly available repository hosted by the American Heart Association precision medicine platform alongside the source code.15
Table 1. Summary of Prediction Models and Risk Factors Included in the Analysis.
| Predictora | Previously published models | Machine learning models | |||
|---|---|---|---|---|---|
| Pooled cohort equations | Framingham Stroke | REGARDS self-report | CoxNET | Random survival forest | |
| Age | X | X | X | X | X |
| Sex | X | X | X | X | X |
| Race | X | X | X | X | |
| Education level | X | X | X | ||
| General health status | X | X | X | ||
| Smoking | X | X | X | X | X |
| Prior myocardial infarction | X | X | X | ||
| Past cardiovascular disease | X | X | X | ||
| Atrial fibrillation | X | X | X | X | |
| Diabetes | X | X | X | X | X |
| Total cholesterol | X | X | X | ||
| HDL cholesterol | X | X | X | ||
| Systolic BP | X | X | X | X | |
| Antihypertensive treatment | X | X | X | X | X |
Abbreviations: BP, blood pressure; CoxNet, elastic net–regularized Cox proportional hazards model; HDL, high-density lipoprotein; REGARDS, Reasons for Geographic and Racial Differences in Stroke.
The predictors are in the order of sociodemographic variables, health status and behavior, comorbid conditions, laboratory tests, vital signs, and treatment variables. See eTable 3 in Supplement 1 for additional details regarding risk factors and their relative contribution.
Missingness
We investigated the missing rate for each variable (eTable 4 in Supplement 1). Missing values were replaced by the subpopulation-specific means to avoid excluding participants with missing stroke risk due to missing covariate data.
Models for Comparison
We evaluated 2 sets of models in this study: (1) published models applied “as is” to our data—all studies combined and each sample individually; and (2) published models after recalibration plus 2 machine learning models developed using the combined Framingham Offspring, ARIC, and MESA samples applied to the REGARDS study data. Performance was evaluated within subpopulations stratified by race and sex and by race and age.
Published Models
We considered the following previously published models, with a summary of predictors included by each model given in Table 1.
1. The pooled cohort equations model9 was developed pooling data from NIH-funded cohorts to guide lipid-lowering treatment in primary prevention of atherosclerotic cardiovascular disease. The model estimated the 10-year risk, which included stroke. To estimate the risk of stroke, we multiplied each 10-year risk by a ratio of strokes to atherosclerotic cardiovascular disease events.
2. The updated Framingham Stroke model7 used data on individuals aged 55 through 84 years, free of stroke, who attended Framingham Original or Offspring Cohorts to estimate the probability of any stroke in the next 10 years.
3. The REGARDS self-report model8 estimated 10-year risk of stroke based solely on data reported by study participants.
Detailed formulas for each model are presented in the eMethods section in Supplement 1.
Published Models With Recalibration
To facilitate a fair comparison between existing and newly developed models, we recalibrated the 3 previously published models using combined data from the Framingham Offspring, ARIC, and MESA studies. Recalibration was based on calculating the linear predictor for each participant (regression coefficient for each variable × risk factor level) and estimating the baseline survival (10-year survival at-risk factor means) by equating the average 10-year risk to the corresponding observed 10-year Kaplan-Meier rate. For the Framingham Stroke model, recalibration was done by sex and for pooled cohort equations by sex and race.
Machine Learning Models
An elastic net–regularized Cox proportional hazards model (CoxNET)16 and a random survival forest model17 were developed using combined data from the Framingham Offspring, ARIC, and MESA studies (model details are included in the eMethods section in Supplement 1). These samples were divided at random into 2 sets used to train the models (70%) and tune model hyperparameters (30%), respectively. Hyperparameters included the strength of regularization (CoxNET) and the number of trees (random survival forest) and were chosen to maximize model discrimination within the tuning set.
Outcomes
The primary outcome was defined as the occurrence of ischemic or hemorrhagic stroke. Time to event or censoring was counted in the number of days since baseline, defined as the examination at which the participant became eligible for the follow-up. Events were censored at 12 years (4383 days). Performance metrics were evaluated at 10 years.
Statistical Analysis
Evaluation of model performance followed broadly accepted standards described in the TRIPOD (Transparent Reporting of a Multivariable Prediction Model for Individual Prognosis or Diagnosis18) statement. Model discrimination was assessed using the Uno survival C index19 and the Brier score–based R2 analysis.20 Calibration in the large was assessed comparing expected vs observed event rates in the samples of interest, with 1 indicating the desired mean calibration; values less than 1 signaling risk overestimation; and values more than 1 risk underestimation. Clinical utility was determined using standardized net benefit plotted against possible classification thresholds.21 Agreement between the models was assessed with Spearman correlation coefficients and the κ statistic. Asymptotic methods were used to quantify variability and construct 95% CIs.19 Statistical testing used a 2-sided significance level of .05. Because of the potential for type I error due to multiple comparisons, findings for analyses should be interpreted as exploratory. All analyses were performed using SAS version 9.4 TS1M7 (SAS Institute Inc) and Python version 3.7.
Results
The overall study sample included 62 482 records; breakdown by individual study is presented in eTable 1 in Supplement 1. Baseline characteristics of participants by study and contributing examination are summarized in Table 2. The median age of the pooled sample was 61 years; 54% were women; and 29% were Black individuals. The percentage of Black participants was the highest in the REGARDS study (40.8%), followed by MESA (39.8%) and ARIC (25.5% and 20.8% at examinations 1 and 4, respectively). There were no Black participants in Framingham Offspring. The median systolic blood pressure was consistent across samples ranging from 119 mm Hg to 127 mm Hg. The prevalence of diabetes was the highest in the REGARDS sample (23.5%) and so was the prevalence of atrial fibrillation (7.9%) and prior myocardial infarction (11.5%). During the median follow-up of 10 years (last follow-up in 2019), there were 2199 stroke events with the highest number and percentage in the REGARDS sample (Table 2). There were differences in event rates by race. In the combined sample, the 10-year rate was 2.9% in White women vs 5.2% in Black women (P value <.001); in men it was 4.2% in White men vs 6.1% in Black men (P value <.001).
Table 2. Baseline Characteristics and Stroke Outcomes for the 4 US Prospective Cohort Studies: Framingham Offspring Study, Atherosclerosis Risk in Communities, Multi-Ethnic Study of Atherosclerosis, and Reasons for Geographic and Racial Differences in Stroke Studies.
| Characteristics | No./total (%) | ||||||
|---|---|---|---|---|---|---|---|
| Framingham examinations | ARIC examinations | MESA, examination 1 (n = 4182) | REGARDS, examination 1 (n = 27 032) | ||||
| No. 3 (n = 2294) | No. 6 (n = 3118) | No. 8 (n = 2843) | No. 1 (n = 13 484) | No. 4 (n = 9529) | |||
| Calendar year for examinations | 1983-87 | 1995-98 | 2005-08 | 1987-89 | 1996-99 | 2000-02 | 2003-07 |
| Age, median (IQR), y | 54 (49-60) | 59 (53-67) | 66 (60-73) | 54 (49-59) | 63 (58-68) | 63 (54-71) | 64 (58-71) |
| Sex | |||||||
| Male | 1123 (49.0) | 1447 (46.4) | 1280 (45.0) | 6276 (46.5) | 4368 (45.8) | 1968 (47.1) | 12 090 (44.7) |
| Female | 1171 (51.0) | 1671 (53.6) | 1563 (55.0) | 7208 (53.5) | 5161 (54.2) | 2214 (52.9) | 14 942 (55.3) |
| Racea | |||||||
| Black | 0 | 0 | 0 | 3445 (25.5) | 1982 (20.8) | 1666 (39.8) | 11 029 (40.8) |
| White | 2294 (100.0) | 3118 (100.0) | 2843 (100.0) | 10 039 (74.5) | 7547 (79.2) | 2516 (60.2) | 16 003 (59.2) |
| Systolic BP, median (IQR), mm Hg | 127 (117-139) [n = 2294] | 127 (116-139) [n = 3116] | 127 (116-139) [n = 2839] | 119 (108-132) [n = 13 471] | 125 (114-139) [n = 9517] | 124 (112-140) [n = 4180] | 125 (117-137) [n = 26 968] |
| Medical history | |||||||
| Atrial fibrillation | 10/2290 (0.4) | 27/3118 (0.9) | 57/2842 (2.0) | 19/13 484 (0.1) | 230/9529 (2.4) | 0/4182 | 2102/26 454 (7.9) |
| Current smoker | 605/2293 (26.4) | 455/3118 (14.6) | 248/2839 (8.7) | 3578/13 469 (26.6) | 1414/9442 (15.0) | 592/4163 (14.2) | 3834/26 925 (14.2) |
| Diabetes | 125/2221 (5.6) | 319/3084 (10.3) | 377/2754 (13.7) | 1632/13 366 (12.2) | 1596/9412 (17.0) | 431/4170 (10.3) | 6322/26 956 (23.5) |
| Hypertension | 536/2291 (23.4) | 902/3107 (29.0) | 1374/2840 (48.4) | 3391/13 407 (25.3) | 3427/9472 (36.2) | 1671/4179 (40.0) | 13 282/25 953 (51.2) |
| Previous cardiovascular disease | 199/2294 (8.7) | 316/3118 (10.1) | 374/2843 (13.2) | 1665/13 484 (12.3) | 1699/9529 (17.8) | 21/4182 (0.5) | 4311/26 482 (16.3) |
| Prior myocardial infarction | 94/2294 (4.1) | 140/3118 (4.5) | 159/2843 (5.6) | 533/13 484 (4.0) | 727/9529 (7.6) | 0/4182 | 3045/26 553 (11.5) |
| Total cholesterol, median (IQR), mg/dL | 220 (195-245) [n = 2222] | 204 (181-231) [n = 3079] | 185 (161-211) [n = 2744] | 213 (187-240) [n = 13 278] | 198 (176-223) [n = 9452] | 192 (170-215) [n = 4170] | 190 (165-217) [n = 25 932] |
| HDL-C, median (IQR), mg/dL | 48 (40-60) [n = 2212] | 49 (40-61) [n = 3070] | 55 (44-68) [n = 2737] | 48 (39-61) [n = 13 270] | 47 (38-59) [n = 9446] | 50 (41-61) [n = 4166] | 49 (40-61) [n = 25 788] |
| Education level | |||||||
| <High school | 213/2038 (10.5) | 165/2710 (6.1) | 118/2425 (4.9) | 3217/13 460 (23.9) | 1797/9514 (18.9) | 317/4162 (7.6) | 3144/27 015 (11.6) |
| High school | 755/2038 (37.0) | 920/2710 (33.9) | 786/2425 (32.4) | 4420/13 460 (32.8) | 3242/9514 (34.1) | 745/4162 (17.9) | 6954/27 015 (25.7) |
| Some college | 527/2038 (25.9) | 756/2710 (27.9) | 677/2425 (27.9) | 3073/13 460 (22.8) | 2280/9514 (24.0) | 1295/4162 (31.1) | 7265/27 015 (26.9) |
| Completed college | 543/2038 (26.6) | 869/2710 (32.1) | 844/2425 (34.8) | 2750/13 460 (20.4) | 2195/9514 (23.1) | 1805/4162 (43.4) | 9652/27 015 (35.7) |
| Self-reported general health | |||||||
| Excellent | 1118/3089 (36.2) | 520/2787 (18.7) | 4518/13 476 (33.5) | 783/4488 (17.4) | 590/3868 (15.3) | 4591/26 979 (17.0) | |
| Very good | 0/3089 (0.0) | 1193/2787 (42.8) | 0/13 476 (0.0) | 1685/4488 (37.5) | 1562/3868 (40.4) | 8557/26 979 (31.7) | |
| Good | 1712/3089 (55.4) | 900/2787 (32.3) | 6335/13 476 (47.0) | 1521/4488 (33.9) | 1365/3868 (35.3) | 9436/26 979 (35.0) | |
| Fair | 242/3089 (7.8) | 158/2787 (5.7) | 2196/13 476 (16.3) | 446/4488 (9.9) | 319/3868 (8.2) | 3642/26 979 (13.5) | |
| Poor | 17/3089 (0.6) | 16/2787 (0.6) | 427/13 476 (3.2) | 53/4488 (1.2) | 32/3868 (0.8) | 753/26 979 (2.8) | |
| Follow-up, median (IQR), y | 11.2 (10.6-11.4) | 9.4 (8.7-10.4) | 12.1 (9.8-12.8) | 8.9 (8.8-9.2) | 18.3 (12.4-19.5) | 10.2 (9.7-10.7) | 11.5 (6.1-14.0) |
| Any stroke at 10 y | 37 (1.6) | 81 (2.6) | 115 (4.0) | 358 (2.7) | 369 (3.9) | 108 (2.6) | 1131 (4.2) |
Abbreviations: ARIC, Atherosclerosis Risk in Communities; BP, blood pressure; HDL-C, high-density lipoprotein cholesterol; MESA, Multi-Ethnic Study of Atherosclerosis; REGARDS, Reasons for Geographic and Racial Differences in Stroke.
SI conversion factor: To convert cholesterol from mg/dL to mmol/L, multiply by 0.0259.
Race was self-reported in each cohort based on fixed categories; races other than Black and White were excluded from this study due to insufficient sample size for a meaningful analysis.
Performance of Published Models
Relative importance of predictors included in each of the models is given in eTable 3 in Supplement 1.
Discrimination
In the combined sample, model discrimination quantified by the C index was not significantly different for the 3 models considered (pooled cohort equations, 0.72; [95% CI, 0.71-0.73]; Framingham Stroke, 0.72 [95% CI, 0.72-0.73]; and REGARDS self-report, 0.73 [95% CI, 0.72-0.74]), with differences not exceeding 0.01 (all P values >.05, eTable 5 in Supplement 1). Differences did not exceed 0.02 within individual studies (Figure; eFigure 1 and eTable 5 in Supplement 1). The Figure depicts differences in model discrimination between the 3 risk algorithms for all race, sex, and age combinations considered. The narrow sections of changing colors illustrate small differences in C indexes between risk models. For example, among Black women in the ARIC study, the C index was 0.72 for the REGARDS self-report model (blue peak in the Figure) and 0.74 for the pooled cohort equations model (orange peak above blue in the Figure). The REGARDS self-report model numerically outperformed the other models in most subsets of REGARDS data (blue peaks in the Figure) and was never statistically significantly worse (eTable 5 in Supplement 1).
Figure. Comparison of C Index for Stroke Risk Prediction by Race, Sex, and Age.
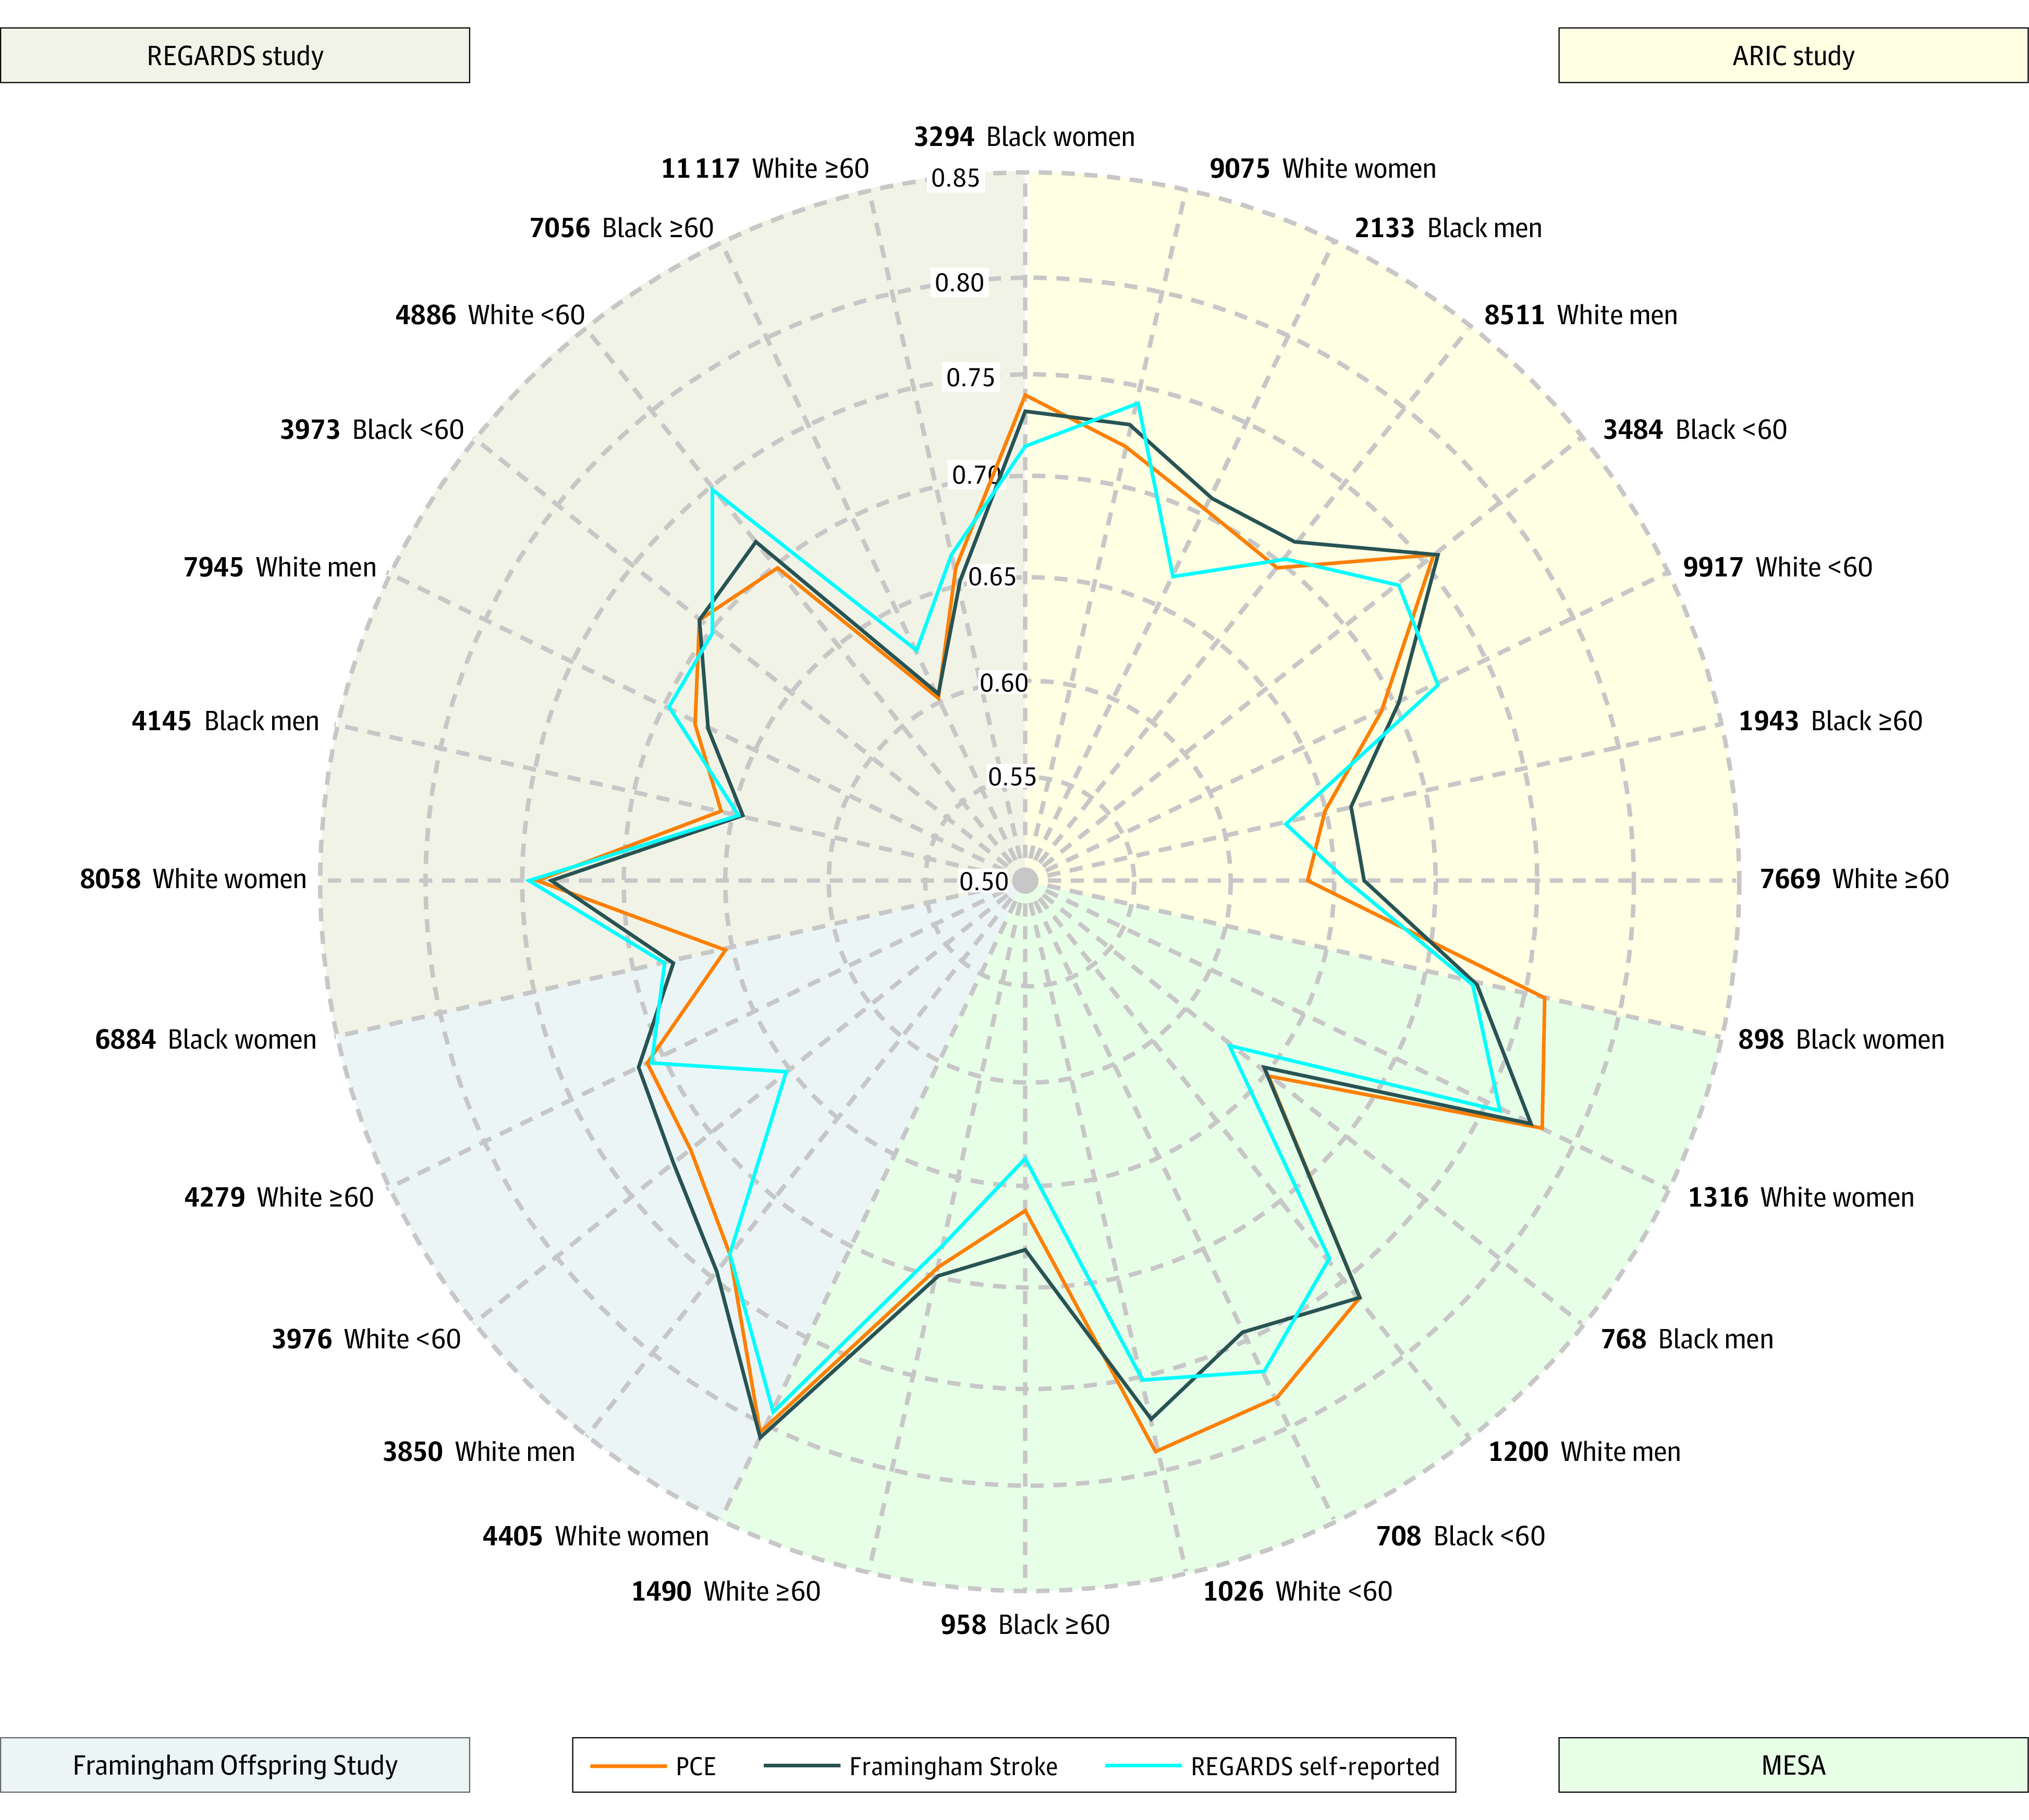
The concordance index (C index) is a single-metric generalization of the area under the receiver operating characteristic curve and ranges from 0.5 (the origin, indicating no better ordering of predicted risks than chance) and 1 (perfect ordering). The radar plot depicts C indexes for 3 previously published models (pooled cohort equations [PCEs], Framingham Stroke, and Reasons for Geographical and Racial Differences in Stroke [REGARDS] self-report) in 4 different cohorts (Framingham Offspring, Atherosclerosis Risk in Communities [ARIC], Multi-Ethnic Study for Atherosclerosis [MESA], and REGARDS) and 8 demographic groups (Black women, White women, Black men, White men, Black <60 years, White <60 years, Black ≥60 years, White ≥60 years). Specifically, each axis in the radar plot represents 1 combination of a cohort and demographic group (eg, Black women of ARIC); the C indexes from different cohorts and demographic groups are plotted along each axis and connected to form a polygon.
In contrast to the event rates which were higher among Black individuals than among White individuals, model discrimination was significantly better among White individuals than among Black individuals and better among women than among men: in the combined sample, among White women, the C indexes were 0.76 for all 3 models (pooled cohort equations, Framingham Stroke, and REGARDS self-report) and 0.69 for Black women (all P values ≤.001, eTable 6 in Supplement 1). The C indexes ranged between 0.71 and 0.72 for White men and between 0.64 and 0.66 for Black men (all P values <.001, eTable 6 in Supplement 1). This indicates significantly weaker ability to distinguish between higher and lower risk among Black vs White individuals. When stratified by age, model performance was better for younger (<60 years) vs older (>60 years) adults, for both Black and White individuals (eTable 6 in Supplement 1). Model performance was the weakest for older Black men, with C indexes ranging from 0.61 and 0.62 in this group compared with 0.67 for older White men (all P values <.001, eTable 6 in Supplement 1).
Calibration
The REGARDS self-report model had the best calibration in the large as evidenced by the ratios of observed to expected 10-year stroke rates closest to 1 in the combined sample (1.05; 95% CI, 1.00-1.09) and in race, sex and age subgroups (Table 3; eFigure 2 in Supplement 1). The pooled cohort equations models with adjustment for stroke overestimated observed risk (observed to expected ratios <1), often by a large amount: in the combined sample, the observed 10-year risk of stroke was 4.08% but the expected rate was 5.54% (observed to expected ratio, 0.74; 95% CI, 0.71-0.77, Table 3). In the majority of subgroups, all models overestimated risk in the Framingham Offspring and MESA studies (calibration ratios <1, Table 3). In the majority of subgroups, Framingham Stroke and REGARDS self-report underestimated risk in ARIC (calibration ratios >1, Table 3).
Table 3. Calibration Ratios of Observed vs Expected Event Rates for Previously Developed Models .
| Cohort and subgroup | No. | Events | Published models, % | Observed to expected ratio (95% CI)b | |||||||
|---|---|---|---|---|---|---|---|---|---|---|---|
| Pooled cohort equationsa | Framingham Stroke | REGARDS self-report | |||||||||
| Observed | Expected | Observed | Expected | Observed | Expected | Pooled cohort equations | Framingham Stroke | REGARDS self-report | |||
| Framingham Offspring, ARIC, MESA, and REGARDS study combined | |||||||||||
| Everyone | 62 482 | 2199 | 4.08 | 5.54 | 4.08 | 4.77 | 4.08 | 3.90 | 0.74 (0.71-0.77) | 0.86 (0.82-0.89) | 1.05 (1.00-1.09) |
| Black women | 11 076 | 479 | 5.23 | 8.08 | 5.23 | 4.40 | 5.23 | 4.28 | 0.65 (0.59-0.71) | 1.19 (1.09-1.30) | 1.22 (1.12-1.33) |
| White women | 22 854 | 594 | 2.92 | 4.18 | 2.92 | 3.42 | 2.92 | 2.94 | 0.70 (0.65-0.76) | 0.85 (0.79-0.93) | 0.99 (0.92-1.08) |
| Black men | 7046 | 348 | 6.13 | 7.79 | 6.13 | 7.37 | 6.13 | 5.67 | 0.79 (0.71-0.87) | 0.83 (0.75-0.92) | 1.08 (0.98-1.20) |
| White men | 21 506 | 778 | 4.16 | 4.95 | 4.16 | 5.53 | 4.16 | 4.16 | 0.84 (0.78-0.90) | 0.75 (0.70-0.81) | 1.00 (0.93-1.07) |
| Black <60 y | 8165 | 270 | 4.05 | 4.71 | 4.05 | 2.55 | 4.05 | 3.00 | 0.86 (0.76-0.97) | 1.59 (1.41-1.79) | 1.35 (1.20-1.52) |
| White <60 y | 19 805 | 246 | 1.40 | 1.87 | 1.40 | 1.65 | 1.40 | 1.48 | 0.75 (0.66-0.85) | 0.85 (0.75-0.96) | 0.95 (0.83-1.07) |
| Black ≥60 y | 9957 | 557 | 6.85 | 10.39 | 6.85 | 8.03 | 6.85 | 6.33 | 0.66 (0.61-0.72) | 0.85 (0.79-0.93) | 1.08 (1.00-1.17) |
| White ≥60 y | 24 555 | 1126 | 5.27 | 6.67 | 5.27 | 6.71 | 5.27 | 5.19 | 0.79 (0.75-0.84) | 0.79 (0.74-0.83) | 1.02 (0.96-1.08) |
| Framingham Offspring | |||||||||||
| Everyone | 8255 | 233 | 3.09 | 4.75 | 3.09 | 4.40 | 3.09 | 3.40 | 0.65 (0.57-0.74) | 0.70 (0.62-0.80) | 0.91 (0.80-1.03) |
| White women | 4405 | 105 | 2.57 | 4.66 | 2.57 | 3.48 | 2.57 | 2.96 | 0.55 (0.46-0.67) | 0.74 (0.61-0.89) | 0.87 (0.72-1.05) |
| White men | 3850 | 128 | 3.71 | 4.86 | 3.71 | 5.46 | 3.71 | 3.89 | 0.76 (0.64-0.91) | 0.68 (0.57-0.81) | 0.95 (0.80-1.13) |
| White <60 y | 3976 | 39 | 1.06 | 1.87 | 1.06 | 1.56 | 1.06 | 1.38 | 0.57 (0.42-0.78) | 0.68 (0.50-0.94) | 0.77 (0.56-1.06) |
| White ≥60 y | 4279 | 194 | 5.09 | 7.34 | 5.09 | 7.05 | 5.09 | 5.27 | 0.69 (0.61-0.80) | 0.72 (0.63-0.83) | 0.97 (0.84-1.11) |
| ARIC | |||||||||||
| Everyone | 23 013 | 727 | 3.57 | 3.98 | 3.57 | 3.06 | 3.57 | 2.77 | 0.90 (0.83-0.97) | 1.17 (1.08-1.255) | 1.29 (1.20-1.39) |
| Black women | 3294 | 159 | 5.50 | 6.36 | 5.50 | 2.39 | 5.50 | 3.25 | 0.87 (0.74-1.01) | 2.30 (1.97-2.68) | 1.69 (1.45-1.98) |
| White women | 9075 | 181 | 2.20 | 2.64 | 2.20 | 1.98 | 2.20 | 2.08 | 0.83 (0.72-0.97) | 1.11 (0.96-1.29) | 1.06 (0.91-1.22) |
| Black men | 2133 | 133 | 7.46 | 6.41 | 7.46 | 5.43 | 7.46 | 4.47 | 1.17 (0.98-1.38) | 1.37 (1.16-1.63) | 1.67 (1.41-1.98) |
| White men | 8511 | 254 | 3.38 | 3.87 | 3.38 | 3.87 | 3.38 | 2.92 | 0.87 (0.77-0.99) | 0.87 (0.77-0.99) | 1.16 (1.02-1.31) |
| Black <60 y | 3484 | 158 | 5.25 | 4.62 | 5.25 | 2.30 | 5.25 | 2.92 | 1.14 (0.97-1.33) | 2.29 (1.95-2.67) | 1.80 (1.54-2.10) |
| White <60 y | 9917 | 132 | 1.50 | 1.90 | 1.50 | 1.53 | 1.50 | 1.50 | 0.79 (0.66-0.94) | 0.98 (0.82-1.18) | 1.00 (0.83-1.19) |
| Black ≥60 y | 1943 | 134 | 8.03 | 9.29 | 8.03 | 5.90 | 8.03 | 5.21 | 0.86 (0.73-1.02) | 1.36 (1.15-1.60) | 1.54 (1.31-1.82) |
| White ≥60 y | 7669 | 303 | 4.37 | 4.96 | 4.37 | 4.68 | 4.37 | 3.77 | 0.88 (0.88-0.98) | 0.93 (0.84-1.04) | 1.16 (1.04-1.29) |
| MESA | |||||||||||
| Everyone | 4182 | 108 | 2.79 | 5.79 | 2.79 | 4.81 | 2.79 | 3.75 | 0.48 (0.40-0.58) | 0.58 (0.48-0.70) | 0.75 (0.62-0.90) |
| Black women | 898 | 24 | 2.90 | 7.45 | 2.90 | 4.63 | 2.90 | 3.76 | 0.39 (0.26-0.58) | 0.63 (0.42-0.93) | 0.77 (0.52-1.15) |
| White women | 1316 | 34 | 2.70 | 4.74 | 2.70 | 3.88 | 2.70 | 2.99 | 0.57 (0.41-0.79) | 0.70 (0.50-0.97) | 0.90 (0.65-1.26) |
| Black men | 768 | 21 | 3.11 | 7.27 | 3.11 | 6.46 | 3.11 | 5.04 | 0.43 (0.28-0.65) | 0.48 (0.32-0.74) | 0.62 (0.40-0.94) |
| White men | 1200 | 29 | 2.63 | 4.74 | 2.63 | 4.90 | 2.63 | 3.75 | 0.55 (0.39-0.79) | 0.54 (0.37-0.77) | 0.70 (0.49-1.01) |
| Black <60 y | 708 | 14 | 2.16 | 3.67 | 2.16 | 1.83 | 2.16 | 2.36 | 0.59 (0.35-0.99) | 1.18 (0.70-1.98) | 0.92 (0.55-1.54) |
| White <60 y | 1026 | 10 | 1.00 | 1.34 | 1.00 | 1.15 | 1.00 | 1.12 | 0.75 (0.40-1.30) | 0.87 (0.47-1.62) | 0.90 (0.49-1.67) |
| Black ≥60 y | 958 | 31 | 3.61 | 10.11 | 3.61 | 8.16 | 3.61 | 5.83 | 0.36 (0.25-0.51) | 0.44 (0.31-0.63) | 0.62 (0.44-0.88) |
| White ≥60 y | 1490 | 53 | 3.86 | 7.09 | 3.86 | 6.58 | 3.86 | 4.89 | 0.55 (0.42-0.71) | 0.59 (0.45-0.77) | 0.79 (0.61-1.03) |
| REGARDS | |||||||||||
| Everyone | 27 032 | 1131 | 5.15 | 7.08 | 5.15 | 6.33 | 5.15 | 5.04 | 0.73 (0.69-0.77) | 0.81 (0.77-0.86) | 1.02 (0.96-1.08) |
| Black women | 6884 | 296 | 5.43 | 8.99 | 5.43 | 5.33 | 5.43 | 4.84 | 0.60 (0.54-0.68) | 1.02 (0.91-1.14) | 1.12 (1.00-1.25) |
| White women | 8058 | 274 | 4.08 | 5.56 | 4.08 | 4.93 | 4.08 | 3.89 | 0.73 (0.65-0.83) | 0.83 (0.74-0.93) | 1.05 (0.93-1.18) |
| Black men | 4145 | 194 | 6.01 | 8.60 | 6.01 | 8.54 | 6.01 | 6.41 | 0.70 (0.61-0.80) | 0.70 (0.61-0.81) | 0.94 (0.82-1.08) |
| White men | 7945 | 367 | 5.58 | 6.18 | 5.58 | 7.45 | 5.58 | 5.67 | 0.90 (0.82-1.00) | 0.75 (0.68-0.83) | 0.98 (0.89-1.09) |
| Black <60 y | 3973 | 98 | 3.23 | 4.99 | 3.23 | 2.89 | 3.23 | 3.17 | 0.65 (0.53-0.79) | 1.12 (0.92-1.36) | 1.02 (0.84-1.24) |
| White <60 y | 4886 | 65 | 1.61 | 1.94 | 1.61 | 2.06 | 1.61 | 1.59 | 0.84 (0.66-1.06) | 0.78 (0.61-1.00) | 1.07 (0.80-1.30) |
| Black ≥60 y | 7056 | 392 | 6.97 | 10.74 | 6.97 | 8.59 | 6.97 | 6.70 | 0.65 (0.59-0.72) | 0.81 (0.74-0.90) | 1.04 (0.94-1.15) |
| White ≥60 y | 11 117 | 576 | 6.25 | 7.54 | 6.25 | 8.00 | 6.25 | 6.17 | 0.83 (0.77-0.90) | 0.78 (0.72-0.85) | 1.01 (0.93-1.10) |
Abbreviations: ARIC, Atherosclerosis Risk in Communities; MESA, Multi-Ethnic Study of Atherosclerosis; REGARDS, Reasons for Geographic and Racial Differences in Stroke.
Expected probabilities were adjusted by stroke calibration factors: Black women: 0.57, White women: 0.47, Black men: 0.43, Black women: 0.30.
The CI of observed to expected ratio was approximated using the approach presented in Debray et al.22
Performance of Published Models With Recalibration and Machine Learning Models
There was a high level of agreement between pooled cohort equations, Framingham Stroke, and REGARDS self-report models and the CoxNET model, with Spearman correlations ranging from 0.83 to 0.89 and κ statistics between 0.63 to 0.70 (eTables 7 and 8 in Supplement 1). The agreement between the random survival forest and all other models was weaker, with Spearman correlations ranging from 0.68 to 0.82 and κ statistics ranging from 0.51 to 0.63.
The added value of complex machine learning models developed on the Framingham, ARIC, and MESA samples and applied to REGARDS data was limited (Table 4). Discrimination C indexes were numerically the highest for the CoxNET model across the 4 subgroups (Black women, Black men, White women, and White men) but the gains were less than 0.02 over the next best model. Neither of the 2 machine learning models achieved a C index higher than 0.70, except in White women, where all other models also had C indexes higher than 0.70. The random survival forest model displayed the weakest discriminatory ability, indicating better performance of other models relative to the random survival forest. Although CoxNET had better discrimination than the random survival forest in all subgroups, it overpredicted risk in Black women and men (Table 4). The random survival forest model tended to have better calibration (Table 4).
Table 4. C Index, Brier Score, and Observed and Expected Risk for Recalibrated Models and Machine Learning Models in the REGARDS Cohort.
| Recalibrated published modelsa | Machine learning models | ||||
|---|---|---|---|---|---|
| Pooled cohort equations | Framingham Stroke | REGARDS self-report | CoxNET | Random survival forest | |
| Stratified by sex and race | |||||
| Black women | |||||
| No. | 6884 | ||||
| Events | 296 | ||||
| Statistic (95% CI) | |||||
| C indexb | 0.65 (0.62-0.68) | 0.68 (0.65-0.71) | 0.68 (0.65-0.72) | 0.70 (0.67-0.72) | 0.67 (0.65-0.69) |
| Brier, %c | 5.74 (4.90-6.59) | 5.12 (4.29-5.96) | 4.97 (4.12-5.82) | 5.09 (4.28-5.89) | 5.04 (4.21-5.88) |
| Event rate, % | |||||
| Observed | 5.43 | 5.43 | 5.43 | 5.43 | 5.43 |
| Expected | 7.26 | 5.80 | 5.44 | 7.04 | 5.72 |
| Observed to expected ratio (95% CI) | 0.75 (0.67-0.84) | 0.94 (0.84-1.05) | 1.00 (0.89-1.12) | 0.77 (0.69-0.86) | 0.95 (0.85-1.06) |
| White women | |||||
| No. | 8058 | ||||
| Events | 274 | ||||
| Statistic (95% CI) | |||||
| C indexb | 0.74 (0.72-0.77) | 0.74 (0.71-0.76) | 0.74 (0.72-0.77) | 0.75 (0.72-0.77) | 0.73 (0.70-0.75) |
| Brier, %c | 3.74 (3.04-4.44) | 3.79 (3.12-4.46) | 3.70 (3.00-4.41) | 3.76 (3.04-4.48) | 3.78 (3.08-4.48) |
| Event rate, % | |||||
| Observed | 4.08 | 4.08 | 4.08 | 4.08 | 4.08 |
| Expected | 3.94 | 5.37 | 4.37 | 3.74 | 4.26 |
| Observed to expected ratio (95% CI) | 1.04 (0.92-1.17) | 0.76 (0.68-0.85) | 0.93 (0.83-1.05) | 1.09 (0.97-1.23) | 0.96 (0.85-1.08) |
| Black men | |||||
| No. | 4145 | ||||
| Events | 194 | ||||
| Statistic (95% CI) | |||||
| C indexb | 0.65 (0.61-0.70) | 0.64 (0.61-0.68) | 0.65 (0.60-0.69) | 0.66 (0.62-0.69) | 0.63 (0.59-0.67) |
| Brier, %c | 5.52 (4.66-6.39) | 5.53 (4.64-6.42) | 5.46 (4.56-6.35) | 5.56 (4.72-6.40) | 5.60 (4.69-6.51) |
| Event rate, % | |||||
| Observed | 6.01 | 6.01 | 6.01 | 6.01 | 6.01 |
| Expected | 8.24 | 7.17 | 7.23 | 9.28 | 6.82 |
| Observed to expected ratio (95% CI) | 0.73 (0.64-0.84) | 0.84 (0.73-0.96) | 0.83 (0.72-0.96) | 0.65 (0.56-0.74) | 0.88 (0.77-1.01) |
| White men | |||||
| No. | 7945 | ||||
| Events | 367 | ||||
| Statistic (95% CI) | |||||
| C indexb | 0.68 (0.66-0.70) | 0.68 (0.65-0.69) | 0.69 (0.67-0.72) | 0.69 (0.67-0.70) | 0.66 (0.63-0.68) |
| Brier, %c | 5.11 (4.34-5.89) | 5.12 (4.37-5.87) | 5.00 (4.26-5.74) | 5.09 (4.33-5.85) | 5.14 (4.37-5.91) |
| Event rate, % | |||||
| Observed | 5.58 | 5.58 | 5.58 | 5.58 | 5.58 |
| Expected | 5.25 | 6.26 | 6.40 | 5.80 | 5.40 |
| Observed to expected ratio (95% CI) | 1.06 (0.96-1.17) | 0.89 (0.81-0.99) | 0.87 (0.79-0.96) | 0.96 (0.87-1.06) | 1.03 (0.93-1.14) |
| Stratified by age and race | |||||
| Black <60 y | |||||
| No. | 3973 | ||||
| Events | 98 | ||||
| Statistic (95% CI) | |||||
| C indexb | 0.71 (0.66-0.76) | 0.71 (0.66-0.76) | 0.69 (0.65-0.73) | 0.73 (0.68-0.78) | 0.71 (0.65-0.77) |
| Brier, %c | 3.09 (2.40-3.78) | 3.07 (2.35-3.78) | 3.07 (2.36-3.79) | 3.07 (2.38-3.76) | 3.10 (2.42-3.78) |
| Event rate, % | |||||
| Observed | 3.23 | 3.23 | 3.23 | 3.23 | 3.23 |
| Expected | 4.10 | 2.71 | 3.54 | 4.15 | 4.41 |
| Observed to expected ratio (95% CI) | 0.79 (0.65-0.96) | 1.19 (0.98-1.45) | 0.91 (0.75-1.11) | 0.78 (0.64-0.95) | 0.73 (0.60-0.89) |
| White <60 y | |||||
| No. | 4886 | ||||
| Events | 65 | ||||
| Statistic (95% CI) | |||||
| C indexb | 0.71 (0.64-0.77) | 0.72 (0.67-0.78) | 0.75 (0.69-0.80) | 0.74 (0.68-0.80) | 0.72 (0.65-0.78) |
| Brier, %c | 1.57 (1.11-2.04) | 1.57 (1.12-2.03) | 1.56 (1.10-2.02) | 1.56 (1.11-2.01) | 1.59 (1.14-2.05) |
| Event rate, % | |||||
| Observed | 1.61 | 1.61 | 1.61 | 1.61 | 1.61 |
| Expected | 1.37 | 1.90 | 1.76 | 2.05 | 2.04 |
| Observed to expected ratio (95% CI) | 1.18 (0.93-1.50) | 0.85 (0.67-1.09) | 0.92 (0.72-1.17) | 0.79 (0.62-1.00) | 0.79 (0.62-1.01) |
| Black ≥60 y | |||||
| No. | 7056 | ||||
| Events | 392 | ||||
| Statistic (95% CI) | |||||
| C indexb | 0.60 (0.57-0.63) | 0.61 (0.58-0.64) | 0.63 (0.60-0.67) | 0.63 (0.61-0.66) | 0.61 (0.59-0.64) |
| Brier, %c | 6.60 (5.70-7.49) | 6.50 (5.60-7.41) | 6.30 (5.38-7.22) | 6.49 (5.62-7.35) | 6.43 (5.51-7.36) |
| Event rate, % | |||||
| Observed | 6.97 | 6.97 | 6.97 | 6.97 | 6.97 |
| Expected | 9.28 | 8.35 | 7.55 | 9.98 | 7.11 |
| Observed to expected ratio (95% CI) | 0.75 (0.68-0.83) | 0.84 (0.76-0.92) | 0.92 (0.84-1.02) | 0.70 (0.63-0.77) | 0.98 (0.89-1.08) |
| White ≥60 y | |||||
| No. | 11 117 | ||||
| Events | 576 | ||||
| Statistic (95% CI) | |||||
| C indexb | 0.66 (0.64-0.68) | 0.65 (0.63-0.67) | 0.66 (0.64-0.68) | 0.66 (0.64-0.68) | 0.64 (0.62-0.66) |
| Brier, %c | 5.67 (4.86-6.49) | 5.74 (4.96-6.52) | 5.60 (4.80-6.39) | 5.70 (4.88-6.51) | 5.74 (4.92-6.55) |
| Event rate, % | |||||
| Observed | 6.25 | 6.25 | 6.25 | 6.25 | 6.25 |
| Expected | 5.96 | 7.53 | 6.96 | 5.95 | 6.05 |
| Observed to expected ratio (95% CI)c | 1.05 (0.97-1.14) | 0.83 (0.77-0.90) | 0.90 (0.83-0.97) | 1.05 (0.97-1.14) | 1.03 (0.95-1.12) |
Abbreviations: ARIC, Atherosclerosis Risk in Communities; CoxNET, elastic net–regularized Cox proportional hazards model; MESA, Multi-Ethnic Study of Atherosclerosis; REGARDS, Reasons for Geographic and Racial Differences in Stroke.
The pooled cohort equations, Framingham Stroke, and REGARDS self-report models were calibrated in the combined sample of Framingham Offspring, ARIC, and MESA studies.
The concordance index (C index) is a single-metric generalization of the area under the receiver operating characteristic curve and ranges from 0.5 (the origin, indicating no better ordering of predicted risks than chance) and 1 (perfect ordering).
The measure of the average squared distances between the observed survival status and the predicted survival probability.
The small differences in C indexes translated into small differences in clinical utility quantified by net benefit,23 a weighted difference between true-positives and false-positives when using the prediction model to classify individuals as high risk.23 eFigure 3 in Supplement 1 shows decision curves, which plotted net benefit against risk classification threshold for the 5 models considered. The curves largely overlap across the range suggesting small differences in clinical utility within subgroups of interest.
Discussion
Existing stroke-specific risk prediction models and novel machine learning techniques did not significantly improve discriminative accuracy for new-onset stroke compared with the American Heart Association–American College of Cardiology atherosclerotic cardiovascular disease–focused pooled cohort equations when applied to harmonized data on individuals without stroke or transient ischemic stroke from 4 US cohorts. Established prediction models generally overestimated risk with the best performance exhibited by the REGARDS model based on self-reported risk factors. Significant discrepancies were observed between event rates and model discrimination by race. Although event rates were substantially higher in Black individuals than in White individuals, the ability to risk rank individuals was significantly weaker for Black participants than for White participants for both sexes.
This inferior risk ordering for Black vs White individuals may lead to erroneous resource allocation, where higher-risk individuals do not receive beneficial therapy and lower-risk individuals are overtreated. The weak discrimination was largely driven by the results in the REGARDS sample, the largest sample of Black individuals available for the analyses. When the results were stratified by age, the performance was unacceptably weak for Black adults older than 60 years. This weakness was again particularly pronounced in the REGARDS sample; however, C indexes were lower than 0.70 on all samples among Black adults older than 60 years.
In most instances, the 3 published algorithms overestimated risk. The REGARDS self-report model had the best calibration, which can be partially explained by the fact that the REGARDS study, on which this model was developed, was the largest contributor to our analytic sample. However, the REGARDS self-report model also calibrated reasonably well in both the MESA and Framingham models but underestimated risk among Black individuals in the ARIC study. In the latter sample, the best calibration was achieved by the pooled cohort equations model.
Calibration, the agreement between predicted and observed risks, is commonly poor for subpopulations that were underrepresented in the development set of the models, resulting in bias and reduced performance for these subpopulations.24 However, this study revealed more striking differences by race in terms of model discrimination than calibration. These findings have different implications. Differences in predicted vs observed risks by race or other characteristic (ie, calibration) could lead to differential access to preventive therapies. Although underestimation of risk can lead to reduced access to care, overestimation of risk can lead to unnecessary overtreatment. On the other hand, differences in model discrimination could lead to differences in risk ordering and imply that the predictors included in the model contain different amounts of information for the prediction task at hand or that the way in which the model integrates them favors one subgroup over another.
Reasons for the differences in model discrimination are not obvious. The model discrimination of the Framingham Stroke equation, developed on a White population, was not meaningfully worse when applied to Black participants than was the other 2 models based on data from White and Black participants. Thus, the reasons for the difference in performance are more complex than just inclusion of Black individuals in the development sample. One possible explanation might be that important risk factors are not captured in the data, such as insurance type, language barriers, and other factors resulting from differential access to health care services.25 A related factor might be clinician bias, which differentially affects study participants. Clinicians can have bias in their diagnostic or therapeutic decision-making resulting in misclassification. For example, implicit bias (unconscious collection of stereotypes and attitudes) by clinicians related to race and ethnicity or socioeconomic status might result in fewer referrals and access to preventive stroke care programs such as medication management and lifestyle modifications.26 Another possible explanation might be an inadequate flexibility of the modeling techniques used to develop existing models. To address this last issue and investigate the extent to which machine learning techniques can improve model performance across sex, race, and age groups, 2 flexible machine learning models, CoxNET and random survival forest were trained using data from Framingham, ARIC, and MESA, and validated using the REGARDS sample. Overall, CoxNET had better discriminative performance, while random survival forest had better calibration performance. However, neither offered meaningfully better performance relative to the recalibrated modifications of pooled cohort equations, Framingham Stroke, and REGARDS self-report models. These findings are consistent with other studies suggesting that there is usually limited benefit in applying machine learning models to tabular clinical data.27,28 These results do not exclude the possibility that more complex machine learning models could offer more benefits, especially for calibration. Deep learning models have been highly effective in risk prediction because they can extract highly complex, latent features in high-dimensional data sets.26,29 This might be particularly valuable when extending the pool of potential predictors beyond traditional demographic (race, sex, and age-group) and clinical factors (comorbidities). Other applicable machine learning techniques include transfer learning methods, where a risk-prediction model trained using data from one population is adapted to a second population with a different distribution of demographics and clinical features. Alternatively, federated learning methods can be used to cotrain models with data from multiple populations.
Limitations
This study has several limitations. First, although data collection methods in the studies included herein are exemplary, the representativeness of participants of the entire US population may be limited, given geographic concentration of some studies. Second, sufficient data were available only for Black and White participants, limiting analyses to these 2 racial groups. Third, variables were used as collected, employing definitions from each study. Future work should expand the pool of potential predictors and consider broader and richer sources of data. Fourth, all models treated stroke as a unitary outcome, which might miss potential differences between ischemic and hemorrhagic strokes. Fifth, only small subsets of existing stroke models and machine learning modeling techniques were considered. Sixth, machine learning models were developed in Framingham, ARIC, and MESA and validated in REGARDS, which is the largest sample with the largest number and proportion of Black participants. Given the consistency of the results, it is unlikely that a different strategy could lead to different results. Seventh, it is not clear to what extent global models similar to the ones considered herein offer added value over local models that can be developed by individual health systems.30
Conclusions
In this analysis of Black and White individuals without stroke or transient ischemic attack among 4 US cohorts, existing stroke–specific risk prediction models and novel machine learning techniques did not significantly improve discriminative accuracy for new-onset stroke compared with the pooled cohort equations, and the REGARDS self-report model had the best calibration. All algorithms exhibited worse discrimination in Black individuals than in White individuals, indicating the need to expand the pool of risk factors and improve modeling techniques to address observed racial disparities and improve model performance.
eMethods
eFigure 1. Discrimination in C indexes for previously developed models
eFigure 2. Calibration for previously developed models
eFigure 3. Comparison of net benefits of recalibrated models and machine learning models validated in REGARDS cohort against threshold probabilities
eTable 1. Study cohorts and eligible patients
eTable 2. Definition of stroke outcome for the four cohorts
eTable 3. Summary of models and variables
eTable 4. Missing value rates for the variables in Framingham Offspring Study (Framingham), Atherosclerosis Risk in Communities (ARIC), Multi-Ethnic Study of Atherosclerosis (MESA), and Reasons for Geographic and Racial Differences in Stroke (REGARDS)
eTable 5. Difference in C index (CI) for previously developed models in combined sample and by study
eTable 6. Difference in C index for previously developed models: White vs. Black within Sex and Age Subgroups
eTable 7. Spearman correlation comparing predictions by recalibrated models (Framingham Stroke, PCE, and REGARDS self-report) and ML models (CoxNET and random survival forest) in REGARDS cohort stratified by different demographic groups
eTable 8. Kappa score comparing predictions by recalibrated models and machine learning models in REGARDS cohort stratified by different demographic groups
eReferences
Data Sharing Statement
References
- 1.Virani SS, Alonso A, Aparicio HJ, et al. ; American Heart Association Council on Epidemiology and Prevention Statistics Committee and Stroke Statistics Subcommittee . Heart disease and stroke statistics—2021 update: a report from the American Heart Association. Circulation. 2021;143(8):e254-e743. doi: 10.1161/CIR.0000000000000950 [DOI] [PubMed] [Google Scholar]
- 2.Stroke and African Americans. US Dept of Health and Human Services. Accessed April 18, 2022. https://minorityhealth.hhs.gov/omh/browse.aspx?lvl=4&lvlid=28
- 3.Goldstein LB, Bushnell CD, Adams RJ, et al. ; American Heart Association Stroke Council; Council on Cardiovascular Nursing; Council on Epidemiology and Prevention; Council for High Blood Pressure Research; Council on Peripheral Vascular Disease, and Interdisciplinary Council on Quality of Care and Outcomes Research . Guidelines for the primary prevention of stroke: a guideline for healthcare professionals from the American Heart Association/American Stroke Association. Stroke. 2011;42(2):517-584. doi: 10.1161/STR.0b013e3181fcb238 [DOI] [PubMed] [Google Scholar]
- 4.Meschia JF, Bushnell C, Boden-Albala B, et al. ; American Heart Association Stroke Council; Council on Cardiovascular and Stroke Nursing; Council on Clinical Cardiology; Council on Functional Genomics and Translational Biology; Council on Hypertension . Guidelines for the primary prevention of stroke: a statement for healthcare professionals from the American Heart Association/American Stroke Association. Stroke. 2014;45(12):3754-3832. doi: 10.1161/STR.0000000000000046 [DOI] [PMC free article] [PubMed] [Google Scholar]
- 5.Wolf PA, D’Agostino RB, Belanger AJ, Kannel WB. Probability of stroke: a risk profile from the Framingham Study. Stroke. 1991;22(3):312-318. doi: 10.1161/01.STR.22.3.312 [DOI] [PubMed] [Google Scholar]
- 6.D’Agostino RB, Wolf PA, Belanger AJ, Kannel WB. Stroke risk profile: adjustment for antihypertensive medication: the Framingham Study. Stroke. 1994;25(1):40-43. doi: 10.1161/01.STR.25.1.40 [DOI] [PubMed] [Google Scholar]
- 7.Dufouil C, Beiser A, McLure LA, et al. Revised Framingham stroke risk profile to reflect temporal trends. Circulation. 2017;135(12):1145-1159. doi: 10.1161/CIRCULATIONAHA.115.021275 [DOI] [PMC free article] [PubMed] [Google Scholar]
- 8.Howard G, McClure LA, Moy CS, et al. Self-reported stroke risk stratification: reasons for geographic and racial differences in stroke study. Stroke. 2017;48(7):1737-1743. doi: 10.1161/STROKEAHA.117.016757 [DOI] [PMC free article] [PubMed] [Google Scholar]
- 9.Andrus B, Lacaille D. 2013 ACC/AHA guideline on the assessment of cardiovascular risk. J Am Coll Cardiol. 2014;63(25 pt A):2886. doi: 10.1016/j.jacc.2014.02.606 [DOI] [PubMed] [Google Scholar]
- 10.An investigation of coronary heart disease in families: the Framingham Offspring Study. Am J Epidemiol. 2017;185(11):1093-1102. doi: 10.1093/aje/kwx110 [DOI] [PubMed] [Google Scholar]
- 11.The Atherosclerosis Risk in Communities (ARIC) study: design and objectives. The ARIC investigators. Am J Epidemiol. 1989;129(4):687-702. doi: 10.1093/oxfordjournals.aje.a115184 [DOI] [PubMed] [Google Scholar]
- 12.Bild DE, Bluemke DA, Burke GL, et al. Multi-Ethnic Study of Atherosclerosis: objectives and design. Am J Epidemiol. 2002;156(9):871-881. doi: 10.1093/aje/kwf113 [DOI] [PubMed] [Google Scholar]
- 13.Howard VJ, Cushman M, Pulley L, et al. The reasons for geographic and racial differences in stroke study: objectives and design. Neuroepidemiology. 2005;25(3):135-143. doi: 10.1159/000086678 [DOI] [PubMed] [Google Scholar]
- 14.Ngwa JS, Cabral HJ, Cheng DM, et al. A comparison of time dependent Cox regression, pooled logistic regression and cross sectional pooling with simulations and an application to the Framingham Heart Study. BMC Med Res Methodol. 2016;16(1):148. doi: 10.1186/s12874-016-0248-6 [DOI] [PMC free article] [PubMed] [Google Scholar]
- 15.Stroke risk prediction using a harmonized dataset of Framingham, MESA, ARIC, and REGARDS (pilot). American Heart Association. November 30, 2021. Accessed April 18, 2022. https://sandbox.precision.heart.org/documentation/data-resources/aha-duke-ninds/index.html
- 16.Simon N, Friedman J, Hastie T, Tibshirani R. Regularization paths for Cox’s proportional hazards model via coordinate descent. J Stat Softw. 2011;39(5):1-13. doi: 10.18637/jss.v039.i05 [DOI] [PMC free article] [PubMed] [Google Scholar]
- 17.Ishwaran H, Kogalur UB, Blackstone EH, Lauer MS. Random survival forests. Ann Appl Stat. 2008;2(3):841-860. doi: 10.1214/08-AOAS169 [DOI] [Google Scholar]
- 18.Collins GS, Reitsma JB, Altman DG, Moons KG. Transparent Reporting of a Multivariable Prediction Model for Individual Prognosis or Diagnosis (TRIPOD): the TRIPOD statement. BMJ. 2015;350:g7594. doi: 10.1136/bmj.g7594 [DOI] [PubMed] [Google Scholar]
- 19.Uno H, Cai T, Pencina MJ, D’Agostino RB, Wei LJ. On the C-statistics for evaluating overall adequacy of risk prediction procedures with censored survival data. Stat Med. 2011;30(10):1105-1117. doi: 10.1002/sim.4154 [DOI] [PMC free article] [PubMed] [Google Scholar]
- 20.Brier GW. Verification of forecasts expressed in terms of probability. Mon Weather Rev. 1950;78(1):1. doi: [DOI] [Google Scholar]
- 21.Rousson V, Zumbrunn T. Decision curve analysis revisited: overall net benefit, relationships to ROC curve analysis, and application to case-control studies. BMC Med Inform Decis Mak. 2011;11:45. doi: 10.1186/1472-6947-11-45 [DOI] [PMC free article] [PubMed] [Google Scholar]
- 22.Debray TP, Damen JA, Riley RD, et al. A framework for meta-analysis of prediction model studies with binary and time-to-event outcomes. Stat Methods Med Res. 2019;28(9):2768-2786. doi: 10.1177/0962280218785504 [DOI] [PMC free article] [PubMed] [Google Scholar]
- 23.Vickers AJ, Van Calster B, Steyerberg EW. Net benefit approaches to the evaluation of prediction models, molecular markers, and diagnostic tests. BMJ. 2016;352:i6. doi: 10.1136/bmj.i6 [DOI] [PMC free article] [PubMed] [Google Scholar]
- 24.Barda N, Yona G, Rothblum GN, et al. Addressing bias in prediction models by improving subpopulation calibration. J Am Med Inform Assoc. 2021;28(3):549-558. doi: 10.1093/jamia/ocaa283 [DOI] [PMC free article] [PubMed] [Google Scholar]
- 25.Obermeyer Z, Powers B, Vogeli C, Mullainathan S. Dissecting racial bias in an algorithm used to manage the health of populations. Science. 2019;366(6464):447-453. doi: 10.1126/science.aax2342 [DOI] [PubMed] [Google Scholar]
- 26.FitzGerald C, Hurst S. Implicit bias in healthcare professionals: a systematic review. BMC Med Ethics. 2017;18(1):19. doi: 10.1186/s12910-017-0179-8 [DOI] [PMC free article] [PubMed] [Google Scholar]
- 27.Christodoulou E, Ma J, Collins GS, Steyerberg EW, Verbakel JY, Van Calster B. A systematic review shows no performance benefit of machine learning over logistic regression for clinical prediction models. J Clin Epidemiol. 2019;110:12-22. doi: 10.1016/j.jclinepi.2019.02.004 [DOI] [PubMed] [Google Scholar]
- 28.Rajkomar A, Oren E, Chen K, et al. Scalable and accurate deep learning with electronic health records. NPJ Digit Med. 2018;1:18. doi: 10.1038/s41746-018-0029-1 [DOI] [PMC free article] [PubMed] [Google Scholar]
- 29.Park DJ, Park MW, Lee H, Kim YJ, Kim Y, Park YH. Development of machine learning model for diagnostic disease prediction based on laboratory tests. Sci Rep. 2021;11(1):7567. doi: 10.1038/s41598-021-87171-5 [DOI] [PMC free article] [PubMed] [Google Scholar]
- 30.Harrell FE. Cox proportional hazards regression model. In: Regression Modeling Strategies. Springer; 2015. [Google Scholar]
Associated Data
This section collects any data citations, data availability statements, or supplementary materials included in this article.
Supplementary Materials
eMethods
eFigure 1. Discrimination in C indexes for previously developed models
eFigure 2. Calibration for previously developed models
eFigure 3. Comparison of net benefits of recalibrated models and machine learning models validated in REGARDS cohort against threshold probabilities
eTable 1. Study cohorts and eligible patients
eTable 2. Definition of stroke outcome for the four cohorts
eTable 3. Summary of models and variables
eTable 4. Missing value rates for the variables in Framingham Offspring Study (Framingham), Atherosclerosis Risk in Communities (ARIC), Multi-Ethnic Study of Atherosclerosis (MESA), and Reasons for Geographic and Racial Differences in Stroke (REGARDS)
eTable 5. Difference in C index (CI) for previously developed models in combined sample and by study
eTable 6. Difference in C index for previously developed models: White vs. Black within Sex and Age Subgroups
eTable 7. Spearman correlation comparing predictions by recalibrated models (Framingham Stroke, PCE, and REGARDS self-report) and ML models (CoxNET and random survival forest) in REGARDS cohort stratified by different demographic groups
eTable 8. Kappa score comparing predictions by recalibrated models and machine learning models in REGARDS cohort stratified by different demographic groups
eReferences
Data Sharing Statement