Abstract
Naïve CD8+ T cells can differentiate into effector (Teff), memory (Tmem) or exhausted (Tex) T cells. These developmental pathways are associated with distinct transcriptional and epigenetic changes that endow cells with different functional capacities and therefore therapeutic potential. The molecular circuitry underlying these developmental trajectories and the extent of heterogeneity within Teff, Tmem and Tex populations remain poorly understood. Here, we used the lymphocytic choriomeningitis virus model of acute-resolving and chronic infection to address these gaps by applying longitudinal single-cell RNA-sequencing (scRNA-seq) and single-cell assay for transposase-accessible chromatin sequencing (scATAC-seq) analyses. These analyses uncovered new subsets, including a subpopulation of Tex cells expressing natural killer cell-associated genes that is dependent on the transcription factor Zeb2, as well as multiple distinct TCF-1+ stem/progenitor-like subsets in acute and chronic infection. These data also revealed insights into the reshaping of Tex subsets following programmed death 1 (PD-1) pathway blockade and identified a key role for the cell stress regulator, Btg1, in establishing the Tex population. Finally, these results highlighted how the same biological circuits such as cytotoxicity or stem/progenitor pathways can be used by CD8+ T cell subsets with highly divergent underlying chromatin landscapes generated during different infections.
Upon activation, CD8+ T cells can differentiate into Teff and Tmem cells in acute-resolving infections or vaccination, or Tex cells in chronic infections, cancer and autoimmunity. Following acute infection or vaccination, activated CD8+ T cells differentiate into Teff populations that are associated with control of infection and subsequent formation of Tmem cells that confer long-term protection1,2 . Among these major differentiation branches, subsets have been identified based on surface phenotype, function and differentiation potential. For example, combinations of KLRG1, CD127, CX3CR1 and other molecules identify subsets with robust effector activity, but limited durability, or alternatively, enhanced capacity to populate the long-term Tmem pool3,4. How development of this subset diversity is linked to the underlying transcriptional and epigenetic wiring remains incompletely understood.
During chronic infection, cancer and autoimmunity, persistent stimulation induces differentiation of Tex cells. Similarly to Teff and Tmem cells, multiple subsets of Tex cells exist4,5. There has been considerable interest in the ontogeny and function of these Tex subsets because some subsets are necessary for response to immunotherapies, including programmed death 1 (PD-1) blockade6–8 and adoptive T cell therapy9. Various definitions have been used, but most studies have identified: (i) progenitor Tex (‘stem-like’ or ‘precursor’) cells; (ii) intermediate or transitory Tex cells; and (iii) terminal Texcells8,10–13. Tex cells have a distinct epigenetic landscape compared to Teff and Tmem cells14–17 governed in part by the transcription factor (TF) TOX18–21. Despite many differences, Tex cells share some features with Teff and Tmem cells; for example, both Teff and Tex cells can be cytolytic, and subsets of Tmem and Tex cells can persist long term despite using different signals for homeostasis5.
There are key gaps in our understanding of developmental relationships and mechanisms governing Teff, Tmem and Tex cell differentiation and heterogeneity. These knowledge gaps are due in part to a paucity of paired transcriptional and epigenetic data from CD8+ T cells differentiating down these distinct trajectories. It is unclear whether subsets of Teff, Tmem and Tex cells largely defined using a few proteins by flow cytometry reflect underlying cell type heterogeneity. For example, this phenotypic heterogeneity could represent different activation states of the same underlying cell ‘fate’ defined by epigenetic patterns. Furthermore, some subsets of Teff and Tmem versus Tex populations have overlapping protein expression patterns, such as the progenitor-associated TF, TCF-1. Whether TCF-1-expressing cells have the same underlying developmental program or whether TCF-1 circuits are used by CD8+ T cells from different developmental lineages is unclear.
To address these questions, we used the lymphocytic choriomeningitis virus (LCMV) model of acute-resolving or chronic viral infection to generate longitudinal single-cell RNA-sequencing (scRNA-seq) and single-cell assay for transposase-accessible chromatin sequencing (scATAC-seq) data for Teff, Tmem and Tex cells. These data defined population heterogeneity and identified gene expression and accessible chromatin patterns associated with major branches of CD8+ T cell differentiation. Comparing scATAC-seq and scRNA-seq data revealed that cells with the same accessible chromatin profile existed in more than one transcriptional state. These analyses also uncovered new subpopulations of Teff, Tmem and Tex cells, including a Tex subset expressing natural killer (NK) cell-associated genes that required the TF Zeb2 for differentiation. Indeed, this Zeb2 circuitry was shared with cytotoxic subsets of Teff and Tmem cells generated from acute-resolving infection despite distinct epigenetic landscapes. In addition, we defined multiple epigenetically distinct populations of TCF-1+ antigen-experienced CD8+ T cells. Tex precursor cells found early in chronic infection were distinct from Tex progenitors at later time points, and both of these TCF-1+ populations were different from Tmem cell precursors and mature Tmem cells generated from acute-resolving infection. Finally, we identified the cell stress response gene, B cell translocation gene (BTG)/TOB family member, Btg1, as a previously unappreciated regulator for establishing the Tex population. Thus, this transcriptional and epigenetic map provides insights into the developmental biology and mechanisms governing Teff, Tmem and Tex cell differentiation.
Results
CD8+ T cell transcriptional and epigenetic atlas
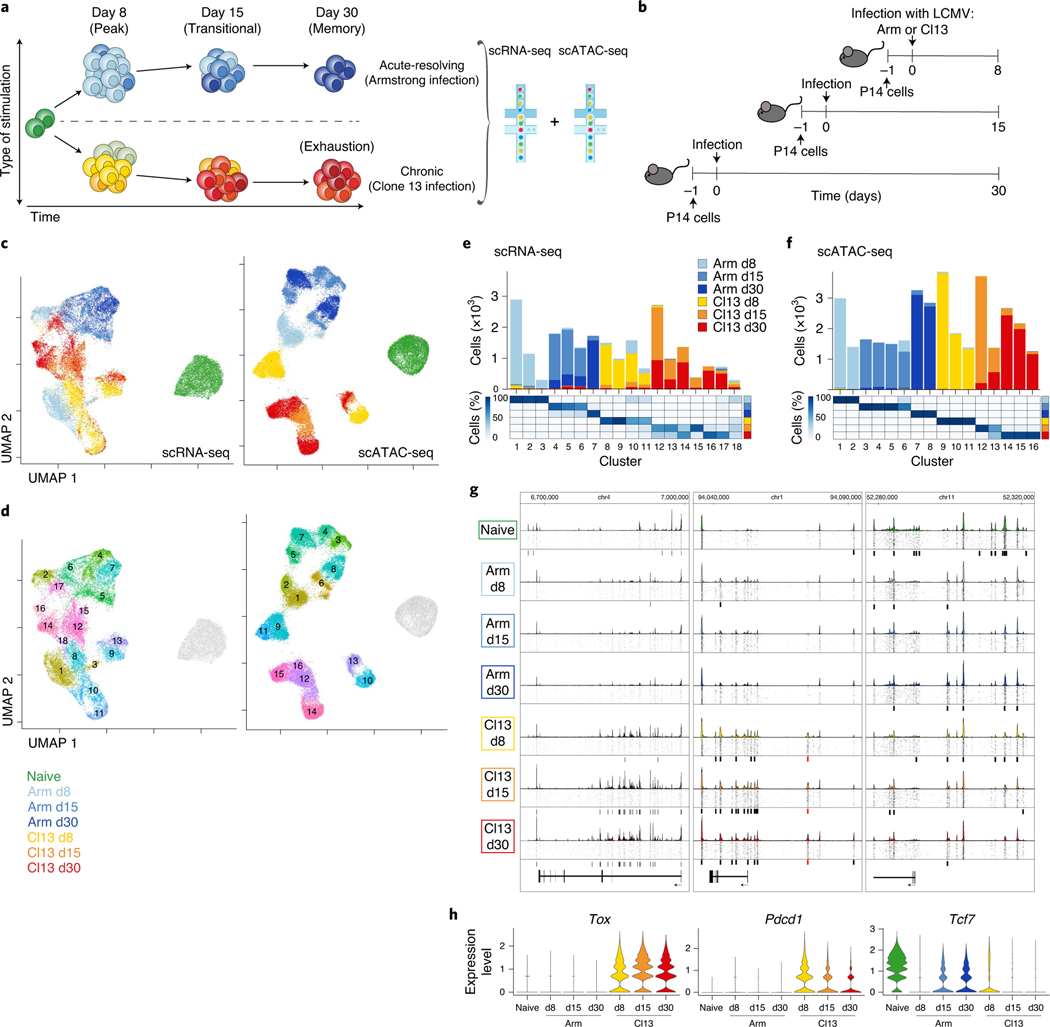
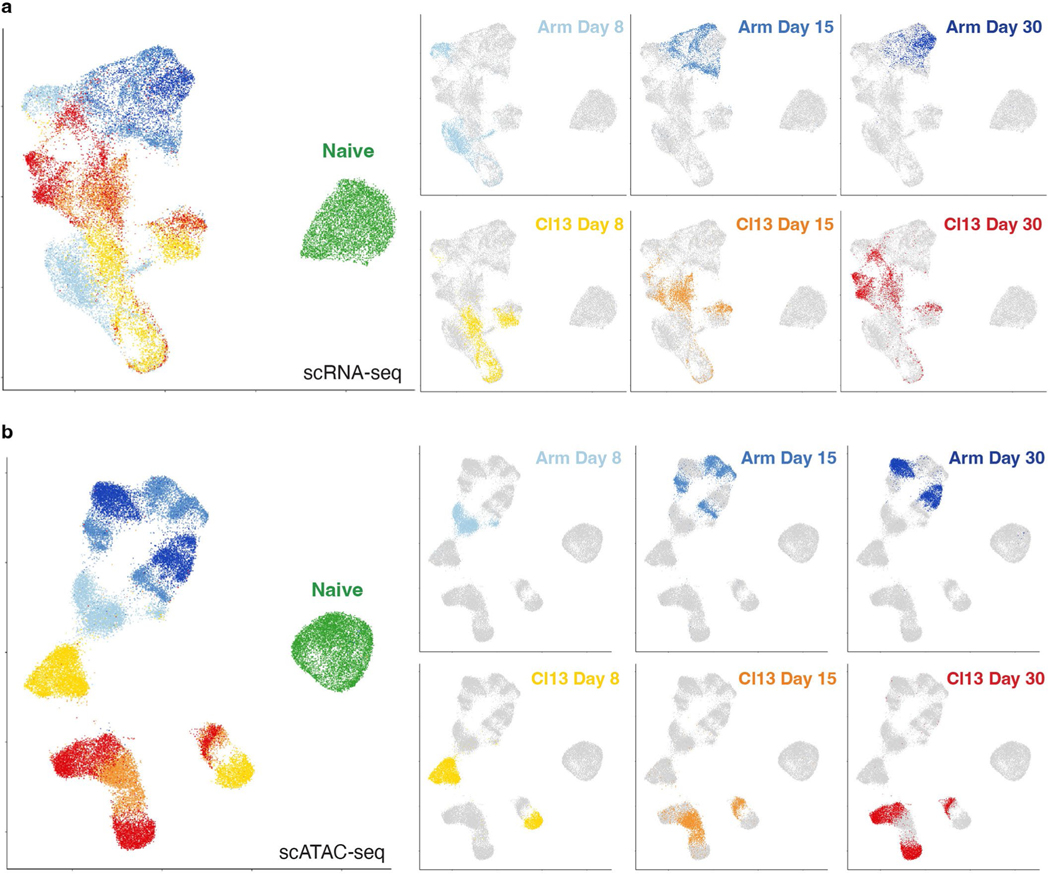
We adoptively transferred T cell receptor (TCR)-transgenic gp33-specific (P14) CD8+ T cells into congenically distinct recipient mice, infected with Armstrong (Arm) or clone 13 (Cl13), then isolated P14 cells (Fig. 1a and Extended Data Fig. 1a) and performed scRNA-seq and scATAC-seq on days 8 (d8), 15 (d15) and 30 (d30) post infection (p.i.; Fig. 1a,b). We projected all cells from scRNA-seq or scATAC-seq into uniform manifold approximation and projection (UMAP) space. This analysis revealed separation of cells based on infection (Arm or Cl13) and time point (Fig. 1c and Extended Data Fig. 2a,b). scATAC-seq separated cells more clearly, reflecting the enhanced ability of ATAC-seq to distinguish distinct cell types compared to RNA-seq22–24. From non-naïve CD8+ T cells, we resolved 18 distinct scRNA-seq clusters (Fig. 1d,e) and 16 distinct scATAC-seq clusters (Fig. 1d,f). Most clusters contained cells from one infection and time point. However, some clusters were more diverse; scRNA-seq clusters 12–18 contained a mixture of cells from d15 and d30 of Cl13 infection, whereas these time points were more homogeneous by scATAC-seq (Fig. 1e,f). This latter observation indicates the transcriptional program of Tex cells is established by d15, but the chromatin landscape of Tex cells continues to evolve for at least 1 month.
Fig. 1 |. Single-cell transcriptional and accessible chromatin landscape of memory and exhausted CD8+ T development.
a, Experimental strategy to capture CD8+ T cell differentiation in acute resolving and chronic viral infections. Microfluidic image provided by 10x Genomics. b, Detailed experimental schematic (Extended Data Fig. 1a). c,d, UMAP from scRNA-seq and scATAC-seq colored by infection and time point (c) or by cluster (d). e,f, Enumeration and proportion of cells per cluster as indicated for scRNA-seq (e) or scATAC-seq (f). g, scATAC-seq coverage and tile plots. Sample-specific ACRs are indicated with black boxes below tile plot. Previously identified Pdcd1 enhancer17 indicated in red. h, Gene expression from scRNA-seq of genes represented in g.
We next asked how key chromatin accessibility changes identified by scATAC-seq associated with developmental trajectories in Arm or Cl13 infection. We examined three canonical CD8+ T cell genes: Tox, Pdcd1 (encoding PD-1) and Tcf7 (encoding TCF-1; Fig. 1g,h). Tox, encoding a TF required for formation of Tex18–21, was highly expressed during Cl13 infection and accessibility of the gene locus increased over time. Pdcd1 was expressed in Cl13 infection and had uniquely accessible regions, including a previously described enhancer14,17. The Tcf7 locus contained infection-dependent and time-dependent accessible chromatin regions (ACRs) suggesting complex gene regulation in different T cell populations. Using scATAC-seq, we identified distinct epigenetic patterns associated with expression of key genes in Teff, Tmem and Tex cells.
T cell fates defined by cytotoxic potential in acute-resolving infection
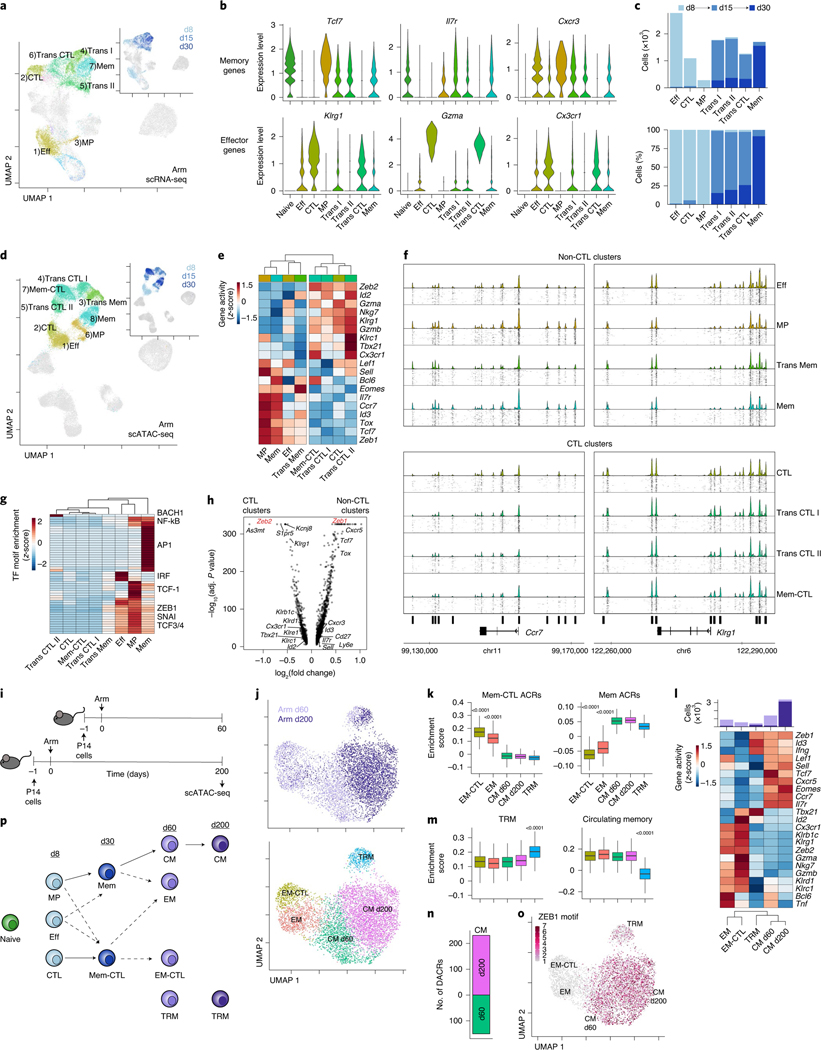
We first identified CD8+ T cell subsets in acute resolving infection using scRNA-seq (Fig. 2a). On d8, three clusters were identified: memory precursor (MP), effector (Eff) and cytolytic (CTL) (Fig. 2b,c and Supplementary Table 1), the latter likely a subpopulation of KLRG1+CD127− short-lived effectors2. At d15, three additional transitional (Trans) clusters were identified: Trans I, Trans II and Trans CTL. By d30, there was one primary cluster of memory CD8+ T cells (Mem; Fig. 2b,c). We next performed unbiased clustering from chromatin accessibility data (Fig. 2d) and used gene activity, a metric of local gene accessibility, to approximate gene expression and assign differentiation state (Fig. 2e). Some clusters defined by scATAC-seq overlapped with transcriptionally defined clusters, such as d8 Eff and CTL (Extended Data Fig. 3a,b). However, other clusters were only revealed by scATAC-seq, including Mem-CTL, suggesting that chromatin accessibility may provide additional information about differentiation, particularly in transcriptionally quiescent cells.
Fig. 2 |. Acute-resolving infection generates two branches of effector and memory CD8+ T cells distinguished by epigenetic cytolytic potential.
a, scRNA-seq UMAP; cells from Arm infection are colored by cluster or time point (inset). b, Expression of T cell genes by cluster. c, Number (top) and percentage (bottom) of cells from Arm infection per cluster filled by time point. d, scATAC-seq UMAP; cells from Arm infection are colored by cluster or time point (inset). e, Average gene activity per scATAC-seq cluster. f, scATAC-seq coverage and tile plots. DACRs of CTL versus non-CTL clusters indicated on the bottom. g, Average TF motif enrichment per scATAC-seq cluster of differentially enriched motifs comparing CTL and non-CTL scATAC-seq clusters. h, Differential gene activity comparing CTL and non-CTL scATAC-seq clusters. Gene loci of interest indicated. Calculation performed with two-sided Seurat FindMarkers LR test using Bonferroni correction. i, Experimental schematic of long-term Arm infection experiment (Extended Data Fig. 1b). j, scATAC-seq UMAP of cells from experiment in i colored by time point (top) or cluster (bottom). k, Enrichment score of cluster-specific ACRs from d30 Arm Mem-CTL and Mem scATAC-seq clusters. Two-sided Wilcoxon test of EM (871 cells) or EM-CTL (547 cells) versus the rest (5,741 or 6,065 cells). l, Average gene activity per scATAC-seq cluster with number of cells per cluster indicated on top, filled by time point. m, Enrichment score of gene activity from gene sets derived from TRM or circulating memory cells48. Two-sided Wilcoxon test of TRM (419 cells) versus the rest (6,193 cells). n, Number of DACRs between CM d60 and CM d200 clusters. DACRs were calculated with Signac FindAllMarkers two-sided likelihood-ratio (LR) test using Bonferroni correction. o, scATAC-seq UMAP of cells from experiment in i colored by ZEB1 motif enrichment. p, Data summary schematic. In box plots, the median is indicated by the center line; box limits represent upper and lower quartiles; and whiskers extend to 1.5 times the interquartile range.
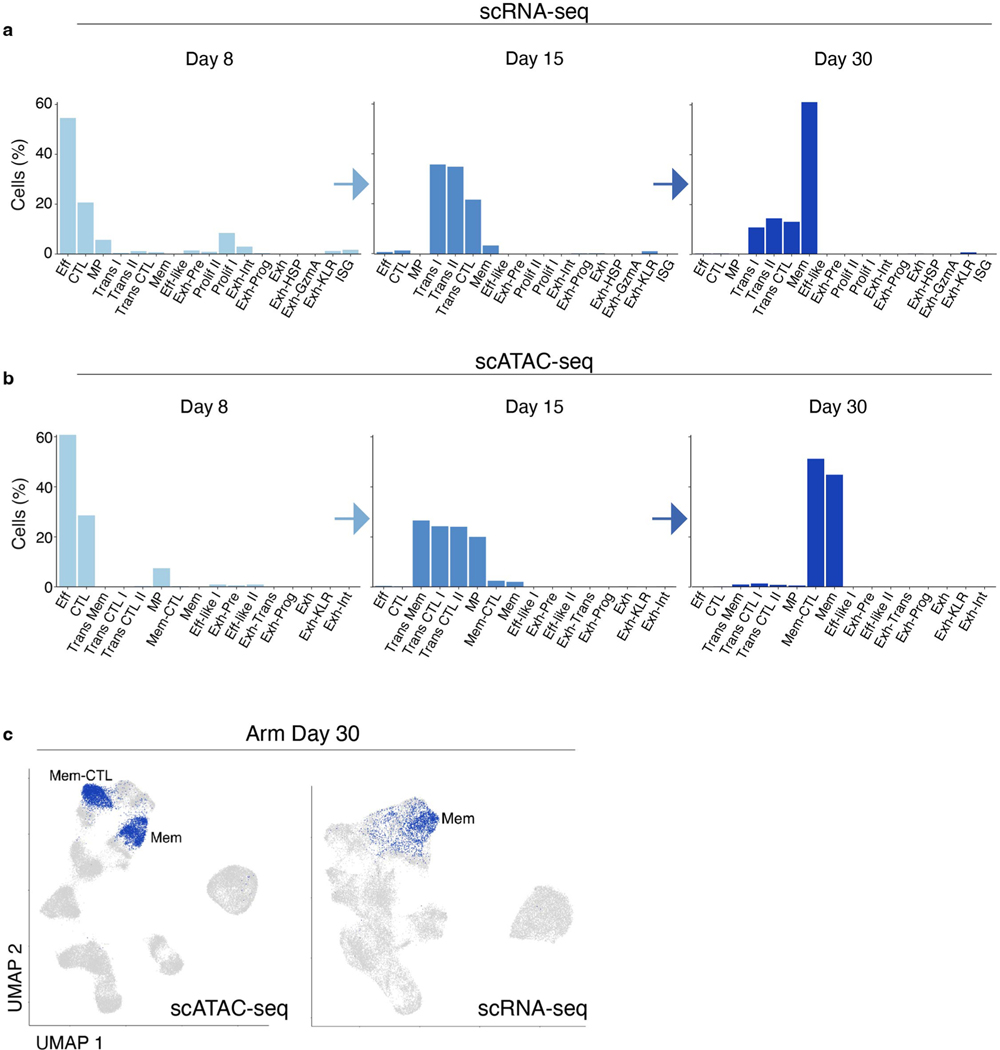
Gene activity analysis also revealed two broad epigenetic groups among the scATAC-seq clusters that differed in accessibility at cytotoxic genes including Gzma, Gzmb and Klrc1 (encoding NKG2A): CTL and non-CTL (Fig. 2e and Supplementary Table 2). CTL clusters included CTL from d8, Trans CTL I and Trans CTL II from d15, and the Mem-CTL cluster from d30. The non-CTL clusters included Eff and MP from d8, Trans Mem from d15, and Mem from d30. These two groups displayed different ACR profiles including ACRs at the Ccr7 locus (non-CTL clusters) and Klrg1 locus (CTL clusters) (Fig. 2f). Notably, although there were two distinct clusters of d30 memory cells based on chromatin accessibility (Mem and Mem-CTL), there was only one major transcriptional cluster (Fig. 2a,d and Extended Data Fig. 3a–c). In summary, scATAC-seq identified two epigenetically distinct groups in acute-resolving infection defined by cytotoxic or memory patterns. This bifurcation was identifiable by d8, consistent with the notion of early commitment to either the memory or the effector lineage1,25.
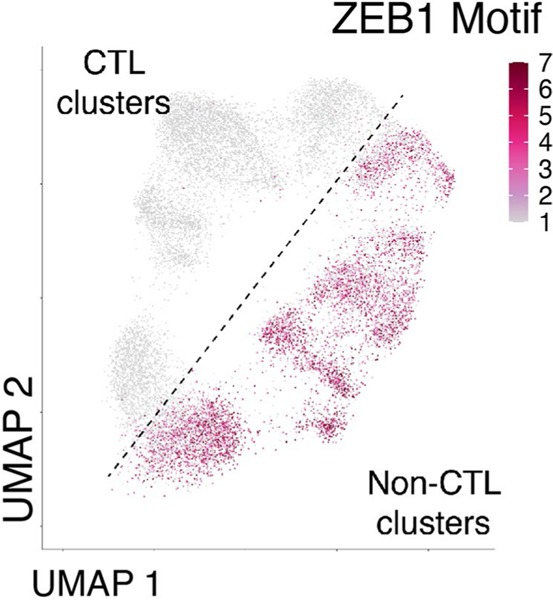
We next identified TF motifs enriched in CTL versus non-CTL clusters. Some motifs were more specific for one cluster such as AP1 motifs in the Mem cluster, but ZEB1, TCF3 (E2A), TCF4, TCF12 (HEB) and SNAI motifs were all enriched in non-CTL clusters compared to CTL clusters (Fig. 2g). Based on gene activity, Zeb1 was likely to be highly expressed in the non-CTL clusters and Zeb2 in the CTL clusters (Fig. 2h). Although ZEB2 lacks a testable motif, the ZEB1 motif was strongly enriched in non-CTL clusters and nearly absent in CTL clusters (Fig. 2g and Extended Data Fig. 4). This analysis is consistent with a role for Zeb1 in Tmem cell formation and function, whereas Zeb2 can promote short-lived Teff cell differentiation26–28. However, our data also suggest that Zeb2 may have a specific role in all subsets with cytotoxic function, including Mem-CTL cells at d30 and highlight the ZEB1-ZEB2 TF pair in the bifurcation of CTL and non-CTL branches of CD8+ T cell differentiation in acute-resolving infection.
We next examined whether Mem and Mem-CTL clusters were present at later time points. We performed scATAC-seq on days 60 (d60) and 200 (d200) after Arm infection (Fig. 2i and Extended Data Fig. 1b). Indeed, at d60, two clusters had enriched accessibility at loci associated with the d30 Mem-CTL cluster: effector memory (EM) and EM-CTL (Fig. 2j,k). EM-CTL had increased accessibility at cytotoxic gene loci, including Gzma, Gzmb and NK receptors (Fig. 2l). Tissue-resident memory (TRM) and central memory (CM) clusters were also present at d60 (Fig. 2j–m). However, by d200 most cells belonged to a single CM cluster (CM d200) with a small proportion of TRM cells (Fig. 2j–m). CM cells from d60 and d200 separated into different clusters suggesting continued evolution of memory CD8+ T cell chromatin accessibility over time (Fig. 2n). TF motif analysis revealed enrichment in ZEB1 motif accessibility in CM and TRM cells and relative absence in EM and EM-CTL (Fig. 2o). These data confirm that CD8+ T cells similar to the d30 Mem-CTL cluster are also present 1 month later but are essentially undetectable by d200, consistent with the evolution of the memory pool to largely CM cells over time25 together with TRM cells29. These data define a trajectory of CD8+ T cell differentiation to long-term memory after acute infection (Fig. 2p) and suggest that effector functions in longer-lived cells may be epigenetically encoded early during infection.
Temporal single-cell RNA sequencing of exhausted T cells reveals transcriptional heterogeneity
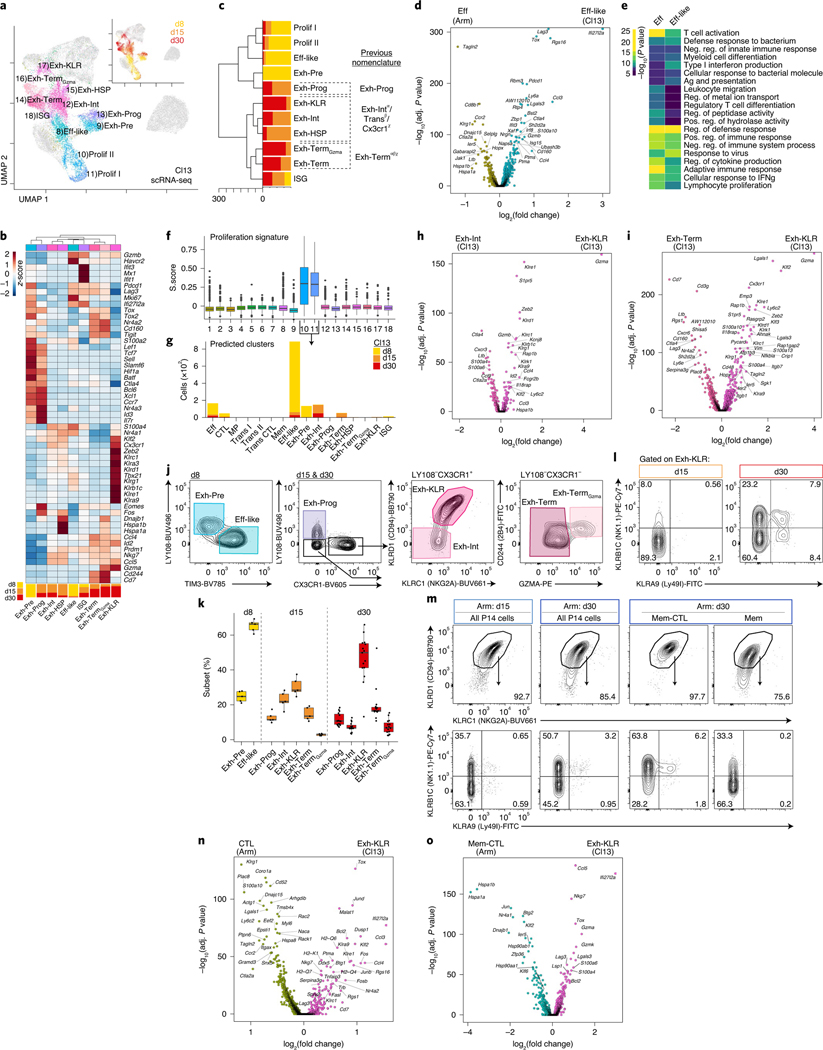
Unlike acute-resolving infections, chronic infections and cancer induce differentiation of Tex cells5. Multiple Tex subsets have been identified, including progenitor, intermediate and terminal cells8,10–13. To examine the development and heterogeneity of Tex over time, we first defined CD8+ T cell clusters from Cl13 infection with scRNA-seq (Fig. 3a–c and Supplementary Table 1). At d8, there were four major clusters (Fig. 3a–c). One cluster contained effector-like (Eff-like) cells that was distinct from Eff generated in Arm infection. Cl13 Eff-like cells had higher expression of Tox, Lag3, Rgs16 and Ifi27I2a, whereas Klrg1, Ccr2 and Selplg were higher in Eff from Arm (Fig. 3d). Pathway analysis revealed increased expression of general T cell activation genes in Arm Eff cells, whereas Eff-like cells from Cl13 had increased expression of viral response genes (Fig. 3e). There were also two proliferating clusters (Fig. 3a–c,f). Because cell cycle genes can obscure underlying transcriptional identity, we projected these cells back onto the remaining clusters (Methods). Most proliferating cells belonged to the d8 Eff-like cluster, although a smaller number of cells were derived from clusters present at later time points (Fig. 3g), consistent with the ongoing cell cycle by Tex cells13. The fourth d8 Cl13 cluster, Exh-Pre, had some similarity to MP from Arm infection including expression of Il7r, Id3, Tcf7, Lef1, Sell and Ccr7 (Fig. 3b,c). However, this subset also expressed exhaustion-related genes (Tox, Tox2, Pdcd1 and Lag3), confirming previous work that identified an exhaustion-committed population early during Cl13 infection21,30.
Fig. 3 |. Exhausted CD8+ T cells are transcriptionally heterogeneous and include a distinct subset characterized by expression of natural killer cell receptors.
a, scRNA-seq UMAP; cells from Cl13 infection are colored by cluster or time point (inset). b, Average gene expression per scRNA-seq cluster with proportion of cells per time point in each cluster represented below. c, Phylogenetic tree of scRNA-seq clusters with proportion of cells per time point. Correspondence of clusters with previous nomenclature: α11, β10, χ12. d, DEG analysis between Eff and Eff-like clusters. e, Gene Ontology analysis of DEGs in d performed with Metascape, which uses a hypergeometric test and Benjamini–Hochberg P-value correction algorithm. f, Cell cycle S.Score for each cluster. The number of cells in each cluster is available in Supplementary Table 7. g, Predicted cluster identity of proliferating cells shown as the number of cells per cluster and colored by time point (Methods). h, DEG analysis between Exh-Int and Exh-KLR clusters. i, DEG analysis between Exh-Term and Exh-KLR clusters. j, Flow cytometry gating strategy to identify Tex clusters. Cells were gated as live single CD8+ P14 cells (Extended Data Fig. 1c). k, Enumeration of Tex clusters gated in j. Each point represents a mouse. l, Representative flow cytometry plots gated on Exh-KLR cells as in j from Cl13 infection at d15 and d30. Mean percentage per quadrant is indicated. m, Representative flow cytometry plots from Arm infection at d15 or d30 gated on live singlet CD8+ P14 cells (top) or KLRC1+KLRD1+ P14 cells (bottom) as indicated. Mean percentage per quadrant is indicated. n, DEG analysis between CTL cluster from Arm infection and Exh-KLR cluster from Cl13 infection. o, DEG analysis between Mem-CTL cluster from Arm infection and Exh-KLR cluster from Cl13 infection. In d, h, I, n and o, DEGs were calculated with Seurat FindMarkers two-sided Wilcoxon test using Bonferroni correction. In j–m, n = 5 d8 Cl13, n = 5 d15 Cl13, n = 15 d30 Cl13, n = 5 d15 Arm and n = 5 d30 Arm mice. Data are representative of two independent experiments. In box plots, the median is indicated by the center line; box limits represent upper and lower quartiles; and whiskers extend to 1.5 times the interquartile range.
We next investigated heterogeneity within the established Tex population. Seven clusters were present at d15 and d30 p.i. (Fig. 3a–c). An Exh-Prog cluster at these time points was similar to d8 Exh-Pre (Fig. 3c) but had unique features including high expression of Eomes and Fos (Fig. 3b). The two smallest clusters (Fig. 1e) were defined by expression of heat-shock protein genes (Exh-HSP) or interferon-stimulated genes (ISG) (Fig. 3b). The previously described terminal Tex population8,10–12 is characterized by high inhibitory receptor (IR) expression; however, unbiased clustering separated terminal-like cells into two subsets, Exh-Term and Exh-TermGzma (Fig. 3b,c). These analyses also revealed a previously unappreciated population of Tex cell expressing NK-associated genes, Exh-KLR (Fig. 3b,c). The Exh-Int, Exh-KLR and Exh-HSP cells were likely included in the intermediate Tex population in previous studies8,10–13. To gain more insight into this Exh-KLR subset, we compared Exh-KLR cells to Exh-Int (Fig. 3h) and Exh-Term (Fig. 3i). In both comparisons, the Exh-KLR subset was distinguished by genes associated with NK cells (Klr genes and Fcgr2b, for example), cytotoxic genes (Gzma and Gzmb), migration-related genes (S1pr5 and Itgb7) and TFs (Zeb2, Klf2, Klf3 and Id2). These results suggested that Exh-KLR cells have more cytolytic potential than other Tex subsets. Recent work has identified potential clinically relevant T cells expressing NK receptors31–34, but Tex cells with characteristics of this Exh-KLR population have not been previously described.
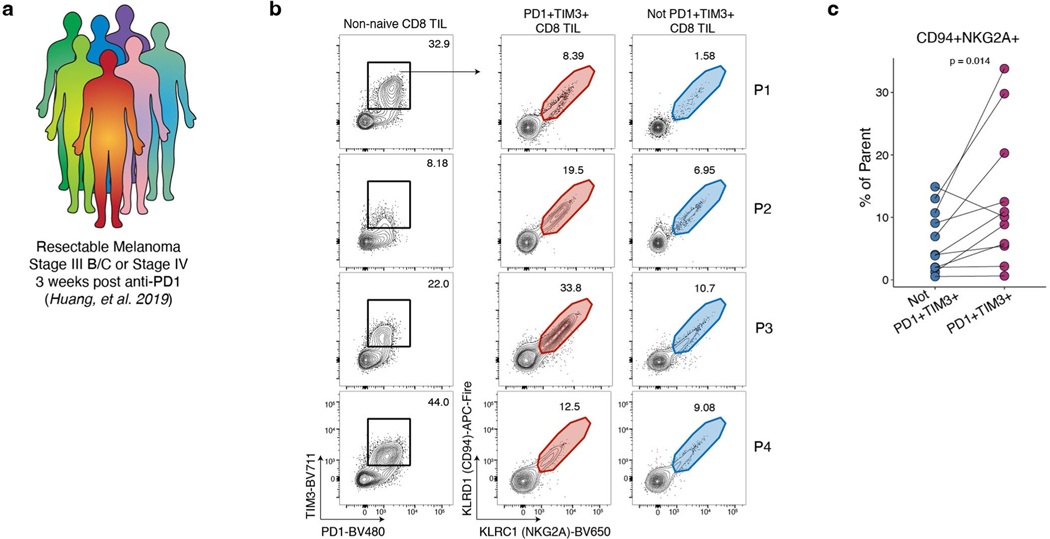
Next, we asked whether these Tex subpopulations could be identified by flow cytometry. Gating on P14 cells (Extended Data Fig. 1c) at d8, Exh-Pre and Eff-like were distinguished using LY108 and TIM3 (Fig. 3j). At d15 and d30, the major subsets were identified using a tiered gating strategy (Fig. 3j). Exh-Prog were LY108+CX3CR1−. From the LY108−CX3CR1+ gate, the Exh-KLR population were identified by expression of NKG2A (Klrc1) and CD94 (Klrd1), whereas Exh-Int were NKG2A−CD94−. Exh-Term and Exh-TermGzma from the LY108−CX3CR1− gate were distinguished based on GZMA expression. Consistent with transcriptional data, Exh-TermGzma cells also expressed higher 2B4 (Cd244a) (Fig. 3b,j). Thus, based on protein expression, it was possible to resolve Exh-Pre, Eff-like, Exh-Prog, Exh-Int, Exh-KLR, Exh-Term and Exh-TermGzma during chronic viral infection. The relative proportion of these subsets changed over time, with Exh-KLR cells increasing from d15 to d30 (Fig. 3k). Transcriptionally, the Exh-KLR subset expressed several additional NK receptors, including NK1.1 (Klrb1c) and Ly49I (Klra9) (Fig. 3b). By d30, there was heterogeneity within the Exh-KLR population based on protein-expressed combinations of these NK receptors (Fig. 3l), perhaps reflecting functional diversification35. To determine whether an analogous subset could be identified in human tumors, we analyzed tumor-infiltrating lymphocytes (TILs) from individuals with melanoma who were treated with anti-PD-1 (Extended Data Fig. 5a and Supplementary Table 3) from a previous trial cohort36. An average of 12.8% of IR-positive (PD-1+TIM3+) TILs expressed NKG2A (KLRC1) and CD94 (KLRD1), compared to 6.2% of IR-negative TILs (Extended Data Fig. 5b, c and Extended Data Fig. 1d). Altogether, these results identify Tex subsets by flow cytometry that were defined using scRNA-seq and confirm the presence of a KLR+ Tex in human TILs.
Expression of NK receptors by CD8+ T cells is not unique to Cl13; most virus-specific CD8+ T cells from Arm infection also expressed NKG2A (Klrc1) and CD94 (Klrd1) and had variable expression of NK1.1 (Klrb1c) and Ly49I (Klra9) (Fig. 3m and Extended Data Fig. 1e), consistent with studies documenting expression of NK receptors on CD8+ T cells in infections37,38. We compared Exh-KLR from Cl13 infection with CTL (Fig. 3n) and Mem-CTL (Fig. 3o) subsets from Arm infection. Both comparisons revealed many differentially expressed genes (DEGs) between Exh-KLR and the two CTL cell subsets from Arm infection, including higher expression of Tox, Bcl2 and Lag3 in Exh-KLR. These results indicate that Exh-KLR cells are distinct from Teff and Tmem cells generated from acute-resolving infection (Fig. 3n,o). These observations also suggested that, despite divergent differentiation of Exh-KLR in chronic infection compared to CTL and Mem-CTL in acute-resolving infection, these cells share a transcriptional module containing NK-associated genes.
Single-cell assay for transposase-accessible chromatin sequencing reveals four distinct exhausted T cell subsets
CD8+ T cell exhaustion is the result of an epigenetically distinct developmental path compared to Teff and Tmem cells14,39, driven in part by TOX18–21. However, it has been unclear how phenotypic or transcriptional heterogeneity of Tex populations is related to underlying chromatin landscape heterogeneity. Thus, we asked whether distinct Tex subsets also existed based on scATAC-seq (Fig. 4a).
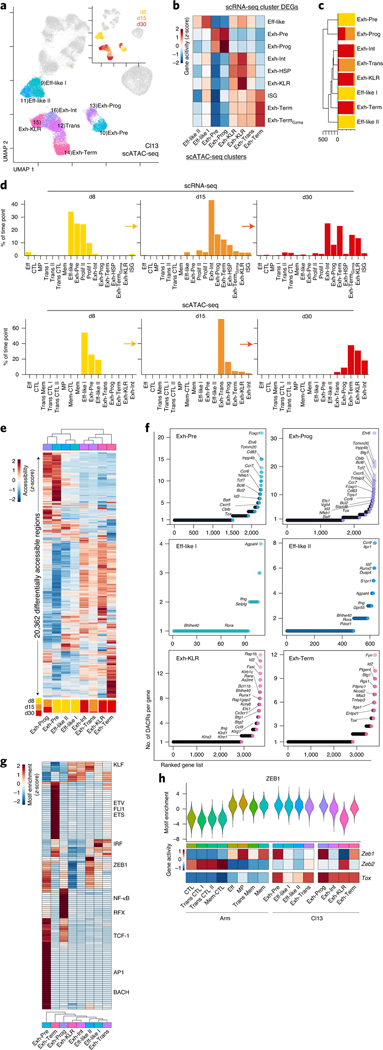
Fig. 4 |. The accessible chromatin landscape distinguishes fewer exhausted T cell epigenetic cell fates under wider transcriptional diversity.
a, scATAC-seq UMAP; cells from Cl13 infection are colored by cluster or time point (inset). b, Average enrichment score per scATAC-seq cluster of gene sets from scRNA-seq cluster DEGs, using gene activity. c, Phylogenetic tree of scATAC-seq clusters with proportion of cells per time point. d, Percentage of cells from Cl13 infection by time point as indicated in scRNA-seq clusters (top) and scATAC-seq clusters (bottom). e, Average accessibility of DACRs per scATAC-seq cluster with proportion of cells per time point in each cluster represented below. f, Number of DACRs per gene loci for each scATAC-seq cluster. DACRs were calculated with Signac FindAllMarkers two-sided LR test using Bonferroni correction. g, Average TF motif enrichment per cluster for differentially enriched TF motifs. h, Top, ZEB1 motif enrichment. Bottom, Zeb1, Zeb2 and Tox average gene activity per scATAC-seq cluster.
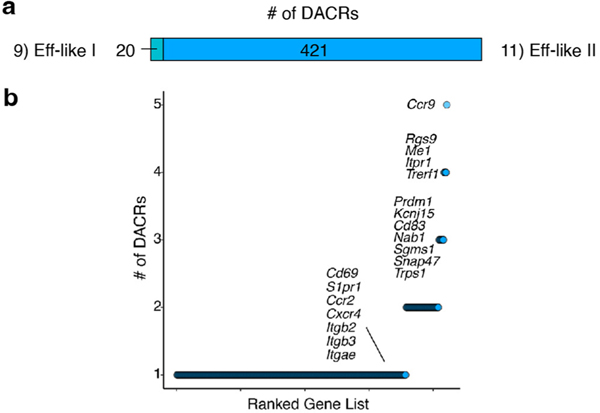
Unbiased clustering of scATAC-seq identified eight clusters during Cl13 infection. To infer cell subset identity, we used time point, gene activity (Fig. 4b) and cluster similarity (Fig. 4c). First, we calculated enrichment of gene sets derived from the scRNA-seq clusters (Fig. 4b). On d8, there were three clusters: Exh-Pre and two Eff-like clusters. Increased accessibility at several genes related to migration in Eff-like II, including Ccr9, S1pr1, Cd69 and several integrins (Extended Data Fig. 6a,b), suggesting trafficking to peripheral sites. By d15, the Exh-Prog subset was identifiable by scATAC-seq; however, most cells were in a second cluster almost exclusively found at d15, which we called transitory (Exh-Trans). By d30, most cells populated four clusters: Exh-Prog, Exh-Int, Exh-KLR and Exh-Term. To understand how these epigenetically defined subsets mapped to transcriptionally defined subsets, we compared scRNA-seq clusters and scATAC-seq clusters by time point (Fig. 4d). scATAC-seq resolved fewer clusters than scRNA-seq at d8 (3 versus 7 clusters), d15 (5 versus 10) and d30 (5 versus 11). These differences likely reflect fewer cell ‘fates’ revealed by scATAC-seq underlying multiple transcriptional states.
Next, we investigated epigenetic programs used by different Tex subsets. We visualized all 20,362 differentially accessible chromatin regions (DACRs) (Fig. 4e and Supplementary Table 2), then assessed the number of DACRs in each gene locus (Fig. 4f). This approach revealed global patterns of shared and distinct ACRs among the Tex cell clusters. For example, Exh-Pre and Exh-Prog DACR profiles were most like each other (Fig. 4e), including DACRs at stem-associated genes, Tcf7, Foxp1 and Id3 (Fig. 4f). Eff-like I and Eff-like II from chronic infection shared accessibility at Ifng and Bhlhe40, as did Exh-KLR (Fig. 4f). However, Exh-KLR also contained DACRs at Rap1b, Id2 and Klrb1c. Exh-Term exhibited a distinct ACR profile (Fig. 4e) that included accessibility at Fyn, Ptger4, Btg1 and Rgs1 (Fig. 4f).
We next asked which TFs had potential to regulate transcriptional programs within each Tex subset (Fig. 4g). As expected, ACRs in Exh-Pre and Exh-Prog were enriched in TCF-1 motifs. However, ACRs in Exh-Pre had increased accessibility at AP1 motifs, suggesting response to TCR stimulation, whereas ACRs in Exh-Prog were enriched in nuclear factor kappa B (NF-κB) and RFX motifs (Fig. 4g). Exh-Term also had a distinct TF motif profile characterized by enrichment in ETV and ETS TF motifs, including FLI1. Exh-KLR and Exh-Int clusters shared enrichment for several TF motifs, including the KLF family. However, the Exh-KLR cluster was distinguished from all other clusters by the relative absence of ZEB1 motifs (Fig. 4g,h), a pattern reminiscent of CTL clusters from Arm infection (Fig. 2g and Extended Data Fig. 4). Furthermore, high Zeb2 but low Zeb1 gene activity was also characteristic of Exh-KLR and CTL clusters from Arm infection, suggesting overlapping TF circuits (Fig. 4h). Despite this shared ZEB2-associated ‘CTL’ feature, Exh-KLR from chronic infection had high Tox gene activity, which was absent from CTL clusters from Arm infection (Fig. 4h).
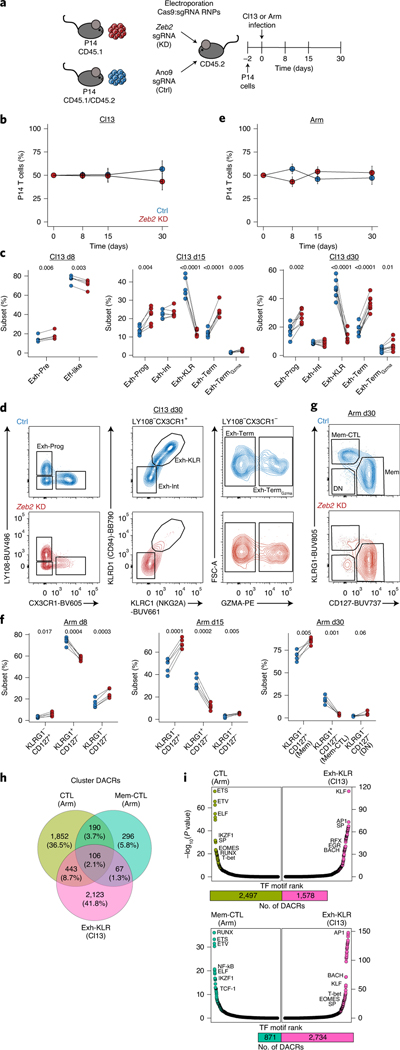
To further interrogate the role of Zeb2, we used CRISPR-mediated knockdown (KD) (Fig. 5a and Extended Data Fig. 1f)40. Loss of Zeb2 had minimal effect of total cell number over time in Cl13 (Fig. 5b) but altered the differentiation pattern of Tex subsets (Fig. 5c,d). At d8, there was skewing away from Eff-like cells and toward the Exh-Pre subset. By d15, the effect of Zeb2 loss was more dramatic, and there was a substantial loss of Exh-KLR cells with concomitant increase in Exh-Prog, Exh-Term and Exh-TermGzma subsets, confirming a role for Zeb2 in the differentiation of the Exh-KLR subset. These results were mirrored in Arm infection. Zeb2 KD had minimal effect on overall cell number (Fig. 5e) but decreased CTL subsets (KLRG1+D127−), including an almost total loss of Mem-CTL cells at d30 (Fig. 5f,g), in agreement with previous studies26–28. In contrast, Zeb1 KD led to a substantial decrease in total cell number across all subsets in Cl13 (Extended Data Fig. 7a–d and Extended Data Fig. 1f), confirming a broad requirement for this TF in chronic infection for persistence.
Fig. 5 |. Zeb2 promotes differentiation of epigenetically distinct cytotoxic CD8+ T cell subsets in chronic and acute-resolving viral infection.
a, Experimental schematic for testing the role of Zeb2 in Cl13 versus Arm infection. b, Frequency of Zeb2 KD versus control (Ctrl) over time in the spleen in Cl13 infection. Data are presented as mean values ± s.d. c, Enumeration of subsets from Cl13 infection as gated in Fig. 3j. d, Representative flow cytometry plots from d30 Cl13 infection as indicated. e, Frequency of Zeb2 KD versus Ctrl over time in the spleen in Arm infection. Data are presented as mean values ± s.d. f, Enumeration of subsets from Arm infection. g, Representative flow cytometry plots from d30 Arm as indicated. In b–g, n = 5 d8 Cl13, n = 7 d15 Cl13, n = 8 d30 Cl13, n = 5 d8 Arm, n = 5 d15 Arm and n = 5 d30 Arm mice. Data are representative of three independent experiments. Cells are gated as live single CD8+ P14 cells KD or Ctrl (Extended Data Fig. 1f). In b, d, e and g, P values were calculated using two-sided paired Student’s t-test with Benjamini–Hochberg correction. h, Venn diagram of overlapping DACRs in scATAC-seq CTL, Mem-CTL and Exh-KLR clusters. i, TF motif enrichment in DACRs comparing scATAC-seq Exh-KLR and CTL (top) or Mem-CTL (bottom) clusters with total number of DACRs represented as bar plot below. TF motif enrichment was calculated with Signac FindMotifs, which uses a hypergeometric test and Benjamini–Hochberg correction. RNP, ribonucleoprotein; sgRNA, single-guide RNA.
Given the shared requirement for Zeb2 in CD8+ T cell subsets in acute-resolving and chronic infection, we next compared the epigenetic programs used in Exh-KLR and the Arm-derived CTL clusters. Most Exh-KLR ACRs (2,123/2,739) were unique compared to Arm-derived CTL and Mem-CTL (Fig. 5h). Exh-KLR shared only ~11% and ~3% ACRs with CTL and Mem-CTL, respectively. DACRs unique to Exh-KLR were enriched in KLF and AP1 motifs, whereas those in CTL and Mem-CTL were enriched for ETS, ETV and RUNX motifs (Fig. 5i). Thus, the Exh-KLR subset uses epigenetic and transcriptional modules related to cytolytic activity and NK biology that are also used by CD8+ T cells in acute-resolving viral infections, but the Exh-KLR subset is otherwise largely distinct from CTLs generated following Arm infection.
PD-1 blockade promotes differentiation of exhausted T cell subsets
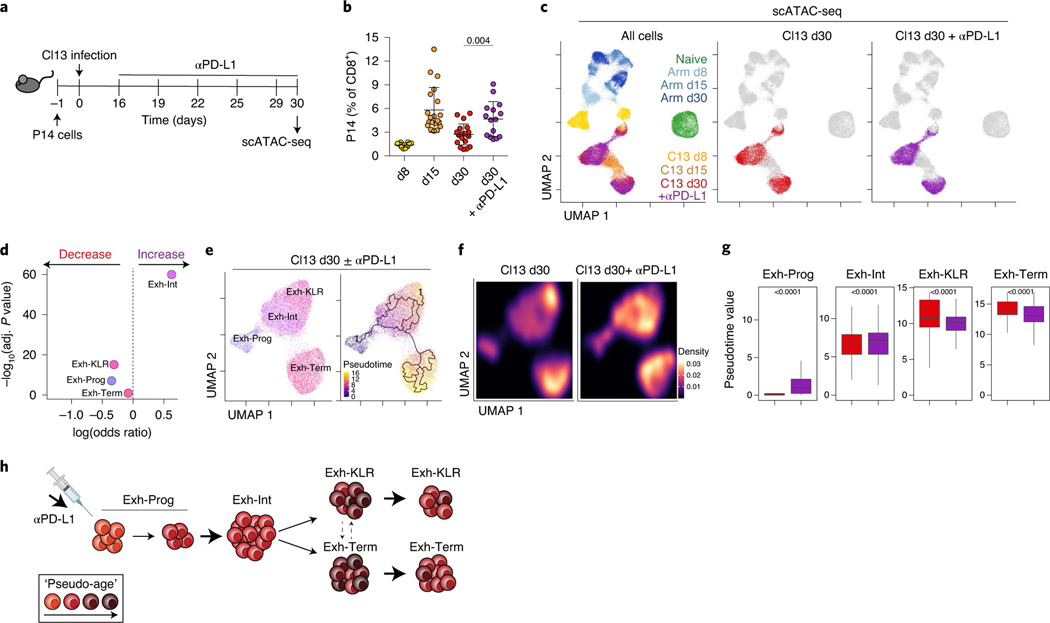
The distinct epigenetic landscape of Tex cells limits their ability to re-differentiate into Teff or Tmem cell following PD-1 blockade or antigen removal14–16. PD-1 blockade targets Exh-Prog6–8 resulting in expansion of Tex intermediate/transitory cells10,11. Our data indicate that the Tex intermediate/transitory population is heterogeneous and contains Exh-Int and Exh-KLR subsets. How PD-1 blockade impacts the balance of these subsets is unknown. Thus, we treated Cl13-infected mice with αPD-L1 and examined responding Tex cells by scATAC-seq (Fig. 6a,b) because ACR profiles reflect cell fate more accurately than transcriptional data.
Fig. 6 |. PD-1 pathway blockade alters exhausted T cell subset dynamics within the preexisting population structure.
a, Experimental schematic. b, Frequency of blood P14 cells determined by flow cytometry. Data are presented as mean values ± s.d. Each dot is a mouse. d30 with and without αPD-L1 were compared with a two-sided Student’s t-test. n = 10 d8, n = 20 d15, n = 20 d30, n = 15 d30 + αPD-L1 mice. Data are from one scATAC-seq experiment. c, scATAC-seq UMAPs colored by infection, time point and treatment as indicated. d, Difference in the number of cells in each scATAC-seq Tex cluster with and without αPD-L1 using Fisher’s exact test. e, scATAC-seq UMAP of Cl13 d30 cells with or without αPD-L1, colored by cluster (left) or pseudotime calculated by Monocle (right). f, scATAC-seq UMAP of Cl13 d30 cells with and without αPD-L1 colored by density. g, Pseudotime within each scATAC-seq cluster comparing cells with or without αPD-L1 using two-sided Wilcoxon test. The number of cells in each cluster is available in Supplementary Table 7. h, The schematic shows a summary of results. In box plots, the median is indicated by the center line; box limits represent upper and lower quartiles; and whiskers extend to 1.5 times the interquartile range.
We first determined where cells from αPD-L1-treated mice were positioned in the overall scATAC-seq UMAP space (Fig. 6c). This analysis demonstrated that cells from αPD-L1-treated mice largely overlapped with Tex cells from control-treated mice (Fig. 6c). PD-1 blockade did not produce cells that overlapped with Teff or Tmem cells from Arm infection, nor did it result in the formation of new Tex epigenetic cluster(s). However, PD-1 blockade substantially altered Tex subset frequencies (Fig. 6d), increasing Exh-Int cells and decreasing Exh-KLR and Exh-Prog subsets. Nevertheless, these changes were associated with minimal DACR changes within each subset (Supplementary Table 4). To further investigate, we used pseudotime analysis, which suggested a trajectory from Exh-Prog to Exh-Int then to either Exh-Term or Exh-KLR (Fig. 6e) and revealed a shift in cell density in UMAP space within these clusters following αPD-L1 (Fig. 6f). These analyses point to an increase in ‘pseudo-age’ of Exh-Prog and Exh-Int after αPD-L1 and a decrease in pseudo-age of Exh-KLR and Exh-Term suggesting new cells entered these clusters and/or ‘older’ terminally differentiated Tex cells were lost (Fig. 6g,h). Together, these data demonstrate that PD-1 pathway blockade alters Tex subset dynamics within the preexisting Tex population hierarchy, accelerating differentiation of Exh-Prog to Exh-Int.
TCF-1+ precursors initiate distinct memory or exhausted T cell differentiation trajectories
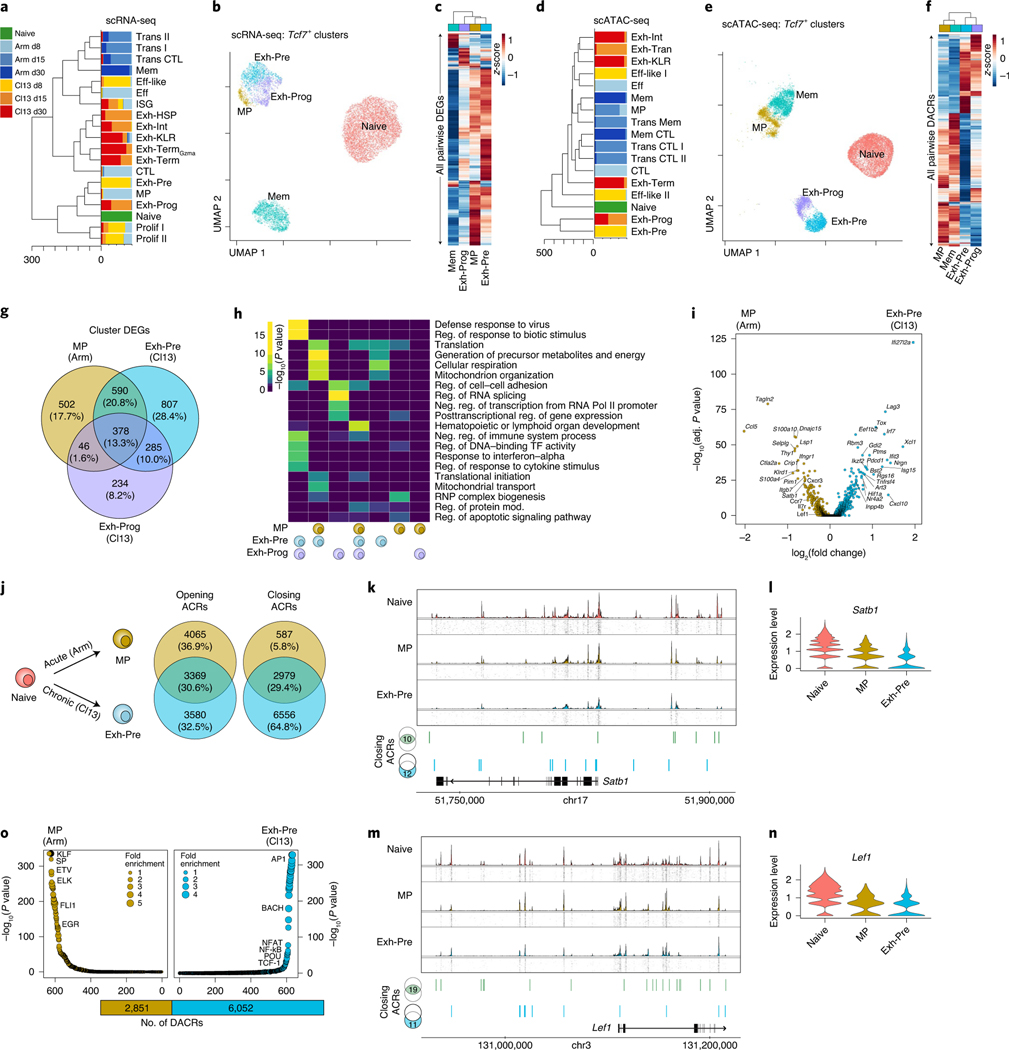
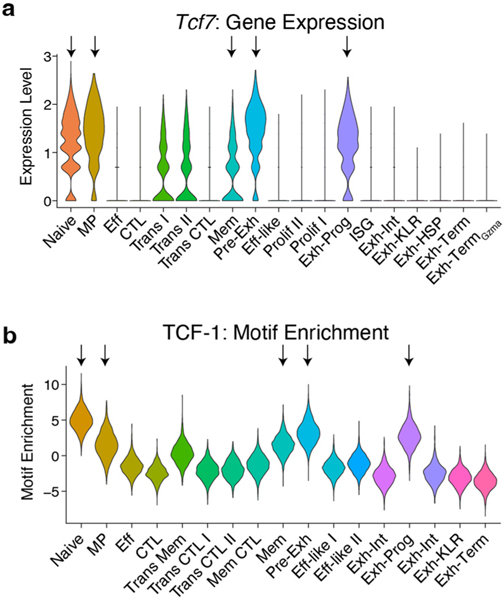
A major unresolved question is whether cells expressing TCF-1 (Tcf7) are the same between acute infections (memory lineage) versus chronic infections and tumors (exhaustion lineage). Therefore, we compared the Tcf7-expressing subsets generated in Arm and Cl13 (Extended Data Fig. 8a,b). First, we constructed a phylogenetic tree using all scRNA-seq clusters (Fig. 7a), revealing some transcriptional similarity at d8 between infections. By d15, however, subsets from the same infection were most similar to each other. For example, Tcf7-expressing MP from d8 Arm and Exh-Pre from d8 Cl13 infection were transcriptionally similar; however, by d15, subsets from Arm infection formed a unique branch, whereas the Exh-Prog subset from Cl13 branched off from d8 Exh-Pre and MP (Fig. 7a). UMAP analysis also reflected these relationships where MP, Exh-Pre and Exh-Prog subsets clustered together in a different UMAP location than either Mem or Naïve cells (Fig. 7b). Analysis of DEGs revealed shared and distinct transcriptional patterns and highlighted the relative quiescence of Mem cells (Fig. 7c). While scRNA-seq clustered Exh-Pre, Exh-Prog and MP together, the scATAC-seq phylogenetic tree revealed Exh-Pre and Exh-Prog were epigenetically distinct from all other clusters (Fig. 7d). Also, in contrast to the scRNA-seq data, MP and Mem were most similar to each other based on scATAC-seq (Fig. 7d). These epigenetic relationships between Tcf7+ subsets were also clear in the scATAC-seq UMAP (Fig. 7e). These four Tcf7+ CD8+ T cell subsets also displayed distinct chromatin accessibility profiles that highlighted an exhaustion-associated versus a memory-associated ACR pattern (Fig. 7f). Together, these data demonstrate epigenetic divergence between virus-specific CD8+ T cells in settings that result in Tex versus Tmem cell differentiation.
Fig. 7 |. Acute-resolving and chronic infections generate Tcf7-expressing progenitors with divergent accessible chromatin profiles.
a,d, Phylogenetic tree of scRNA-seq (a) or scATAC-seq (d) clusters; bar plots represent the proportion of cells per infection and time point. b,e, UMAP from scRNA-seq (b) or ATAC-seq (e) of Naïve, MP, Mem, Exh-Pre and Exh-Prog subsets, colored by subset. c, Average gene expression per cluster of all pairwise DEGs. f, Average accessibility per cluster of all pairwise DACRs. g, Venn diagram of MP, Exh-Pre and Exh-Prog DEGs. h, Gene Ontology of DEGs in g performed with Metascape, which uses a hypergeometric test and Benjamini–Hochberg P-value correction algorithm. i, DEG analysis between MP and Exh-Pre clusters. Calculation performed with Seurat FindMarkers two-sided Wilcoxon test using Bonferroni correction. j, Venn diagram of DACRs calculated between scATAC-seq naïve and MP or Naïve and Exh-Pre clusters. k,m, Coverage and tile plots from scATAC-seq of the Satb1 locus (k) or Lef1 locus (m); DACRs closing in both MP and Exh-Pre (green) or only in Exh-Pre (blue), compared to Naïve, are indicated on the bottom. l,n, Gene expression of Satb1 (l) or Lef1 (n). o, TF motif enrichment of DACRs comparing MP and Exh-Pre; the total number of DACRs are represented as bar plot below. Enrichment was calculated with Signac FindMotifs, which uses a hypergeometric test and Benjamini–Hochberg correction.
These results revealed transcriptional similarity among MP, Exh-Pre and Exh-Prog subsets perhaps reflecting convergence of gene expression related to cell activation early in infection. MP and Exh-Pre shared expression of 968 genes, 378 of which were also expressed by Exh-Prog (Fig. 7g). Among these three cell types, the Exh-Pre cluster had the greatest number (807) of uniquely expressed genes (Fig. 7g). Gene Ontology analysis revealed that many pathways shared between MP and Exh-Pre were related to cellular metabolism, including cellular respiration, generation of metabolites, and mitochondrial function (Fig. 7h), consistent with the simultaneous ‘stem-like’ and active state of Tcf7+ cells early during both acute-resolving and chronic infection. However, the expression of viral response gene programs in Exh-Pre and Exh-Prog, but not MP, points to induction of distinct pathways in Cl13 at d8 compared to Arm. Despite some shared pathways, MP and Exh-Pre subsets differed in expression of the exhaustion-driving TF encoded by Tox, consistent with previous data21, the IR Lag3 and many ISGs (Fig. 7i). Thus, MP and Exh-Pre subsets in acute-resolving and chronic infection, share transcriptional features of T cell activation and metabolic activity that may drive colocalization in scRNA-seq space. Nevertheless, Exh-Pre subsets have a distinct transcriptional program that includes key exhaustion-specific TFs and IRs.
Given the epigenetic divergence of subsets from acute-resolving versus chronic infection, we next compared chromatin accessibility changes between Naïve and d8 precursor cells in Arm (MP) versus Cl13 (Exh-Pre) (Fig. 7j). Among regions with increased accessibility, one-third were shared and one-third each were unique to MP or Exh-Pre. In contrast, most DACRs that lost accessibility were unique to Exh-Pre (6,556 ACRs, ~65%). MP only had 587 regions that closed (~6%), and 2,979 ACRs (~30%) were closed in both MP and Exh-Pre subsets. Some regions that lost accessibility between Naïve and Exh-Pre cells were near genes related to self-renewal, including Satb1 41 and Lef1 (ref. 42). At the Satb1 locus, 10 ACRs lost accessibility in both MP and Exh-Pre; however, an additional 12 were closed only in Exh-Pre (Fig. 7k), and this pattern was reflected in the gene expression profiles (Fig. 7l); Lef1 followed a similar pattern (Fig. 7m,n). Thus, one major distinction of Tex cell precursors in chronic infection may be decreased expression of stem-associated genes, a set of changes that could prevent full conversion to quiescence. Finally, we directly compared ACRs in Exh-Pre and MP identifying enrichment of AP1 motifs in Exh-Pre-specific ACRs (Fig. 7o), suggesting a role for TCR signaling in shaping the Exh-Pre epigenetic landscape and/or TCR-dependent TFs operating in this ACR landscape. In contrast, MP were enriched in accessibility for ETS family TFs, including FLI1, a TF that may restrain activation43. These data reveal distinct paths of Tcf7-expressing cells early during acutely resolved versus chronic infection and identify different biological modules that can be present in TCF-1-positive ‘stem’ or ‘progenitor’-like cells.
Biological circuits in the transition from Exh-Pre to Exh-Prog
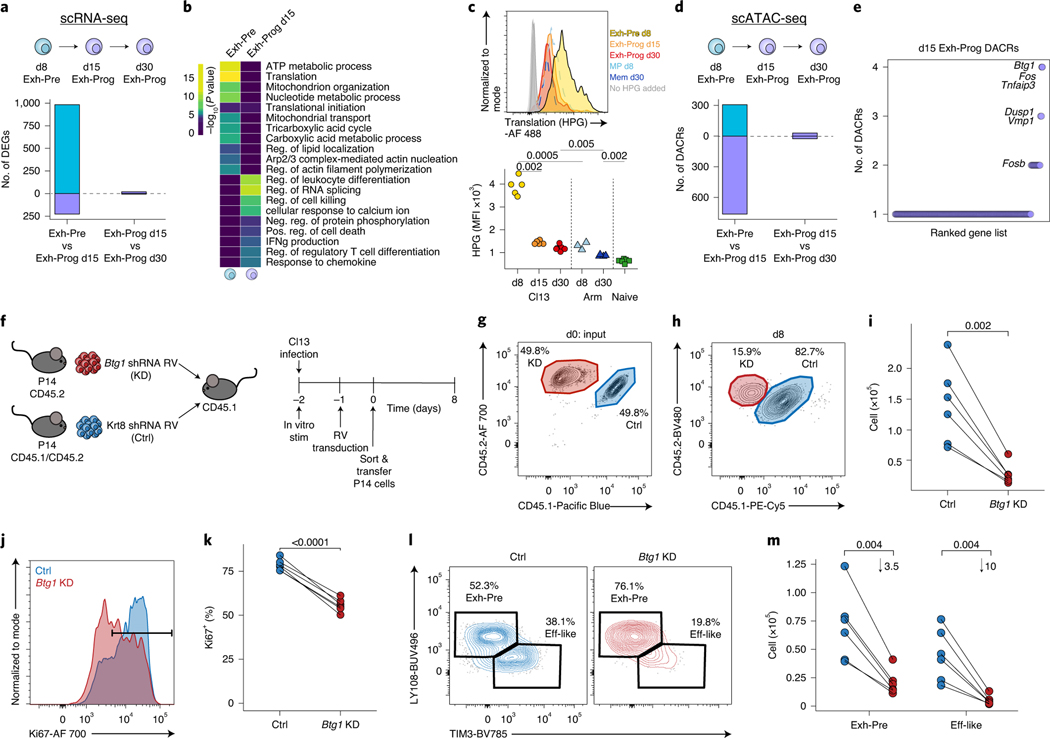
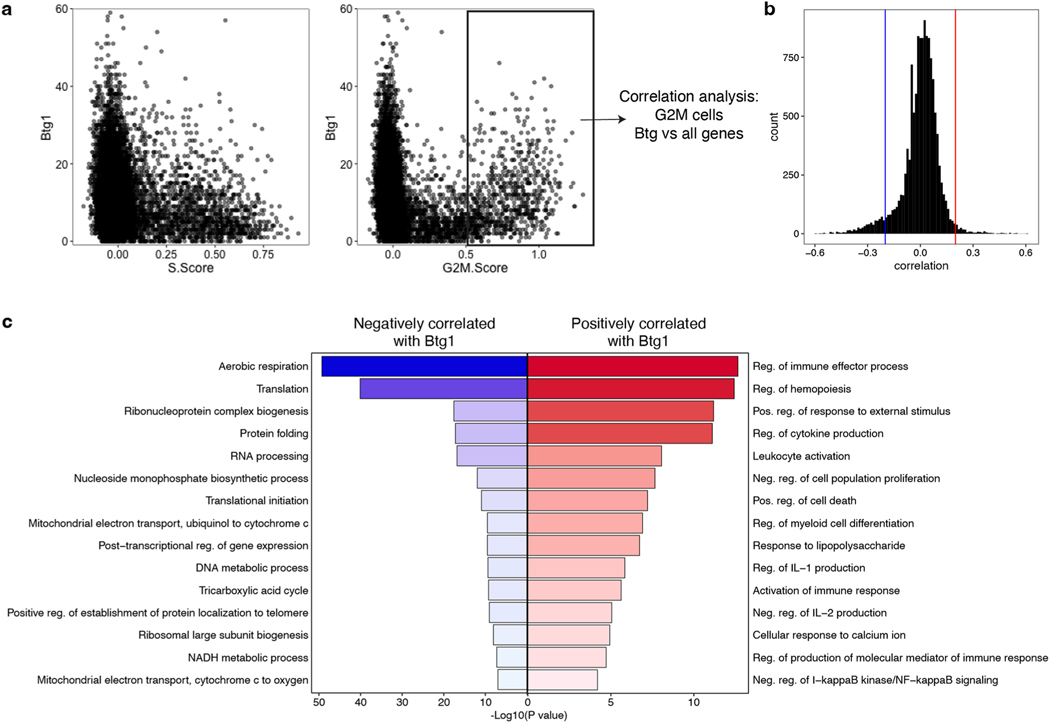
Finally, we investigated transcriptional and epigenetic changes between Exh-Pre and Exh-Prog because this transition marks irreversibility in commitment to exhaustion15,39,44. Almost 1,000 genes were increased in Exh-Pre from d8 versus d15 Exh-Prog, but very few genes changed between d15 and d30 (Fig. 8a), consistent with establishment of Tex cells by d15. Exh-Pre DEGs were enriched in pathways related to metabolism and mitochondrial function (Fig. 8b), supporting the results above indicating Exh-Pre cells are highly activated at d8. Here, we found a decrease in these pathways from Exh-Pre to Exh-Prog as well as decreased protein translation (Fig. 8b). Because protein translation is one of the most bioenergetically costly cellular activities45, it may be challenging to sustain high translational activity in Tex cells despite ongoing antigen stimulation. We used an in vitro translation assay that measures uptake of l-homopropargylglycine (HPG) to assess protein translation. At d8, Exh-Pre from Cl13 had significantly higher HPG incorporation than MP from Arm infection (Fig. 8c). However, by d15 in Cl13, this HPG signal was substantially reduced in Exh-Prog (Fig. 8c). These data indicate that despite ongoing antigen stimulation during chronic infection, one major feature of the Exh-Pre to Exh-Prog transition is reduced metabolic and protein translation activities. Establishing a more quiescent state juxtaposed to strong continued stimulation may be necessary to ensure cellular persistence in chronic infection. In contrast to the scRNA-seq data that indicated increased transcriptional activity in Exh-Pre, scATAC-seq revealed a greater number of DACRs in d15 Exh-Prog compared to d8 Exh-Pre (Fig. 8d). Several gene loci had multiple DACRs including Fos, Fosb, Dusp1, Tnfaip3 and Btg1 (Fig. 8e). Btg1 was of particular interest because of its role in maintaining homeostasis under stress46. In Tex cells, Btg1 expression was low in cells in S phase but increased during cell division where Btg1 expression correlated with G2/M score—suggesting that Btg1 decreases during DNA replication then is reexpressed as cells divide (Extended Data Fig. 9a). Btg1 expression was positively correlated with the regulation of multiple of processes (for example, immune effector responses) and negatively correlated with cellular processes associated with activation, including aerobic respiration and translation, as well as DNA and RNA metabolic processes (Extended Data Fig. 9b,c). These results suggest that Btg1 has a role in returning Tex cells to a more quiescent state after proliferation, analogous to its reported function in hematopoietic stem cells47.
Fig. 8 |. Transition from Exh-Pre to Exh-Prog uncovers Btg1 as a new regulator of exhausted T cell differentiation.
a, Enumerated DEGs from pairwise analysis. DEGs were calculated with Seurat FindMarkers two-sided Wilcoxon test using Bonferroni correction. b, Gene Ontology of DEGs from a performed with Metascape, which uses a hypergeometric test and Benjamini–Hochberg P-value correction algorithm. c, Representative flow cytometry plot (top) and enumeration of MFI of HPG signal (bottom) from in vitro translation assay. Cells were gated as described in Fig. 3j. n = 5 d8 Cl13, n = 5 d15 Cl13, n = 6 d30 Cl13, n = 5 d8 Arm, n = 4 d30 Arm and n = 6 naive mice. Data are representative of two independent experiments. P values were calculated with two-sided Student’s t-test using Benjamini–Hochberg correction. d, Enumerated DACRs from pairwise analysis as indicated. DACRs were calculated with Signac FindAllMarkers two-sided LR test using Bonferroni correction. e, Number of DACRs in d15 Exh-Prog per gene loci. Select genes overlapping with d15 Exh-Prog DEGs are annotated. f, Experimental schematic. g, Flow cytometry plot of input P14 cell mixture containing Btg1 KD and Ctrl. h, Representative flow cytometry plot from d8 p.i. Cells were gated on RV+ (GFP) live CD8+ P14 T cells (Extended Data Fig. 1g). Mean percentage is indicated. i, Total P14 cells with Btg1 KD or Ctrl RV. P values were calculated with two-sided paired Student’s t-test. j, Representative flow cytometry plot of Ki67 staining; histograms were colored by shRNA target. k, Total Ki67+ cells per shRNA target as indicated. P values were calculated with two-sided paired Student’s t-test. l, Representative flow cytometry plots of Tex subsets. Cells gated on RV+ live P14 T cells. Mean percentage as indicated. m, Total RV+ live P14 T cells per each subset. Mean fold change is indicated. P values were calculated with two-sided paired Student’s t-test with Benjamini–Hochberg correction. In h–m, n = 6 mice. Each point represents a mouse. Data are representative of three independent experiments.
To test whether Btg1 has a role in vivo, we used retroviral (RV)-mediated short hairpin (sh)RNA KD (Fig. 8f and Extended Data Fig. 10a,b). We transduced P14 cells with RV-encoding shRNA targeting Btg1 or Krt8 (an irrelevant control gene; Ctrl) followed by dual adoptive transfer into congenically distinct mice infected with Cl13 (Fig. 8f). Despite an equal mixture of cells targeting the Ctrl versus Btg1 in the input population (Fig. 8g and Extended Data Fig. 1g), Btg1 KD resulted in significantly fewer Tex cells by d8 (Fig. 8h,i). Moreover, among Btg1 KD cells, the frequency of Ki67+ dividing cells was substantially reduced (Fig. 8j,k) consistent with a potential role for Btg1 in sustaining highly proliferative cells. Although Exh-Pre and Eff-like Tex subsets were both numerically reduced, the impact of Btg1 KD was most profound in the Eff-like cells (Fig. 8l,m). The analyses above suggested a role for Btg1 in regulating the transition from the highly stimulated Exh-Pre population present in the first week of chronic infection to a more ‘regulated’ Exh-Prog population by d15. Here, we find that KD of Btg1 had a profound effect early, by d8 after infection, on the number Tex cells and ability to form the Eff-like subset. Together, these data indicate a key role for this stress response gene in the ability to generate early Tex cells and in the transition from the early phase of exhaustion to formation of established Tex cells.
Discussion
We used the LCMV model of CD8+ T cell differentiation in combination with single-cell transcriptional and epigenetic analyses to investigate the developmental trajectories of Tmem and Tex cells, revealing several key insights not previously possible through bulk analyses. First, scATAC-seq defined fewer clusters compared to scRNA-seq, demonstrating that multiple transcriptional states can exist from fewer epigenetic cell fates. Transcriptional analysis may have less resolution in defining cell identity due to convergent patterns of gene expression from distinct cell types. These data support the idea that chromatin accessibility profiles are better suited to define cell ‘fates’. Second, these analyses uncovered new subpopulations of Teff, Tmem and Tex cells, including a Tex subset expressing NK receptors (Exh-KLR) and an early Tmem subset distinguished by cytolytic potential (Mem-CTL). Although these NK-receptor-expressing CD8+ T cell subsets in Arm and Cl13 infection shared this biological circuit, including a requirement for Zeb2, these subsets were otherwise largely distinct cell types. Third, we tested the effect of PD-1 blockade on these epigenetically defined Tex cell subsets and found preferential expansion of the Exh-Int subset and evidence of repopulating the more terminal Tex cell subsets, Exh-KLR and Exh-Term, with new cells. Fourth, we identified epigenetically distinct TCF-1+ CD8+ T cell populations in chronic and acute-resolving infection. TCF-1-positive populations shared some transcriptional features; however, the subsets were imprinted with unique, accessible chromatin landscapes that further evolved over time as Tmem and Tex cells developed. Therefore, TCF-1 expression in non-naïve CD8+ T cells is not sufficient to define the biology of these stem/progenitor populations. The ability to distinguish between Exh-Pre and Exh-Prog may be particularly relevant in settings where initial activation is not synchronized such as in a mutating or evolving tumor. Recently activated Exh-Pre subsets retain more fate flexibility44 and would be predicted to respond differently than Exh-Prog subsets to immunotherapies. Disentangling closely related but distinct CD8+ T cell populations such as Exh-Pre and Exh-Prog could have key relevance for understanding immune responses after treatment and for identifying clinical biomarkers. Lastly, we identified the stress response gene Btg1 as a new regulator of Tex cells that may mediate the transition from Exh-Pre to Exh-Prog.
In summary, scRNA-seq and scATAC-seq landscapes of Teff, Tmem and Tex cells revealed subpopulation heterogeneity and developmental trajectories. Comparative analysis across these cell types identified shared and distinct transcriptional and epigenetic programs underlying cellular identities. These data overall highlight a key theme of ‘reusing’ biological circuits in different CD8+ T cell populations. This concept was apparent for NK-associated cytotoxicity and TCF-1 progenitor biology that were found in epigenetically distinct CD8+ T cell subpopulations. Thus, this transcriptional and chromatin accessibility landscape map provides insights into the developmental biology and underlying mechanisms governing Teff, Tmem and Tex cell differentiation and may help identify specific targets or pathways for future therapeutic manipulation.
Online content
Any methods, additional references, Nature Research reporting summaries, source data, extended data, supplementary information, acknowledgements, peer review information; details of author contributions and competing interests; and statements of data and code availability are available at https://doi.org/10.1038/s41590-022-01338-4.
Methods
Human sample data
Data from tumor samples from patients with melanoma were generated as part of a previously published36 phase 1b clinical trial (NCT02434354), which was a single-institution investigator-initiated study sponsored by the University of Pennsylvania. The protocol and its amendments were approved by the Institutional Review Board at the University of Pennsylvania, and all patients provided written informed consent. All detailed methods regarding the trial, patients and sample collection are available in ref. 36. Age and sex information is provided in Supplementary Table 3.
Mice
P14 transgenic mice expressing a TCR specific for the LCMV peptide gp33–41 were bred at the University of Pennsylvania and backcrossed onto the NCI C57BL/6 background. C57BL/6 recipient mice were purchased from Charles River and used at 6–7 weeks of age; males and females were used and sex matched with donor mice. Mice were housed in a specific-pathogen-free animal facility at the University of Pennsylvania at ~20 °C (68 °F) with humidity at ~55%, and the dark–light cycle was 12 h–12 h. All mouse use, experiments, protocols and breeding conditions were in accordance with Institutional Animal Care and Use Committee guidelines for the University of Pennsylvania and are in compliance with the ethical guidelines of the University of Pennsylvania that comply with the US national and international guidelines.
Adoptive T cell transfer
Recipient mice were adoptively transferred with peripheral blood mononuclear cells containing P14 CD8+ T cells isolated from peripheral blood of donor P14 mice using gradient centrifugation with Histopaque-1083 (Sigma-Aldrich). For most experiments, 500 naïve P14 cells were adoptively transferred intravenously (i.v.) into 6- to 7-week-old sex-matched recipient mice 1 d before infection. In long-term Arm experiments (d60 and d200), 5,000–10,000 naïve P14 cells were transferred to facilitate adequate cell recovery at late time points after infection. Recipients were of a distinct congenic background to allow for identification of donor populations from host CD8+ T cells.
Infections
LCMV Arm and Cl13 were grown in BHK cells (American Type Culture Collection (ATCC), CL-10) and titrated using plaque assay on VERO cells (ATCC, CCL-81) using plaque assay as previously described in ref. 49. Recipient mice were infected intraperitoneally (i.p.) with LCMV Armstrong (2 × 10⁵) plaque-forming units (PFUs) or i.v. with LCMV Cl13 (4 × 10⁶ PFUs) 1 d after adoptive transfer of P14 cells. For the scRNA-seq/scATAC-seq experiment (Fig. 1a,b), the number of mice infected per condition was 10 for d8 Arm, 15 for d15 Arm, 15 for d30 Arm, 10 for d8 Cl13, 20 for d15 Cl13, 20 for d30 Cl13 and 15 for d30 Cl13 + αPD-L1. For the long-term Arm memory experiment (Fig. 2i), four mice were infected for each d60 and d200.
PD-1 blockade
PD-1 blockade was performed with five treatments of 200 μg αPD-L1 antibody (10 F.9G2, BioXCell, BE0101) i.p. every 3 d starting 16 d after infection with LCMV Cl13. Analysis was performed 1 d after final treatment. For control treatments, PBS was administered i.p. The blockade experiment was performed at the same time as the experiment in Fig. 1a.
Cell sorting for sequencing libraries
Spleens from mice in the same experimental group (for example, d8 Arm, d15 Arm) were processed together, five at a time. Spleens were homogenized using a Miltenyi gentleMACS Dissociator in C tubes. CD8+ T cells were enriched using an EasySep magnetic negative selection kit (Stem Cell Technologies, 19853), according to the manufacturer’s recommendations. Cells were washed with 1× PBS and stained with an amine-reactive dye (BioLegend, 423106) for 20 min at room temperature (~22 °C) to assess cell viability, followed by an antibody cocktail in complete RPMI (cR10, RPMI-1640 medium supplemented with 10% FBS, 1× non-essential amino acids (Gibco, 11140050) and 10 mM HEPES (Gibco, 15630080, 7.2 to 7.5), 2 mM l-glutamine (Gibco, 25030081), 100 U ml−1 penicillin–streptomycin (Gibco, 15140122) and 14.3 μM beta-mercaptoethanol) for 45 min on ice. Samples were sorted on a BD FACSAria II machine into complete RPMI (cR50, RPMI-1640 medium supplemented with 50% FBS, 1× non-essential amino acids (Gibco, 11140050) and 10 mM HEPES (Gibco, 15630080, 7.2 to 7.5), 2 mM l-glutamine (Gibco, 25030081), 100 U ml−1 penicillin–streptomycin (Gibco, 15140122) and 14.3 μM beta-mercaptoethanol). Cells gated as live single CD8+ P14 cells designated by congenic markers. A small aliquot of all sorted samples was run as a purity check. Voltages on the machine were standardized using fluorescent targets and Spherotech rainbow beads (URCP-50–2F).
Flow cytometry
Single-cell suspensions were prepared by mechanically disrupting spleen through a 70-μm cell strainer using the plunger of a 3-ml syringe; followed by red blood cell lysis with ACK buffer (Gibco, A10492-01). Cells were washed with PBS and stained with an amine-reactive dye (BioLegend, 423104) for 20 min at room temperature (~22 °C) to assess cell viability. Surface staining (Supplementary Table 5) was performed for 45 min at room temperature (~22 °C) in staining medium (SM), PBS with 3% FCS, 5 mM EDTA and 1% penicillin–streptomycin, followed by secondary staining using streptavidin-Brilliant Blue 790 (BD Biosciences) in SM for 30 min on ice. Permeabilization was performed using the Foxp3 Fixation/Permeabilization Concentrate and Diluent kit (eBioscience, 00-5521-00) for 20 min. Intracellular staining with antibody cocktails was performed for 2 h at room temperature (~22 °C). Samples were run on a BD FACSymphony A5 instrument or BD LSR II instrument. Voltages on the machine were standardized using fluorescent targets and Spherotech rainbow beads (URCP-50-2F). Data were analyzed with FlowJo software (version 10.5.3, TreeStar).
Translation assay
The protein translation assay was adapted from ref. 50. First, single-cell suspensions were prepared as described above (‘Flow cytometry’). Then, the cells were washed and plated at 1 million cells per well in a V-bottom 96-well plate in methionine-free R10 (Gibco, A1451701) supplemented with 10% FBS, 1× non-essential amino acids (Gibco, 11140050), 10 mM HEPES (Gibco, 15630080, 7.2 to 7.5), 2 mM l-glutamine (Gibco, 25030081), 100 U ml−1 penicillin–streptomycin (Gibco, 15140122) and 14.3 μM beta-mercaptoethanol. The cells were rested at 37 °C for 3 h, then 400 μM Click-iT HPG (Invitrogen, C10186) was added. After 3 h, cells were stained with viability dye and surface antibody cocktail as described above (‘Flow cytometry’). Then, the cells were fixed and permeabilized (BD, 51–2090KZ) for 20 min at room temperature (~22 °C), followed by one wash with perm wash (BD, 51-2091KZ) and one wash with PBS. Next, the Click-iT reaction was performed according to the manufacturer’s protocol (Invitrogen, C10641). Samples were analyzed as described above (‘Flow cytometry’).
shRNA cloning and retroviral transduction
shRNA sequences (Supplementary Table 6) and cloning strategy are as described in ref. 51. Briefly, 97-mer shRNA oligonucleotides were synthesized (IDT) and 4 pmol was amplified with HotStarTaq polymerase (Qiagen, 203207) using the primers miR-E-fw (5′-TGAACTCGAGAAGGTATATTGCTGTTGACAGTGAGCG-3′) and miR-E-rev (5′-TCTCGAATTCTAGCCCCTTGAAGTCCGAGGCAGTAGGC-3′). Following amplification, reactions were purified (Qiagen MinElute PCR Purification Kit, 28004) and subsequently digested with XhoI/EcoRI using standard techniques. Amplicons were purified (Qiagen MinElute Reaction Cleanup Kit, 28206) and ligated into XhoI/EcoRI-digested LMPd plasmid (kindly provided by the S. Crotty, La Jolla Institute for Immunology) with T4 DNA ligase. Sequence-verified plasmids were then used to transform TOP10 chemically competent bacterial cells (Thermo Fisher, C404010) and endotoxin-free plasmid stocks were prepared (Qiagen EndoFree Plasmid Maxi Kit, 12362). RV was generated for each construct as previously described in ref. 52 using 293T cells (ATCC, CRL-3216).
For RV transduction, single-cell suspensions were prepared by mechanically disrupting spleen through a 70-μm cell strainer using the plunger of a 3-ml syringe. CD8+ T cells were enriched using an EasySep magnetic negative selection kit (Stem Cell Technologies, 19853) according to the manufacturer’s recommendations. P14 T cells were stimulated with αCD3 (1 mg ml−1), αCD28 (0.5 mg ml−1) and interleukin (IL)-2 (100 U ml−1) (PeproTech). Thirty hours after activation, T cells were were transduced via spin infection for 75 min at 2,000g at 37 °C with RV supernatant containing polybrene (4 mg ml−1) and IL-2 (100 U ml−1). Approximately 24 h later, GFP-positive cells were sorted on a BD FACSAria II machine into cR50. A small aliquot of all sorted samples was run as a purity check. Voltages on the machine were standardized using fluorescent targets and Spherotech rainbow beads (URCP-50-2F). Sorted cells were washed twice with warm unsupplemented RPMI. An equal number of cells transduced with the Krt8 (control, Ctrl) RV or Btg1 RV (25,000 Krt8 + 25,000 Btg1) were transferred i.v. into mice that had been infected with LCMV Cl13 2 days before (the same day as in vitro stimulation).
CRISPR knockdown
Gene editing was performed as described in ref. 40. Briefly, naïve P14 CD8+ T cells were enriched using EasySep magnetic negative selection (Stem Cell Technologies, 19858) according to the manufacturer’s recommendations. RNP complexes were generated by incubating 0.6 μl 1.5 nmol sgRNAs (two guides per experimental gene target; Supplementary Table 6; Alt-R CRISPR-Cas9 IDT) with 1 μl Cas9 protein (IDT, 1081059) for 10 min. RNPs were added to 2–5 million naïve P14 CD8+ T cells, which were then electroporated using a Lonza 4D-NucleofectorTM 4 Core Unit (Lonza, AAF-1002B) and 4D-NucleofectorTM 5 X Kit S electroporation kit (Lonza, V4XP6 3032). cRPMI was added to electroporated cells followed by resting in a 37 °C incubator for 10 mins. An equal number of cells electroporated with the control (Ano9) or target (Zeb1 or Zeb2) (1,000 Ano9 + 1,000 Zeb1 or Zeb2) were co-transferred i.v. into congenically distinct mice that were infected 48 h later as described above.
scRNA-seq library generation
scRNA-seq libraries were generated using the 10x Genomics Chromium Single Cell 3′ Library (v2). In brief, sorted CD8+ P14 T cells were washed with 0.04% BSA PBS, then approximately 20,000 cells were loaded into a 10x Chromium controller. All downstream library preparation steps were performed according to the manufacturer’s instructions. Libraries were assessed using an Agilent Tapestation and quantified using a KAPA Library Quantification Kit (KK4824) and sequenced on an Illumina NovaSeq.
scATAC-seq library generation
scATAC-seq libraries were generated using the 10x Genomics Chromium Cell ATAC Reagent Kit (v1). In brief, sorted CD8+ P14 T cells were washed with 0.04% BSA PBS, then approximately 40,000 cells were subjected to the nuclei preparation protocol according to the manufacturer’s instructions. Then, 16,000 nuclei were loaded into a 10x Chromium controller. All downstream library preparation steps were performed according to the manufacturer’s instructions. Libraries were assessed using an Agilent Tapestation and quantified using a KAPA Library Quantification Kit (KK4824) and sequenced on an Illumina NovaSeq.
scRNA-seq data processing and analysis
scRNA-seq data were generated using the 10x Cell Ranger pipeline (3.0.2) and mm10 genome. Specifically, we generated fastq files using cellranger mkfastq, then quantified reads using cellranger count, and cellranger aggr to combine samples. Downstream analysis was performed in R (version 4.0.2) and Seurat (version 4.0.4) using default parameters unless otherwise noted. Cells with less than 200 features and more than 0.75% mitochondrial reads were excluded. Standard Seurat data processing and normalization steps were performed: SCTransform, RunPCA, RunUMAP, FindNeighbors and FindClusters; clusters with low-quality scores were removed, and the final resolution was 0.9. Clusters 9 and 13, which split in a high resolution, were kept separate based on their large number of DEGs. Proliferation analysis used the CellCycleScoring function (Seurat). DEGs were calculated using the functions FindAllMarkers or FindMarkers (Seurat) for pairwise comparisons using a log2 fold-change threshold of 0.125 and an adjusted P value of less than 0.05, and included the number of counts as a latent variable. Gene-set enrichment was performed using the AddModuleScore function (Seurat), and Gene Ontology analysis of DEGs used Metascape (https://metascape.org/) with all expressed genes as the background gene list. Phylogenetic trees were constructed with the BuildClusterTree function (Seurat). Average gene expression was calculated using the AverageExpression function (Seurat). All heat maps were generated using pheatmap (version 1.0.12). Cluster prediction of proliferating cells (Fig. 3g) was accomplished by creating two Seurat objects, one with proliferating cells and one without proliferating cells using the standard processing steps described above and including S.Score and G2M.Score calculated from CellCycleScoring as variables to regress in the SCTransform calculation. The proliferating cells were then projected onto the UMAP of non-proliferating cells using the Seurat functions FindTransferAnchors, TransferData, IntegrateEmbeddings and ProjectUMAP.
scATAC-seq data processing and analysis
scATAC-seq data were generated using the 10x Cell Ranger ARC pipeline (2.0.0) and mm10 genome. Specifically, we generated fastq files using cellranger mkfastq, then quantified reads using cellranger arc-count. Downstream analysis was performed in R (version 4.0.2), Seurat (version 4.0.4), Signac (1.3.0) and ArchR (1.0.1) using default parameters unless otherwise noted. ArchR was used to perform initial quality control (TSSEnrichment > 10, nFrag > 1,500 and < 30,000, BlacklistRatio < 0.1) and identify doublets. The union peak list was generated using a hybrid approach. Peaks were called using ArchR with default parameters based on clusters generated from the latent semantic indexing dimension reduction of the tile matrix, which allowed peaks to be called on unbiased cell clusters. In addition, we called peaks on the sample bam files (naïve, Arm d8, Arm d15, Arm d30, Cl13 d8, Cl13 d15, Cl13 d30, Cl13 d30 + αPD-L1) using macs2 as previously described22 with a q value of 0.001, then combined the two peak lists. Downstream analysis was performed using the Signac package, unless otherwise noted. In addition to the ArchR metrics, quality-control metrics were also calculated in Signac, and cells were filtered as follows: nCounts_peaks > 3,500 and < 35,000, blacklist_fraction < 0.035 and nucleosome_signal < 5. The custom peak list was added to the Signac object using FeatureMatrix and CreateChromatinAssay. Peak annotation was performed using the ClosestFeature function. Standard processing and normalization steps were performed as follows: FindTopFeatures, RunTFIDF, RunSVD and FindClusters (resolution of 0.9). DACRs were calculated using FindAllMarkers or FindMarkers for pairwise comparisons using the LR test, with a min.pct of 0.05, a log2 fold-change threshold of 0.125 and an adjusted P value less than 0.05, and included the number of counts as a latent variable. ACR-set enrichment was performed using AddModuleScore. Phylogenetic trees were constructed with the BuildClusterTree function. Gene activity was calculated using the GeneActivity function followed by Normalize Data with the LogNormalize method. Differentiation gene activity was calculated using FindAllMarkers or FindMarkers for pairwise comparisons using the LR test, with a min.pct of 0.05, a log2 fold-change threshold of 0.125 and an adjusted P value less than 0.05, and included the number of counts as a latent variable. TF motif enrichment was calculated using the functions getMatrixSet with JASPAR2020 (species 9606), CreateMotifMatrix, CreateMotifObject and RunChromVar with BSgenome.Mmusculus. UCSC.mm10. Differential TF motif enrichment was calculated using FindAllMarkers or FindMarkers for pairwise comparisons using the LR test, with a min.pct of 0.05, a log2 fold-change threshold of 2 and an adjusted P value less than 0.05, and included the number of counts as a latent variable. Pseudotime was calculated using the Signac wrapper functions for Monocle, cluster_cells, learn_graph, order_cells and pseudotime. The root cell was determined as max enrichment for the TCF7 motif. Genome coverage tracks were generated using the following Signac visualization functions: CovPlot, PeakPlot, TilePlot and AnnotationPlot.
Statistics
Details of statistical tests are described in the figure legends and/or in the Methods. Nonparametric tests were used throughout except for analytic flow cytometry experiments, which were analyzed with a two-sided Student’s t-test using Benjamini–Hochberg correction where indicated. Data distribution was assumed to be normal but was not formally tested. No data were excluded from the analyses. Mice were allocated to groups randomly (simple randomization). Blinding was not performed due to requirements for cage labeling; data analysis was quantitative, not qualitative. Group sizes for experiments were selected based upon previous knowledge. Sample size choice and assumption of normality were based on similar analyses in published studies, for adoptive transfer experiments (for example, refs. 44,53,54). For scRNA-seq and scATAC-seq, 20,000–40,000 cells were collected per sample; each sample was collected from a pool of 4–20 mice (biological replicates) as in previous publications (for example, refs. 15,21,55).
Reporting summary
Further information on research design is available in the Nature Research Reporting Summary linked to this article.
Data availability
scRNA-seq and scATAC-seq data generated in this study are deposited in the National Center for Biotechnology Information Gene Expression Omnibus under accession GSE199565. Processed Seurat R objects are available here. Source data are provided with this paper.
Code availability
All analyses were done with custom R scripts and are available upon request using standard R packages. No new algorithms were developed during this study.
Extended Data
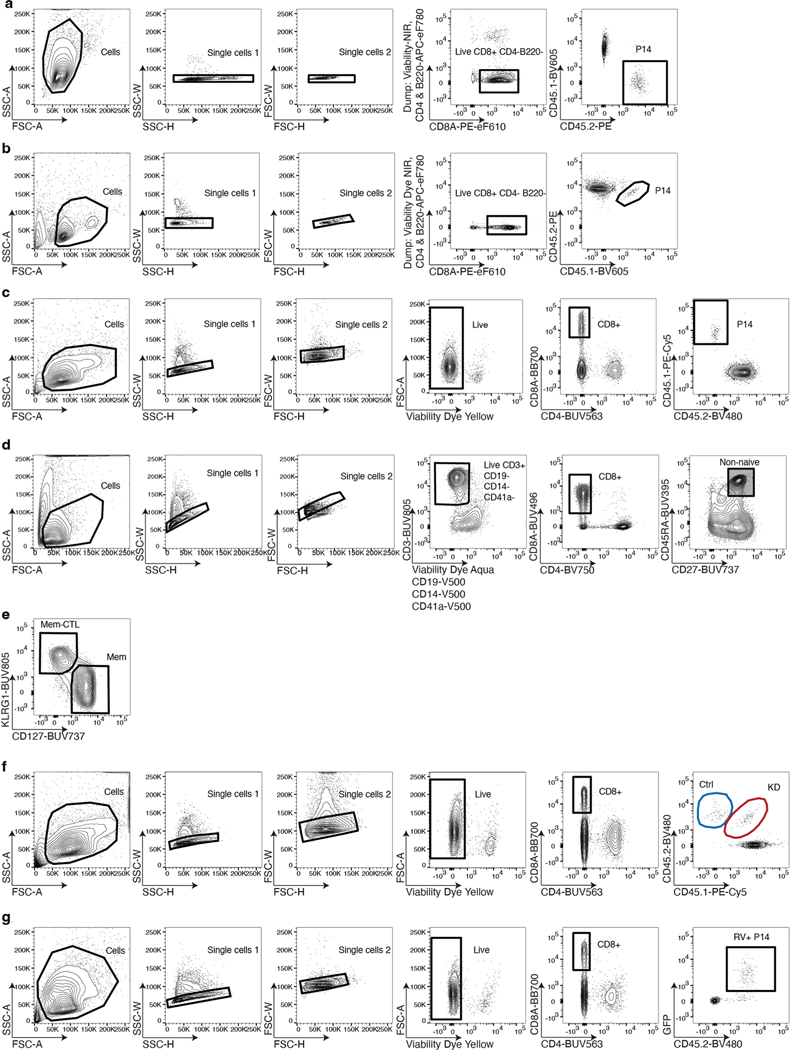
Extended Data Fig. 1 |. Flow cytometry gating schemes.
a) Sort strategy of scRNA-seq/scATAC-seq depicted in Fig. 1a,b. b) Sort strategy of scATAC-seq depicted in Fig. 2i. c) Gating strategy for Fig. 3j. d) Gating strategy for Extended Data Fig. 5b. e) Gating strategy for Fig. 3m. f) Gating strategy for Fig. 5b-f. g) Gating strategy for Fig 8 g-m.
Extended Data Fig. 2 |. UMAP analysis of scRNA-seq and scATAC-seq by infection and timepoint.
UMAP from (a) scRNA-seq and (b) scATAC-seq colored by infection and timepoint as indicated.
Extended Data Fig. 3 |. Effector and memory clusters defined by scRNA-seq and scATAC-seq identify shared and non-overlapping cell subsets.
Percentage of cells from Arm infection by timepoint as indicated in (a) scRNA-seq clusters and (b) scATAC-seq clusters. c) scATAC-seq UMAP (left) and scRNA-seq UMAP (right) colored with d30 Arm cells.
Extended Data Fig. 4 |. ZEB1 motif is enriched in non-CTL clusters.
scATAC-seq UMAP of cells from Arm infection colored by ZEB1 motif enrichment. The location of CTL and non-CTL clusters is indicated.
Extended Data Fig. 5 |. CD8+ TIL from human melanoma post-PD1 blockade express NK receptors.
a) Sample schematic. b) Representative flow cytometry plots of four patients. Cells are first gated as live single non-naïve (not CD45RA+CD27+) CD8+ T cells. (Extended Data Fig.1d) c) Enumeration of subsets gated in (b). Two-sided paired Student’s t-test. n = 11 patients.
Extended Data Fig. 6 |. scATAC-seq defined clusters Eff-like I and Eff-like II are distinguished by DACRs at gene loci related to migration.
a) Barplot representing the number of DACRs between scATAC-seq clusters Eff-like I and Eff-like II. b) Number of Eff-like II DACRs per gene loci. Genes of interest annotated.
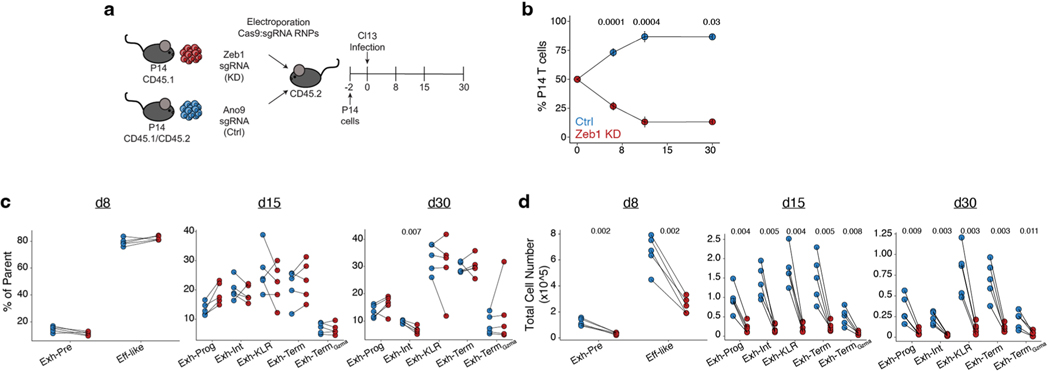
Extended Data Fig. 7 |. Zeb1 is critical for persistence of exhausted CD8+ T cells.
a) Experimental schematic for testing the role of Zeb1 in Cl13 infection. b) Frequency of Zeb1 KD versus control (Ctrl) over time in the spleen in Cl13 infection. Data are presented as mean values +/− standard deviation. Enumeration of Tex subsets gated as in Fig. 3j as percent of parent (c) and total number (d). (b-d) P values calculated with two-sided paired Student’s t-test with Benjamini– Hochberg correction. n = 5 d8 Cl13, 5 d15 Cl13, 5 d30 Cl13, 5 d8 Arm, 5 d15 Arm, 5 d30 Arm mice. Data representative of 2 independent experiments.
Extended Data Fig. 8 |. Identification of Tcf7-expressing progenitor/stem-like CD8+ T cell subsets.
a) Gene expression from scRNA-seq of all scRNA-seq defined clusters. b) Motif enrichment from scATAC-seq of all scATAC-seq defined clusters.
Extended Data Fig. 9 |. Btg1 expression is associated with return to quiescence after proliferation.
a) Gene expression of Btg1 compared to cell cycle phase scores in Cl13. b) Correlation of Btg1 with all other expressed genes in within G2M+ cells as indicated. c) Gene ontology of genes positively or negatively correlated Btg1 performed with performed with metascape.org which uses hypergeometric test and Benjamini-Hochberg p-value correction algorithm.
Extended Data Fig. 10 |. Retroviral-mediated knock down of Btg1.
a) Experimental schematic. b) qPCR results of shRNA-mediated knockdown of Btg1. Bar represents mean, points represent independent experiments.
Supplementary Material
Acknowledgements
We thank members of the laboratory of E.J.W. This work was supported by T32 CA009140 and a Cancer Research Institute-Mark Foundation Fellowship (to J.G.), by the Parker Institute for Cancer Immunotherapy and Stand Up to Cancer and National Institutes of Health (NIH) grants AI155577, AI149680, AI108545, AI082630, DK127768 and CA210944 (to E.J.W.). Work in the Wherry laboratory is supported by the Parker Institute for Cancer Immunotherapy. S.F.N. was supported by an Australia NHMRC C.J. Martin Fellowship (GNT1111469) and the Mark Foundation Momentum Fellowship. O.K. was supported by an NIAID F30 fellowship (F30AI129263). D.M. was supported through The American Association of Immunologists Intersect Fellowship Program for Computational Scientists and Immunologists. J.E.W. was supported by a PICI Scholar award. Y.J.H. was supported by a National Science Foundation graduate research fellowship. A.C.H. was supported by NIH grant K08-CA230157, the Damon Runyon Clinical Investigator Award, Doris Duke Clinical Scientist Development Award, W. W. Smith Charitable Trust Award, the Tara Miller Foundation and P50 CA174523. The melanoma clinical trial was supported by SPORE grant P50CA261608.
Competing interests
E.J.W. is a member of the Parker Institute for Cancer Immunotherapy, which supported the study. E.J.W. is an advisor for Danger Bio, Marengo, Janssen, Pluto Immunotherapeutics, Related Sciences, Rubius Therapeutics, Synthekine and Surface Oncology. E.J.W. is a founder of Surface Oncology, Danger Bio and Arsenal Biosciences. E.J.W. has a patent on the PD-1 pathway. O.K. holds equity in Arsenal Biosciences and is an employee of Orange Grove Bio. A.C.H. is a consultant for Immunai and receives funding from BMS. X.X. is scientific cofounder of CureBiotech and Exio Biosciences. T.M. is on the scientific advisory board for Merck, BMS, OncoSec, GigaGen and Instil Bio. G.C.K. is on the scientific advisory board for Merck and was the principal investigator of an investigator-initiated trial sponsored by Merck.
Footnotes
Additional information
Extended data is available for this paper at https://doi.org/10.1038/s41590-022-01338-4.
Supplementary information The online version contains supplementary material available at https://doi.org/10.1038/s41590-022-01338-4.
Peer review information Nature Immunology thanks Fotini Gounari and the other, anonymous, reviewer(s) for their contribution to the peer review of this work. Primary Handling Editor: L. A. Dempsey, in collaboration with the Nature Immunology team.
Reprints and permissions information is available at www.nature.com/reprints.
References
- 1.Kaech SM et al. Selective expression of the interleukin-7 receptor identifies effector CD8+ T cells that give rise to long-lived memory cells. Nat. Immunol. 4, 1191–1198 (2003). [DOI] [PubMed] [Google Scholar]
- 2.Joshi NS et al. Inflammation directs memory precursor and short-lived effector CD8+ T cell fates via the graded expression of t-bet transcription factor. Immunity 27, 281–295 (2007). [DOI] [PMC free article] [PubMed] [Google Scholar]
- 3.Martin MD & Badovinac VP. Defining memory CD8+ T cell. Front. Immunol. 9, 2692 (2018). [DOI] [PMC free article] [PubMed] [Google Scholar]
- 4.Chung HK, McDonald B & Kaech SM. The architectural design of CD8+ T cell responses in acute and chronic infection: Parallel structures with divergent fates. J. Exp. Med. 218, e20201730 (2021). [DOI] [PMC free article] [PubMed] [Google Scholar]
- 5.McLane LM, Abdel-Hakeem MS & Wherry EJ. CD8+ T cell exhaustion during chronic viral infection and cancer. Annu. Rev. Immunol. 37, 457–495 (2019). [DOI] [PubMed] [Google Scholar]
- 6.Im SJ et al. Defining CD8+ T cells that provide the proliferative burst after PD-1 therapy. Nature 537, 417–421 (2016). [DOI] [PMC free article] [PubMed] [Google Scholar]
- 7.Utzschneider DT et al. T cell factor 1-expressing memory like CD8+ T cells sustain the immune response to chronic viral infections. Immunity 45, 415–427 (2016). [DOI] [PubMed] [Google Scholar]
- 8.Blackburn SD, Shin H, Freeman GJ & Wherry EJ. Selective expansion of a subset of exhausted CD8+ T cells by αPD-L1 blockade. Proc. Natl Acad. Sci. USA 105, 15016–15021 (2008). [DOI] [PMC free article] [PubMed] [Google Scholar]
- 9.Krishna S et al. Stem-like CD8+ T cells mediate response of adoptive cell immunotherapy against human cancer. Science 370, 1328–1334 (2020). [DOI] [PMC free article] [PubMed] [Google Scholar]
- 10.Hudson WH et al. Proliferating transitory T cells with an effector-like transcriptional signature emerge from PD-1+ stem-like CD8+ T cells during chronic infection. Immunity 51, 1043–1058 (2019). [DOI] [PMC free article] [PubMed] [Google Scholar]
- 11.Beltra JC et al. Developmental relationships of four exhausted CD8+ T cell subsets reveals underlying transcriptional and epigenetic landscape control mechanisms. Immunity 52, 825–841 (2020). [DOI] [PMC free article] [PubMed] [Google Scholar]
- 12.Zander R et al. CD4+ T cell help is required for the formation of a cytolytic CD8+ T cell subset that protects against chronic infection and cancer. Immunity 51, 1028–1042 (2019). [DOI] [PMC free article] [PubMed] [Google Scholar]
- 13.Paley MA et al. Progenitor and terminal subsets of CD8+ T cells cooperate to contain chronic viral infection. Science 338, 1220–1225 (2012). [DOI] [PMC free article] [PubMed] [Google Scholar]
- 14.Pauken KE et al. Epigenetic stability of exhausted T cells limits durability of reinvigoration by PD-1 blockade. Science 354, 1160–1165 (2016). [DOI] [PMC free article] [PubMed] [Google Scholar]
- 15.Abdel-Hakeem MS et al. Epigenetic scarring of exhausted T cells hinders memory differentiation upon eliminating chronic antigenic stimulation. Nat. Immunol. 22, 1008–1019 (2021). [DOI] [PMC free article] [PubMed] [Google Scholar]
- 16.Yates KB et al. Epigenetic scars of CD8+ T cell exhaustion persist after cure of chronic infection in humans. Nat. Immunol. 22, 1020–1029 (2021). [DOI] [PMC free article] [PubMed] [Google Scholar]
- 17.Sen DR et al. The epigenetic landscape of T cell exhaustion. Science 354, 1165–1169 (2016). [DOI] [PMC free article] [PubMed] [Google Scholar]
- 18.Khan O et al. TOX transcriptionally and epigenetically programs CD8+ T cell exhaustion. Nature 571, 211–218 (2019). [DOI] [PMC free article] [PubMed] [Google Scholar]
- 19.Alfei F et al. TOX reinforces the phenotype and longevity of exhausted T cells in chronic viral infection. Nature 571, 265–269 (2019). [DOI] [PubMed] [Google Scholar]
- 20.Scott AC et al. TOX is a critical regulator of tumour-specific T cell differentiation. Nature 571, 270–274 (2019). [DOI] [PMC free article] [PubMed] [Google Scholar]
- 21.Yao C et al. Single-cell RNA-seq reveals TOX as a key regulator of CD8+ T cell persistence in chronic infection. Nat. Immunol. 20, 890–901 (2019). [DOI] [PMC free article] [PubMed] [Google Scholar]
- 22.Corces MR et al. Lineage-specific and single-cell chromatin accessibility charts human hematopoiesis and leukemia evolution. Nat. Genet 48, 1193–1203 (2016). [DOI] [PMC free article] [PubMed] [Google Scholar]
- 23.Yoshida H et al. The cis-regulatory atlas of the mouse immune system. Cell 176, 897–912 (2019). [DOI] [PMC free article] [PubMed] [Google Scholar]
- 24.Giles JR et al. Human epigenetic and transcriptional T cell differentiation atlas for identifying functional T cell-specific enhancers. Immunity 55, 557–574.e557 (2022). [DOI] [PMC free article] [PubMed] [Google Scholar]
- 25.Wherry EJ et al. Lineage relationship and protective immunity of memory CD8+ T cell subsets. Nat. Immunol. 4, 225–234 (2003). [DOI] [PubMed] [Google Scholar]
- 26.Omilusik KD et al. Transcriptional repressor ZEB2 promotes terminal differentiation of CD8+ effector and memory T cell populations during infection. J. Exp. Med. 212, 2027–2039 (2015). [DOI] [PMC free article] [PubMed] [Google Scholar]
- 27.Dominguez CX et al. The transcription factors ZEB2 and T-bet cooperate to program cytotoxic T cell terminal differentiation in response to LCMV viral infection. J. Exp. Med 212, 2041–2056 (2015). [DOI] [PMC free article] [PubMed] [Google Scholar]
- 28.Guan T et al. ZEB1, ZEB2, and the miR-200 family form a counterregulatory network to regulate CD8+ T cell fates. J. Exp. Med 215, 1153–1168 (2018). [DOI] [PMC free article] [PubMed] [Google Scholar]
- 29.Masopust D & Soerens AG. Tissue-resident T cells and other resident leukocytes. Annu. Rev. Immunol. 37, 521–546 (2019). [DOI] [PMC free article] [PubMed] [Google Scholar]
- 30.Chen Z et al. TCF-1-centered transcriptional network drives an effector versus exhausted CD8+ T cell-fate decision. Immunity 51, 840–855 (2019). [DOI] [PMC free article] [PubMed] [Google Scholar]
- 31.Good CR et al. An NK-like CAR T cell transition in CAR T cell dysfunction. Cell 184, 6081–6100 (2021). [DOI] [PMC free article] [PubMed] [Google Scholar]
- 32.Zheng L et al. Pan-cancer single-cell landscape of tumor-infiltrating T cells. Science 374, abe6474 (2021). [DOI] [PubMed] [Google Scholar]
- 33.Mathewson ND et al. Inhibitory CD161 receptor identified in glioma-infiltrating T cells by single-cell analysis. Cell 184, 1281–1298 (2021). [DOI] [PMC free article] [PubMed] [Google Scholar]
- 34.van Montfoort N et al. NKG2A blockade potentiates CD8+ T cell immunity induced by cancer vaccines. Cell 175, 1744–1755 (2018). [DOI] [PMC free article] [PubMed] [Google Scholar]
- 35.Raulet DH, Marcus A & Coscoy L. Dysregulated cellular functions and cell stress pathways provide critical cues for activating and targeting natural killer cells to transformed and infected cells. Immunol. Rev. 280, 93–101 (2017). [DOI] [PMC free article] [PubMed] [Google Scholar]
- 36.Huang AC et al. A single dose of neoadjuvant PD-1 blockade predicts clinical outcomes in resectable melanoma. Nat. Med 25, 454–461 (2019). [DOI] [PMC free article] [PubMed] [Google Scholar]
- 37.McMahon CW et al. Viral and bacterial infections induce expression of multiple NK cell receptors in responding CD8+ T cells. J. Immunol. 169, 1444–1452 (2002). [DOI] [PubMed] [Google Scholar]
- 38.McMahon CW & Raulet DH. Expression and function of NK cell receptors in CD8+ T cells. Curr. Opin. Immunol. 13, 465–470 (2001). [DOI] [PubMed] [Google Scholar]
- 39.Philip M et al. Chromatin states define tumour-specific T cell dysfunction and reprogramming. Nature 545, 452–456 (2017). [DOI] [PMC free article] [PubMed] [Google Scholar]
- 40.Nüssing S et al. Efficient CRISPR–Cas9 gene editing in uncultured naive mouse T cells for in vivo studies. J. Immunol. 204, 2308–2315 (2020). [DOI] [PubMed] [Google Scholar]
- 41.Will B et al. Satb1 regulates the self-renewal of hematopoietic stem cells by promoting quiescence and repressing differentiation commitment. Nat. Immunol. 14, 437–445 (2013). [DOI] [PMC free article] [PubMed] [Google Scholar]
- 42.Huang C & Qin D. Role of Lef1 in sustaining self-renewal in mouse embryonic stem cells. J. Genet. Genomics 37, 441–449 (2010). [DOI] [PubMed] [Google Scholar]
- 43.Chen Z et al. In vivo CD8+ T cell CRISPR screening reveals control by Fli1 in infection and cancer. Cell 184, 1262–1280 (2021). [DOI] [PMC free article] [PubMed] [Google Scholar]
- 44.Angelosanto JM, Blackburn SD, Crawford A & Wherry EJ. Progressive loss of memory T cell potential and commitment to exhaustion during chronic viral infection. J. Virol. 86, 8161–8170 (2012). [DOI] [PMC free article] [PubMed] [Google Scholar]
- 45.Lane N & Martin W. The energetics of genome complexity. Nature 467, 929–934 (2010). [DOI] [PubMed] [Google Scholar]
- 46.Yuniati L, Scheijen B, van der Meer LT & van Leeuwen FN. Tumor suppressors BTG1 and BTG2: beyond growth control. J. Cell. Physiol. 234, 5379–5389 (2019). [DOI] [PMC free article] [PubMed] [Google Scholar]
- 47.Venezia TA et al. Molecular signatures of proliferation and quiescence in hematopoietic stem cells. PLoS Biol. 2, e301 (2004). [DOI] [PMC free article] [PubMed] [Google Scholar]
- 48.Milner JJ et al. Runx3 programs CD8+ T cell residency in non-lymphoid tissues and tumours. Nature 552, 253 (2017). [DOI] [PMC free article] [PubMed] [Google Scholar]
- 49.Odorizzi PM, Pauken KE, Paley MA, Sharpe A & Wherry EJ. Genetic absence of PD-1 promotes accumulation of terminally differentiated exhausted CD8+ T cells. J. Exp. Med 212, 1125–1137 (2015). [DOI] [PMC free article] [PubMed] [Google Scholar]
- 50.Araki K et al. Translation is actively regulated during the differentiation of CD8+ effector T cells. Nat. Immunol. 18, 1046–1057 (2017). [DOI] [PMC free article] [PubMed] [Google Scholar]
- 51.Fellmann C et al. An optimized microRNA backbone for effective single-copy RNAi. Cell Rep. 5, 1704–1713 (2013). [DOI] [PubMed] [Google Scholar]
- 52.Kurachi M et al. Optimized retroviral transduction of mouse T cells for in vivo assessment of gene function. Nat. Protoc. 12, 1980–1998 (2017). [DOI] [PMC free article] [PubMed] [Google Scholar]
- 53.Shin H, Blackburn SD, Blattman JN & Wherry EJ. Viral antigen and extensive division maintain virus-specific CD8+ T cells during chronic infection. J. Exp. Med. 204, 941–949 (2007). [DOI] [PMC free article] [PubMed] [Google Scholar]
- 54.Wherry EJ, Barber DL, Kaech SM, Blattman JN & Ahmed R. Antigen-independent memory CD8+ T cells do not develop during chronic viral infection. Proc. Natl Acad. Sci. USA 101, 16004–9 (2004). [DOI] [PMC free article] [PubMed] [Google Scholar]
- 55.Yao C. BACH2 enforces the transcriptional and epigenetic programs of stem-like CD8+ T cells. Nat Immunol. 22, 370–380 (2021). [DOI] [PMC free article] [PubMed] [Google Scholar]
Associated Data
This section collects any data citations, data availability statements, or supplementary materials included in this article.
Supplementary Materials
Data Availability Statement
scRNA-seq and scATAC-seq data generated in this study are deposited in the National Center for Biotechnology Information Gene Expression Omnibus under accession GSE199565. Processed Seurat R objects are available here. Source data are provided with this paper.


