Abstract
This paper outlines the major updates of the line-shape parameters that were performed for the nitrous oxide (N2O) and carbon monoxide (CO) molecules listed in the HITRAN2020 database. We reviewed the collected measurements for the air- and self-broadened N2O and CO spectra to determine proper values for the spectroscopic parameters. Careful comparisons of broadening parameters using the Voigt and speed-dependent Voigt line-shape profiles were performed among various published results for both N2O and CO. Selected data allowed for developing semi-empirical models, which were used to extrapolate/interpolate existing data to update broadening parameters of all the lines of these molecules in the HITRAN database. In addition to the line broadening parameters (and their temperature dependences), the pressure shift values were revised for N2O and CO broadened by air and self for all the bands. The air and self speed-dependence of the broadening parameter for these two molecules were added for every transition as well. Furthermore, we determined the first-order line-mixing parameters using the Exponential Power Gap (EPG) scaling law. These new parameters are now available at HITRAN online.
Keywords: HITRAN database, N2O, CO, Line-shape parameters, Air- and self-broadening, Speed-dependent parameter, EPG calculation, First-order line-mixing, Padé approximant
1. Introduction
N2O is a long-lasting (around 115 years) greenhouse gas in the terrestrial atmosphere originating from both natural and anthropogenic (including agricultural activities, combustion of fossil fuels, and solid waste) sources [1–4]. With the current concentration of N2O and its yearly increase of 0.3% in atmospheric concentration [5], N2O is responsible for nearly 6% of greenhouse warming [6]. Moreover, Ravishankara et al. [1] and Crutzen [2] have stated that N2O is the main ozone-depleting substance. Therefore, continuous efforts to monitor and accurately measure the volume mixing ratio of atmospheric N2O are highly desirable. CO, on the other hand, is not a greenhouse gas. However, CO plays a role in chemical reactions within the atmosphere resulting in the formation of greenhouse gases. CO is emitted due to biomass burning and combustion [7] and is formed by reaction of the OH radical with volatile organic compounds [8]. Furthermore, the oxidation of CO by OH results in the formation of ozone and CO2 [9]. The high-accuracy concentration retrieval of these trace gases either from space-based (e.g. the Atmospheric Chemistry Experiment (ACE) mission [10], the Microwave Limb Sounder (MLS) [11,12], the Michelson Interferometer for Passive Atmospheric Sounding (MIPAS) [13], Tropospheric Monitoring Instrument (TROPOMI) [14], Infrared Atmospheric Sounding Interferometer (IASI) [15], and Atmospheric Infrared Sounder (AIRS) sensors [16,17]) or ground-based missions requires the use of sophisticated spectroscopic databases (for the N2O retrieval, the Total Carbon Column Observing Network (TC-CON) [18] uses the HITRAN database [19]). To this end, the spectroscopic parameters retrieved using advanced line-shape models such as the speed-dependent Voigt profile (SDV) [20–24] are required for N2O and CO. These data must be incorporated in updates to spectroscopic databases for the proper wavelength ranges.
This study focuses on the implementation of line-shape parameters for N2O and CO by air- and self-broadening in the HITRAN2020 database [25]. We obtained new parameters for the air-and self-broadened spectral line-shapes of N2O and CO using the Voigt (VP) [26] and speed-dependent Voigt (SDV) profile [20–24]. The first-order (weak) line-mixing parameters [27] were determined through the Exponential Power Gap (EPG) scaling law [28] for all the lines. The modern structure [29,30] of the HITRAN database enables the seamless inclusion of parameters for both profiles.
2. N2O-air and N2O-N2O line-shape parameters
The line list of N2O, in the HITRAN2020 edition, covers the spectral range 0 cm−1 to 10364 cm−1 for five isotopologues. The line positions and line intensities of N2O have not changed in the HITRAN2020 edition, except for the update of the line intensities in the 4ν1 + 2ν2 and 5ν1 bands. The line intensities for these bands have been updated using the recent measurement by Adkins et al. [31]. Also, additional transitions up to J″ = 91 were added for these bands.
In the previous editions of the database [19,32,33], the VP lineshape parameters of N2O (in the ‘.par’ format) had not been modified since the release of HITRAN2004 [34]. These parameters were produced using a polynomial fit to the measured data by Toth [35], Lacome et al. [36], and Nemtchinov et al. [37]. It is worth mentioning that data associated with air-broadening from Loos et al. [38] were introduced in the HITRAN2016 [19] edition for the ν3 band (where available), under the Hartmann-Tran (HT) profile [39] parameters (although essentially it was the SDV profile because all the higher-order HT parameters were set to zero). The recent availability of more accurate state-of-the-art measurements motivated updates of the HITRAN database. Also, for efficient applicability of the database, it is important that the advanced lineshape parameters be available for as many lines as possible and not just for selected transitions.
In updating the line-shape parameters of N2O, we adopted the approach proposed in Ref. [40] that was used for revising the parameters of CO2. We applied sets of Padé approximants (fitted to selected experimental and theoretical data) to calculate the broadening parameters, their temperature dependence, and the speed-dependent parameters for transitions of N2O in the database. This approach provided VP and SDV parameters for all the lines by neglecting vibrational-dependence of the line widths. The equation we used is as follows,
| (1) |
where m is the independent variable (the usual running index of rotational value J), in which the fit coefficients c0, ..., c3 and d1, ..., d4 can be obtained by fits to different data sets. This function permits the extrapolation of experimental results to higher-J transitions.
2.1. Air- and self-broadening parameters of N 2 O and their temperature dependence using the Voigt profile
In the previous editions of the database [19,32–34], the air-broadened parameters of N2O were produced from polynomial fits to the data in Refs. [35–37,41] using the VP. Lacome et al. [36] measured the broadening parameters and the temperature-dependent parameters of N2O broadened by N2O, N2, and O2 using the Fourier-Transform (FT) spectra of N2O in the 4μm and 8μm spectral regions. The temperature range for this measurement [36] was between 220 K to 300 K over the pressures between 0.7099 kPa and 24.44 kPa. Toth [35] measured the FT spectra of N2- and air-broadened N2O at room temperature at the pressure range 38.95 kPa to 65.62 kPa to obtain N2- and air-broadening half-widths and pressure shifts in the 1800 cm−1 to 4800 cm−1 spectral range. Also, the self-half-widths and self-shifts of N2O in the 1800 cm−1 to 2630 cm−1 region were measured in an earlier study by Toth [41]. These FT spectra had been measured at two temperatures 296 K and 301 K and pressures from 0.112 kPa to 67.15 kPa. Nemtchinov et al. [37] measured the FT spectra of N2- and O2-broadened N2O in the ν3 band. The temperature dependence of the widths was investigated in the temperature range between 216 K and 296 K for the pressure range of 11.73–62.78 kPa. Recently, Adkins et al. [31] measured the near-IR region for the 4200–0000 and 5000–0000 bands of N2O-air lines at the National Institute of Standards and Technology (NIST) using frequency-agile, rapid scanning cavity ring-down spectroscopy measurements [42] in the pressures 9.3 kPa, 15.3 kPa, 29.1 kPa, 37.5 kPa, and 42.7 kPa. The authors used the Multi-spectrum Analysis Tool for Spectroscopy (MATS) [43] to retrieve the air-broadening parameters of N2O using the VP and SDV. Ngo et al. [44] used requantized Classical Molecular Dynamics Simulations (rCMDS) to predict the line-shape parameters for the N2O-air broadened lines using the VP and SDV as well. Also, the temperature exponents of the broadening parameters were obtained from fits of rCMDS spectra, where three different temperatures 200, 250 and 296 K were considered in the analysis.
The γ0-air half-widths of N2O lines for different vibrational bands using the VP versus |m| (with m = −J for the P-branch and m = J + 1 for the R-branch lines) are compared in Fig. 1. The estimated uncertainties of the broadening values reported in Ref. [36] were below 4%. For Refs. [35,37] the uncertainties were about 2% and 3%, respectively. Uncertainties in the rCMDS values [44] were not estimated because of difficulties in their determination. Except for the rCMDS half-widths [44] (after |m| > 19), the majority of the presented results are in good agreement, with the distribution of values exhibiting a standard deviation below 2%. The discrepancy of the broadening parameters for different sets is more noticeable for |m| > 40. The graph indicates that, within the experimental uncertainty, the vibrational dependence of the widths can be ignored. A fit of the Padé approximant to the data in Ref. [31] is shown by the solid line in the plot. The reason for using the air-broadening parameters from the 5ν1 band of Ref. [31] was the closer agreement of the this band data with other measurements (compared to the 4ν1 + 2ν2 band). The uncertainty of the fit is defined by the relative standard deviation of the fit residual from the experimental half-widths.
Fig. 1.
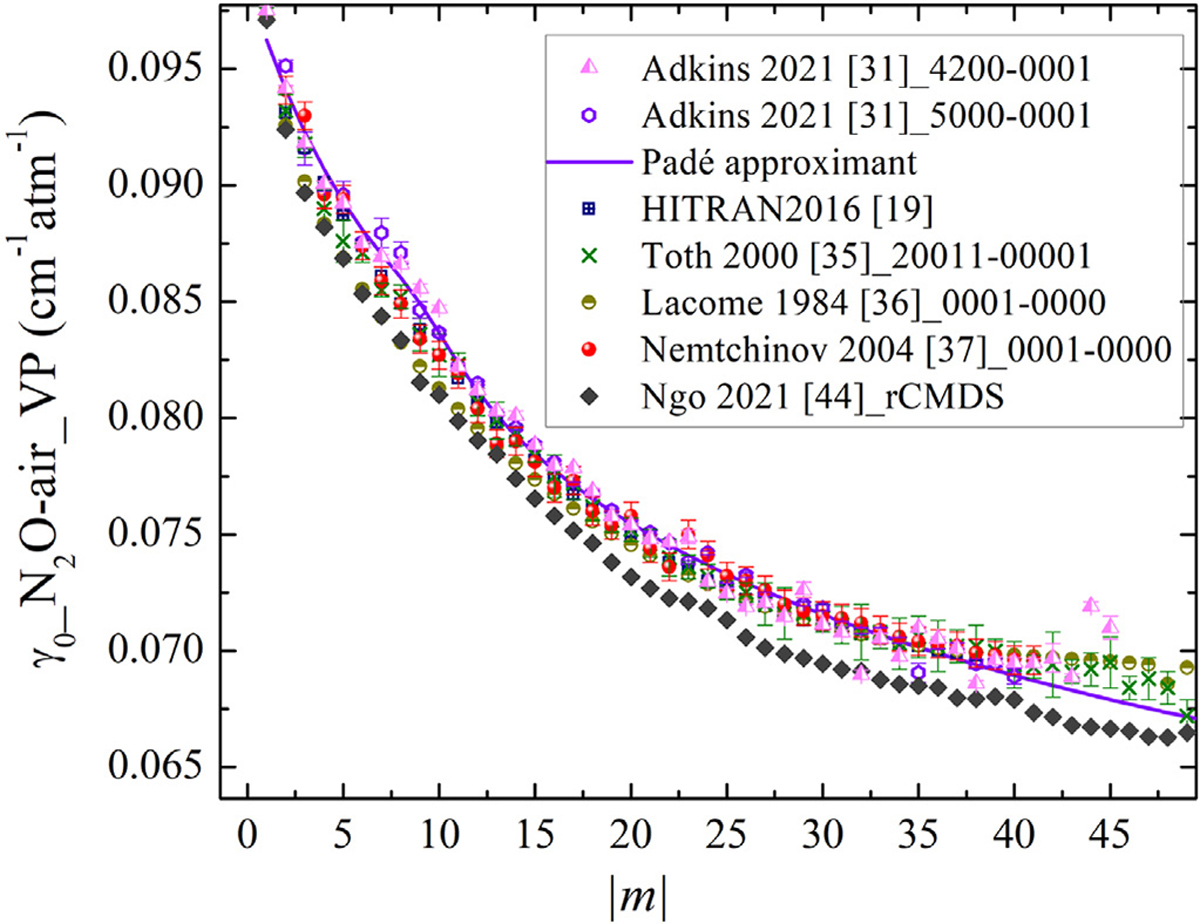
The air-broadening half-widths (γ0-air) in cm−1atm−1 of N2O lines at 296 K plotted versus |m|. The air-broadening values measured by Adkins et al. [31] are compared with the HITRAN2016 values [19] and previous measurements including those of Lacome et al. [36], Toth [35], and Nemtchinov et al. [37]. The recent theoretical results by Ngo et al. [44] using the requantized classical molecular dynamics simulations are shown as well. The Padé approximant smoothed values for the collisional broadening are shown with the solid line.
The data sets, presented in Fig. 1, were employed to determine the residuals (experiment-calculations) in modeling the laboratory spectra. The measured half-widths which resulted in smaller residuals were used for the update of the HITRAN database (see Section 2.5). The determined values from the Padé fit to Ref. [31] were extended to populate the HITRAN database for the entire bands. The fitting coefficients can be found in Table 1.
Table 1.
The fitting coefficients obtained using Eq. (1) for calculating air-broadening parameters, their temperature exponents, and the self-half-widths of N2O at room temperature (in cm−1 atm−1) for the VP line-shape.
| Coef. | γ0-air (VP) [31] | nγ0-air (VP) [37] | γ0-self (VP) [45] |
|---|---|---|---|
|
| |||
| c 0 | 9.868 × 10⁻² | 6.881 × 10⁻¹ | 1.184 × 10⁻¹ |
| c 1 | −1.395 × 10⁻² | −2.162 × 10⁻² | −3.930 × 10⁻³ |
| c 2 | 1.492 × 10⁻⁴ | −6.047 × 10⁻⁴ | −7.807 × 10⁻⁵ |
| c 3 | 4.4905 × 10⁻⁵ | 2.123 × 10⁻⁵ | 3.447 × 10⁻⁶ |
| d 1 | −1.148 × 10⁻¹ | −3.813 × 10⁻² | −1.974 × 10⁻² |
| d 2 | −3.520 × 10⁻³ | −3.399 × 10⁻⁴ | −1.250 × 10⁻³ |
| d 3 | 7.208 × 10⁻⁴ | 1.667 × 10⁻⁵ | 2.891 × 10⁻⁵ |
| d 4 | 6.171 × 10⁻⁷ | 1.070 × 10⁻⁷ | 2.479 × 10⁻⁷ |
The temperature exponents of the air-broadening parameters (for the VP) originate from the measurements of Ref. [37] which were modeled using the power law equation,
| (2) |
Here, γ0(T) is the line-broadening parameter (Lorentzian component) at the reference temperature Tref = 296 K. Note that in the literature and in the HITRAN database, the subscript zero is often not used for the Lorentzian component and only the symbol γ is employed. The parameters were updated for all the lines using fits of the Padé approximant to the measured data from Ref. [37]. The fitting coefficients can be found in Table 1 and the values are presented in Fig. 2. This figure illustrates that the findings of Lacome et al. [36] are consistent with the measured by Nemtchinov et al. [37], while the results of Varanasi and Chudamani [46] match well with the predicted values by the rCMDS method [44]. The graph shows that the values are scattered for m larger than 40. The fit to the VP values approaches about 0.65 for the transitions with higher J. We emphasize that the extrapolated line-shape parameters based on the fitted Padé approximant as given in Fig. 2 and elsewhere in this paper, are intended to provide a reasonable estimate of the line-shape parameters for rotational quanta outside the range of existing measurements or calculations. In the absence of these constraints, uncertainties in these extrapolated quantities are difficult to estimate with confidence.
Fig. 2.
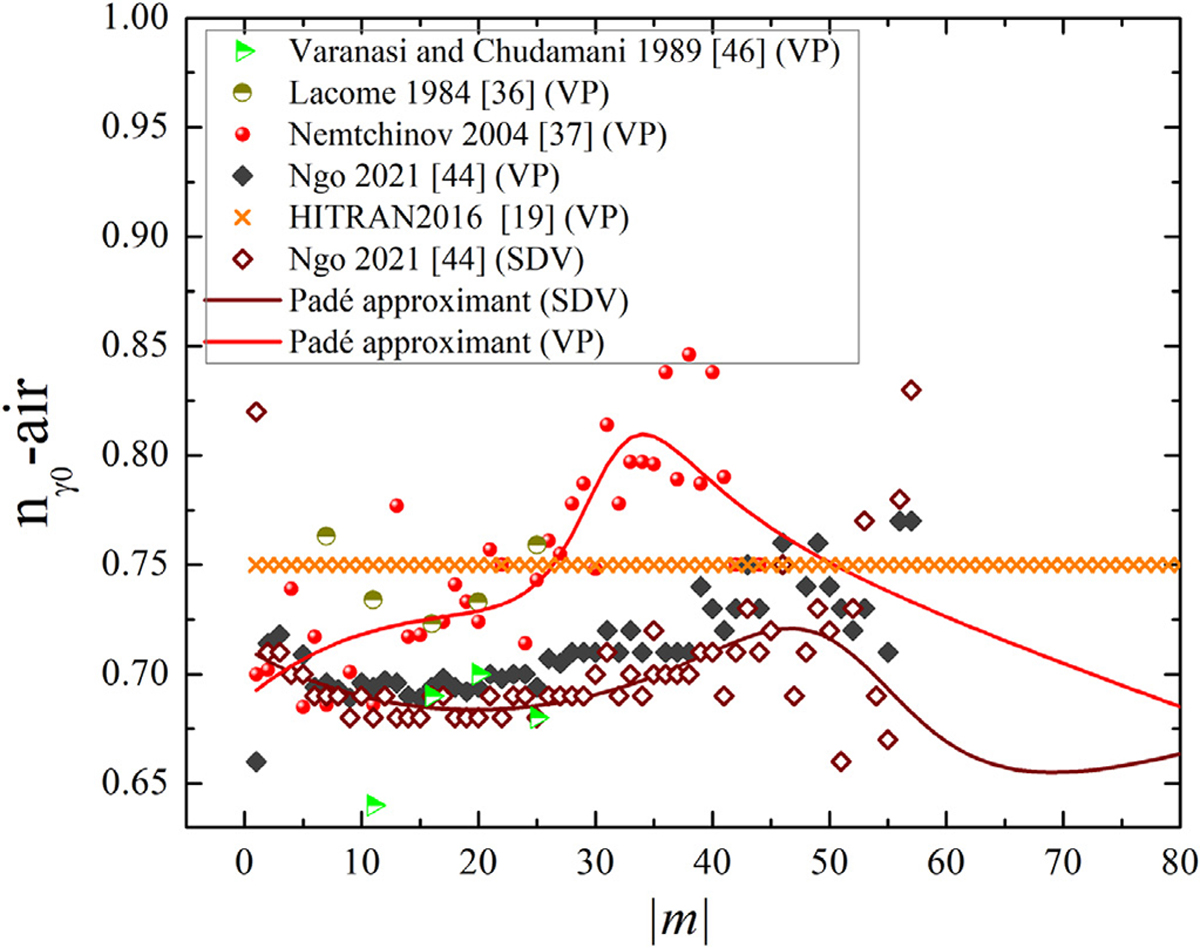
The temperature dependence of the air-broadening half-widths of N2O lines plotted versus m. The -air values measured using the VP by Lacome et al. [36], Toth [35], Nemtchinov et al. [37], Varanasi and Chudamani [46], and HITRAN2016 are plotted. The results by Ngo et al. [44] using the rCMDS prediction are shown as well for the VP and SDV. The Padé approximants for the temperature dependence for both VP and SDV values are shown with the solid lines.
The N2O-N2O broadening values in HITRAN2016 were based on the study by Toth [41]. For the HITRAN2020 edition, the data measured by Werwein et al. [45] were fit using a Padé approximant. The authors of that work measured the FT spectra of pure N2O to retrieve the self-broadening and self-shift parameters in the 0002 – 0000 band, and determined the spectroscopic parameters in the pressure range of 5.3 kPa to 101.9 kPa for lines up to J = 40 at 296 K. The fitting constants are provided in Table 1 and the extrapolated results were used to replace previous HITRAN2016 data for all the bands.
2.1.1. Air- and self-broadening parameters of N 2 O and their temperature dependence using the SDV profile
In the previous editions of the HITRAN database, the SDV profile parameters were not provided for N2O. However, in the atmospheric retrievals by ACE-FTS, to reduce the systematic residuals, Boone et al. [47] emphasized the importance of including non-Voigt parameters for the N2O molecule. Thanks to availability of the recent accurate measurements of N2O with more sophisticated experimental and analysis tools, the SDV parameters were added to the database. As mentioned in Section 2.1, Adkins et al. [31] measured the 4200 – 0000 and 5000 – 0000 bands of N2O-air using the SDV line profile to model the observed line-shapes. Ngo et al. [44] used requantized Classical Molecular Dynamics Simulations to predict the line-shape parameters for the N2O-air broadened lines using speed-dependent profiles. The ν3 band of N2O was studied by Loos et al. [38], where they carried out accurate, room-temperature measurements of air-broadening, pressure-shift, speed-dependent parameters, and first-order line-mixing parameters with FT spectra collected at a pressure range between 10 kPa and 100 kPa. As already mentioned, these parameters were used as the HT profile [39] parameters in the HITRAN2016 edition. Furthermore, Predoi-Cross et al. [48] measured the FT spectra of N2O broadened by air at pressures 14.79–67.13 kPa and retrieved the air-half-widths, air-shift parameters, and the Rosenkranz [27] parameters at room temperature in the ν3 band region using the SDV line-shape model. The overlaid air-broadening parameters for different bands are displayed in Fig. 3.
Fig. 3.
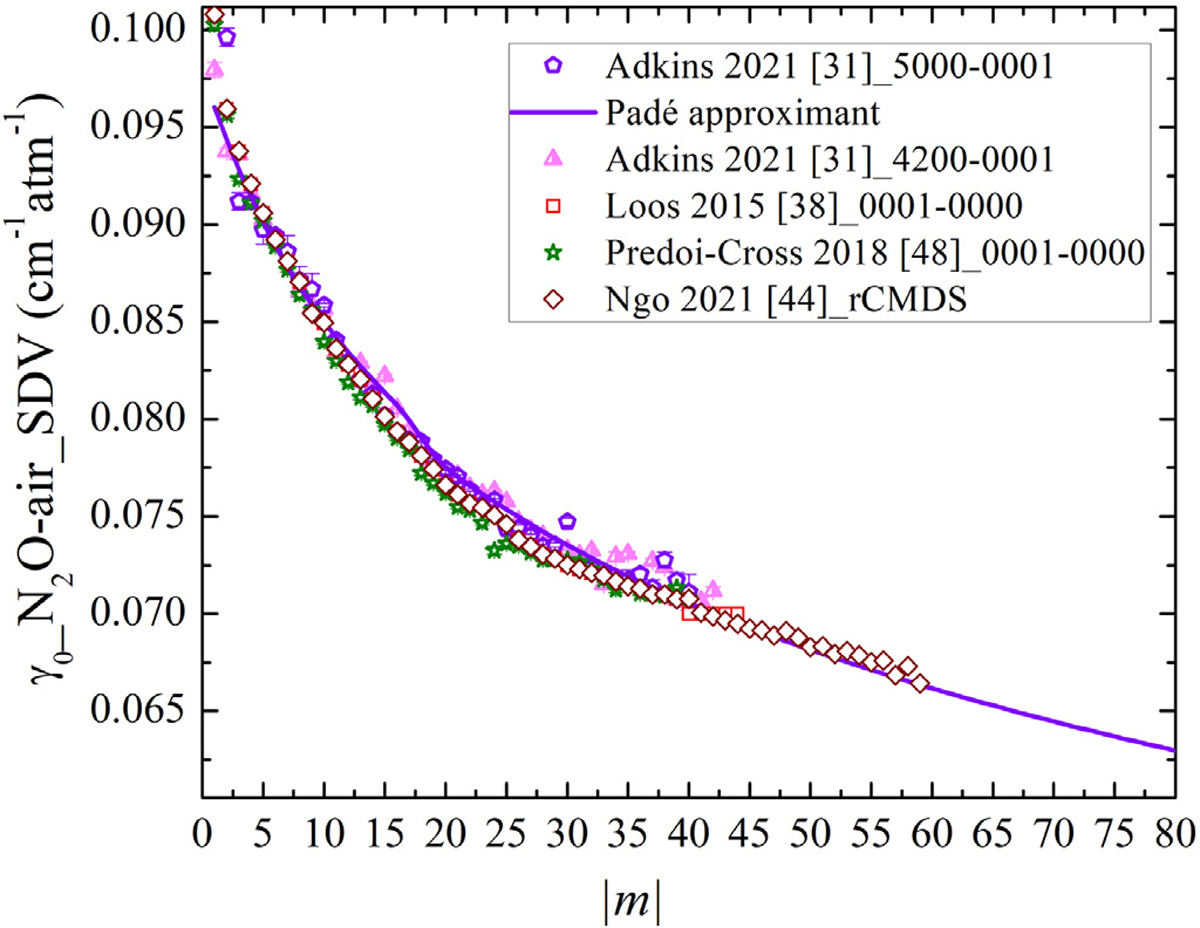
The air-broadening half-widths of N2O lines at 296 K plotted versus |m| in cm−1atm−1 measured by Adkins et al. [31], Loos et al. [38], Predoi-Cross et al. [48], and Ngo et al. [44]. The Padé approximant fit to the results of Ref. [31] is presented as well.
The γ0-air values in Refs. [38,44,48] are in close agreement which is encouraging since they were measured in the ν3 band and analyzed using the SDV line profile. The small variation among the results of the ν3 band and the two NIR bands measured by Adkins et al. [31] confirmed the negligible vibrational dependence in the line widths at the experimental uncertainty level (the displayed error bars for the measured lines correspond to the combined systematic and statistical error). The half-widths in Ref. [31] were found to be about 0.8% larger than the rCMDS-predicted broadening values. This difference was 0.6 % larger compared to the half-width data of Ref. [38] and around 1 % larger than those of Ref. [48]. Only for transitions where m > 35, do the values in the 4ν1 + 2ν2 band deviate from the other measured half-widths. This discrepancy is likely due to increased uncertainties in measurements of weaker lines. For the same reason explained for the use of the air-broadening (VP) parameters from the 5000 – 0000 band, the air-broadening (SDV) results of the 5ν1 band from Ref. [31] were used to extrapolate the results for all the lines as shown by the violet line in Fig. 3. The validity of the extrapolated widths out to |m| = 60 was confirmed by the rCMDS prediction [44].
To add the temperature dependence of the air-broadening parameters (the SDV parameters) of N2O, we used from Ref. [44] which was estimated using the SDV profile. Fig. 2 presents the extrapolated temperature dependence parameters, and the constants, produced from the semi-empirical fit, can be found in Table 2. To the best of our knowledge there were no published measurements of the -air parameters deduced with the SDV profile to compare with the rCMDS results. For this reason, we compared them to the VP results in Fig. 2. It can be discerned that the rotational dependence of the for the VP and SDV profiles is similar to the rCMDS prediction [44]. However, there is a noticeable deviation from measurements in Refs. [36,37] that used the VP.
Table 2.
Fitting coefficients obtained using Eq. (1) for extrapolating the air-broadening parameters, air speed-dependence of N2O at room temperature (in cm−1 atm−1), and the temperature exponent of the air-half-width for the SDV line-shape profile.
| Coef. | γ0-air [31] | aw-air [31] | nγ0-air [44] |
|---|---|---|---|
|
| |||
| c 0 | 9.789 × 10⁻² | 1.010 × 10⁻¹ | 7.121 × 10⁻¹ |
| c 1 | −7.100 × 10⁻³ | −5.170 × 10⁻³ | −1.340 × 10⁻² |
| c 2 | −9.038 × 10⁻⁵ | −4.145 × 10⁻⁴ | −1.873 × 10⁻⁴ |
| c 3 | 1.081 × 10⁻⁵ | 2.212 × 10⁻⁵ | 4.070 × 10⁻⁶ |
| d 1 | −5.250 × 10⁻² | −6.291 × 10⁻² | −1.420 × 10⁻² |
| d 2 | −3.03 × 10⁻³ | −1.02 × 10⁻³ | −5.086 × 10⁻⁴ |
| d 3 | 1.626 × 10⁻⁴ | −8.131 × 10⁻⁶ | 9.785 × 10⁻⁶ |
| d 4 | 2.583 × 10⁻⁷ | 5.102 × 10⁻⁶ | −2.019 × 10⁻⁸ |
It may be noted that more refined line shapes, including speed-dependent Nelkin-Gatak profile (SDNG) [49] accounting for the Dicke narrowing effect [50] have been investigated in a number of recent studies for the N2O-air system. Ngo et al. [44] obtained Dicke narrowing parameters and their temperature dependences using the SDNG profile. Their results showed that using the SDNG profile led to more significant dispersion than the SDV profile. Also, they stated that the fit residuals obtained with the SDNG profile were not remarkably better than the SDV residuals. Therefore, for the N2O perturbed by air, Ngo et al. [44] suggested using the SDV line-shape parameters. Furthermore, Adkins et al. [31] used the SDNG profile in their analysis, however, in their fit using the SDNG profile, there were problems related to converging the results into physical values because of the strong correlation between the speed dependence of the collisional broadening and the narrowing parameter. The authors declared that the issue was the limited signal-to-noise ratio in their experiment. Loos et al. [38] also employed the SDNG profile in their analysis of N2O-air spectra. The residuals they achieved did not exhibit an obvious dependence on the Dicke-narrowing parameters and the correlation between collision-induced velocity changes. Therefore, by setting the narrowing and correlation parameters to 0, they effectively used the SDV profile. In the future, with the availability of more measurements with high signal-to-noise ratio, these advanced parameters can be added in HITRAN under the Hartmann-Tran profile parametrization.
2.2. Air and self speed-dependence of the widths of N 2 O
Fig. 4 exhibits the overlaid results of the air speed-dependent parameters (aw = γ2/γ0) obtained using the SDV profile. Among the exhibited data sets, the measured speed-dependence by Adkins et al. [31] shows the strongest rotational dependence. It can be observed that the speed-dependent values for Ref. [38] and Ref. [31] agree in the range 20 < m < 40, while for higher rotational quantum numbers the discrepancy becomes more substantial (about 15% on average). Besides the measurement uncertainties, this difference might be explained by the fact that in retrieving the aw parameters in Ref. [44], the first-order line-mixing effect was included in the analysis, whereas in the study of Adkins et al. [31] measurements were made at low-pressure and the line-mixing effect was not taken into account. There is excellent agreement among the values of Ref. [44] and those of Ref. [38] for m below 30. The rationale for this agreement is that the values retrieved by the rCMDS prediction were corrected based on Ref. [38] data. The single value published in Ref. [48] is also displayed in the figure which was based on the theoretical value in Ref. [51].
Fig. 4.
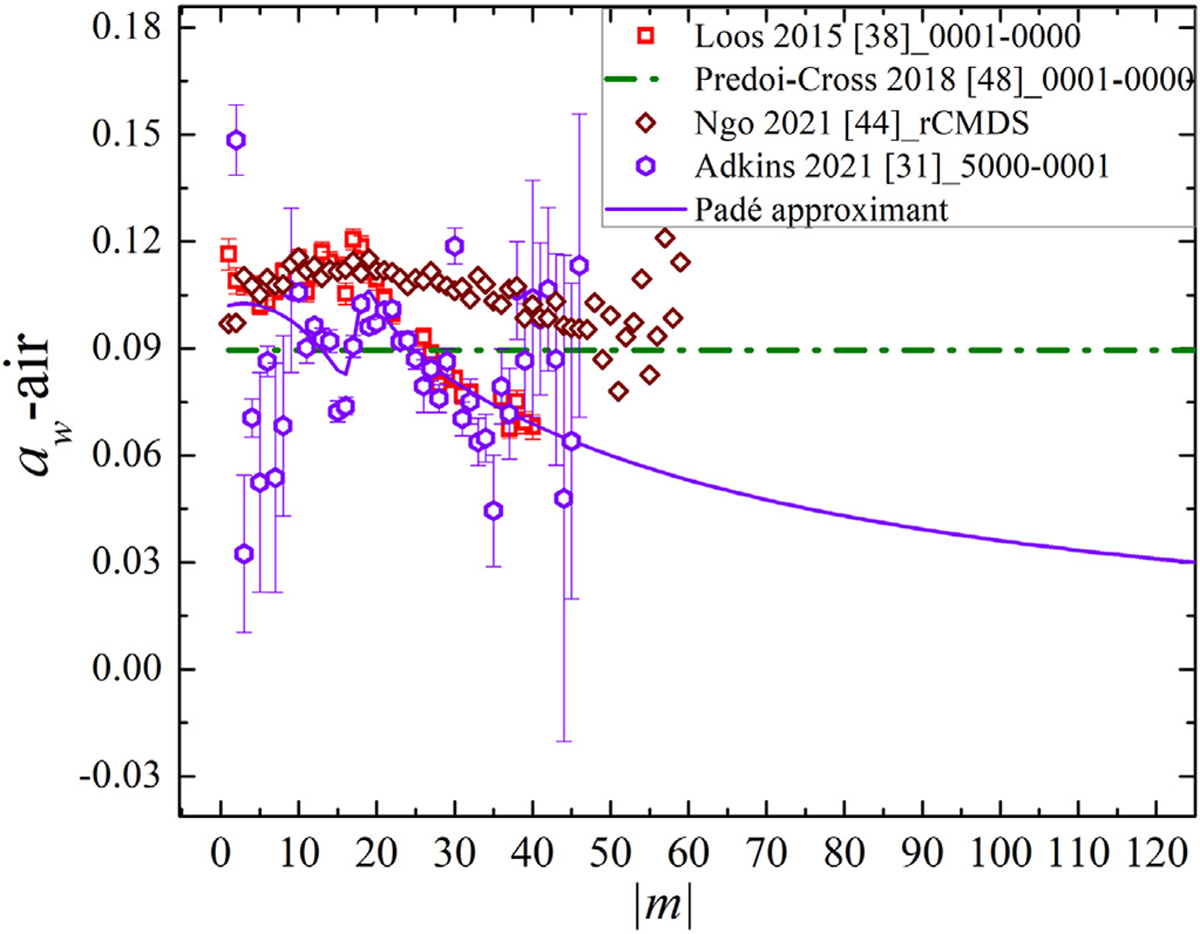
The air-speed-dependence of widths of N2O deduced from the results of Ref. [31] using the SDV profile and fitted using a Padé approximant. The results are compared with measurements of Loos et al. [38], Ngo et al. [44], and those of Predoi-Cross et al. [48] measured using the SDV profile.
Because we used the air-broadening (SDV) parameters of the 5000 – 0000 band from Ref. [31], the same band results are used for aw-air parameters for all the bands except the ν3 band. The data from Ref. [38] were used for the ν3 band to update the speed-dependence of half-width parameters. Because of the large uncertainties for the transitions with m > 40 in Ref. [31], those values are not included in the fit. The fitting coefficients of Eq. (1) for the semi-empirical model are given in Table 2 to enable calculation of aw for every transition of the N2O-air system. To ensure the best values for these parameters, we validated the results as described in Section 2.5.
In the study by Ngo et al. [44], although the temperature dependencies of the width parameters were estimated, the temperature exponents of the speed-dependent of the half-widths were not reported. Accordingly, in HITRAN2020, the temperature-dependence values reported for γ0-air (SDV) ( -air) were used for the γ2-air ( -air) as well (taken from Ref. [44]).
In order to add the self speed-dependent parameters of N2O to the database, the data of Ref. [52], measured with a diode laser spectrometer at a temperature about 296 K and pressure range of 0.66–13.33 kPa, were adopted. However, only eight transitions in the 3ν1 + 2ν2 band were acquired in Ref. [52], which was not enough data to justify extrapolating the semi-empirical model. Different methods were examined to extend the coverage in |m| such as empirically scaling the measured SDV γ0-air parameters in Ref. [31] (for the 5000 – 0000 band) based on the corresponding γ0-self (SDV) values from Ref. [52]. In this way, two average scaling factors (for the low-J and high-J) were obtained to generate the self-broadening parameters for N2O lines. The following simple equation was used to estimate the scale factors (SF) which were 1.235 for J < 30 and 1.17 for J > 30:
| (3) |
The self-broadening parameters, estimated using the empirical scaling factors from the air-broadening (SDV) parameters from Ref. [31]. are shown in Fig. 5. The need for using two scaling factors creates a discontinuity at J = 30 and it does appear that for low rotational levels the Voigt values appear larger than those determined with SDV which is not typical.
Fig. 5.
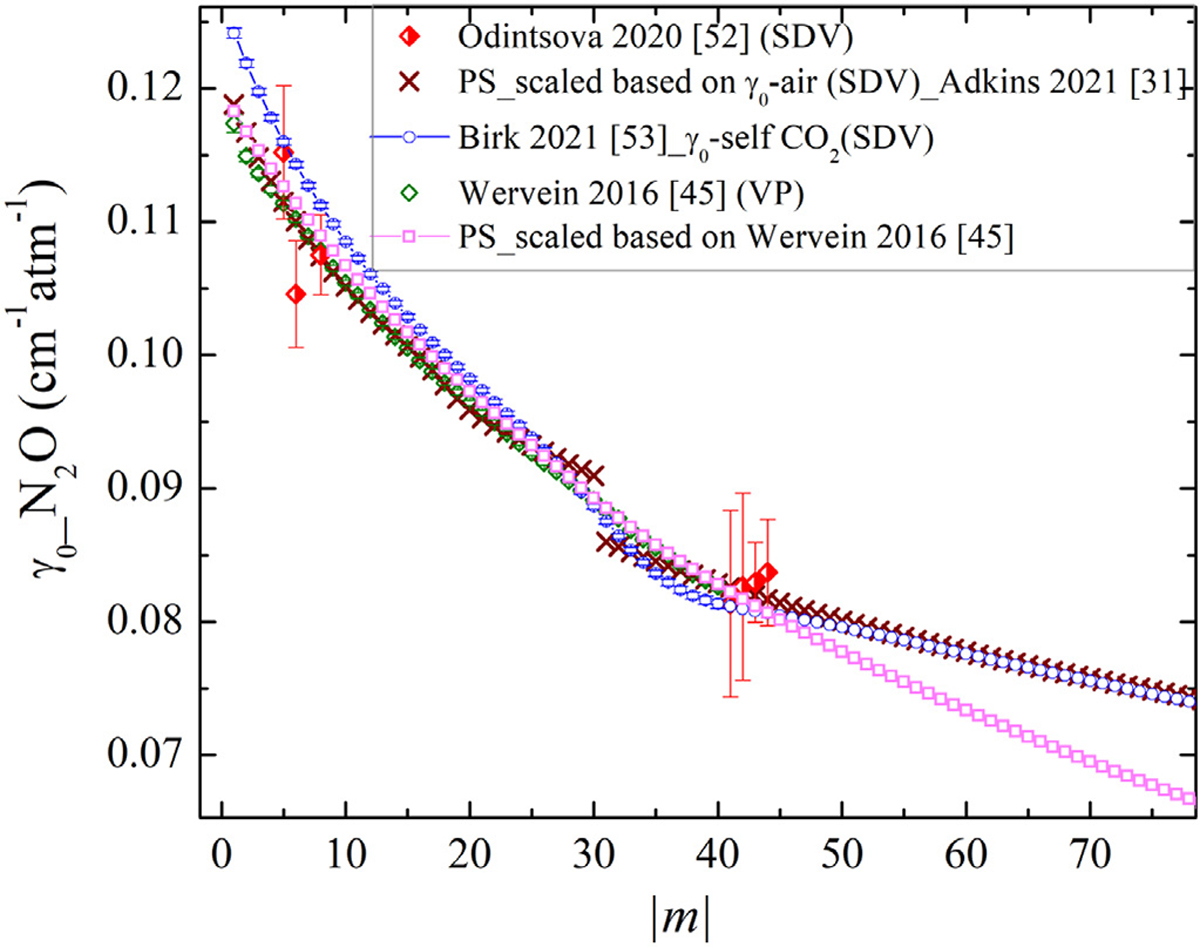
The self-broadening parameters of N2O measured by Odintsova et al. [52] based on the SDV profile. The estimated values of the self-broadening (SDV) γ0-self values using the calculated scaling factors from γ0-air (SDV) values by Adkins et al. [31] correspond to the x-mark symbols. The extrapolated self-broadening values for CO2 lines measured by Birk et al. [53] are presented as well, which were used for updating the self-broadening parameters of N2O in the present study. The corresponding VP parameters measured by Werwein et al. [45] and the scaled values for γ0-self values using the calculated scaling factors from VP results based these parameters [45] are also shown for comparison.
Fig. 5 also includes the γ0-self parameters measured using the VP determined by Werwein et al. [45]. The extended values of γ0-self (SDV) using the scaled VP results (shown as ‘PS_scaled based on Werwein et al. [45]’) are displayed in the same figure as well. The agreement of these scaled self-broadening values is good for the transitions with |m| < 40. However, the scaled VP parameters decrease faster for the transitions with |m| > 40.
Finally, because of the similarity of the N2O-N2O and CO2-CO2 systems (N2O and CO2 having almost identical molecular masses and similar quadruple moments), we examined the possibility of using the CO2-CO2 values. Fig. 5 demonstrates that the γ0-self (SDV) parameters measured for the CO2 lines [53] agree well (most within the experimental error bars) with the few N2O-N2O SDV half-widths measured in Ref. [52]. Based on these evaluations, we populated the HITRAN2020 self-N2O data using the self-broadening (SDV) values measured for CO2 transitions by Birk et al. [53].
Not having experimental data for the self-broadened speed-dependent parameters (γ2-self), to be consistent with the choice of the half-widths, we used the self speed-dependent parameters measured for CO2 [53]. Assuming that there is not a strong vibrational dependence for the self-broadening parameters, γ2-self values were updated for all the N2O-self broadened transitions in HITRAN2020. An uncertainty of > 20 % was assigned for these approximate values. These parameters will be reevaluated once more experimental data for the N2O-N2O system using SDV profile will become available in the future.
2.3. The pressure shifts of air- and self-broadened N 2 O lines
We followed the method proposed by Hartmann [54] to calculate the pressure shifts of air- and self-broadened N2O transitions. This algorithm was originally suggested for the air-broadened CO2 lines and implemented for the self-broadened CO2 lines in Ref. [40]. Here, we repeat the important equations in the shift calculation which can be found in section 2 of Ref. [54].
The key formula to calculate the vibrational-dependent shift values in Ref. [54] is,
| (4) |
where the shifts are related to the change in the quantum numbers (Δνj), and where by using measured shifts for a specific band, the shifts for other bands can be calculated. The term δrot (|m|) is the half-difference of the shifts and δvib (|m|) is the half-sum of the shifts which can be obtained using the experimental shifts for the P- and R-branch lines for the same |m|. The parameters a1, a2, and a3 can also be obtained from fits to the appropriate measured shifts.
Also, the δrot (|m|) and δvib (|m|) terms are modeled using the empirical functions presented as Eq. (15) in Ref. [54]:
| (5) |
The , , , , , , a1, a2, and a3 coefficients can be deduced from the fits to the measured shift values and the resulting calculated half-sum and half-difference of the shifts. For calculating the air-shifts of N2O, the measured shifts of Ref. [38] for the 0001 – 0000 band were employed. The resulting coefficients are provided in Table 3 to calculate the δ-air values. Also, the coefficients a1 = 0.55, a2 = 0.12, and a3 = 0.9 were obtained.
Table 3.
The coefficients obtained when fitting Eq. (5) to the experimental δ0-air [38] and δ0-self [45] values.
| Coefficients (δ0-self) | Coefficients (δ0-air) | ||
|---|---|---|---|
|
| |||
| δvib | δrot | δvib | δrot |
Fig. 6 shows the estimated shift values for several bands and corresponding comparisons to the HITRAN2016 air-shifts and the available measured data for the same vibrational band. The resulting precision of the shift values was limited by inconsistency in the data sets. For instance, for the 1200 – 0000 band, measured values for several lines occur outside of the regular rotational dependence pattern. Hence, it was challenging for the fitting algorithm to model the observed rotational dependence of the shift values. Nevertheless, the calculated shift values in the present study are in near agreement with the experimental shifts. The rotational dependence and asymmetry of the shift parameters between the P- and R-branch lines, observed in the experimental data for the presented bands, are also reproduced.
Fig. 6.
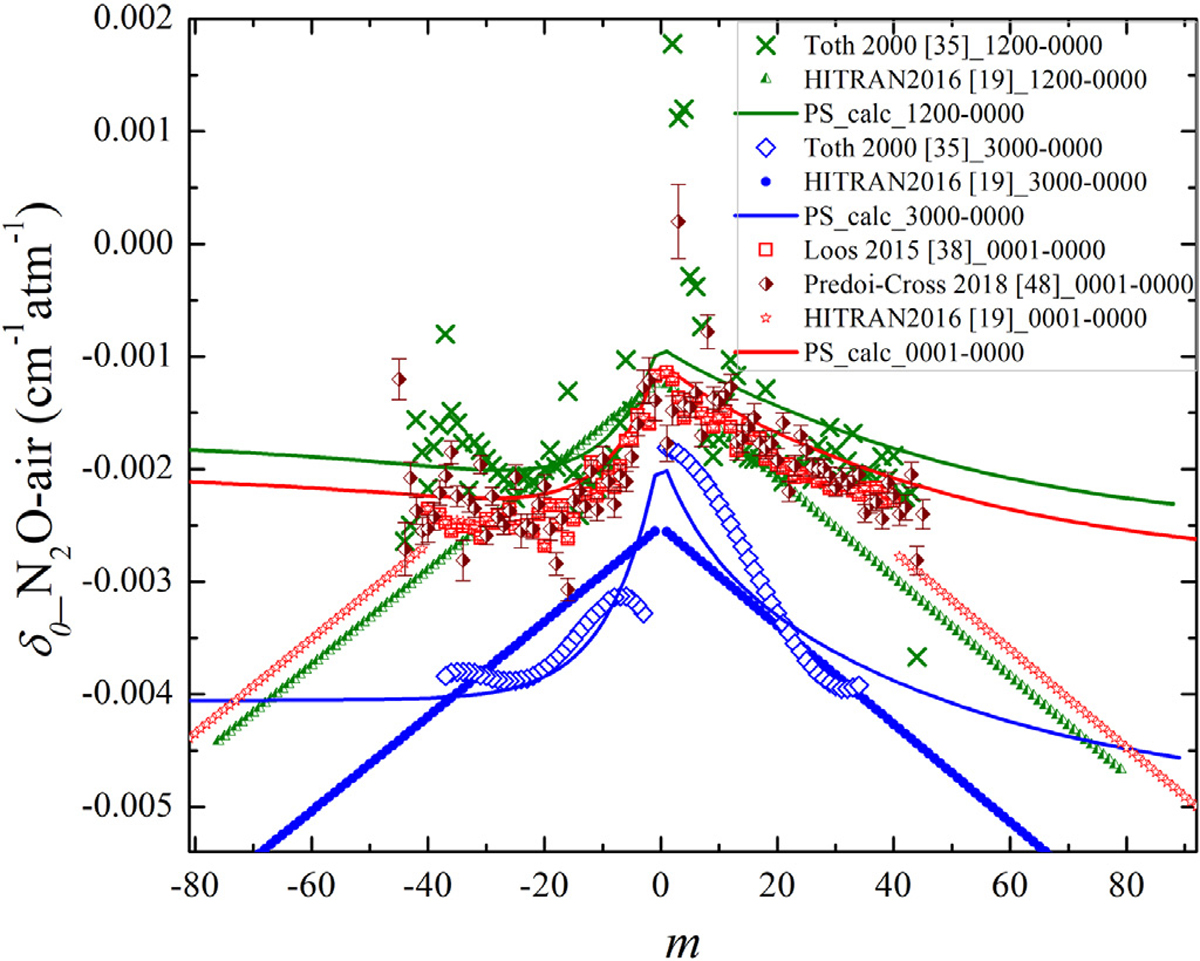
The δ0-air values calculated at room temperature for the present study (PS) using the approach of Hartmann [54]. The measured shifts by Toth [35] for the ν1 + 2ν2 and 3ν1 bands, the measured shifts by Loos et al. [38] and Predoi-Cross et al. [48] for the ν3 band, and the HITRAN2016 [19] values are also presented.
For calculating the self-shifts of N2O, the data from the 2ν3 band measured in Ref. [45] were used and the coefficients a1 = 0.2, a2 = 0.1, and a3 = 0.5 were found from the fit. The fitting coefficients , , , , , are given in Table 3. Because there were not enough measured values to educate the algorithm with the SDV and VP shifts separately, the same air- and self-shifts were assigned for the VP and SDV profiles in the database. The uncertainty in the measured self-shifts of Ref. [45] was estimated to be about 9.5%. For our calculation we adopted the uncertainty > 20% for all the bands.
2.4. Semi-empirical calculations of line-mixing coefficients for N 2 O lines
The line-mixing effect for N2O has been examined in several studies. Strow et al. [55] studied the line-mixing parameter in the ν2 + ν3 Q-branch of N2O and suggested the use of the semi-empirical first-order Exponential Power Gap law (EPG) approximation. Furthermore, Margottin-Maclou et al. [56] observed the line-mixing effect in absorption spectra recorded at room temperature, using a FT spectrometer to acquire spectra over the pressure range 1.01–648.48 kPa. Hartmann et al. [57] investigated the line-mixing extensively in three different Q-branches, for N2O broadened by N2, O2, and air. The authors used the Energy-Corrected-Sudden (ECS) approach and verified their approximation using various laboratory spectra. The 0310 – 0110 band Q-branch lines of N2O were studied by Vitcu et al. [58] over a low-pressure range (up to 3.99 kPa) using their mid-infrared spectrometer based on difference-frequency infrared generation in AgGaS2 employing the EPG law [28]. Based on the formalism provided in Refs. [28,55,58], the rotationally inelastic state-to-state rates can be expressed in terms of the rotational quantum numbers and fitting coefficients that can be determined from the measured line broadenings.
We also used the EPG approximation to obtain the first-order line-mixing parameters systematically for all the N2O lines broadened by air and N2O. Our EPG line-mixing calculation package includes Python code for reading the N2O band information and spectroscopic parameters, and MATLAB code functions for calculating the relaxation matrix elements. Here we briefly mention the important equations in the calculation.
In the line-profile function, the weak line-mixing parameter is modeled to introduce asymmetry in the main profile as written in Eq. (6) [28]:
| (6) |
where ϕLM represents the profile of the lines affected by the line-mixing effect, and Re (ϕ) and Im (ϕ) are the real and imaginary parts of the normalized line-shape profile. Yk is the first-order line-mixing parameter of line k that can be calculated using the relaxation matrix elements. Concerning the collisional energy transfer between two energy levels labeled j and k, we can write,
| (7) |
Here, Yk (T) is the weak N2O line-mixing parameter of the transition of interest, dk and dj represent the dipole moment components, and Wjk are the off-diagonal elements of the relaxation matrix. The line positions are indicated by νj and νk in cm−1. In the relaxation matrix formalism, the N2O broadening coefficients are the real parts of the diagonal elements of the relaxation matrix, and the off-diagonal elements are related to the collisional transfer rates given by the parameter κjk. Applying the detailed balanced relation, the rate of transfer between the states k and j is related to the rate of transfer from j to k by,
| (8) |
where ρk is the population of rotational level k.
The EPG formalism gives the collisional transfer rates from the lower rotational level k to a higher rotational level j as,
| (9) |
in which ΔEjk represents the energy gap between two rotational levels in cm−1. B0 is the rotational constant of the lower-energy level. The A1, A2, and A3 coefficients can be found using the non-linear least-squares fitting. Assuming that the collisional rates are the same in the upper and lower vibrational levels, the diagonal elements of the relaxation matrix can be written as:
| (10) |
Fig. 7 shows the N2O line-mixing parameters that we estimated using the EPG law for the SDV profile.
Fig. 7.
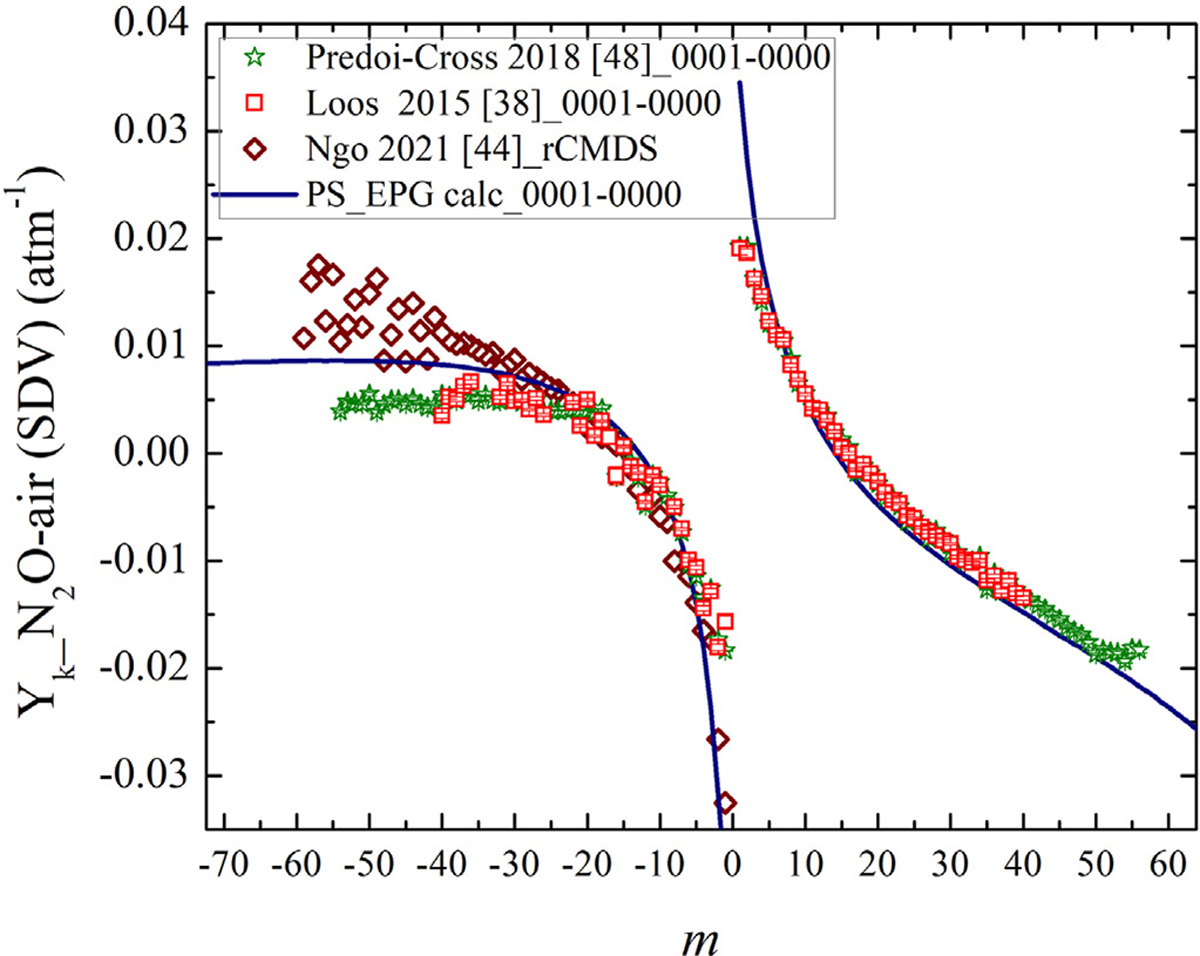
Comparison of the first-order line-mixing parameter at 296 K versus m for the ν3 band. The estimated Yk parameters using the EPG formalism is given by the solid line and compared to those measured by Predoi-Cross et al. [48], and Loos et al. [38]. The rCMDS-predicted values by Ngo et al. [44] are also shown.
We achieved good agreement between the semi-empirical calculations and observed line-mixing parameters for the stronger lines. Fig. 7 demonstrates that the line-mixing parameters calculated with the EPG law agree well with the experimental values of line mixing reported in Refs. [38,48] for the R-branch lines. For the P-branch lines, the EPG calculation predicts slightly larger Yk values for |m| > 30. The first-order line-mixing parameters predicted by the rCMDS theory in Ref. [44] were only calculated in the P-branch and, as can be seen, they begin to deviate from the experimental values for the high-J transitions exceeding |m| of about 30.
The EPG approximation allowed the prediction of first-order line mixing in all bands and regions for the four isotopologues of N2O broadened by air and N2O in the HITRAN2020 database. Different sets of A1, A2, and A3 coefficients were obtained for the bands and isotopologues of N2O. It should be noted that the lineshape parameters were not updated for the isotopologue because the assignments for some of the NIR bands were ambiguous. This issue is addressed in the HITRAN2016 paper [19]. Furthermore, the temperature-dependence parameters of the first-order line mixing were updated using the rCMDS prediction in Ref. [44].
2.5. Validation of the N2O-air line-shape parameters
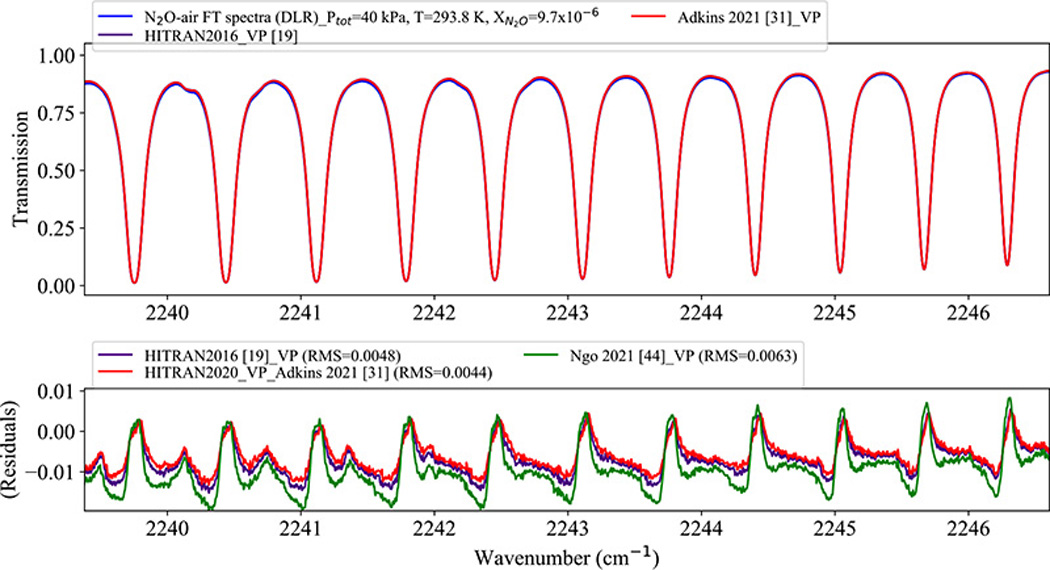
The reliability of the new N2O parameters was evaluated using available laboratory data. In particular, the HITRAN Application Programming Interface (HAPI) [59] was used to validate the results against the laboratory spectra. By choosing the desired lineshape profiles in HAPI, the absorption coefficient for the mixture of N2O-air at a specific temperature T and pressure P was obtained. We used the FT spectra of N2O-air measured at the German Aerospace Center (DLR) [38] in the ν3 spectral region. These measurements were made at a total pressure of 40 kPa and temperature of 293.8 K using a Bruker 125HR spectrometer. This laboratory measurement was compared to transmission spectra that were calculated by HAPI.
Fig. 8 shows the experimental FT spectra in the upper panel as well as the transmission spectra calculated for the updated VP based on the Adkins et al. [31] (used for HITRAN2020) and HITRAN2016 parameters. The bottom panel presents the residuals for different data sets calculated with the VP in HAPI: a) the HITRAN2016 database using the VP, b) the new VP parameters which are in the HITRAN2020 database and based on Adkins et al. [31], and c) the VP parameters predicted by Ngo et al. [44]. The RMS values of the residuals calculated for each case clearly shows that use of the parameters measured by Adkins et al. [31] yields improved residuals.
Fig. 8.
The FT transmission spectra of N2O-air at T = 293.8 K, total P = 40 kPa and volume mixing ratio of . The bottom panel shows the residuals and calculated using the VP for the HITRAN2016 data, the Adkins et al. [31] results, and the Ngo et al. [44] calculations.
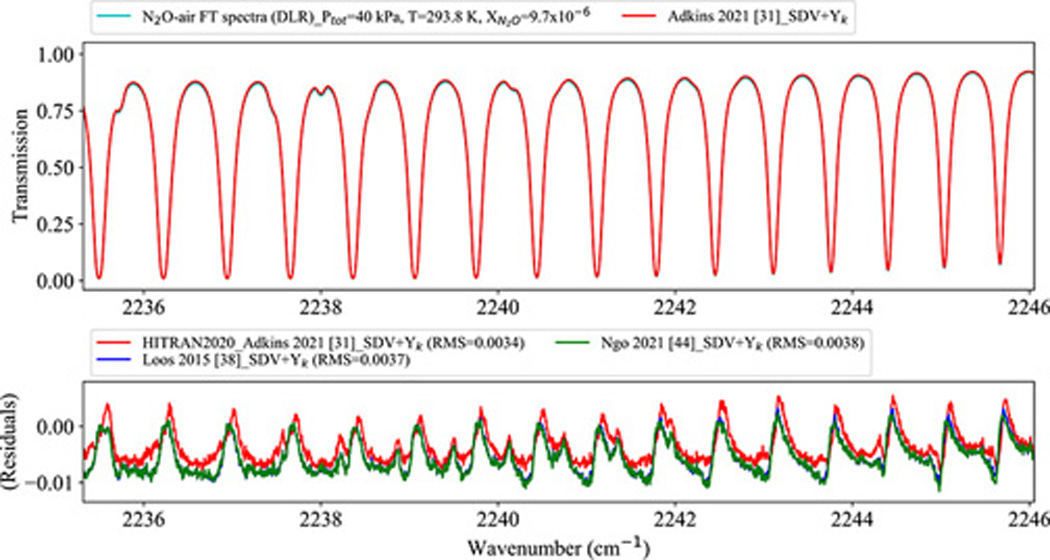
We repeated the validation test for the updated SDV parameters as described earlier in Section 2.1. Fig. 9 demonstrates the residuals for three sets of calculations: a) the new SDV parameters as in the HITRAN2020 database based on the measured parameters by Adkins et al. [31], b) the SDV parameters measured by Loos et al. [38], and c) the SDV parameters predicted by Ngo et al. [44]. The first-order line-mixing parameters were included in the calculations. The resulting fit residuals are generally close, especially those obtained using the SDV parameters in Ref. [44], and Ref. [38]. The SDV parameters by Adkins et al. [31] had the lowest RMS value and led to improvements in calculating the spectra using the SDV profile parameterization. This test showed that the new parameters in HITRAN2020 provide improved prediction of the air-broadened N2O spectra for this band.
Fig. 9.
The FT transmission spectra of N2O-air at T = 293.8 K, total P = 40 kPa and . The bottom panel shows the residuals for three sets of calculations for the use of the SDV parameters measured by Adkins et al. [31], Loos et al. [38], and Ngo et al. [44].
In addition to laboratory spectra, atmospheric spectra from the ACE-FTS instrument [47] have been used to evaluate the impact of SDV N2O parameters from the HITRAN2020 database. Fig. 10 shows all of the contributions to the transmittance spectrum (excluding N2 collision-induced absorption) for a spectral region containing an N2O band near 2460 cm−1. These contributions correspond to a tangent height near 9 km for the limb-viewing ACE-FTS instrument.
Fig. 10.
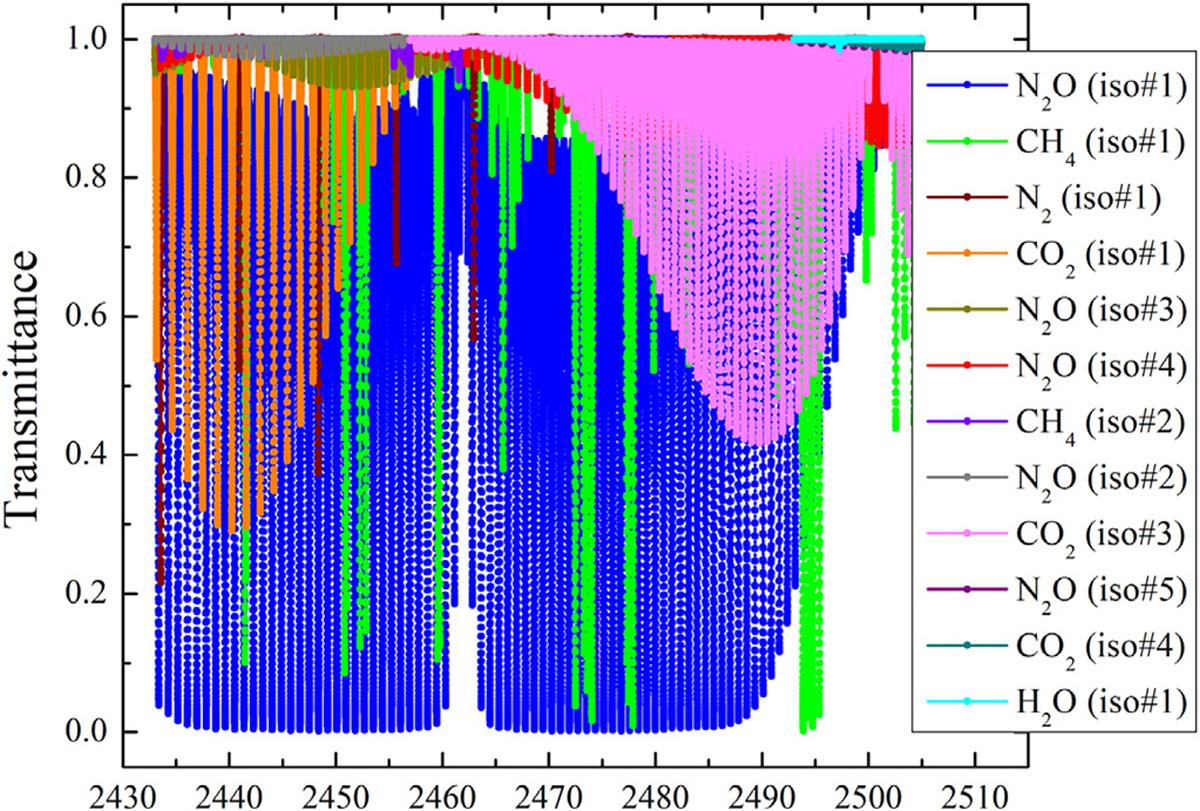
Contributions to the transmittance spectrum in the vicinity of an N2O band near 2460 cm−1. Each color represents a different atmospheric constituent, with the molecule name and isotopologue number indicated in the label. Calculations are for the ACE-FTS limb viewing instrument and correspond to a tangent height near 9 km.
Fig. 11 presents fitting results for the lower portion of the wavenumber range from Fig. 10. The top panel in Fig. 11 shows calculated contributions to the spectral window; the middle panel provides a comparison of fitting residuals using VP parameters from HITRAN2016 in the forward model and SDV parameters from HITRAN2020 for a measurement near a tangent height of 18.2 km; and the bottom panel provides the VP and SDV comparison for a measurement with a tangent height near 17.5 km. In both cases (using VP and SDV parameters), the strong N2O lines in the window have systematic features in the residuals well above the noise level, but the magnitude of the systematic feature is reduced using the HITRAN2020 SDV parameters compared to the results using VP parameters from HITRAN2016.
Fig. 11.
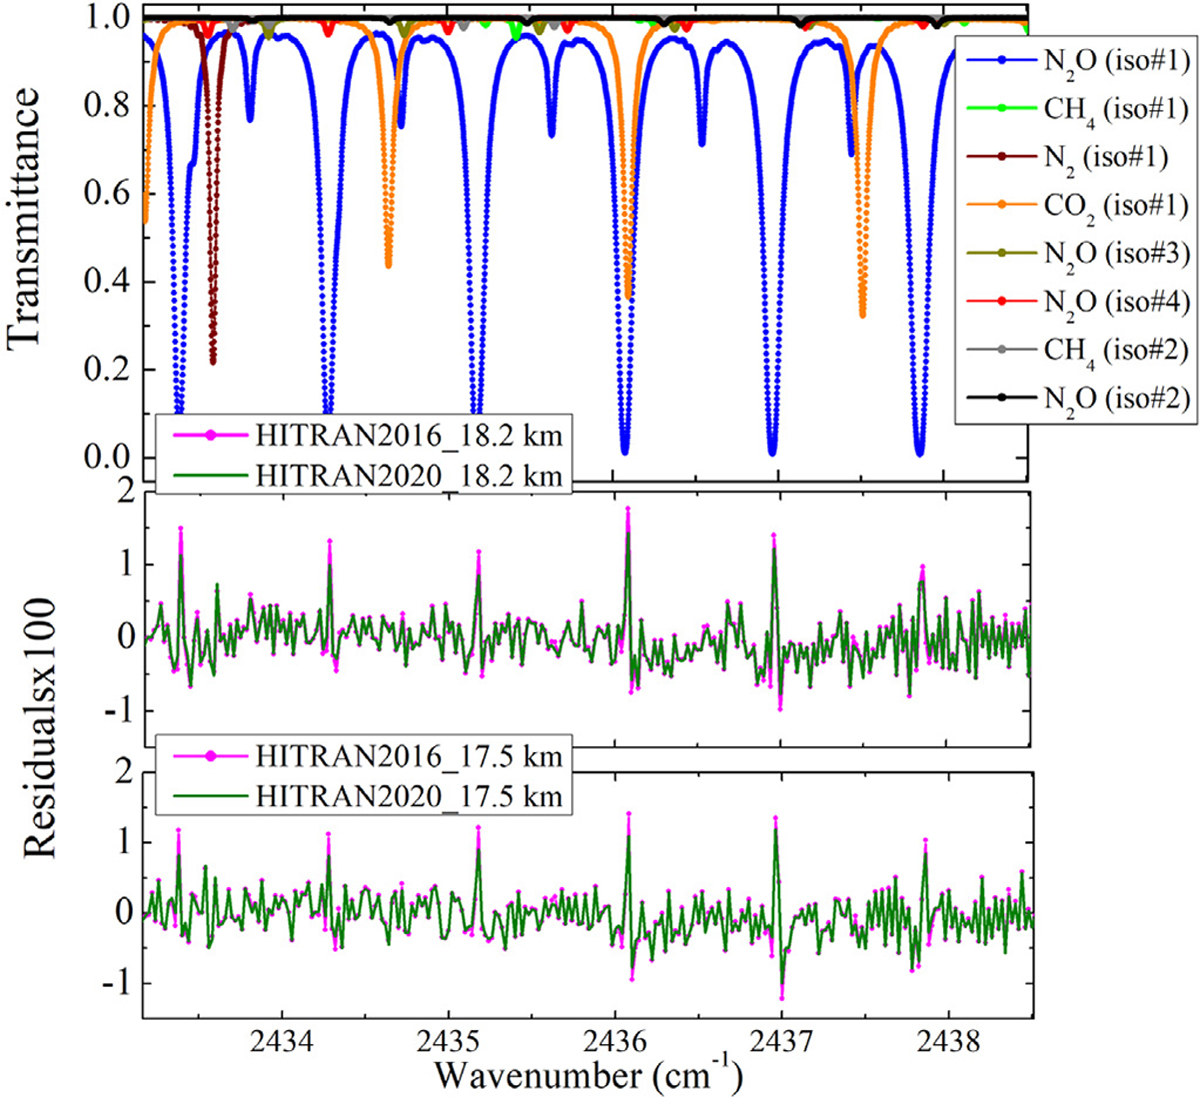
ACE-FTS analysis results from occultation sr10063. Top panel: Calculated contributions to the analyzed spectral region, corresponding to a tangent height near 9 km for the ACE-FTS instrument. Middle panel: fitting residuals for a tangent height near 18.2 km using VP parameters from HITRAN2016 (in pink) and SDV parameters from HITRAN2020 (in green). Bottom panel: the same as the middle panel, but for a tangent height near 17.5 km.
Note that the residuals in Fig. 11 contain a significant asymmetric component. For a limb-viewing instrument like the ACE-FTS, which looks through a large range of pressures and temperatures along the line of sight, asymmetry in the observed line shape can arise from strong pressure shifts or asymmetry in the line itself (or a combination of the two effects). Studies with ACE-FTS spectra suggest that including an asymmetric term in the line-shape function (with sharper effects close to line center than line mixing would provide) is required to flatten the residuals for these N2O lines (e.g., invoking speed dependence for the pressure shift). A large temperature dependence for the pressure shift could also contribute to the degree of apparent asymmetry for these N2O lines, but that possibility is difficult to assess from ACE-FTS limb measurements.
It should be noted that the non-Voigt line parameters provided by Boone et al. [47] (generated empirically from ACE-FTS spectra) for N2O lines improve the atmospheric residuals. However, these parameters [47] do not agree well with the SDV parameters provided in the present study. This difference can be explained by the fact that the authors added an additional parameter for speed dependence of the pressure shift, and as a result all the parameters (including both the broadening and the speed dependence of the broadening parameters) change.
3. CO-CO and CO-air line-shape parameters
The line list of CO in HITRAN includes the line-by-line parameters for six stable isotopologues covering 3 cm−1 to 14478 cm−1 (note that line lists for the three radioactive isotopologues, 14C16O, 14C18O and 14C17O are provided in the so-called ”Supplementary” folder in HITRAN). For updating the CO line list in the HITRAN2020 edition, the line positions for carbon monoxide lines were not changed, however, the line intensities of CO in the 1–0 band and the corresponding hot bands were reduced by 2% based on the measurement by Devi et al. [60]. Also, intensities of the 3–0 band and the corresponding hot bands were scaled up by 2.6% based on results of Borkov et al. [61] and Cygan et al. [62].
The line-shape parameters of CO in HITRAN2016 for the VP had been populated using the line list provided by Li et al. [63]. The half-width parameters by Li et al. [63] were produced based on a semi-empirical polynomial fit to the experimental data of Devi et al. [64,65] which were deduced using the SDV profile. The SDV parameters were provided only to those lines in the first overtone that had measured values from Devi et al. [64,65]. The air-shifts of CO in the previous edition were generated by extrapolating measured air-shifts by Devi et al. [64] using the approach proposed by Hartmann and Boulet [66]. For the purpose of separating the VP and SDV parameters, the line-shape parameters of CO in the HITRAN2020 edition have undergone a major revision. Various measurements of the CO-CO and CO-air lineshape parameters were employed to update the values in the HITRAN database. A review of previous studies of carbon monoxide line-shape parameters for different broadeners and bands was provided in Table 1 of Ref. [67]. However, the aforementioned table did not include the publications after 2016, where more advanced line-shape profiles (including the SDV profile) were used in the analysis.
3.1. The broadening half-width parameters of CO
For the air half-widths (the VP parameters), first, we evaluated the vibrational dependence by plotting the results for different bands. Fig. 12 presents the measured air-broadening parameters of CO for selected vibrational bands. In the bottom panel the relative differences are presented for individual bands. It was observed that the average difference for both the 1–0 and 3–0 bands compared to the 2–0 band is less than 1% for the air-broadening of CO (VP). Therefore, we assumed negligible vibrational dependence for the broadening parameters. The Padé approximant was employed to fit all the measured air-broadening data for various bands simultaneously, such as Ref. [68] for the 1–0 band measured with FT spectrometer, in the pressures of 6.32 kPa up to 101.11 kPa. Also, Ref. [69] data which the FT spectra were recorded at temperatures between 174 and 296 K and various pressures up to 74.32 kPa for the 2–0 band. Furthermore, the results in Ref. [70] for the 3–0 band, where the experimental spectra were collected using a FT spectrometer at 298 K and pressures of 267.7, 399.9, 536.3, 666.6 kPa. The fit coefficients are given in Table 4. As a result, broadening parameters were expanded to all the transitions of CO perturbed by air.
Fig. 12.
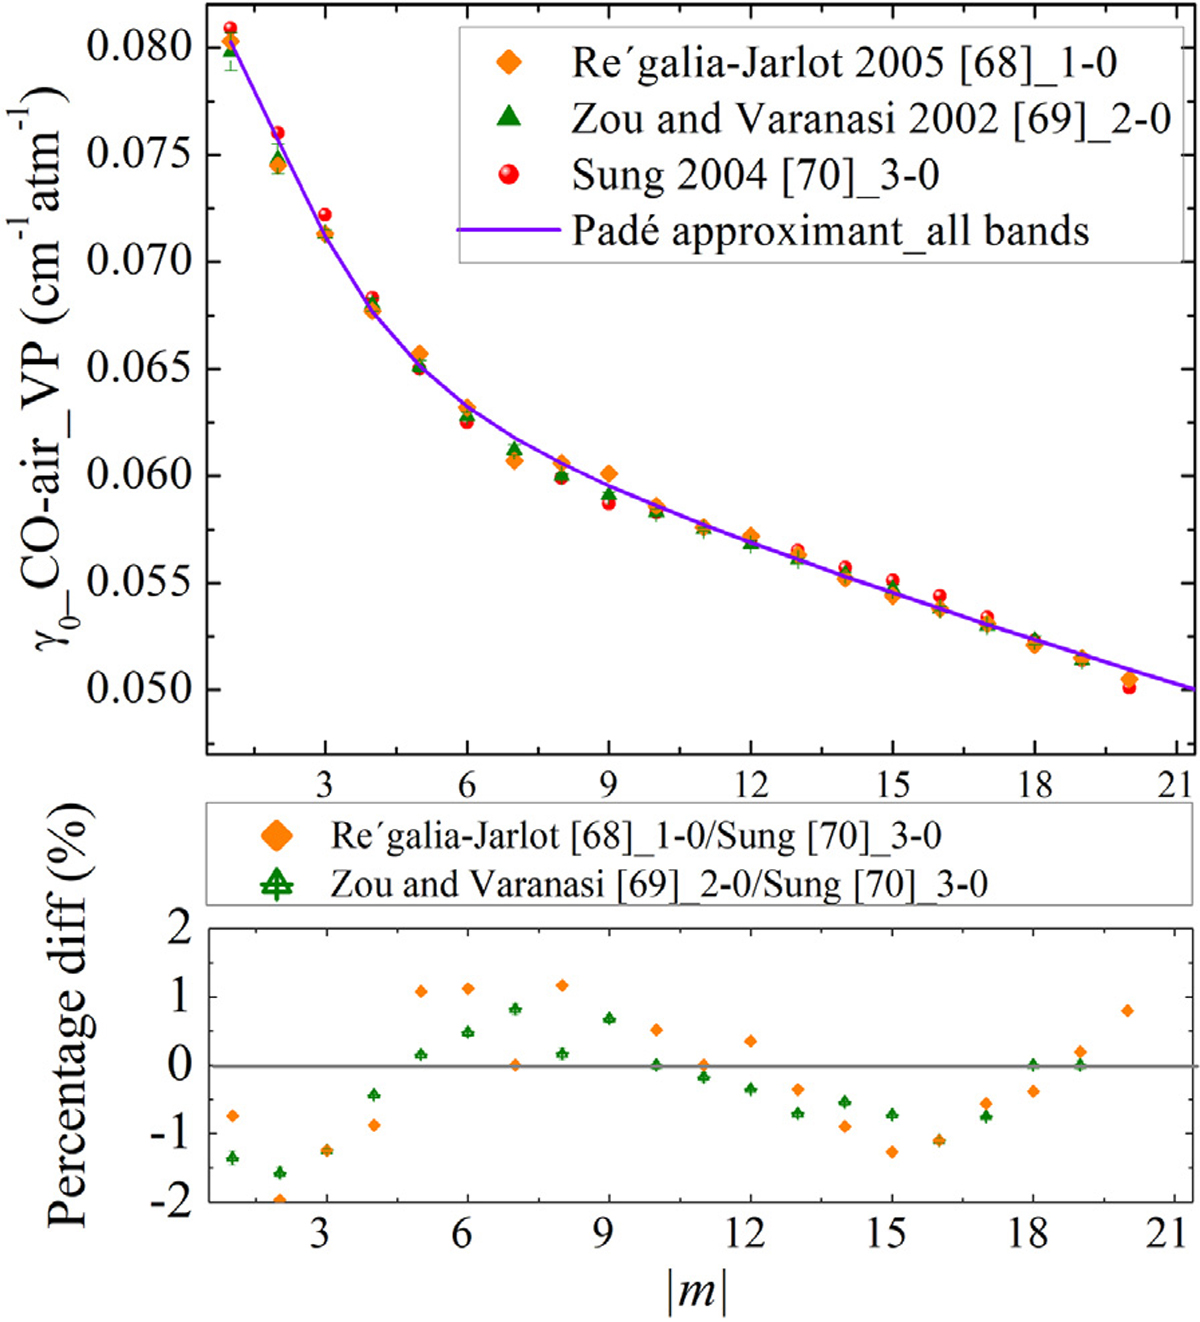
The comparison of the air-broadening parameters (VP) in cm−1atm−1 versus m for various bands such as Régalia-Jarlot et al. [68], Zou and Varanasi [69], Sung et al. [70]. The Padé approximant model is also presented with the solid line. The bottom panel shows the relative percentage difference for the air-broadening values of different data sets.
Table 4.
The coefficients obtained in fitting Eq. (1) for calculating air- and self-broadening parameters of CO at room temperature (in cm−1 atm−1) using the VP line-shape profile.
The self-broadened half-widths of CO obtained using the VP in different bands are displayed in Fig. 13. The self-broadening values for the 1–0 band measured by Ngo et al. [71] using the FT spectra at room temperature and for various pressures ranging from 3.85 to 101.62 kPa are shown. The 2–0 band data, reported by Esteki et al. [73], were obtained using the measured FT spectra at a temperature of about 298 K and pressure ranges from 0.42 to 67.59 kPa. For the same band Predoi-Cross et al. [72] obtained their results using the FT spectra recorded at 296 K over a range of pressures from 4 to 10.66 kPa. The FT spectra at a temperatures 205 to 350 K and pressures up to 101.325 kPa in the 3–0 band were measured by Predoi-Cross et al. [74]) to deduce the self-broadening parameters of CO. Bordet et al. [75] measured the 4–0 band of CO using CRDS at room temperature and low pressure up to 1.33 kPa and obtained the self-broadening values. These data are compared to the 2–0 band data measured by Devi et al. [76] using a FT spectrometer at room temperature and pressure range between 0.4 and 67.6 kPa. The relative percentage differences are presented in the second panel. The low average difference obtained for the compared bands supported the assumption of negligible vibrational dependence for the self-broadening values as well. All these data were fitted simultaneously to estimate the self-broadening parameters for the lines that were not measured for all the bands except for the measured transitions in the 2–0 band, where the data from Devi et al. [76] were used for the update. In Table 4 we present the fit results for the coefficients of Eq. (1).
Fig. 13.
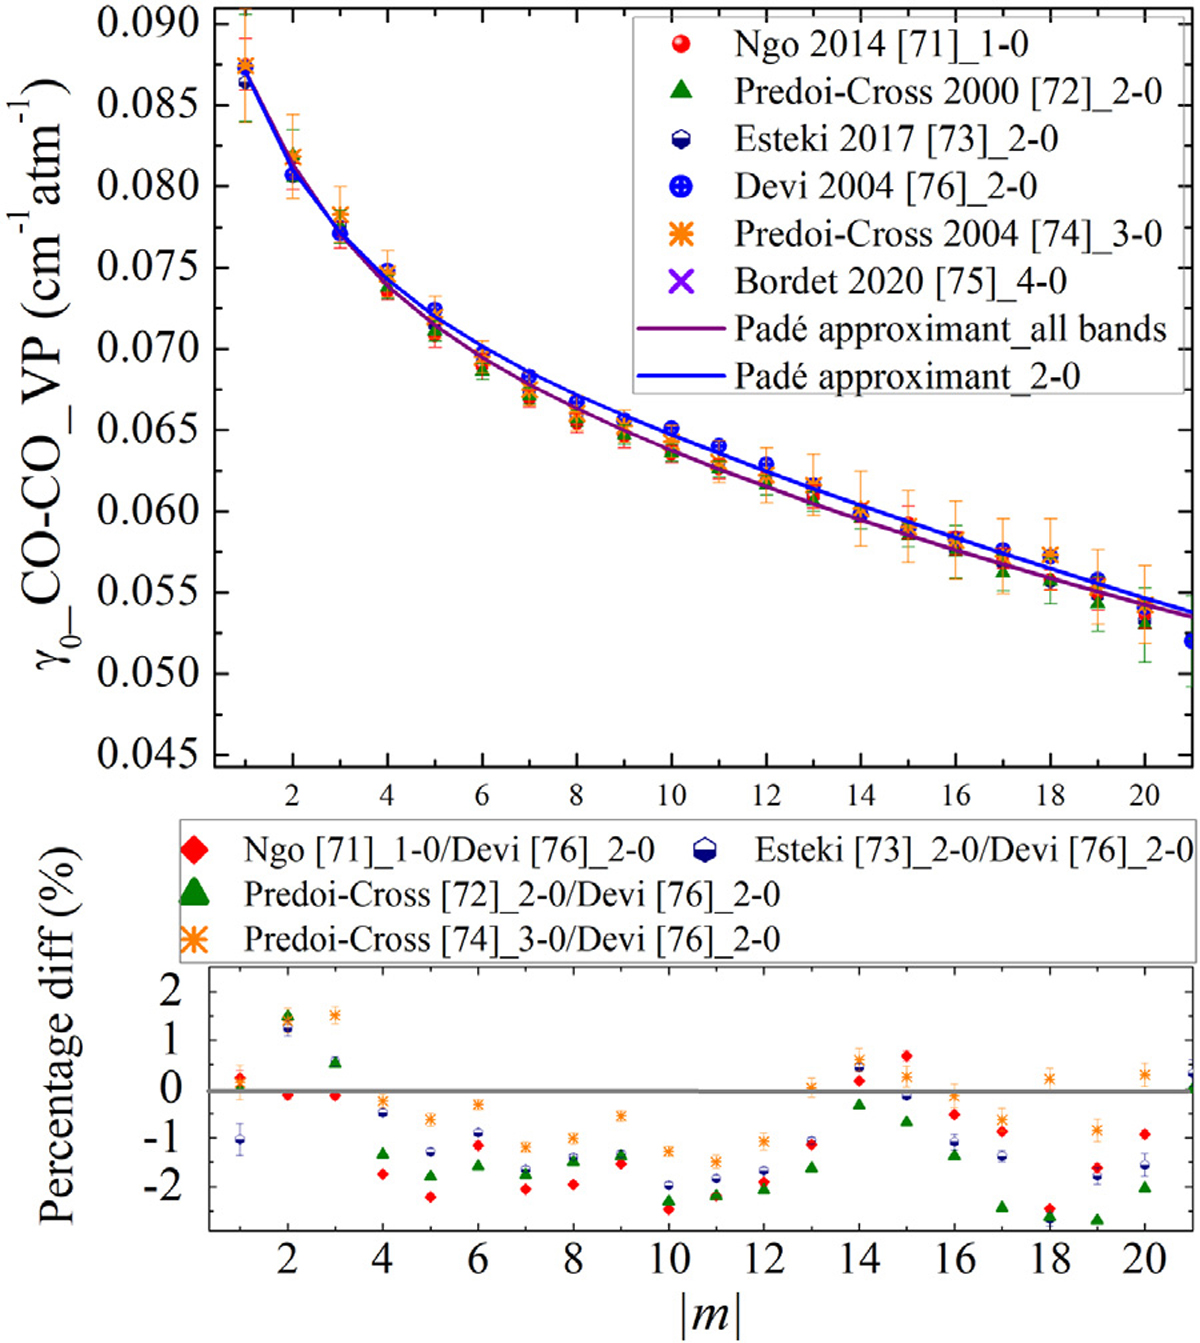
The comparison of the self-broadening parameters (VP) in cm−1atm−1 versus |m| for the measured data by Ngo et al. [71], Devi et al. [76], Esteki et al. [73], Bordet et al. [75], and Predoi-Cross et al. [72,74] for various bands. The Padé approximant fits for the 2–0 band data (blue line) and for the other bands (purple line) are presented. The bottom panel shows the relative percentage differences for the self-broadening values of different data sets.
The temperature dependence of the air-broadening parameters for the VP were not changed and remained the same as HITRAN2016 values which had been produced by using a polynomial fit to the measurements of Refs. [69,77,78] described in the HITRAN2004 edition [34].
The importance of including non-Voigt line shapes in atmospheric retrievals of CO has been highlighted by Hochstaffl et al. [79,80]. The HITRAN2016 line list had included the speed-dependent parameters for some of the lines in the first overtone band, which was unfortunately overlooked in the Ref. [80] paper. However, these parameters were only provided for the measured transitions of the 2–0 band (up to Jmax = 29). Thanks to the approach described in this paper, we included the SDV parameters for every transition of CO in the HITRAN2020 edition.
Fig. 14 presents the air-broadening parameters measured in the 1–0 band [60] (for the 13CO isotopologue) and 2–0 [64] band of CO-air deduced using the SDV profile. The FT spectra measured by Devi et al. [64] was collected at the pressure range between 0.66 and 93.32 kPa and the temperature range from 150 to 298 K. The measured results by Birk et al. [81], using the FT spectroscopy measurements at room temperature and pressure up to 100 kPa, were obtained using the HT [39] profile for the 2–0 band are plotted for comparison. For adding the SDV line-shape parameters, the semi-empirical Padé approximant fits were applied to the experimental air-broadening parameters in the 2–0 band data measured by Devi et al. [64]. The approximated values from the model were expanded for lines of every band. Although we have assumed no isotopic-dependence for the broadening parameters of CO, when the measured values were available, those were used directly in the update of HITRAN (i.e. the air-broadening from the Devi et al. [60] data were used for the lines of the 1–0 band and the measured parameters of Devi et al. [65] were used for updating the 2–0 band lines for different isotopologues of CO).
Fig. 14.
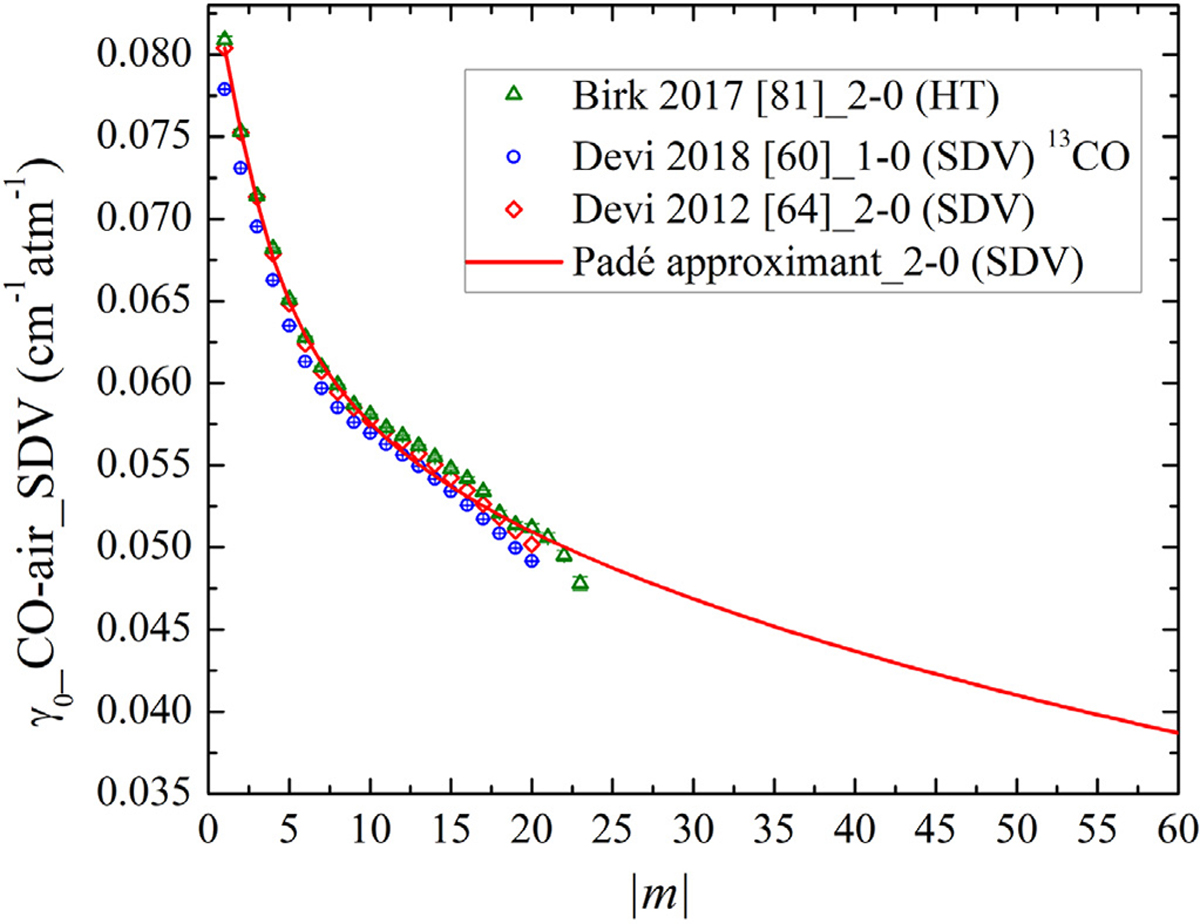
The comparison of the air-broadening parameters (SDV) in cm−1atm−1 versus |m| for two bands measured by Devi et al. [60,64] and Birk et al. [81]. The Padé approximant fit to the data in Ref. [64] is represented by the red line.
With the same procedure explained in the previous sections of our paper for the broadening parameters extrapolation, the temperature dependence of the air-broadening parameters (SDV) were fitted to the measured data in the 2–0 band [64], and the coefficients obtained from this fit are provided in Table 5. Fig. 15 demonstrates the measured and approximated temperature dependence of CO-air broadening parameters (-air) for the 2–0 band. The temperature dependence of self-broadening parameters (-self) for the same measurement [64] are presented in the same figure. Based on this graph, it can be concluded that the -air values are larger than those measured for -self. However, the decending slope of the fitted line to the -air parameters is larger than the one fitted to the -self parameters.
Table 5.
The fitting coefficients obtained using Eq. (1) for extrapolating the air-broadening parameters (SDV) (in cm−1 atm−1), temperature dependence of the air-broadening, and the air speed-dependence (in cm−1 atm−1) of CO-air lines at room temperature using the SDV line-shape profile.
| Coef. | γ0-air [64] | nγ0-air [64] | γ2-air [64] |
|---|---|---|---|
|
| |||
| c 0 | 9.050 × 10⁻¹ | −7.802 × 101 | 1.465 × 10³ |
| c 1 | 4.673 × 10⁻¹ | 4.132 × 10² | −1.115 × 10³ |
| c 2 | 0.136 × 101 | −7.264 × 101 | 9.326 × 10² |
| c 3 | 0.108 × 101 | 4.353 × 101 | 1.036 × 10² |
| d 1 | 2.774 × 101 | 3.497 × 10² | 1.278 × 10⁵ |
| d 2 | −0.01 × 10² | −0.01 × 10² | −0.01 × 10² |
| d 3 | 1.960 × 101 | 4.131 × 101 | 2.293 × 10⁴ |
| d 4 | 1.498 × 10⁻¹ | 6.914 × 10⁻¹ | 8.085 × 10² |
Fig. 15.
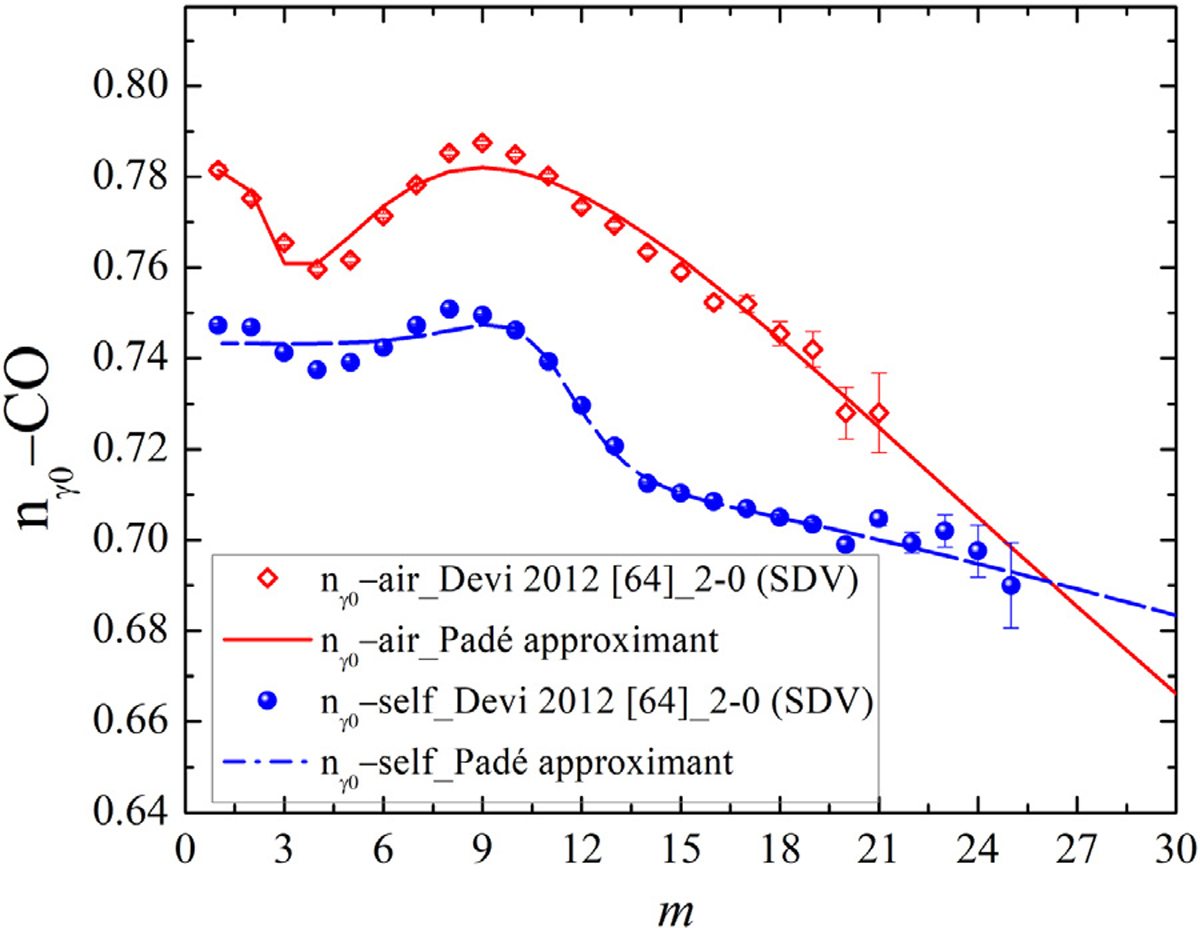
The comparison of the temperature-dependence exponent of the air- and self-broadening parameters (SDV) versus |m| for the 2–0 band measured by Devi et al. [64]. The Padé approximant fit to both the self and air temperature-dependence parameter are shown.
The air and self speed dependence of line widths were fitted as well using the same data source [64], and the corresponding γ2 parameters were estimated and attributed to each transition. Wherever the measured SDV parameters were available, the original experimental results were used in populating the database. For instance, the Devi et al. [60] data were used for the lines of the 1–0 band and the measured parameters of Devi et al. [65] were used for updating the 2–0 band lines for different isotopologues of CO (these values are presented in Fig. 16).
Fig. 16.
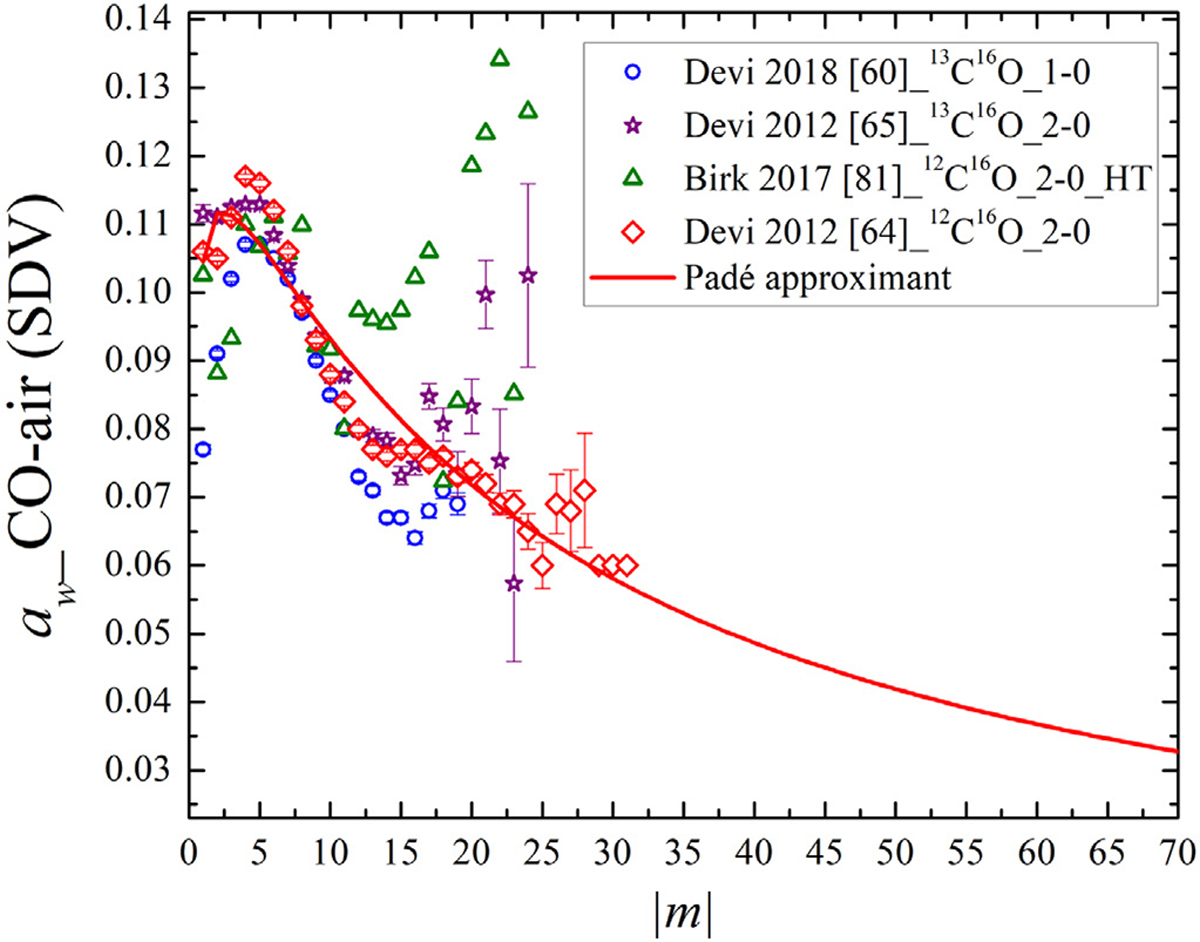
The comparison of the speed-dependence of the air- and self-broadening parameters (SDV) versus |m| for various measurements by Devi et al. [60,64,65]. The speed-dependence parameters deduced using the HT profile by Birk et al. [81] are compared as well. The Padé fit to Ref. [64] data is also presented.
The accurate measurement by Devi et al. [64] was used for updating the SDV parameters for the broadened lines of CO. We extrapolated the self-broadening values, the temperature dependence of the broadening, and their speed dependence. By fitting these parameters to Eq. (1), we obtained the fitting coefficients using the measured line widths of Ref. [64] fitted to the Padé approximant model. We imported the experimental values to the database for different isotopologues reported in Refs. [60,65] for the 1–0 and 2–0 bands, respectively. Fig. 17 presents the overlaid results, where the measured data by Devi et al. [64] for the 2–0 band are compared to the data measured by Wójtewicz et al. [82] for the 3–0 band (measured using the frequency-stabilized cavity ring-down spectrometer at 301 K and pressures 0.13 to 0.6 kPa), Esteki et al. [73] for the 2–0 band, and the self-broadening measured by Borkov et al. [61] (the data was collected using a FT spectrometer at pressure range from 19.6 to 49.2 kPa and temperature of about 302 K). The approximated values using the Padé fit are within the experimental uncertainties of the presented data sets. The half-widths measured for the higher-J values in Ref. [82] confirm the rotational dependence of the extrapolated self-broadening values. The temperature dependence of these parameters are shown in Fig. 15 and the required coefficients for the expansion of these values are provided in Table 6.
Fig. 17.
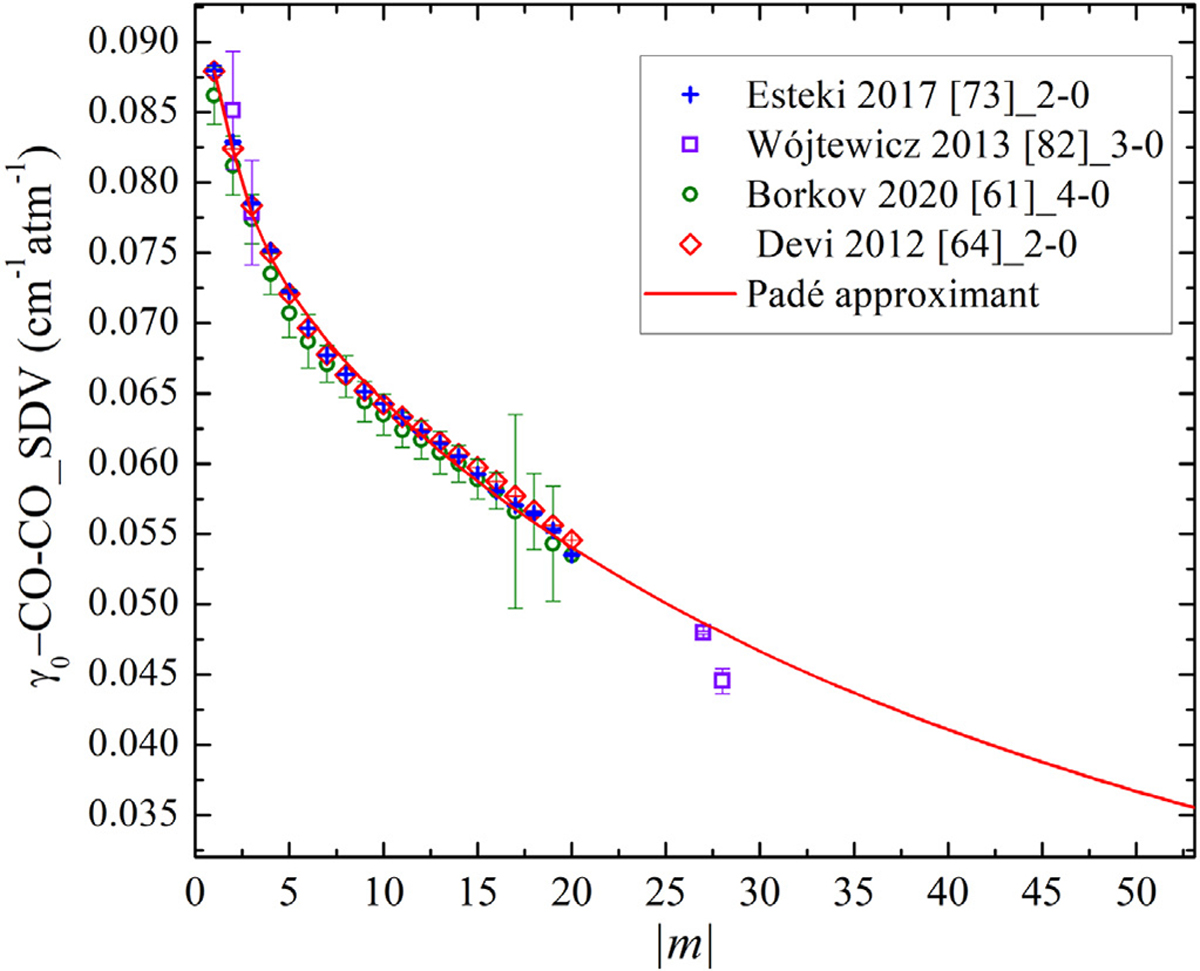
The comparison of the self-broadening parameters (SDV) in cm−1 atm−1 versus |m| for various bands measured by Wójtewicz et al. [82], Esteki et al. [73], Borkov et al. [61] and Devi et al. [64]. The Padé approximant method is applied for the data in Ref. [64].
Table 6.
The coefficients obtained in fitting Eq. (1) for calculating the self-broadening parameters of CO at room temperature (in cm−1 atm−1) and the temperature exponent of the self-broadening using the SDV line-shape profile.
To avoid mixing the SDV parameters from different measurement sets, for the speed-dependence of self-broadening widths of CO, the same data source as for the self-half-widths was used [64] in HITRAN2020. The aw parameters from Devi et al. [64] are plotted in Fig. 18. The speed-dependent parameters using the rotational spectrum of CO determined by Seleznev et al. [83] (using a backward-wave oscillator based spectrometer with radioacoustic detection of absorption at room temperature and pressures between 0.26 and 0.5 kPa), the measured aw by Wójtewicz et al. [82] in the 3–0 band, and the weaker bands results (4–0, 4–1) measured by Borkov et al. [61,84] are displayed for comparison. The measurements of Ref. [64] agree well with the pure rotational data in Ref. [83] except for transitions with m = 5 and 7. However, they disagree with those in Ref. [82]. The 4–0 and 4–1 band results [61,84] represent an agreement for the transitions with lower |m| and deviate from the Ref. [64] data for |m| > 10. This discrepancy is explained by the fact that the authors fixed most of the γ2 values to 0.006 (cm−1atm−1) for the weaker lines. It is worth noting that Wójtewicz et al. [82] also used the SDNG profile in their analysis and indicated the strong correlation between the narrowing parameters and speed-dependent parameters in their investigation.
Fig. 18.
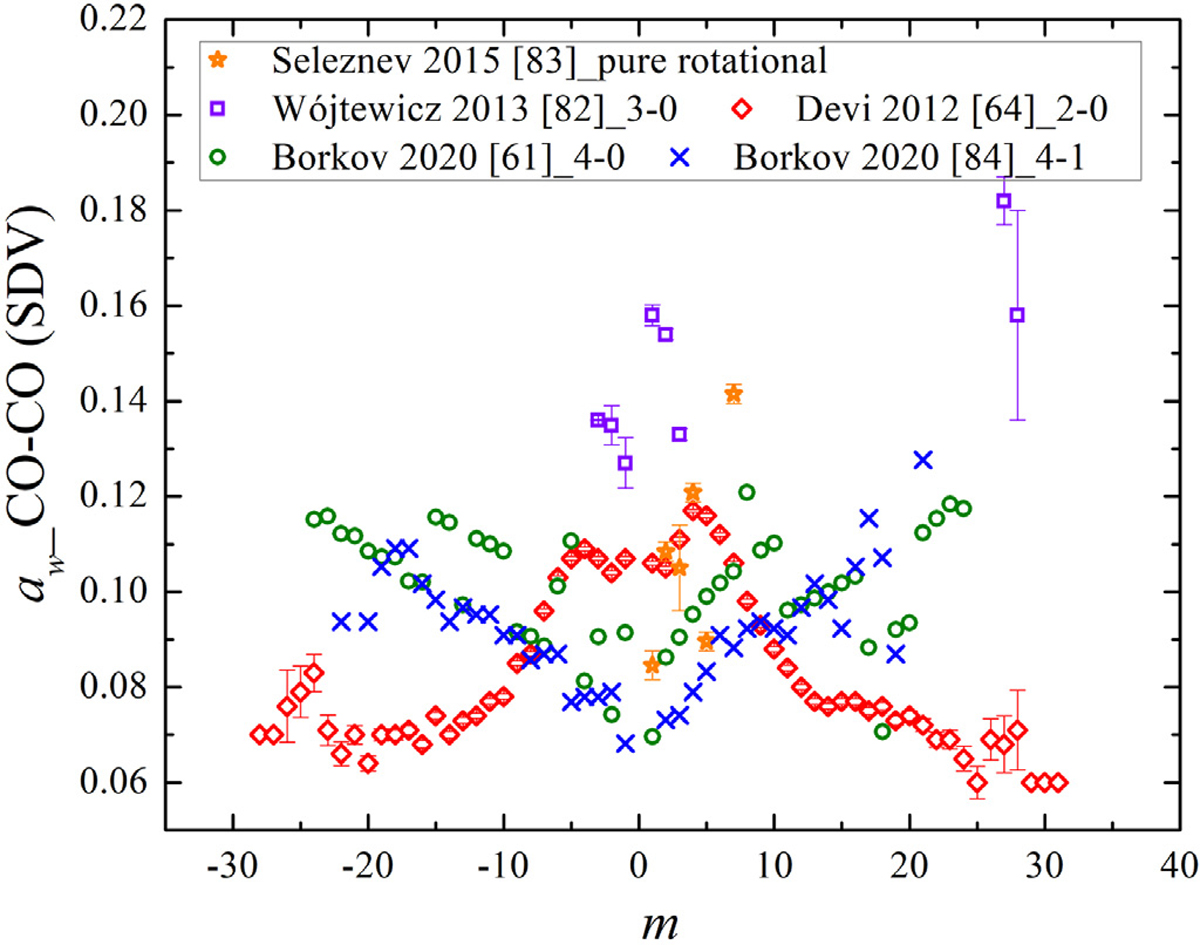
The self speed-dependent parameters (SDV) of CO versus m measured by Seleznev et al. [83] Wójtewicz et al. [82], Borkov et al. [61,84] and Devi et al. [64].
3.2. The CO-air and CO-CO pressure shifts
The air and self shifts of CO were calculated employing the same approach we explained in Section 2.3 for the N2O molecule [54] to obtain the coefficients , , , , , . These coefficients are written in Table 7. For estimating the air-shifts, the measured data in Refs. [69,70] were used to feed the algorithm. The coefficients obtained from the fit are written in Table 7. We note that where the accurate measured pressure shift parameters were available in HITRAN2016 database, they were taken in place of our calculated values. Therefore, the measured air shifts for the transitions in the 1–0, 2–0, and 3–0 bands remained the same as HITRAN2016. In addition, the values for the SDV profile for the 2–0 band remained the same as HITRAN2016 (only for the measured transitions). The calculated air-shifts were used for populating the non-measured transitions in HITRAN2020.
Table 7.
The coefficients obtained when fitting the experimental δ0-self [69] and δ0-air [69] values to Eq. (5).
| Coeff. δ0-self | Coeff. δ0-air | ||
|---|---|---|---|
|
| |||
| δvib | δrot | δvib | δrot |
The CO shift coefficients obtained based on the Hartmann semi-classical routine are compared with the measured results and HITRAN2016 air-shifts in Fig. 19. There is good agreement between the measured and calculated data for the two presented bands. New values of the shifts for the higher-J transitions have now been adopted, thereby replacing the previous constant value in HITRAN.
Fig. 19.
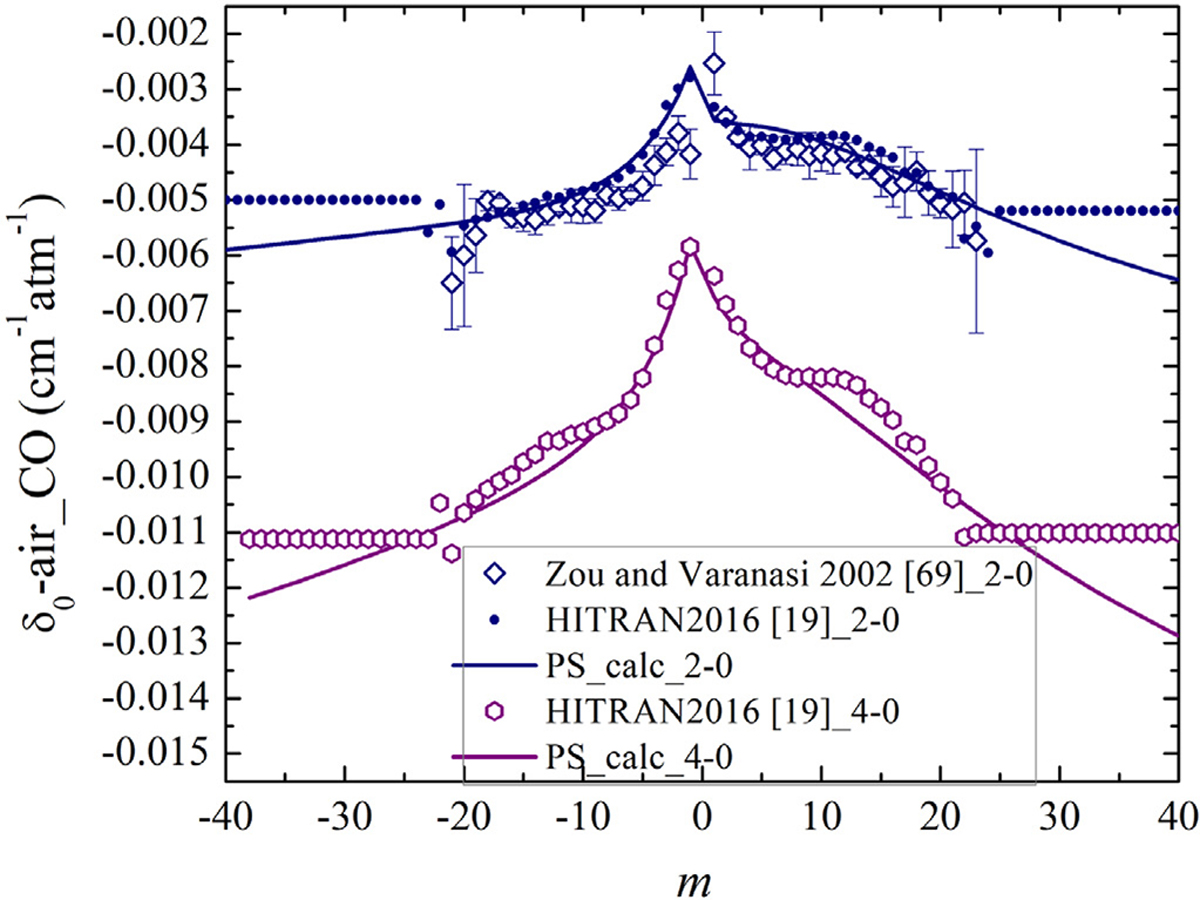
The measured δ0-air at 296 K versus m presented by symbols and the estimated ones using the Hartmann algorithm [54] in the present study (PS) shown by the same color solid lines. The measured shifts for the 2–0 band by Zou and Varanasi [69] are compared to those in HITRAN2016 and the calculated ones. The calculated shift parameters and the HITRAN2016 shifts in the 3–0 band are plotted as well.
For determining the CO-CO shifts using the VP, the measured pressure-shift values [69,71,74,76], measured in different regions, were utilized in the fit. The optimized fit result was achieved using the 2–0 band measured by Zou and Varanasi [69]. The same measurement was used to estimate the a1 constant to be 0.54. The required coefficients for calculating the self shifts are provided in Table 7. Again, the high-quality measured self shifts of CO for the 1–0 [71], 2–0 [64], 3–0 [70] and 4–0 [75] bands were directly adopted into the database for the measured lines.
For obtaining the a1 parameters, the experimental values measured by Devi et al. [64] for the 2–0 band (SDV) were used. By fitting the measured pressure shifts in this band and minimizing the difference, we obtained the coefficient a1 = 0.5. The calculated coefficients presented in Table 7 can be used to obtain the δ0-self for different bands.
Fig. 20 shows that the best agreement was obtained for the 2–0 band since these data were used to retrieve the empirical functions. The values agree well with the results reported by Predoi-Cross et al. [74] for the 3–0 band and with the measured self-shifts by Bordet et al. [75] for the 4–0 band.
Fig. 20.
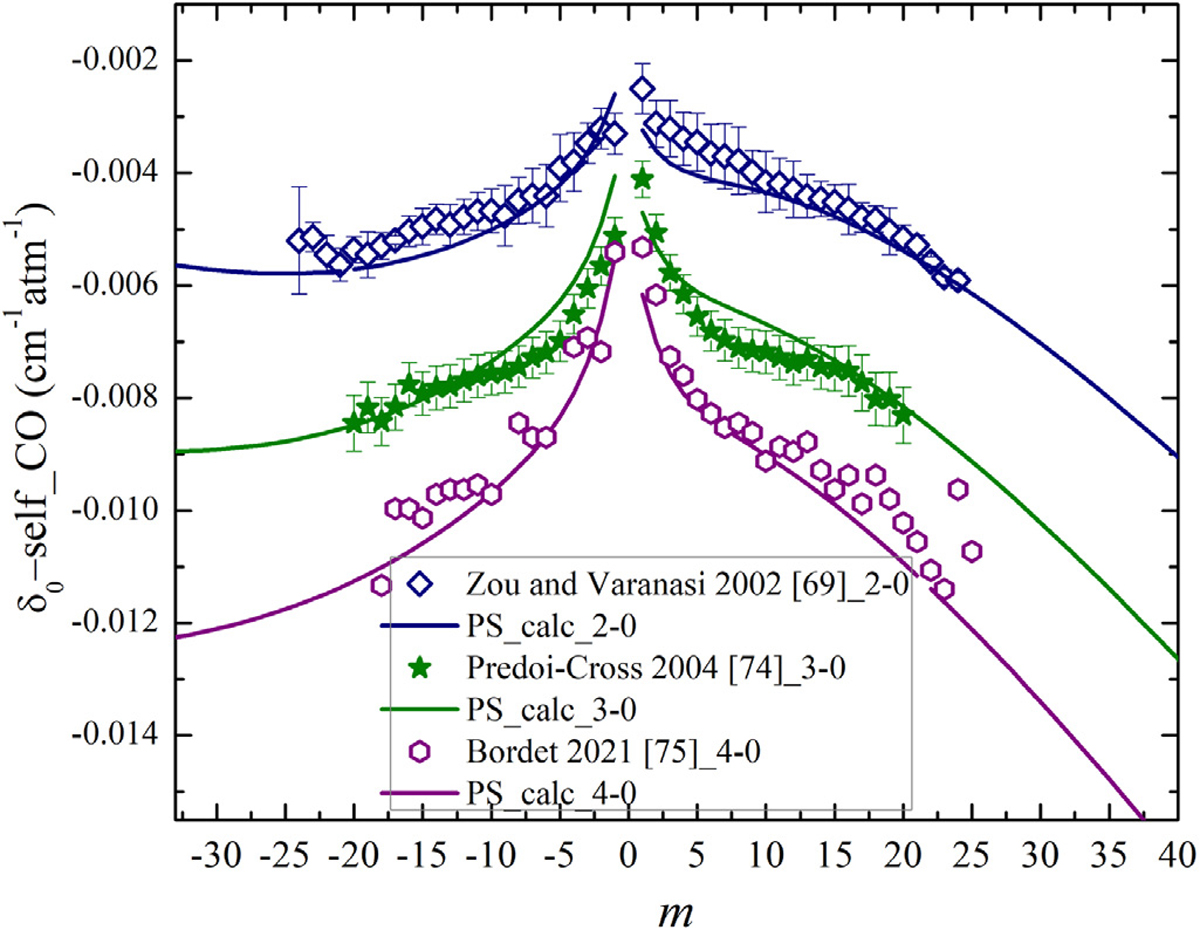
The measured δ0-self at 296 K versus m presented by symbols and the estimated ones using the Hartmann-algorithm [54] in the present study (PS) shown by the same color solid lines. The measured shifts for the 2–0 band by Zou and Varanasi [69] are displayed with the blue rhombus, the 3–0 band shifts, measured by Predoi-Cross et al. [74], are shown with the green stars, and the measured values for the 4–0 band [75] are presented with the purple hexagons.
The δ0-self for all the bands are produced using this method. This method yielded reliable estimates of pressure shifts for every transition. The rotational and vibrational dependence of the line shifts were reproduced well by the suggested process.
3.3. First-order line-mixing coefficients for CO-air and CO-CO lines
For the CO-air and CO-CO broadened lines, the EPG approximation was used as well to calculate the first-order line-mixing parameters. The air- and self-broadening parameters of CO measured using the VP and SDV profiles were used in the calculations. Fig. 21 presents a comparison of the measured and calculated Yk values for the 2–0 band. A good agreement was observed between the Devi et al. [64] measurements and the EPG calculations. In addition, the Yk parameters measured by Birk et al. [81] using the HT profile are displayed. The large difference in the higher m lines in the P-branch can be attributed to the difference of the SDV and HT line-shape models as well as increased relative uncertainty due to the weaker intensities of these lines.
Fig. 21.
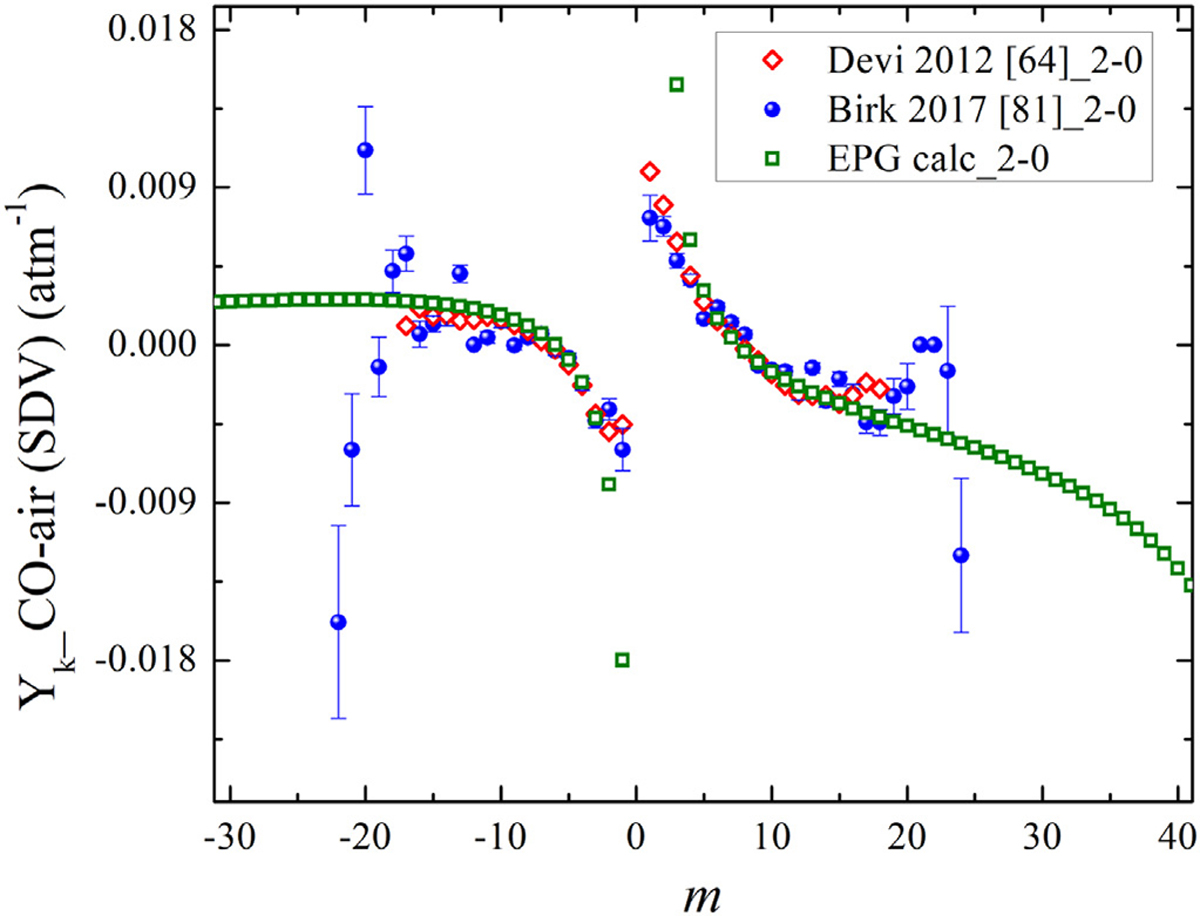
The measured Yk-air at 296 K versus m and the estimated ones using the EPG method in the present study (PS). The measured Yk for the 2–0 band by Devi et al. [64] and Birk et al. [81] are displayed. The presented Yk values are calculated at 296 K and 101 kPa.
The same comparison was performed for the CO-CO measured line-mixing parameters, and the approximated values are plotted in Fig. 22. The EPG calculated Yk for CO-CO are overlaid with the experimental parameters measured by Brault et al. [85] (using FT spectra at pressure range between 27 and 80 kP and temperature varying between 297.8 and 302.1 k) and Devi et al. [64]. As can be seen, there is an excellent agreement between the semi-empirical calculation and observed broadening coefficients for the P- and R-branch lines.
Fig. 22.
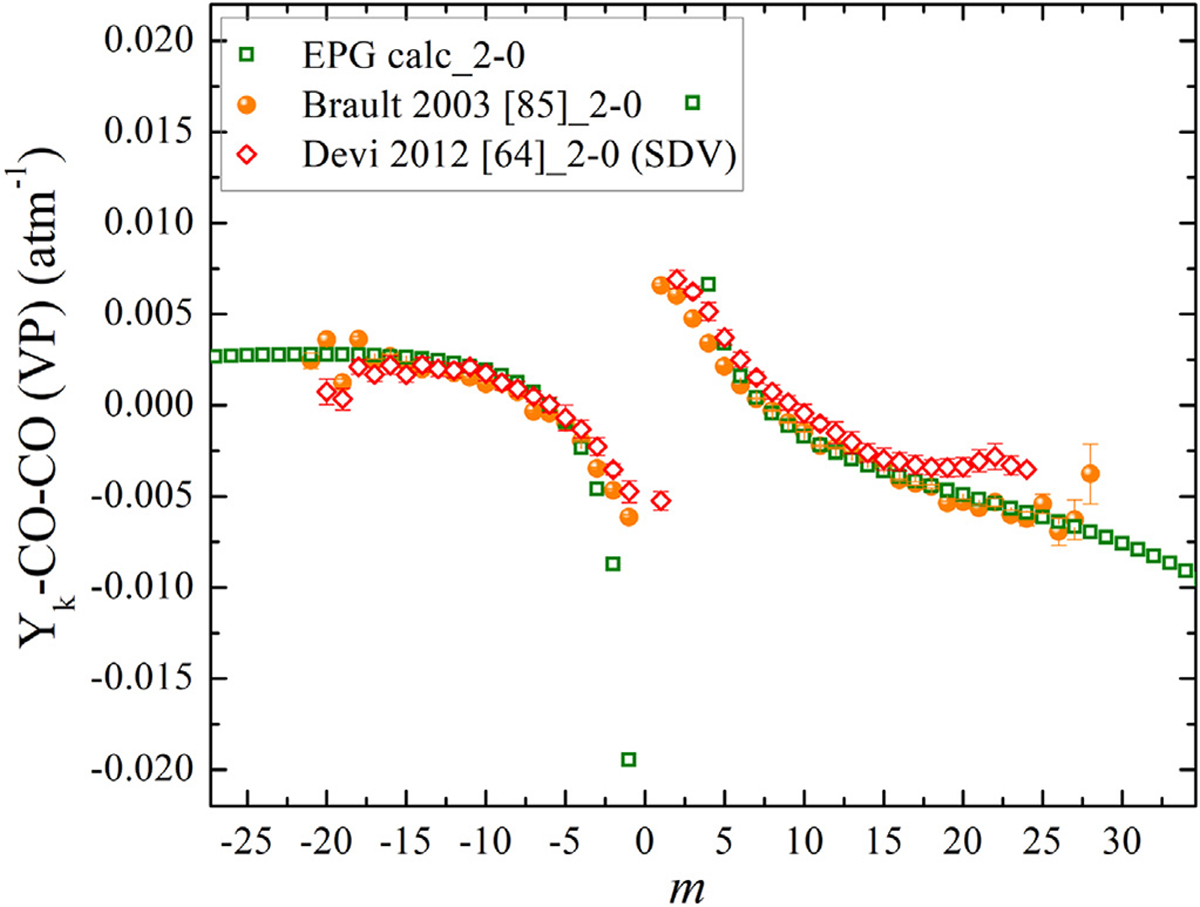
The first-order line-mixing (Yk-self) of CO calculated from the line-mixing code and comparison with those measured by Devi et al. [64] and Brault et al. [85]. The presented Yk values are calculated at 296 K and 101 kPa.
3.4. Validation of the results using laboratory spectra
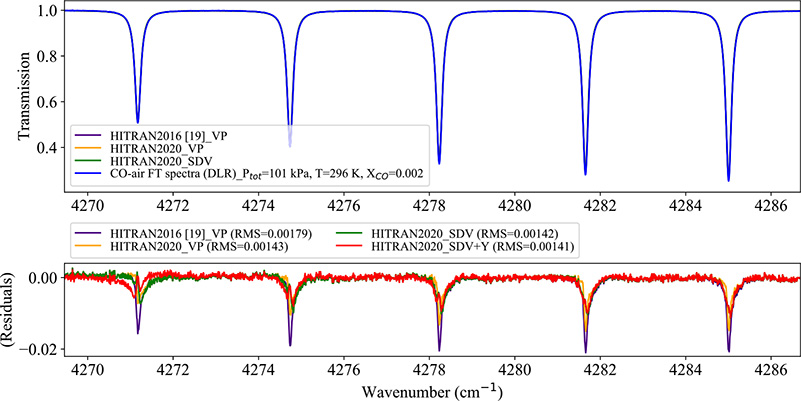
We used the laboratory FT spectra measured at the DLR [81] in the 2–0 band spectral region at a total pressure of 101 kPa and temperature of 296 K using a Bruker 125HR spectrometer. This laboratory measurement was employed to compare the experimental transmission to the line-shape calculation in HAPI [59]. Fig. 23 shows the experimental spectra (the upper panel) and the transmission calculated for the updated VP and SDV parameters. In addition, the HITRAN2016 VP parameters were used for calculating the transmission.
Fig. 23.
The FT transmission spectra of CO-air at T = 296 K, total P = 101 kPa and XCO = 0.002. The bottom panel shows the residuals for four set of calculations: a) the HITRAN2016 database using the VP, b) the new VP parameters as in the HITRAN2020 database, c) the new SDV parameters as in HITRAN2020, and d) the new SDV parameters including the first-order line-mixing effect.
The highest amplitudes of the residuals were calculated when using HITRAN2016 VP parameters. Using the new VP and SDV parameters led to improvements in calculating the spectra. We note that HITRAN2016 included the same SDV parameters for the 2–0 band only for the measured transitions (up to Jmax = 29) taken from Ref. [64]. We additionally examined how including the calculated line mixing influences the residuals. The calculated RMS value revealed that the best residuals were achieved when using the SDV parameters while accounting for the Rosenkranz parameters (RMS = 0.00141).
The new parameters for N2O and CO are provided as supplementary data tables to this paper and can be found in HITRAN online as well.
4. Conclusion
This study provided details regarding the update and extension of the HITRAN database for N2O and CO spectral line-shape parameters. We carried out an overview of the previous spectroscopic studies of N2O and CO that used the VP and SDV line profiles to model observed line-shapes. Informed by these results to provide best estimates of the relevant line parameters, we updated the N2O-air, N2O-N2O, CO-air, and CO-CO line-shape parameters for both profiles in the 2020 edition of the HITRAN database. Moreover, the new edition of the HITRAN database includes the calculated first-order line-mixing Yk values for each line. The shift parameters for the air- and self-broadened N2O, and CO absorption lines were also updated.
Experimental validations for the N2O-air system using atmospheric spectra showed that the new SDV N2O parameters appear to give improved residuals compared to those obtained using HITRAN2016 parameters with the VP. However, there remain significant systematic features in the residuals, possibly indicating the need for adding the speed-dependence and temperature dependence of the pressure-shift parameters. Validation using the laboratory spectra utilizing HAPI verified that new parameters estimated for both CO and N2O lines improve the residuals substantially either using the new VP or the SDV parameters.
The semi-empirical models used in the present study, are valid for the use of the HITEMP database as well. The new data are available in the HITRANonline and can be used for a variety of atmospheric applications. Note that atmospheric scientists should be aware that HITRAN has parameters associated with broadening by water vapor for the transitions of both N2O and CO as described in Tan et al. [86]. In future developments of the database, the HT parameters will be included for N2O and CO line lists as the flexible infrastructure of the database [29,30,87] readily allows for inclusion of these advanced parameters.
Acknowledgements
This work is supported through the NASA HITRAN grant 80NSSC20K0962. Certain commercial equipment, instruments, or materials are identified in this paper in order to specify the experimental procedure adequately. Such identification is not intended to imply recommendation or endorsement by the National Institute of Standards and Technology, nor is it intended to imply that the materials or equipment identified are necessarily the best available for the purpose.
Footnotes
Declaration of Competing Interest
The authors declare that they have no known competing financial interests or personal relationships that could have appeared to influence the work reported in this paper.
CRediT authorship contribution statement
Robab Hashemi: Formal analysis, Software, Methodology, Validation, Writing - original draft. Iouli E. Gordon: Supervision, Conceptualization, Methodology, Project administration, Funding acquisition, Writing - review & editing. Erin M. Adkins: Data curation. Joseph T. Hodges: Methodology, Data curation, Writing - review & editing. David A. Long: Data curation. Manfred Birk: Data curation. Joep Loos: Data curation. Chris D. Boone: Data curation, Validation. Adam J. Fleisher: Data curation. Adriana Predoi-Cross: Software, Conceptualization. Laurence S. Rothman: Conceptualization, Writing - review & editing.
Supplementary material
Supplementary material associated with this article can be found, in the online version, at doi:10.1016/j.jqsrt.2021.107735.
References
- [1].Ravishankara AR, Daniel JS, Portmann RW. Nitrous oxide N2O: the dominant ozone-depleting substance emitted in the 21st century. Science 2009;326(5949):123–5. doi: 10.1126/science.1176985. https://science.sciencemag.org/content/326/5949/123. [DOI] [PubMed] [Google Scholar]
- [2].Crutzen PJ. The influence of nitrogen oxides on the atmospheric ozone content. Q J R Meteorol Soc 1970;96(408):320–5. doi: 10.1002/qj.49709640815. [DOI] [Google Scholar]
- [3].Machida T, Nakazawa T, Fujii Y, Aoki S, Watanabe O. Increase in the atmospheric nitrous oxide concentration during the last 250 years. Geophys Res Lett 1995;22(21):2921–4. doi: 10.1029/95GL02822. [DOI] [Google Scholar]
- [4].Badr O, Probert S. Nitrous oxide in the earth’s atmosphere. Appl Energy 1992;41(3):177–200. doi: 10.1016/0306-2619(92)90002-S. [DOI] [Google Scholar]
- [5].Syakila A, Kroeze C. The global nitrous oxide budget revisited. Greenh Gas Meas Manag 2011;1(1):17–26. doi: 10.3763/ghgmm.2010.0007. [DOI] [Google Scholar]
- [6].Rapson TD, Dacres H. Analytical techniques for measuring nitrous oxide. TrAC, Trends Anal Chem 2014;54:65–74. doi: 10.1016/j.trac.2013.11.004. https://www.sciencedirect.com/science/article/pii/S0165993613002574. [DOI] [Google Scholar]
- [7].Duncan BN, Logan JA, Bey I, Megretskaia IA, Yantosca RM, Novelli PC, et al. Global budget of CO, 1988–1997: source estimates and validation with a global model. J Geophys Res 2007;112(D22). doi: 10.1029/2007JD008459. [DOI] [Google Scholar]
- [8].Bliefert C, Perraud R. Chimie de l’environnement – air, eau, sols, d’chets. De Boeck; 2009. [Google Scholar]
- [9].Jacob D, Press PU. Introduction to atmospheric chemistry. Princeton University Press; 1999. ISBN 9780691001852. [Google Scholar]
- [10].Bernath PF. The atmospheric chemistry experiment (ACE). J Quant Spectrosc Radiat Transf 2017;186:3–16. doi: 10.1016/j.jqsrt.2016.04.006. Satellite Remote Sensing and Spectroscopy: Joint ACE-Odin Meeting, October 2015; https://www.sciencedirect.com/science/article/pii/S0022407316300176. [DOI] [Google Scholar]
- [11].Microwave limb sounder home. 2021. https://mls.jpl.nasa.gov/.
- [12].Lambert A, Read WG, Livesey NJ, Santee ML, Manney GL, Froidevaux L, et al. Validation of the aura microwave limb sounder middle atmosphere water vapor and nitrous oxide measurements. J Geophys Res 2007;112(D24). doi: 10.1029/2007JD008724. [DOI] [Google Scholar]
- [13].Payan S, Camy-Peyret C, Oelhaf H, Wetzel G, Maucher G, Keim C, et al. Validation of version-4.61 methane and nitrous oxide observed by mipas. Atmos Chem Phys 2009;9(2):413–42. doi: 10.5194/acp-9-413-2009. [DOI] [Google Scholar]
- [14].Veefkind J, Aben I, McMullan K, Förster H, de Vries J, Otter G, et al. TROPOMI on the ESA sentinel-5 precursor: a GMES mission for global observations of the atmospheric composition for climate, air quality and ozone layer applications. Remote Sens Environ 2012;120:70–83. doi: 10.1016/j.rse.2011.09.027. http://linkinghub.elsevier.com/retrieve/pii/S0034425712000661. [DOI] [Google Scholar]
- [15].Clerbaux C, Boynard A, Clarisse L, George M, Hadji-Lazaro J, Herbin H, et al. Monitoring of atmospheric composition using the thermal infrared IASI/MetOp sounder. Atmos Chem Phys 2009;9(16):6041–54. doi: 10.5194/acp-9-6041-2009. [DOI] [Google Scholar]
- [16].Home - airs. 2021. https://airs.jpl.nasa.gov/.
- [17].Warner JX, Wei Z, Strow LL, Barnet CD, Sparling LC, Diskin G, et al. Improved agreement of airs tropospheric carbon monoxide products with other eos sensors using optimal estimation retrievals. Atmos Chem Phys 2010;10(19):9521–33. doi: 10.5194/acp-10-9521-2010. [DOI] [Google Scholar]
- [18].Wunch D, Toon GC, Wennberg PO, Wofsy SC, Stephens BB, Fischer ML, et al. Calibration of the total carbon column observing network using aircraft profile data. Atmos Meas Tech 2010;3(5):1351–62. doi: 10.5194/amt-3-1351-2010. [DOI] [Google Scholar]
- [19].Gordon IE, Rothman LS, Hill C, Kochanov RV, Tan Y, Bernath PF, Birk M, Boudon V, Campargue A, Chance KV, Drouin BJ, Flaud J-M, Gamache RR, Hodges JT, Jacquemart D, Perevalov VI, Perrin A, Shine KP, Smith M-AH, Tennyson J, Toon GC, Tran H, Tyuterev VG, Barbe A, Császár AG, Devi VM, Furtenbacher T, et al. The HITRAN2016 molecular spectroscopic database. J Quant Spectrosc Radiat Transf 2017;203:3–69. doi: 10.1016/j.jqsrt.2017.06.038. HITRAN2016 Special Issue; https://www.sciencedirect.com/science/article/pii/S0022407317301073. [DOI] [Google Scholar]
- [20].Berman PR. Speed-dependent collisional width and shift parameters in spectral profiles. J Quant Spectrosc Radiat Transfer 1972;12(9):1331–42. doi: 10.1016/0022-4073(72)90189-6. [DOI] [Google Scholar]
- [21].Pickett HM. Effects of velocity averaging on the shapes of absorption lines. J Chem Phys 1980;73(12):6090–4. doi: 10.1063/1.440145. [DOI] [Google Scholar]
- [22].Pine AS. Line shape asymmetries in ar-broadened HF(ν = 1 − 0) in the Dicke-narrowing regime. J Chem Phys 1994;101(5):3444–52. doi: 10.1063/1.467529. [DOI] [Google Scholar]
- [23].Ward J, Cooper J, Smith EW. Correlation effects in the theory of combined doppler and pressure broadening-I. Classical theory. J Quant Spectrosc Radiat Transf 1974;14(7):555–90. doi: 10.1016/0022-4073(74)90036-3. [DOI] [Google Scholar]
- [24].Rohart F, Mäder H, Nicolaisen H. Speed dependence of rotational relaxation induced by foreign gas collisions: studies on CH3F by millimeter wave coherent transients. J Chem Phys 1994;101(8):6475–86. doi: 10.1063/1.468342. [DOI] [Google Scholar]
- [25].Gordon IE, Rothman LS, Hargreaves RJ, Hashemi R, Karlovets EV, Skinner FM, Conway EK, Hill C, Kochanov RV, Tan Y, Wcisło P, Finenko AA, Nelson K, Bernath PF, Birk M, Boudon V, Campargue A, Chance KV, Coustenis A, Drouin BJ, Flaud J-M, et al. The HITRAN2020 molecular spectroscopic database. Submitted to J Quant Spectrosc Radiat Transf 2021. This Special Issue. [Google Scholar]
- [26].Voigt W Über das gesetz intensitätsverteilung innerhalb der linien eines gas spektrams.. Sitzber Bayr Akad München Ber 1912;603:18. [Google Scholar]
- [27].Rosenkranz P Shape of the 5 mm oxygen band in the atmosphere. IEEE Trans Antennas Propag 1975;23(4):498–506. doi: 10.1109/TAP.1975.1141119. [DOI] [Google Scholar]
- [28].Gentry B, Strow LL. Line mixing in a N2-broadened CO2 Q branch observed with a tunable diode laser. J Chem Phys 1987;86(10):5722–30. doi: 10.1063/1.452770. [DOI] [Google Scholar]
- [29].Hill C, Gordon IE, Kochanov RV, Barrett L, Wilzewski JS, Rothman LS. HITRA-Nonline: an online interface and the flexible representation of spectroscopic data in the HITRAN database. J Quant Spectrosc Radiat Transf 2016;177:4–14. doi: 10.1016/j.jqsrt.2015.12.012. [DOI] [Google Scholar]
- [30].Hill C, Gordon IE, Rothman LS, Tennyson J. A new relational database structure and online interface for the HITRAN database. J Quant Spectrosc Radiat Transf 2013;130:51–61. doi: 10.1016/j.jqsrt.2013.04.027. http://linkinghub.elsevier.com/retrieve/pii/S0022407313001751. [DOI] [Google Scholar]
- [31].Adkins EM, Long DA, Fleisher AJ, Hodges JT. Near-infrared cavity ring-down spectroscopy measurements of nitrous oxide in the (4200)-(0000) and (5000)-(0000) bands. J Quant Spectrosc Radiat Transf 2021;262:107527. doi: 10.1016/j.jqsrt.2021.107527. https://www.sciencedirect.com/science/article/pii/S0022407321000200. [DOI] [PMC free article] [PubMed] [Google Scholar]
- [32].Rothman LS, Gordon IE, Barbe A, Benner DC, Bernath PF, Birk M, Boudon V, Brown LR, Campargue A, Champion J-P, Chance K, Coudert LH, Dana V, Devi VM, Fally S, Flaud J-M, Gamache RR, Goldman A, Jacquemart D, Kleiner I, Lacome N, Lafferty WJ, Mandin J-Y, Massie ST, Mikhailenko SN, et al. The HITRAN 2008 molecular spectroscopic database. J Quant Spectrosc Radiat Transf 2009;110:533–72. doi: 10.1016/j.jqsrt.2009.02.013. [DOI] [Google Scholar]
- [33].Rothman LS, Gordon IE, Babikov Y, Barbe A, Benner CD, Bernath PF, Birk M, Bizzocchi L, Boudon V, Brown LR, Campargue A, Chance K, Cohen EA, Coudert LH, Devi VM, Drouin BJ, Fayt A, Flaud J-M, Gamache RR, Harrison JJ, Hartmann J-M, Hill C, Hodges JT, Jacquemart D, Jolly A, Lamouroux J, Roy Le RJ, Li G, Long DA, Lyulin OM, Mackie CJ, Massie ST, Mikhailenko S, et al. The HITRAN2012 molecular spectroscopic database. J Quant Spectrosc Radiat Transf 2013;130:4–50. doi: 10.1016/j.jqsrt.2013.07.002. HITRAN2012 special issue; https://www.sciencedirect.com/science/article/pii/S0022407313002859. [DOI] [Google Scholar]
- [34].Rothman LS, Jacquemart D, Barbe A, Benner CD, Birk M, Brown LR, Carleer MR, Chackerian C, Chance K, Coudert LH, Dana V, Devi VM, Flaud J-M, Gamache RR, Goldman A, Hartmann J-M, Jucks KW, Maki AG, Mandin J-Y, et al. The HITRAN 2004 molecular spectroscopic database. J Quant Spectrosc Radiat Transf 2005;96(2):139–204. doi: 10.1016/j.jqsrt.2004.10.008. https://www.sciencedirect.com/science/article/pii/S0022407305001081. [DOI] [Google Scholar]
- [35].Toth RA. N2- and air-broadened linewidths and frequency-shifts of N2O. J Quant Spectrosc Radiat Transf 2000;66(3):285–304. doi: 10.1016/S0022-4073(99)00167-3. [DOI] [Google Scholar]
- [36].Lacome N, Levy A, Guelachvili G. Fourier transform measurement of self-, N2-, and O2-broadening of N2O lines: temperature dependence of linewidths. Appl Opt 1984;23(3):425–35. doi: 10.1364/AO.23.000425. [DOI] [PubMed] [Google Scholar]
- [37].Nemtchinov V, Sun C, Varanasi P. Measurements of line intensities and line widths in the ν3-fundamental band of nitrous oxide at atmospheric temperatures. J Quant Spectrosc Radiat Transf 2004;83(3):267–84. doi: 10.1016/S0022-4073(02)00355-2. [DOI] [Google Scholar]
- [38].Loos J, Birk M, Wagner G. Pressure broadening, -shift, speed dependence and line mixing in the ν3 rovibrational band of N2O. J Quant Spectrosc Radiat Transf 2015;151:300–9. doi: 10.1016/j.jqsrt.2014.10.008. [DOI] [Google Scholar]
- [39].Ngo NH, Lisak D, Tran H, Hartmann JM. An isolated line-shape model to go beyond the Voigt profile in spectroscopic databases and radiative transfer codes. J Quant Spectrosc Radiat Transf 2013;129:89–100. doi: 10.1016/j.jqsrt.2013.05.034. [DOI] [Google Scholar]
- [40].Hashemi R, Gordon IE, Tran H, Kochanov RV, Karlovets EV, Tan Y, et al. Revising the line-shape parameters for air- and self-broadened CO2 lines toward a sub-percent accuracy level. J Quant Spectrosc Radiat Transf 2020;256:107283. doi: 10.1016/j.jqsrt.2020.107283. [DOI] [Google Scholar]
- [41].Toth RA. Line strengths (900–3600 cm−1), self-broadened linewidths, and frequency shifts (1800–2360 cm−1) of N2O. Appl Opt 1993;32(36):7326–65. doi: 10.1364/AO.32.007326. [DOI] [PubMed] [Google Scholar]
- [42].Truong G-W, Douglass OK, Maxwell SE, van Zee RD, Plusquellic DF, Hodges JT, et al. Frequency-agile, rapid scanning spectroscopy. Nat Photon 2013;7(1749–4893):532–4. doi: 10.1038/nphoton.2013.98. [DOI] [Google Scholar]
- [43].Adkins EM. MATS: Multi-spectrum analysis tool for spectroscopy. NIST; 2020. doi: 10.18434/M32200. [DOI] [Google Scholar]
- [44].Ngo NH, Nguyen HT, Le MT, Tran H. Air-broadened N2O line-shape parameters and their temperature dependences by requantized classical molecular dynamics simulations. J Quant Spectrosc Radiat Transf 2021:107607. doi: 10.1016/j.jqsrt.2021.107607. https://www.sciencedirect.com/science/article/pii/S002240732100100X. [DOI] [Google Scholar]
- [45].Werwein V, Brunzendorf J, Serdyukov A, Werhahn O, Ebert V. First measurements of nitrous oxide self-broadening and self-shift coefficients in the 0002–0000 band at 2.26 μm using high resolution fourier transform spectroscopy. J Mol Spectrosc 2016;323:28–42. doi: 10.1016/j.jms.2016.01.010. Atmospheric Spectroscopy; https://www.sciencedirect.com/science/article/pii/S002228521630011X. [DOI] [Google Scholar]
- [46].Varanasi P, Chudamani S. Tunable diode laser measurements of line widths in the ν1-fundamental band of 14N216O at atmospheric temperatures. J Quant Spectrosc Radiat Transf 1989;41(5):351–7. doi: 10.1016/0022-4073(89)90064-2. [DOI] [Google Scholar]
- [47].Boone CD, Bernath PF, Cok D, Jones SC, Steffen J. Version 4 retrievals for the atmospheric chemistry experiment fourier transform spectrometer (ACE-FTS) and imagers. J Quant Spectrosc Radiat Transf 2020;247:106939. doi: 10.1016/j.jqsrt.2020.106939. [DOI] [Google Scholar]
- [48].Predoi-Cross A, Hashemi R, Devi VM, Naseri H, Smith MAH. Analysis of Fourier transform spectra of N2O in the ν3 band for atmospheric composition retrievals. Can J Phys 2018;96(4):454–64. doi: 10.1139/cjp-2017-0303. [DOI] [Google Scholar]
- [49].Lance B, Blanquet G, Walrand J, Bouanich J-P. On the speed-dependent hard collision lineshape models: application to C2H2 perturbed by Xe. J Mol Spectrosc 1997;185(2):262–71. doi: 10.1006/jmsp.1997.7385. [DOI] [PubMed] [Google Scholar]
- [50].Dicke RH. The effect of collisions upon the doppler width of spectral lines. Phys Rev 1953;89:472–3. doi: 10.1103/PhysRev.89.472. [DOI] [Google Scholar]
- [51].Kochanov V On parameterization of spectral line profiles including the speed-dependence in the case of gas mixtures. J Quant Spectrosc Radiat Transf 2017;189:18–23. doi: 10.1016/j.jqsrt.2016.11.007. https://www.sciencedirect.com/science/article/pii/S0022407316307580. [DOI] [Google Scholar]
- [52].Odintsova T, Fasci E, Gravina S, Gianfrani L, Castrillo A. Optical feedback laser absorption spectroscopy of N2O at 2 μm. J Quant Spectrosc Radiat Transf 2020;254:107190. doi: 10.1016/j.jqsrt.2020.107190. https://www.sciencedirect.com/science/article/pii/S0022407320303277. [DOI] [Google Scholar]
- [53].Birk M, Röske C, Wagner G. High accuracy CO2 Fourier transform measurements in the range 6000–7000 cm−1. J Quant Spectrosc Radiat Transf 2021. submitted to HITRAN2020 special issue. [Google Scholar]
- [54].Hartmann J-M. A simple empirical model for the collisional spectral shift of air-broadened CO2 lines. J Quant Spectrosc Radiat Transf 2009;110(18):2019–26. doi: 10.1016/j.jqsrt.2009.05.016. [DOI] [Google Scholar]
- [55].Strow LL, Pine AS. Q-branch line mixing in N2O: Effects of l-type doubling. J Chem Phys 1988;89(3):1427–34. doi: 10.1063/1.455142. [DOI] [Google Scholar]
- [56].Margottin-Maclou M, Henry A, Valentin A. Line mixing in the q branches of the ν1 + ν2 band of nitrous oxide and of the (1110)I–(0220) band of carbon dioxide. J Chem Phys 1992;96(3):1715–23. doi: 10.1063/1.462126. [DOI] [Google Scholar]
- [57].Hartmann J-M, Bouanich J-P, Jucks KW, Blanquet G, Walrand J, Bermejo D, Domenech J-L, Lacome N. Line-mixing effects in N2O Q branches: model, laboratory, and atmospheric spectra. J Chem Phys 1999;110(4):1959–68. doi: 10.1063/1.477862. [DOI] [Google Scholar]
- [58].Vitcu A, Ciurylo R, Wehr R, Drummond J, May A. Broadening, shifting, and line mixing in the 0310–0110 parallel Q branch of N2O. J Mol Spectrosc 2004;226(1):71–80. doi: 10.1016/j.jms.2004.03.017. https://www.sciencedirect.com/science/article/pii/S0022285204001195. [DOI] [Google Scholar]
- [59].Kochanov RV, Gordon IE, Rothman LS, Wcisło P, Hill C, Wilzewski JS. HITRAN application programming interface (HAPI): a comprehensive approach to working with spectroscopic data. J Quant Spectrosc Radiat Transf 2016;177:15–30. doi: 10.1016/j.jqsrt.2016.03.005. [DOI] [Google Scholar]
- [60].Devi VM, Benner DC, Sung K, Crawford TJ, Li G, Gamache RR, Smith MAH, Gordon IE, Mantz AW. Positions, intensities and line shape parameters for the 1–0 bands of CO isotopologues. J Quant Spectrosc Radiat Transf 2018;218:203–30. doi: 10.1016/j.jqsrt.2018.06.007. https://www.sciencedirect.com/science/article/pii/S0022407318302462. [DOI] [Google Scholar]
- [61].Borkov YG, Solodov AM, Solodov AA, Petrova TM, Karlovets EV, Perevalov VI. Fourier transform CO spectra near 1.6 μm. J Quant Spectrosc Radiat Transf 2020;253:107064. doi: 10.1016/j.jqsrt.2020.107064. https://www.sciencedirect.com/science/article/pii/S0022407320302557. [DOI] [Google Scholar]
- [62].Cygan A, Wcisło P, Wójtewicz S, Kowzan G, Zaborowski M, Charczun D, et al. High-accuracy and wide dynamic range frequency-based dispersion spectroscopy in an optical cavity. Opt Express 2019;27(15):21810. doi: 10.1364/OE.27.021810. [DOI] [PubMed] [Google Scholar]
- [63].Li G, Gordon IE, Rothman LS, Tan Y, Hu S-M, Kassi S, Campargue A, Medvedev ES. Rovibrational line lists for nine isotopologues of the CO molecule in the X 1 Σ+ground electronic state. Astrophys J Suppl Ser 2015;216. doi: 10.1088/0067-0049/216/1/15. [DOI] [Google Scholar]
- [64].Devi VM, Benner CD, Smith MAH, Mantz A, Sung K, Brown LR, Predoi-Cross A. Spectral line parameters including temperature dependences of self- and air-broadening in the 2–0 band of CO at 2.3 μm. J Quant Spectrosc Radiat Transf 2012;113(11):1013–33. doi: 10.1016/j.jqsrt.2012.02.010. Three Leaders in Spectroscopy; https://www.sciencedirect.com/science/article/pii/S0022407312000696. [DOI] [Google Scholar]
- [65].Devi VM, Benner DC, Smith MAH, Mantz AW, Sung K, Brown LR. Spectral line parameters including temperature dependences of air-broadening for the 2–0 bands of 13C16O and 12C18O at 2.3 μm. J Mol Spectrosc 2012;276–277:33–48. doi: 10.1016/j.jms.2012.05.005. https://www.sciencedirect.com/science/article/pii/S0022285212000872. [DOI] [Google Scholar]
- [66].Hartmann J-M, Boulet C Line shape parameters for HF in a bath of argon as a test of classical path models. J Chem Phys 2000;113(20):9000–10. doi: 10.1063/1.1319346. [DOI] [Google Scholar]
- [67].Hashemi R, Predoi-Cross A, Dudaryonok A, Lavrentieva N, Vandaele A, Vander Auwera J. CO2 pressure broadening and shift coefficients for the 2–0 band of 12C16O. J Mol Spectrosc 2016;326:60–72. doi: 10.1016/j.jms.2016.02.014. New Visions of Spectroscopic Databases, Volume I. [DOI] [Google Scholar]
- [68].Régalia-Jarlot L, Thomas X, Von der Heyden P, Barbe A. Pressure-broadened line widths and pressure-induced line shifts coefficients of the (1–0) and (2–0) bands of 12C16O. J Quant Spectrosc Radiat Transf 2005;91(2):121–31. doi: 10.1016/j.jqsrt.2004.05.042. https://www.sciencedirect.com/science/article/pii/S0022407304001992. [DOI] [Google Scholar]
- [69].Zou Q, Varanasi P. New laboratory data on the spectral line parameters in the 1–0 and 2–0 bands of CO relevant to atmospheric remote sensing. J Quant Spectrosc Radiat Transf 2002;75(1):63–92. doi: 10.1016/S0022-4073(02)00007-9. [DOI] [Google Scholar]
- [70].Sung K, Varanasi P. Intensities, collision-broadened half-widths, and collision-induced line shifts in the second overtone band of 12C16O. J Quant Spectrosc Radiat Transf 2004;83(3):445–58. doi: 10.1016/S0022-4073(03)00015-3. [DOI] [Google Scholar]
- [71].Ngo NH, Landsheere X, Pangui E, Morales S, Tran H, Hartmann J-M. Self-broadening and -shifting of very intense lines of the 1–0 band of CO. J Quant Spectrosc Radiat Transf 2014;149:285–90. doi: 10.1016/j.jqsrt.2014.08.021. https://www.sciencedirect.com/science/article/pii/S0022407314003653. [DOI] [Google Scholar]
- [72].Predoi-Cross A, Bouanich JP, Benner DC, May AD, Drummond JR. Broadening, shifting, and line asymmetries in the 2–0 band of CO and N2: experimental results and theoretical calculations. J Chem Phys 2000;113(1):158–68. doi: 10.1063/1.481783. [DOI] [Google Scholar]
- [73].Esteki K, Predoi-Cross A, Povey C, Ivanov S, Ghoufi A, Thibault F, et al. Room temperature self- and H2-broadened line parameters of carbon monoxide in the first overtone band: theoretical and revised experimental results. J Quant Spectrosc Radiat Transf 2017;203:309–24. doi: 10.1016/j.jqsrt.2017.04.008. HITRAN2016 Special Issue; https://www.sciencedirect.com/science/article/pii/S0022407316308780. [DOI] [Google Scholar]
- [74].Predoi-Cross A, Hnatovsky C, Strong K, Drummond JR, Benner CD. Temperature dependence of self- and N2-broadeningand pressure-induced shifts in the 3←0 band of CO. J Mol Struct 2004;695–696:269–86. doi: 10.1016/j.molstruc.2003.12.043. [DOI] [Google Scholar]
- [75].Bordet B, Kassi S, Campargue A. Line parameters of the 4–0 band of carbon monoxide by high sensitivity cavity ring down spectroscopy near 1.2μm. J Quant Spectrosc Radiat Transf 2021;260:107453. doi: 10.1016/j.jqsrt.2020.107453. https://www.sciencedirect.com/science/article/pii/S002240732030981X. [DOI] [Google Scholar]
- [76].Devi MV, Predoi-Cross A, Benner CD, Smith M, Rinsland C, Mantz A. Self- and H2-broadened width and shift coefficients in the 2–0 band of 12C16O: revisited. J Mol Spectrosc 2004;228(2):580–92. doi: 10.1016/j.jms.2004.05.006. Special Issue Dedicated to Dr. Jon T. Hougen on the Occasion of His 68th Birthday; https://www.sciencedirect.com/science/article/pii/S0022285204001584. [DOI] [Google Scholar]
- [77].Smith MAH, Brown LR, Devi VM, Pittman TJ. CO broadening and shift parameters for TES. In: Proceedings of the Eighth HITRAN database conference, Cambridge, MA, June; 2004. [Google Scholar]
- [78].Smith MAH, Perrin A, Ben Sari-Zizi N, Demaison J. Recent results on infrared molecular line broadening and shift parameters. remote sensing of the atmosphere for environmental security. NATO security through science series (NATO security through science series c: environmental security). Dordrecht: Springer; 2006. 10.1007/978-1-4020-5090-9_12. [DOI] [Google Scholar]
- [79].Hochstaffl P, Schreier F, Birk M, Wagner G, Feist DG, Notholt J, et al. Impact of molecular spectroscopy on carbon monoxide abundances from TROPOMI. Remote Sens 2020;12(21):3486. doi: 10.3390/rs12213486. www.mdpi.com/journal/remotesensing https://www.mdpi.com/2072-4292/12/21/3486. [DOI] [Google Scholar]
- [80].Hochstaffl P, Schreier F. Impact of molecular spectroscopy on carbon monoxide abundances from SCIAMACHY. Remote Sens 2020;12(7):1084. doi: 10.3390/rs12071084. [DOI] [Google Scholar]
- [81].Birk M, Wagner G, Loos J, Mondelain D, Campargue A. Esa seom-ias measurement database 2.3 μm region. Zenodo; 2017. doi: 10.5281/zenodo.1009122. [DOI] [Google Scholar]
- [82].Wójtewicz S, Stec K, Masłowski P, Cygan A, Lisak D, Trawiński R, et al. Low pressure line-shape study of self-broadened CO transitions in the 3–0 band. J Quant Spectrosc Radiat Transf 2013;130:191–200. doi: 10.1016/j.jqsrt.2013.06.005. HITRAN2012 special issue; https://www.sciencedirect.com/science/article/pii/S0022407313002495. [DOI] [Google Scholar]
- [83].Seleznev AFR,Fedoseev GV, Koshelev MA, Tretyakov MY. Shape of collision-broadened lines of carbon monoxide. J Quant Spectrosc Radiat Transf 2015;161:171–9. doi: 10.1016/j.jqsrt.2015.04.011. https://www.sciencedirect.com/science/article/pii/S0022407315001624. [DOI] [Google Scholar]
- [84].Borkov YG, Solodov AM, Petrova TM, Solodov AA, Karlovets EV, Perevalov VI. Fourier transforms CO spectra near 1.19 μm. J Quant Spectrosc Radiat Transf 2020;242:106790. doi: 10.1016/j.jqsrt.2019.106790. https://www.sciencedirect.com/science/article/pii/S0022407319307125. [DOI] [Google Scholar]
- [85].Brault J, Brown L, Chackerian C, Freedman R, Predoi-Cross A, Pine A. Self-broadened 12C16O line shapes in the v=2–0 band. J Mol Spectrosc 2003;222(2):220–39. doi: 10.1016/j.jms.2003.07.002. https://www.sciencedirect.com/science/article/pii/S0022285203002327. [DOI] [Google Scholar]
- [86].Tan Y, Kochanov RV, Rothman LS, Gordon IE. Introduction of water-vapor broadening parameters and their temperature-dependent exponents into the HITRAN database: part I-CO2, N2O, CO, CH4, O2, NH3, and H2S. J Geophys Res 2019;124(21):11580–94. doi: 10.1029/2019JD030929. [DOI] [PMC free article] [PubMed] [Google Scholar]
- [87].Wcisło P, Gordon IE, Tran H, Tan Y, Hu SM, Campargue A, Kassi S, Romanini D, Hill C, Kochanov RV, Rothman LS. The implementation of non-Voigt line profiles in the HITRAN database: H2 case study. J Quant Spectrosc Radiat Transfer 2016;177:75–91. doi: 10.1016/j.jqsrt.2016.01.024. https://www.sciencedirect.com/science/article/pii/S0022407315302028. [DOI] [Google Scholar]


