

Abstract
MicroRNAs are small non-coding RNAs that epigenetically regulate gene expression. MiR-200c is a known tumor suppressive microRNA found in many types of cancer, and its high expression has been associated with improved prognosis. However, the association between miR-200c expression and its clinical relevance in gastric cancer (GC) patients remains controversial. Here, we hypothesized that gastric cancer patients with high miR-200c gene expression translated to better overall survival. A total of 372 GC patients from the Cancer Genome Atlas (TCGA) were analyzed. The top three quartiles were defined as a high miR-200c expression group. High miR-200c expression was associated with decreased invasion, favorable histological type, and improved overall survival in gastric cancer patients. Unexpectedly, high miR-200c expression GC was also associated with enhanced cell proliferation, shown by MKi67 expression, proliferation score, and enrichment of Hallmark cell proliferation-related gene sets (E2F targets, G2M checkpoints, MYC targets v1 and v2) by gene set enrichment assay (GSEA). High miR-200c GC was also associated with a high mutation rate and homologous recombination deficiency. Despite the association with elevated neoantigens, high miR-200c GC was associated with significantly low infiltration of anti-cancer immune cells, decreased immune response, and with suppressed IL2, TNF-α, and IFN-γ pathways. On the other hand, GC with low miR-200c expression significantly enriched hypoxia, angiogenesis, epithelial-mesenchymal transition (EMT), and TGF-β signaling gene sets, all of which promote cancer progression and metastasis in GSEA. In conclusion, patients with high miR-200c expression GC had better survival despite association with aggressive tumor biology, such as high mutation rates, cell proliferation, and low cancer immunity. Given that low miR-200c GC was associated with hypoxia, angiogenesis, EMT and TGF-β signaling, we cannot help but speculate that the difference in survival by miR-200c expression may be at least partly due to the association between low miR-200c expression and aggressive biology.
Keywords: Gastric cancer, prognosis, signaling, EMT, angiogenesis
Introduction
Gastric cancer (GC) is the fourth most common cause of cancer-related death in the world [1]. Although the incidence and mortality of GC has declined with preventive measures such as eradication of Helicobacter pylori infection and with advances in therapeutics, the prognosis of advanced GC remains poor. To this end, better understanding of the biology of real-world GC patients is needed.
MicroRNAs are small non-coding RNAs that epigenetically regulate gene expression. They play key roles in cancer biology including cell proliferation, cell invasion, and metastasis. MiR-200c is a known tumor-suppressive microRNA found in various cancers [2-5]. To date, there have been numerous experimental studies that elucidated the mechanism as to how miR-200c suppresses cancer progression. For instance, miR-200c expression was shown to downregulate hypoxia-inducible factor-1α (HIF-1α) and inhibit angiogenesis in lung cancer and bladder cancer [6,7], where hypoxia-induced angiogenesis is a known mechanism of cancer progression. Additionally, recent experimental studies demonstrated that the miR-200 family suppresses epithelial-mesenchymal transition (EMT), a key step for cancer metastasis that enables epithelial cancer cells to gain invasive properties in breast, ovarian, and GCs [8-10]. Indeed, Song et al. reported that EMT markers such as E-cadherin are associated with GC survival [10]. In GC cells, overexpression of miR-200b induced the epithelial phenotype, and systemic delivery of miR-200b induced mesenchymal to epithelial transition confirmed by E-cadherin expression in vivo [10].
In terms of clinical outcomes, high expression of miR-200c was associated with improved prognosis in various cancers [11,12]. In GC, the relationship between miR-200c expression and prognosis differs by organ. Although increased miR-200c expression was associated with improved prognosis in primary GC tumors [10,13,14], it was found to be associated with a poorer prognosis in blood samples [15]. Further, a meta-analysis that systemically reviewed this relationship gathered studies that used both tumor tissue and blood samples, and did not differentiate between the two in their study [16]. To this end, survival analysis utilizing a larger cohort was in need.
Our group has been pursuing an in silico translational approach to address the clinical relevance of gene expressions including microRNAs [17-20]. For instance, we reported that high expression of miR-200c in breast tumors was associated with significantly better overall survival (OS) in breast cancer patients [2]. We used multiple algorithms such as gene set enrichment analysis (GSEA) and xCell to analyze the biology and estimate infiltrating cells by examining the expression levels of genes of interest [19,21-23]. Here, using a large GC patient cohort in The Cancer Genome Atlas (TCGA), we hypothesized that GC with high miR-200c expression has unique cancer biology characteristics that translates to better overall survival.
Materials and methods
Data acquisition of GC patients in TCGA
Transcriptome data of The Cancer Genome Atlas Stomach Adenocarcinoma project (TCGA-STAD, n = 375) was obtained through the Genomic Data Commons data portal (GDC) as previously described [24,25]. Clinical and pathological data were extracted from the Pan-Cancer Clinical Data Resource.
Gene set enrichment analysis (GSEA)
Gene Set Enrichment Analysis (GSEA) [26] was performed using the GSEA Java software (version 4.0) with MSigDB Hallmark gene sets to study the enrichment of signaling pathways as previously described [27-29]. Enrichment score (ES) is the maximum deviation from zero encountered in walking the list. Normalized enrichment score (NES), which is ES adjusted to the gene set, was used for evaluation. False discovery rate (FDR) of less than 0.25 was used for the statistical significance as recommended.
Estimation of intratumoral cell fraction
xCell algorithm [30] is a gene signature-based method to assess the tumor microenvironment from transcriptomics. It was used to convert gene expression profiles to enrichment scores of 64 types of immune and stroma cells, as we previously described [18,31,32]. Cytolytic Activity (CYT) score is an index of cancer immunity, and was calculated from granzyme A and Perforin 1 expression levels [33,34]. We also investigated intratumoral heterogeneity, homologous recombination deficiency (HRD), fraction altered, silent and non-silent mutation rate, single-nucleotide variants (SNV) antigens, proliferation score, lymphocyte infiltration signature score, leukocyte fraction, TCR richness, BCR richness, which are precalculated by Thorsson et al. [35].
Statistical analysis
R software (version 4.1.0) was used for all analyses. Boxplots were used to depict medians and interquartile range (IQR). P values for group comparisons were calculated by the Mann-Whitney U test, Kruskal-Wallis test or Fisher’s test. The statistical significance was defined as a two-sided p-value of less than 0.05. The top three quartiles were defined as a high miR-200c expression group. The Kaplan-Meier method with log-rank test was used for survival analyses.
Results
High miR-200c expression was associated with decreased tumor invasion, favorable histological type and better patient survival in gastric cancer (GC)
Since miR-200c is a known tumor-suppressive microRNA, we expected that gastric cancer patients with higher miR-200c expression would demonstrate less aggressive clinical phenotypes. Indeed, we found that miR-200c expression was significantly negatively correlated with the invasion of the primary tumor (assessed by the American Joint Committee (AJCC) T category, Figure 1A, P = 0.002). The T1 category, which is tumor invasion limited to the mucosal or submucosal layers, showed significantly higher miR-200c expression compared to the more advanced T2, T3 or T4 (Figure S1A, P = 0.001, P = 0.001, or P = 0.001, respectively). Although there was no significance in AJCC staging by Kruskal-Wallis test (Figure 1A, P = 0.063), Stage 1 showed significantly higher miR-200c compared to Stage 2, 3, and 4 when compared individually by Mann-Whitney U test (Figure S1A, P = 0.004, P = 0.005, and P = 0.001, respectively). Of note, poorly differentiated diffuse type gastric cancer, known for its severe prognosis, was associated with the lowest miR-200c levels amongst the histologic types by Kruskal-Wallis test (Figure 1B, P < 0.001); however, significant difference in miR-200c expression was only apparent between the tubular and diffuse type when individual histological types were compared using Mann-Whitney U test (Figure S1B, P < 0.001).
Figure 1.
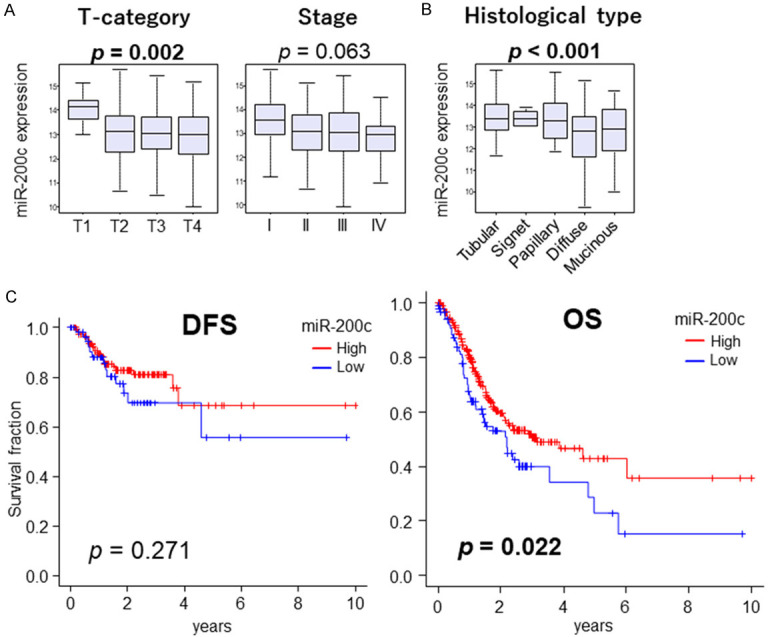
Clinical relevance of miR-200c in GC. A. Boxplots of miR-200c expression by AJCC T-category, AJCC staging. B. Boxplots of miR-200c expression by histological type. The group comparisons were tested by Mann-Whitney U test, and multiple groups by Kruskal-Wallis test. The error bars in each boxplot show the 95% confidence interval. Horizontal line inside the boxes are the median, and top and bottom show the 25th and 75th percentiles, respectively. C. Disease-Free Survival (DFS) and Overall Survival (OS) between high and low miR-200c expression groups. Top three quartiles were defined as high miR-200c expression. High groups are indicated by red lines, low groups by blue lines. P-value less than 0.05 are in bold. Log-rank test was used to test the significance of the survival analysis.
The top three quartiles in each cohort were defined as a high miR-200c expression group and the characteristics were demonstrated in Table S1. There was no significant difference between high and low miR-200c groups. High miR-200c GC patients demonstrated significantly better overall survival (OS) (Figure 1C, P = 0.022), but not disease-free survival (DFS) (Figure 1C, P = 0.271). GC patients with high miR-200a and miR-200b expression also showed significantly better OS, however, they were not as prominent as miR-200c (Figure S2A). These results suggest that miR-200c expression in GC is associated with better clinical phenotypes.
High miR-200c GC was significantly associated with enhanced cell proliferation
Uncontrollable accelerated cell proliferation is one of the key hallmarks of cancer that determines its aggressiveness [36-39]. Thus, it was of interest to investigate whether miR-200c expression in patients’ GC was related to cell proliferation. Surprisingly, gene expression of Ki67 (MKI67), a cell proliferation marker that is routinely used in clinical practice, as well as proliferation score, were both significantly associated with miR-200c expression (Figure 2A, P < 0.001 and P < 0.001, respectively). Consistently, we found that high miR-200c GC significantly enriched five cell proliferation-related gene sets by gene set enrichment assay (GSEA, Figure 2B); E2F targets (normalized enrichment score (NES) = 1.97, false discovery rate (FDR) = 0.02), G2M checkpoints (NES = 1.83, FDR = 0.03), MYC targets v1 (NES = 1.86, FDR = 0.03) and MYC targets v2 (NES = 1.86, FDR = 0.04), as well as other pro-cancerous gene sets; mTORC1 signaling (NES = 1.61, FDR = 0.10), unfolded protein response (NES = 1.44, FDR = 0.17), and DNA repair (NES = 1.46, FDR = 0.19). These findings suggest that high miR-200c expression is associated with cell proliferation in GC, despite its association with improved survival.
Figure 2.

Association of miR-200c expression and cell proliferation. A. Boxplots of Ki67 gene expression (MKI67) and proliferation score by high and low miR-200c expression groups. Top three quartiles were defined as high miR-200c expression group. B. Enrichment plots of cell proliferation-related gene sets; E2F targets, G2M checkpoints, MYC targets v1 and v2, as well as other pro-cancerous gene sets; MTORC1, unfolded protein response, and DNA repair pathways in gene enrichment analysis (GSEA) comparing high vs low expression of miR200c. FDR less than 0.25 is regarded as significant in GSEA. All two group comparisons are tested by Whitney U test. The error bars in each boxplot show the 95% confidence interval. The line in the box shows the median, and top and bottom show the 25th and 75th percentiles, respectively.
High miR-200c GC was significantly associated with high homologous recombination deficiency (HRD) and with high mutation load
In order to investigate the possible mechanism behind how miR-200c expression was associated with increased cell proliferation but better OS, we analyzed the relationship between miR-200c expression and mutation rate that correlated with aggressive cancer phenotypes in patients’ GC. Surprisingly, homologous recombination deficiency (HRD), the inability to repair double stranded breaks in DNA, was significantly higher in high miR-200c expression GC (Figure 3A, P < 0.001), whereas no significant association with intratumor heterogeneity was found (Figure 3A, P = 0.266). Further, high miR-200c GC was significantly associated with mutations (Figure 3B); fraction altered (P < 0.001), silent mutation rate (P < 0.001) and non-silent mutation rate (P < 0.001). In agreement, high miR-200c tumors were associated with higher single-nucleotide variations (SNV) neoantigens (P = 0.028). This data is consistent with the fact that high miR-200c expression GC was associated with enhanced cell proliferation, due to the increased likelihood of mutations, particularly when DNA repair is impaired.
Figure 3.

Association of miR-200c expression and scores of mutation-related, intratumor heterogeneity, and homologous recombination defects (HRD) in GC. Boxplots of (A) intratumor heterogeneity and HRD. (B) Mutation-related scores; fraction altered, silent and non-silent mutation rate, and SNV (Single-nucleotide variations) neoantigens, by high and low miR-200c groups. Top three quartiles were defined as high miR-200c expression group. p-value of less than 0.05 is in bold. All two group comparisons are tested by Mann-Whitney U test.
High miR-200c GC was associated with low cancer immunity
It is known that cancer with high mutation burden is more likely to generate neoantigens that attract immune cell infiltrations to the tumor microenvironment. To this end, we hypothesized that miR-200c expression is associated with antitumor immune cell infiltrations and immune response. First, we analyzed the association between miR-200c expression and immune cell infiltrations. Contrary to our expectation, high miR-200c expression was associated with significantly less infiltration of anti-cancerous immune cells; CD8+ cells, and dendric cells (DC) (Figure 4A, P = 0.020, P < 0.001, respectively), while the infiltration of T helper type 1 (Th1) cells, which are also anti-cancerous immune cells, was higher in high miR-200c GC (Figure 4A, P < 0.001). There was no trend in the infiltration of the other immune cells, such as CD4+ memory cells, natural killer (NK) cells, M1 macrophage and B cells, with regard to miR-200c expression (Figure 4A, 4B). High miR-200c expression was also significantly associated with high infiltration of pro-cancerous immune cells; T helper type 2 (Th2) cells, regulatory T cells (Tregs), and M2 macrophages (Figure 4B, P = 0.041, P = 0.028, and P = 0.010, respectively). Next, we investigated the association between miR-200c expression and immune-related scores. Surprisingly, lymphocyte infiltration signature score, leukocyte fraction, and T cell repertoire (TCR) richness were all significantly lower in the high miR-200c expression group (Figure 4C, P < 0.001, P < 0.001, and P < 0.001, respectively). There was no significant association between miR-200c expression and B cell repertoire (BCR) richness, nor cytolytic activity (CYT) (Figure 4C, 4D). In order to explain the potential mechanisms of decreased immune response in high miR-200c GC, we performed GSEA on inflammatory cytokine pathways and responses. In agreement with the immune cell infiltrations, low miR-200c expression tumors enriched the number of immune-related gene sets (Figure 4E); IL2/STAT5 signaling (FDR = 0.07, NES = -1.75), Inflammatory response (FDR = 0.07, NES = -1.73), allograft rejection (FDR = 0.08, NES = -1.68), IL6/JAK/STAT signaling (FDR = 0.11, NES = -1.55), TNF-α signaling (FDR = 0.17, NES = -1.40), and interferon (IFN)-γ response (FDR = 0.24, NES = -1.28). These findings suggest that high miR-200c expression was associated with suppressed anti-cancer immunity, which may be due to cytokine signaling, IL2/STAT5, IL6/JAK/STAT, TNF-α, and IFN-γ.
Figure 4.

Association of miR-200c expression and immune cell infiltrations and immune response. Boxplots of infiltrations of (A) anti-cancerous immune cells; CD8+ T cells, CD4+ memory T cells, T helper 1 (Th1) cells, NK cells, dendritic cells (DC), and M1 macrophages, (B) pro-cancerous immune cells; T helper 2 (Th2) cells, regulatory T cells, and M2 macrophages, as well as B cells, (C) immune-related score; lymphocyte infiltration signaling, leukocyte fraction, TCR and BCR richness, all pre-calculated for individual patients in TCGA by Thorsson, et al., and (D) Cytolytic activity score (CYT), by high and low miR-200c groups. Top three quartiles were defined as high miR-200c expression group. p-values less than 0.05 are in bold. All two group comparisons are tested by Whitney U test. The error bars in each boxplot show the 95% confidence interval. The line in the box shows the median, and top and bottom show the 25th and 75th percentiles, respectively. (E) Gene set enrichment analysis with immune-related hallmark gene sets; IL2/STAT5, Inflammatory response, allograft rejection, IL6/JAK/STAT, TNF-β signaling, and interferon (IFN)-α and IFN-γ response, with FDR (orange plot) and NES (blue bar). FDR less than 0.25 is regarded as significant in GSEA.
Low miR-200c expression was associated with hypoxia and angiogenesis
Since hypoxia-induced angiogenesis is known to be associated with aggressive cancer phenotypes [24,25,40,41], we investigated the association between miR-200c expression and hypoxia and angiogenesis. Low miR-200c GC significantly enriched the Hallmark hypoxia gene set (Figure 5A, NES = -1.60, FDR = 0.09), and it was associated with a significantly high gene set variation assay (GSVA) hypoxia score (Figure 5B, P < 0.001). Further, low miR-200c GC significantly enriched the Hallmark angiogenesis gene set (Figure 5C, NES = -1.84, FDR = 0.043), and it was associated with a significantly high GSVA angiogenesis score (Figure 5D, P < 0.001). Low miR-200c GC was associated with high expressions of angiogenesis-related genes; VEGFA, VEGFB, VEGFC, VWF, PECAM1, CD31, ANGPT1, ANG-PT2, TIE1, and TIE2 (Figure 5E-G, all P < 0.001 except for VEGFA, ANGPT2 and TIE2). These results suggest that low miR-200c expression is associated with hypoxia and angiogenesis that worsen GC progression.
Figure 5.

Association of miR-200c expression and hypoxia and angiogenesis scores. (A) Enrichment plot of hypoxia in GSEA comparing high vs low expression of miR200c. FDR less than 0.25 is regarded as significant in GSEA. (B) Boxplot of hypoxia. (C) Enrichment plot of angiogenesis in GSEA. Boxplots of (D) angiogenesis, (E) VEGF-related genes; VEGFA, VEGFB, VEGFC, VEGFR1, VEGFR2, and VEG-FR3 (F) endothelial cell marker; VWF, PECAM1, and CD31, and (G) vascular stability-related genes; ANGPT1, ANG-PT2, TIE1, TIE2, TEK, VE-Cadherin, JAM2, and Claudin5 between high and low miR-200c groups. Top three quartiles were defined as high miR-200c expression group. *P-value of statistical significance. All two group comparisons are tested by Whitney U test. The error bars in each boxplot show the 95% confidence interval. The line in the box shows the median, and top and bottom show the 25th and 75th percentiles, respectively.
Low miR-200c expression was associated with epithelial-mesenchymal transition (EMT) and TGF-β signaling
Since EMT is known to be a crucial driver of GC progression and metastasis, we investigated its association with miR-200c expression. Low miR-200c expression significantly enriched the Hallmark EMT gene set (Figure 6A, NES = -2.11, FDR = 0.003), and it was associated with high GSVA EMT score (Figure 6B, P < 0.001). We also investigated the correlation between miR-200a, miR-200b, and miR-200c expression with EMT, all of which were found to be significantly negatively correlated; however, miR-200c specifically demonstrated the strongest correlation (Figure S2B, r = -0.466, r = -0.478, and r = -0.532, respectively). Further, we investigated the relationship between miR-200c and EMT-related genes. High miR-200c expression was associated with low levels of ZEB1, ZEB2, and VIM (Figure 6C, P < 0.001, P < 0.001, and P < 0.001, respectively) and high levels of CDH1 and OCLN (Figure 6C, P < 0.001 and P < 0.001, respectively). SNAI1, which are also EMT-related genes, was not significantly associated with high or low miR-200c (Figure 6C, P = 0.077).
Figure 6.

Association of miR-200c expression and EMT and TGF-β signaling. (A) Enrichment plot of EMT signaling in GSEA comparing high vs low expression of miR-200c. FDR less than 0.25 is regarded as significant in GSEA. Boxplots of (B) EMT 5thscore (C) EMT-related genes; ZEB1, ZEB2, CDH1, SNAI1, and VIM. (D) Enrichment plot of TGF-β signaling in GSEA. Boxplots of (E) TGF-β signaling score (F) TGF-β response, which is calculated by Thorsson et al. (G) TGF-β related genes; ALK1, ALK2, TGFB1, and TGFBR2, between high and low miR-200c groups. Top three quartiles were defined as high miR-200c expression group. p-values less than 0.05 are in bold. All two group comparisons are tested by Whitney U test. The error bars in each boxplot show the 95% confidence interval. The line in the box shows the median, and top and bottom show the 25th and 7 percentiles, respectively.
Lastly, the TGF-β pathway, which is well known to play critical roles in cancer progression, was investigated. Low miR-200c expression enriched the Hallmark TGF-β pathway (Figure 6D, NES = -1.60, FDR = 0.069), and it was associated with a high GSVA TGF-β score (Figure 6E, P < 0.001) as well as TGF-β response score, which was pre-calculated by Thorsson et al. [35] (Figure 6F, P < 0.001). Low miR-200c expression was also associated with high expression of TGF-β receptors; ALK1, ALK2, TGFBR1, and TGFBR2 (Figure 6G, all P < 0.01). These results suggest that low miR-200c expression is associated with EMT and TGF-β signaling, both of which are associated with cancer progression.
Discussion
In this study, we investigated the characteristics of GCs with high miR-200c expression using the TCGA cohort. High miR-200c expression was associated with decreased tumor invasion, better pathological grade and histological type, and improved patient survival in GC. Surprisingly, we found that high miR-200c expression GC was also associated with enhanced cell proliferation assessed by MKi67 expression, proliferation score and GSEA, as well as with a high mutation rate and HRD. Further, despite the association with high levels of neoantigens, high miR-200c expressed GC was associated with significantly lower infiltration of anti-cancer immune cells and decreased immune response. All of these are characteristics of aggressive cancers that appear to be the opposite of what we typically expect in tumors associated with improved survival. On the other hand, we found that low miR-200c expression GC was associated with hypoxia, angiogenesis, EMT, and TGF-β signaling, all of which are mechanisms that promote cancer progression and metastasis. These observations led us to speculate that low miR-200c expression may be associated with a tumor aggravating mechanism in GC, promoting worse survival in those tumors, and improved survival in high miR-200c tumors. Another possibility is that high miR-200c tumors are associated with enhanced cancer cell proliferation and high mutation rates, and therefore, may demonstrate an improved response to systemic therapy, resulting in better survival outcomes. Either way, further experimental studies to elucidate the mechanism are warranted.
The biology that leads to cancer progression consists of complex processes and involves the expression of multiple genes and gene product interaction. Therefore, traditional methods analyzing a single gene, such as quantitative-PCR, face challenges in capturing the complicated biological phenomena. Our group adapted a computational approach to evaluate sets of genes and pathways. Using GSEA, we analyzed the trend in expression of a priori gene sets in a TCGA GC cohort.
MiR-200c is a known tumor suppressive microRNA, and high miR-200c expression has been shown to be associated with better prognosis in various types of cancers [11,12]. High miR-200c expression in GC tumors was shown to be associated with better prognosis in a cohort of 102 patients [14], while Valladares-Ayerbes et al. reported that high miR-200c expression in blood was associated with a poorer OS [15]. A meta-analysis by Huang et al. showed that GC patients with high miR-200c expression had better OS and DFS; however, this study included the expression from both bulk tumors and blood samples that may or may not reflect the same mechanism [16]. Looking at other clinical characteristics, high miR-200c GC was shown to be associated with decreased tumor invasion [13] and less advanced stage [13,14]. In the current study using a TCGA cohort, GC with high miR-200c expression was associated with decreased tumor invasion, better histological type, and better overall survival, which suggest that they are decreased aggressive tumors.
Given the link between high miR-200c GC and improved survival, we expected that high miR-200c expression would be associated with less aggressive features. Indeed, miR-200c is a known tumor suppressive microRNA and suppresses cell proliferation in various types of cancer such as breast, thyroid, melanoma, glioma, and non-small cell lung cancer [2,3,5,42-44]. However, the studied effects of miR-200c on cell proliferation in GC remains inconsistent. Some in vitro studies demonstrated that miR-200c suppressed the proliferation of GC cells [45,46], while Wang et al. reported that downregulation of miR-200c-3p suppressed the proliferation of GC cells [47]. The current study demonstrated that high miR-200c expression in patients with GC was associated with enhanced cell proliferation, which further highlights the importance of analyzing patient tumors to understand cancer biology in the real world.
In order to further investigate other potential factors affecting the improved prognosis in high miR-200c GC, we analyzed hypoxia, angiogenesis, EMT and TGF-β signaling. Angiogenesis is the generation of new blood vessels from existing ones and is an essential step for cancer progression and metastasis [24,40]. It is known that hypoxia promotes angiogenesis mainly by activating transcription factors, including hypoxia-inducible factor (HIF)-1α. We found that hypoxia and angiogenesis were activated in low miR-200c expression GC. These results are consistent with previous studies that demonstrated downregulation of HIF-1α by miR-200c in lung cancer cells [6], and inhibition of HIF-1α and Vascular Endothelial Growth Factor (VEGF) expression by miR-200c overexpression in bladder cancer cells [7]. To our knowledge, our study is the first to report that low miR-200c expression is associated with angiogenesis in GC. EMT is a process by which epithelial cells lose their epithelial features, such as cell polarity and cell-cell adhesion, and gain migratory and invasive properties. It plays a key role in the invasion and metastasis of cancer cells [48]. It is known that miR-200c suppress ZEB1 and ZEB2 genes, which are repressors of the EMT marker, E-cadherin [8,9], and TGF-β pathway is enriched in miR-200 family knockout cells [49]. In our study, low miR-200c in GC patients was associated with EMT, as well as expression of ZEB1, ZEB2, VIM, CDH1 and OCLN, which demonstrate that the same mechanism is in place in the real world. We also found that low miR-200c GC was significantly associated with TGF-β signaling, and expression of TGF-β receptors. These results support the notion that TGF-β induces EMT by downregulating miR-200c in GC [50,51]. Given these results, we speculate that the association of high miR-200c and better clinical phenotypes including improved survival in GC patients may be due to the association of aggressive cancer biology (such as hypoxia-induced angiogenesis and TGF-β induced EMT) with low miR-200c expression, which outweighs the effects of miR-200c on tumor-promoting properties including cell proliferation.
There are several limitations in this present study. First, this is a retrospective study using a single cohort, TCGA, which lacks data on patient comorbidities and use of systemic therapies. Given the lack of access to another large GC cohort associated with microRNA expressions, our results are not validated. Second, since the analysis was performed using the gene expression data from surgically resected primary tumors, metastatic sites might have different biological characteristics. Lastly, this study does not include any experimental data demonstrating the direct effect of miR-200c on clinical outcomes or biological features in GC. However, the results of our study using a computational approach cannot be reproduced in vitro experiments since the complex interaction of phenomena cannot be reproduced. Hence, even if in vitro experiments do not support our study, it does not deny our findings. In addition, there is no current in vivo experimental method to recreate the system to support our conclusion.
Conclusions
In conclusion, GC with high miR-200c expression demonstrated better overall survival even though it was associated with high mutation rates, cell proliferation, and decreased immune cell infiltration and immune response. Given that low miR-200c expression GC was associated with hypoxia, angiogenesis, EMT and TGF-β signaling, we cannot help but speculate that the survival difference by miR-200c expression may be partly due to the association between low miR-200c expression and aggressive biologic characteristics.
Acknowledgements
K.T. is supported by US NIH grant R01CA251545, R01CA250412, R01CA160688, R37CA248018, as well as US DoD BCRP grant W81XWH-19-1-0674, and W81XWH-19-1-0111. Roswell Park Comprehensive Cancer Center is supported by NCI/NIH grant P30-CA016056.
Disclosure of conflict of interest
None.
Abbreviations
- AJCC
American Joint Committee on Cancer
- FDR
false discovery rate
- GSEA
gene set enrichment analysis
- GSVA
gene set variation analysis
- NES
normalized enrichment score
- TCGA
The Cancer Genome Atlas
Supporting Information
References
- 1.Sung H, Ferlay J, Siegel RL, Laversanne M, Soerjomataram I, Jemal A, Bray F. Global cancer statistics 2020: GLOBOCAN estimates of incidence and mortality worldwide for 36 cancers in 185 countries. CA Cancer J Clin. 2021;71:209–249. doi: 10.3322/caac.21660. [DOI] [PubMed] [Google Scholar]
- 2.Kawaguchi T, Yan L, Qi Q, Peng X, Gabriel EM, Young J, Liu S, Takabe K. Overexpression of suppressive microRNAs, miR-30a and miR-200c are associated with improved survival of breast cancer patients. Sci Rep. 2017;7:15945. doi: 10.1038/s41598-017-16112-y. [DOI] [PMC free article] [PubMed] [Google Scholar]
- 3.Zhang Y, Duan Y, Wu C, Peng W, Chen W, Wang L, Deng Z. MiR-200c regulates invasion, proliferation and EMT of anaplastic thyroid cancer cells by targeting parathyroid hormone like hormone. Growth Factors. 2022;40:175–185. doi: 10.1080/08977194.2022.2108809. [DOI] [PubMed] [Google Scholar]
- 4.Cong J, Gong J, Yang C, Xia Z, Zhang H. MiR-200c/FUT4 axis prevents the proliferation of colon cancer cells by downregulating the Wnt/β-catenin pathway. BMC Cancer. 2021;21:2. doi: 10.1186/s12885-020-07670-y. [DOI] [PMC free article] [PubMed] [Google Scholar] [Retracted]
- 5.Klicka K, Grzywa TM, Mielniczuk A, Klinke A, Włodarski PK. The role of miR-200 family in the regulation of hallmarks of cancer. Front Oncol. 2022;12:965231. doi: 10.3389/fonc.2022.965231. [DOI] [PMC free article] [PubMed] [Google Scholar]
- 6.Byun Y, Choi YC, Jeong Y, Lee G, Yoon S, Jeong Y, Yoon J, Baek K. MiR-200c downregulates HIF-1α and inhibits migration of lung cancer cells. Cell Mol Biol Lett. 2019;24:28. doi: 10.1186/s11658-019-0152-2. [DOI] [PMC free article] [PubMed] [Google Scholar]
- 7.Wu SQ, He HQ, Kang Y, Xu R, Zhang L, Zhao XK, Zhu X. MicroRNA-200c affects bladder cancer angiogenesis by regulating the Akt2/mTOR/HIF-1 axis. Transl Cancer Res. 2019;8:2713–2724. doi: 10.21037/tcr.2019.10.23. [DOI] [PMC free article] [PubMed] [Google Scholar]
- 8.Burk U, Schubert J, Wellner U, Schmalhofer O, Vincan E, Spaderna S, Brabletz T. A reciprocal repression between ZEB1 and members of the miR-200 family promotes EMT and invasion in cancer cells. EMBO Rep. 2008;9:582–589. doi: 10.1038/embor.2008.74. [DOI] [PMC free article] [PubMed] [Google Scholar]
- 9.Park SM, Gaur AB, Lengyel E, Peter ME. The miR-200 family determines the epithelial phenotype of cancer cells by targeting the E-cadherin repressors ZEB1 and ZEB2. Genes Dev. 2008;22:894–907. doi: 10.1101/gad.1640608. [DOI] [PMC free article] [PubMed] [Google Scholar]
- 10.Song F, Yang D, Liu B, Guo Y, Zheng H, Li L, Wang T, Yu J, Zhao Y, Niu R, Liang H, Winkler H, Zhang W, Hao X, Chen K. Integrated microRNA network analyses identify a poor-prognosis subtype of gastric cancer characterized by the miR-200 family. Clin Cancer Res. 2014;20:878–889. doi: 10.1158/1078-0432.CCR-13-1844. [DOI] [PubMed] [Google Scholar]
- 11.Liu XG, Zhu WY, Huang YY, Ma LN, Zhou SQ, Wang YK, Zeng F, Zhou JH, Zhang YK. High expression of serum miR-21 and tumor miR-200c associated with poor prognosis in patients with lung cancer. Med Oncol. 2012;29:618–626. doi: 10.1007/s12032-011-9923-y. [DOI] [PubMed] [Google Scholar]
- 12.Yu J, Ohuchida K, Mizumoto K, Sato N, Kayashima T, Fujita H, Nakata K, Tanaka M. MicroRNA, hsa-miR-200c, is an independent prognostic factor in pancreatic cancer and its upregulation inhibits pancreatic cancer invasion but increases cell proliferation. Mol Cancer. 2010;9:169. doi: 10.1186/1476-4598-9-169. [DOI] [PMC free article] [PubMed] [Google Scholar]
- 13.Tang H, Deng M, Tang Y, Xie X, Guo J, Kong Y, Ye F, Su Q, Xie X. miR-200b and miR-200c as prognostic factors and mediators of gastric cancer cell progression. Clin Cancer Res. 2013;19:5602–5612. doi: 10.1158/1078-0432.CCR-13-1326. [DOI] [PubMed] [Google Scholar]
- 14.Wang S, Guo J, Mo Z, Shi X, Qu C. Clinical significance and correlation of miR-200c and P-gp expression in gastric cancer and the effects on multidrug resistance. J Gastrointest Oncol. 2022;13:581–592. doi: 10.21037/jgo-22-167. [DOI] [PMC free article] [PubMed] [Google Scholar]
- 15.Valladares-Ayerbes M, Reboredo M, Medina-Villaamil V, Iglesias-Díaz P, Lorenzo-Patiño MJ, Haz M, Santamarina I, Blanco M, Fernández-Tajes J, Quindós M, Carral A, Figueroa A, Antón-Aparicio LM, Calvo L. Circulating miR-200c as a diagnostic and prognostic biomarker for gastric cancer. J Transl Med. 2012;10:186. doi: 10.1186/1479-5876-10-186. [DOI] [PMC free article] [PubMed] [Google Scholar]
- 16.Huang ZS, Guo XW, Zhang G, Liang LX, Nong B. The diagnostic and prognostic value of miR-200c in gastric cancer: a meta-analysis. Dis Markers. 2019;2019:8949618. doi: 10.1155/2019/8949618. [DOI] [PMC free article] [PubMed] [Google Scholar]
- 17.Kim SY, Kawaguchi T, Yan L, Young J, Qi Q, Takabe K. Clinical relevance of microRNA expressions in breast cancer validated using the cancer genome atlas (TCGA) Ann Surg Oncol. 2017;24:2943–2949. doi: 10.1245/s10434-017-5984-2. [DOI] [PMC free article] [PubMed] [Google Scholar]
- 18.Tokumaru Y, Oshi M, Huyser MR, Yan L, Fukada M, Matsuhashi N, Futamura M, Akao Y, Yoshida K, Takabe K. Low expression of miR-29a is associated with aggressive biology and worse survival in gastric cancer. Sci Rep. 2021;11:14134. doi: 10.1038/s41598-021-93681-z. [DOI] [PMC free article] [PubMed] [Google Scholar]
- 19.Tokumaru Y, Oshi M, Patel A, Katsuta E, Yan L, Angarita FA, Dasgupta S, Nagahashi M, Matsuhashi N, Futamura M, Yoshida K, Takabe K. Low expression of miR-195 is associated with cell proliferation, glycolysis and poor survival in estrogen receptor (ER)-positive but not in triple negative breast cancer. Am J Cancer Res. 2021;11:3320–3334. [PMC free article] [PubMed] [Google Scholar]
- 20.Oshi M, Tokumaru Y, Benesch MG, Sugito N, Wu R, Yan L, Yamada A, Chishima T, Ishikawa T, Endo I, Takabe K. High miR-99b expression is associated with cell proliferation and worse patient outcomes in breast cancer. Am J Cancer Res. 2022;12:4840–4852. [PMC free article] [PubMed] [Google Scholar]
- 21.Satyananda V, Oshi M, Tokumaru Y, Maiti A, Hait N, Matsuyama R, Endo I, Takabe K. Sphingosine 1-phosphate (S1P) produced by sphingosine kinase 1 (SphK1) and exported via ABCC1 is related to hepatocellular carcinoma (HCC) progression. Am J Cancer Res. 2021;11:4394–4407. [PMC free article] [PubMed] [Google Scholar]
- 22.Oshi M, Gandhi S, Huyser MR, Tokumaru Y, Yan L, Yamada A, Matsuyama R, Endo I, Takabe K. MELK expression in breast cancer is associated with infiltration of immune cell and pathological compete response (pCR) after neoadjuvant chemotherapy. Am J Cancer Res. 2021;11:4421–4437. [PMC free article] [PubMed] [Google Scholar]
- 23.Huang JL, Oshi M, Endo I, Takabe K. Clinical relevance of stem cell surface markers CD133, CD24, and CD44 in colorectal cancer. Am J Cancer Res. 2021;11:5141–5154. [PMC free article] [PubMed] [Google Scholar]
- 24.Oshi M, Satyananda V, Angarita FA, Kim TH, Tokumaru Y, Yan L, Matsuyama R, Endo I, Nagahashi M, Takabe K. Angiogenesis is associated with an attenuated tumor microenvironment, aggressive biology, and worse survival in gastric cancer patients. Am J Cancer Res. 2021;11:1659–1671. [PMC free article] [PubMed] [Google Scholar]
- 25.Oshi M, Sarkar J, Tokumaru Y, Yan L, Kosaka T, Akiyama H, Nagahashi M, Kunisaki C, Endo I, Takabe K. Higher intra-tumoral expression of pro-coagulation genes is a predictor of angiogenesis, epithelial mesenchymal transition and worse patient survival in gastric cancer. Am J Cancer Res. 2022;12:4001–4014. [PMC free article] [PubMed] [Google Scholar]
- 26.Subramanian A, Tamayo P, Mootha VK, Mukherjee S, Ebert BL, Gillette MA, Paulovich A, Pomeroy SL, Golub TR, Lander ES, Mesirov JP. Gene set enrichment analysis: a knowledge-based approach for interpreting genome-wide expression profiles. Proc Natl Acad Sci U S A. 2005;102:15545–15550. doi: 10.1073/pnas.0506580102. [DOI] [PMC free article] [PubMed] [Google Scholar]
- 27.Cherkassky L, Oshi M, Abdelfatah E, Wu R, Takabe Y, Yan L, Endo I, Takabe K. An immune-inflamed tumor microenvironment as defined by CD8 score is associated with favorable oncologic outcomes in hepatocellular carcinoma independent of measures of tumor mutational burden. Am J Cancer Res. 2022;12:3099–3110. [PMC free article] [PubMed] [Google Scholar]
- 28.Wu R, Yu I, Tokumaru Y, Asaoka M, Oshi M, Yan L, Okuda S, Ishikawa T, Takabe K. Elevated bile acid metabolism and microbiome are associated with suppressed cell proliferation and better survival in breast cancer. Am J Cancer Res. 2022;12:5271–5285. [PMC free article] [PubMed] [Google Scholar]
- 29.Oshi M, Roy AM, Gandhi S, Tokumaru Y, Yan L, Yamada A, Endo I, Takabe K. The clinical relevance of unfolded protein response signaling in breast cancer. Am J Cancer Res. 2022;12:2627–2640. [PMC free article] [PubMed] [Google Scholar]
- 30.Aran D, Hu Z, Butte AJ. xCell: digitally portraying the tissue cellular heterogeneity landscape. Genome Biol. 2017;18:220. doi: 10.1186/s13059-017-1349-1. [DOI] [PMC free article] [PubMed] [Google Scholar]
- 31.Asaoka M, Patnaik SK, Ishikawa T, Takabe K. Different members of the APOBEC3 family of DNA mutators have opposing associations with the landscape of breast cancer. Am J Cancer Res. 2021;11:5111–5125. [PMC free article] [PubMed] [Google Scholar]
- 32.Katsuta E, Huyser M, Yan L, Takabe K. A prognostic score based on long-term survivor unique transcriptomic signatures predicts patient survival in pancreatic ductal adenocarcinoma. Am J Cancer Res. 2021;11:4294–4307. [PMC free article] [PubMed] [Google Scholar]
- 33.Takahashi H, Kawaguchi T, Yan L, Peng X, Qi Q, Morris LGT, Chan TA, Tsung A, Otsuji E, Takabe K. Immune cytolytic activity for comprehensive understanding of immune landscape in hepatocellular carcinoma. Cancers (Basel) 2020;12:1221. doi: 10.3390/cancers12051221. [DOI] [PMC free article] [PubMed] [Google Scholar]
- 34.Narayanan S, Kawaguchi T, Yan L, Peng X, Qi Q, Takabe K. Cytolytic activity score to assess anticancer immunity in colorectal cancer. Ann Surg Oncol. 2018;25:2323–2331. doi: 10.1245/s10434-018-6506-6. [DOI] [PMC free article] [PubMed] [Google Scholar]
- 35.Thorsson V, Gibbs DL, Brown SD, Wolf D, Bortone DS, Ou Yang TH, Porta-Pardo E, Gao GF, Plaisier CL, Eddy JA, Ziv E, Culhane AC, Paull EO, Sivakumar IKA, Gentles AJ, Malhotra R, Farshidfar F, Colaprico A, Parker JS, Mose LE, Vo NS, Liu J, Liu Y, Rader J, Dhankani V, Reynolds SM, Bowlby R, Califano A, Cherniack AD, Anastassiou D, Bedognetti D, Mokrab Y, Newman AM, Rao A, Chen K, Krasnitz A, Hu H, Malta TM, Noushmehr H, Pedamallu CS, Bullman S, Ojesina AI, Lamb A, Zhou W, Shen H, Choueiri TK, Weinstein JN, Guinney J, Saltz J, Holt RA, Rabkin CS Cancer Genome Atlas Research Network. Lazar AJ, Serody JS, Demicco EG, Disis ML, Vincent BG, Shmulevich I. The immune landscape of cancer. Immunity. 2018;48:812–830. e814. doi: 10.1016/j.immuni.2018.03.023. [DOI] [PMC free article] [PubMed] [Google Scholar]
- 36.Schulze A, Oshi M, Endo I, Takabe K. MYC targets scores are associated with cancer aggressiveness and poor survival in ER-positive primary and metastatic breast cancer. Int J Mol Sci. 2020;21:8127. doi: 10.3390/ijms21218127. [DOI] [PMC free article] [PubMed] [Google Scholar]
- 37.Oshi M, Takahashi H, Tokumaru Y, Yan L, Rashid OM, Nagahashi M, Matsuyama R, Endo I, Takabe K. The E2F pathway score as a predictive biomarker of response to neoadjuvant therapy in ER+/HER2- breast cancer. Cells. 2020;9:1643. doi: 10.3390/cells9071643. [DOI] [PMC free article] [PubMed] [Google Scholar]
- 38.Oshi M, Takahashi H, Tokumaru Y, Yan L, Rashid OM, Matsuyama R, Endo I, Takabe K. G2M cell cycle pathway score as a prognostic biomarker of metastasis in estrogen receptor (ER)-positive breast cancer. Int J Mol Sci. 2020;21:2921. doi: 10.3390/ijms21082921. [DOI] [PMC free article] [PubMed] [Google Scholar]
- 39.Oshi M, Patel A, Le L, Tokumaru Y, Yan L, Matsuyama R, Endo I, Takabe K. G2M checkpoint pathway alone is associated with drug response and survival among cell proliferation-related pathways in pancreatic cancer. Am J Cancer Res. 2021;11:3070–3084. [PMC free article] [PubMed] [Google Scholar]
- 40.Ramanathan R, Olex AL, Dozmorov M, Bear HD, Fernandez LJ, Takabe K. Angiopoietin pathway gene expression associated with poor breast cancer survival. Breast Cancer Res Treat. 2017;162:191–198. doi: 10.1007/s10549-017-4102-2. [DOI] [PMC free article] [PubMed] [Google Scholar]
- 41.Oshi M, Newman S, Tokumaru Y, Yan L, Matsuyama R, Endo I, Nagahashi M, Takabe K. Intra-tumoral angiogenesis is associated with inflammation, immune reaction and metastatic recurrence in breast cancer. Int J Mol Sci. 2020;21:6708. doi: 10.3390/ijms21186708. [DOI] [PMC free article] [PubMed] [Google Scholar]
- 42.Lei W, Kang W, Nan Y, Lei Z, Zhongdong L, Demin L, Lei S, Hairong H. The downregulation of miR-200c promotes lactate dehydrogenase a expression and non-small cell lung cancer progression. Oncol Res. 2018;26:1015–1022. doi: 10.3727/096504018X15151486241153. [DOI] [PMC free article] [PubMed] [Google Scholar]
- 43.Qin Y, Chen W, Liu B, Zhou L, Deng L, Niu W, Bao D, Cheng C, Li D, Liu S, Niu C. MiR-200c inhibits the tumor progression of glioma via targeting moesin. Theranostics. 2017;7:1663–1673. doi: 10.7150/thno.17886. [DOI] [PMC free article] [PubMed] [Google Scholar]
- 44.Liu S, Tetzlaff MT, Cui R, Xu X. miR-200c inhibits melanoma progression and drug resistance through down-regulation of BMI-1. Am J Pathol. 2012;181:1823–1835. doi: 10.1016/j.ajpath.2012.07.009. [DOI] [PMC free article] [PubMed] [Google Scholar]
- 45.Zhang H, Sun Z, Li Y, Fan D, Jiang H. MicroRNA-200c binding to FN1 suppresses the proliferation, migration and invasion of gastric cancer cells. Biomed Pharmacother. 2017;88:285–292. doi: 10.1016/j.biopha.2017.01.023. [DOI] [PubMed] [Google Scholar]
- 46.Wei W, Shi L, Chen W, Hu L, Chen D, Shi X, Xiang H, Guo C, Wu Z. miR-200c regulates the proliferation, apoptosis and invasion of gastric carcinoma cells through the downregulation of EDNRA expression. Int J Mol Med. 2018;41:1619–1626. doi: 10.3892/ijmm.2017.3317. [DOI] [PubMed] [Google Scholar]
- 47.Wang Y, Lu K, Li W, Wang Z, Ding J, Zhu Z, Li Z. MiR-200c-3p aggravates gastric cell carcinoma via KLF6. Genes Genomics. 2021;43:1307–1316. doi: 10.1007/s13258-021-01160-6. [DOI] [PMC free article] [PubMed] [Google Scholar]
- 48.Zhang Y, Weinberg RA. Epithelial-to-mesenchymal transition in cancer: complexity and opportunities. Front Med. 2018;12:361–373. doi: 10.1007/s11684-018-0656-6. [DOI] [PMC free article] [PubMed] [Google Scholar]
- 49.Yu L, Cao C, Li X, Zhang M, Gu Q, Gao H, Balic JJ, Xu D, Zhang L, Ying L, Xu D, Yang Y, Wu D, He B, Jenkins BJ, Liu Y, Li J. Complete loss of miR-200 family induces EMT associated cellular senescence in gastric cancer. Oncogene. 2022;41:26–36. doi: 10.1038/s41388-021-02067-y. [DOI] [PMC free article] [PubMed] [Google Scholar]
- 50.Saito T, Kurashige J, Nambara S, Komatsu H, Hirata H, Ueda M, Sakimura S, Uchi R, Takano Y, Shinden Y, Iguchi T, Eguchi H, Ehata S, Murakami K, Sugimachi K, Mimori K. A long non-coding RNA activated by transforming growth factor-β is an independent prognostic marker of gastric cancer. Ann Surg Oncol. 2015;22(Suppl 3):S915–922. doi: 10.1245/s10434-015-4554-8. [DOI] [PubMed] [Google Scholar]
- 51.Zhou X, Men X, Zhao R, Han J, Fan Z, Wang Y, Lv Y, Zuo J, Zhao L, Sang M, Liu XD, Shan B. miR-200c inhibits TGF-β-induced-EMT to restore trastuzumab sensitivity by targeting ZEB1 and ZEB2 in gastric cancer. Cancer Gene Ther. 2018;25:68–76. doi: 10.1038/s41417-017-0005-y. [DOI] [PubMed] [Google Scholar]
Associated Data
This section collects any data citations, data availability statements, or supplementary materials included in this article.