Abstract
Lung adenocarcinoma (LUAD) is the most common type of lung cancer. LRP1B was initially identified as a cancer suppressor in several cancers. However, the potential biological phenotypes and molecular mechanisms of LRP1B in LUAD have not been fully investigated. In our study, we showed that the expression of LRP1B in LUAD tissues was lower than that in normal tissues. Knockdown of LRP1B markedly enhanced malignancy of LUAD cells. Genomic analysis indicated that the population expressing low-levels of LRP1B had higher genomic instability, which accounted for a larger proportion of aneuploidy and inflammation subtyping. Enrichment analysis of bulk and cell-line transcriptomic data both showed that the low expression of LRP1B could induce the activation of IL-6-JAK-STAT3, chemokine, cytokine, and other inflammation signaling pathways. Moreover, our findings revealed that knockdown LRP1B enhanced the secretion of IL-6 and IL-8, as confirmed by ELISA assays. Further validation using PCR and WB confirmed that downregulation of LRP1B mRNA significantly upregulated the activity of the IL-6-JAK-STAT3 pathway. Collectively, this study highlights LRP1B as a tumor suppressor gene and reveals that LRP1B knockdown promotes malignant progression in LUAD by inducing inflammation through the IL-6-JAK-STAT3 pathway.
Keywords: LRP1B, inflammation, IL-6, JAK-STAT3, LUAD
Introduction
Lung cancer currently ranks as the leading cause of death among cancer patients worldwide. Among the various types, lung adenocarcinoma (LUAD) represents the most common form [1,2]. Unfortunately, a significant number of LUAD cases are already diagnosed at intermediate to advanced stages, posing a serious threat to human life and health.
Low-density lipoprotein receptor-related protein 1B (LRP1B) belongs to the LDL receptor family and is one of the most frequently altered genes in human cancers. As one of the largest transmembrane receptors, it consists of 4599 amino acids encoded by an mRNA of 13800 base pairs [3]. Inactivation of LRP1B has been observed in hepatobiliary tumors [4], urothelial cancer [5], esophageal cancer [6], and others. Notably, it has been found to be inactivated in more than 40% of non-small cell lung cancer cell lines [3]. Several previous investigations have identified LRP1B as a critical tumor suppressor gene. Downregulation of LRP1B has been shown to promote cancer cell growth and migration in colon cancer [7], as well as regulate the progression of high-grade urothelial carcinoma [5]. In gastric cancer, inactivation of LRP1B through DNA methylation has been demonstrated to promote tumorigenesis [8]. However, the precise impact of LRP1B on the biological behavior of lung cancer and its potential molecular mechanism have not been fully elucidated. Therefore, in this study, we aimed to investigate the function of LRP1B in LUAD and explore its potential mechanisms through in silico analysis and molecular experiments.
The IL-6-JAK-STAT pathway is composed of interleukin 6 (IL-6), Janus kinase (JAK), and signal transducer and activator of transcription (STAT) [9]. Several key inflammatory cytokines, particularly IL-6 and IL-8, exert a significant impact on cancer progression. IL-6, in particular, is a prototypical tumor-promoting cytokine that has long been recognized as a crucial link between inflammation and cancer, offering potential as a therapeutic target [10,11]. It binds to its ligand-binding receptor IL-6R and transmits intracellular signals through the JAK-STAT pathway [12]. The JAK-STAT pathway, acting as a central communication node in numerous vital cellular processes, induces the expression of various key mediators involved in cancer and inflammation [13]. It plays a pivotal role in the occurrence and development of various malignant tumors, including lung cancer, influencing tumor cell proliferation, differentiation, development, and metastasis [13,14]. Additionally, IL-17 has been reported to stimulate the activation of IL-6 and STAT3 in cancer, inflammatory cells, and autoimmune diseases [15,16].
In our study, we observed that the expression of LRP1B was higher in normal tissues compared with tumor tissues. Analysis of LUAD data from the TCGA database revealed that samples with low LRP1B expression exhibited elevated genome instability and tumorigenesis signaling. Knockdown of LRP1B significantly enhanced the malignant phenotype of LUAD cell lines and indicated worse outcomes. Furthermore, we found that reducing the mRNA expression of LRP1B significantly elevated the activity of inflammation signaling pathways such as IL-6-JAK-STAT3 and IL17, as revealed by bulk and cell-line RNA sequencing data, and were validated at the mRNA and protein levels.
Materials and methods
Gene expression analysis
We utilized two interactive network resources, the GEPIA2 portal (http://gepia2.cancer-pku.cn) and the Ualcan portal (http://ualcan.path.uab.edu), to analyze cancer data Omics. For this study, we selected the available dataset of LUAD and explored the expression level of the total protein between tumor and normal tissues by inputting ‘LRP1B’.
Immunohistochemistry (IHC)
IHC staining was performed using the IHC Kit (ZLI-9019, ORIGENE, Beijing, China). Briefly, tissue microarrays were incubated with primary antibody (1:200, TA367775, ORIGENE, China), washed, incubated with secondary antibodies, and followed with staining with DAB and hematoxylin reagent. The expression of LRP1B in 65 cases of LUAD tissues and matched normal tissues was scored using IHC staining. The scoring method was performed as previously described [17]: the staining intensity was categorized into four grades: no staining (score 0), pale yellow (score 1), pale brown (score 2), and dark brown (score 3). Area of positive staining was classified into five categories: < 5% (score 0), 6-25% (score 1), 26-50% (score 2), 51-75% (score 3), and 76-100% (score 4). The final LRP1B expression score was determined by multiplying the intensity and area scores. All cases were independently scored by two pathologists from Shandong Provincial Hospital who were blind to the clinical data of the patients. In cases where there were inconsistencies between the two pathologists, the mean score was used.
Paraffin-embedded specimens from 65 patients diagnosed with LUAD from 2014 to 2016 were randomly selected and reviewed from the archives of the Department of Pathology, Shandong Provincial Hospital. This study was approved by the Institutional Ethics Committee of Shandong Provincial Hospital (NSFC: No. 2021-529). Each patient in this study provided written informed consent for the collection of samples and the analysis of data.
Protein-protein interaction networks (PPI)
The GeneMANIA portal (http://genemania.org/) is an interactive web resource for analyzing PPI. In this study, we used this portal to obtain the relationship between different genes (sets). We selected the available dataset of LUAD for our analysis.
Genomic and clinical data
Gene expression data (TPM), clinical information, and somatic mutation data (MuTect2) of 499 LUAD samples in The Cancer Genome Atlas (TCGA) were downloaded from the UCSC Xena database (https://xenabrowser.net/). Mutation signatures and mutation load were extracted from somatic mutation data using the “maftools” package [18]. Aneuploid scores and HR defects of TCGA samples were determined and curated based on previous studies [19].
Inference of infiltrating cells in the tumor microenvironment (TME) of LUAD
Using bulk RNA-seq datasets, we employed the xCell algorithm [20] to estimate immune and stromal cell subpopulations in LUAD tumors. Gene expression profiles were prepared using standard annotation files, and the data were submitted to the xCell portal (https://xcell.ucsf.edu). The xCell signature was used in the algorithm.
Gene set enrichment analysis (GSEA) and network analysis
LUAD samples from TCGA were divided into high and low subgroups based on the median expression of LRP1B. The R package ‘limma’ [21] was employed to evaluate differentially expressed genes in the two LRP1B expression subgroups of TCGA and A549 cell lines with or without LRP1B knockdown. Specifically, gene expression data were normalized and then input to lmFit and eBayes functions to calculate statistics using the R limma package. The obtained differential expression statistics were used as input to perform GSEA [22] on the HallMarker and KEGG gene sets (downloaded from the MSigDB database v7.1). The fast gene set enrichment analysis algorithm implemented in the Bioconductor R package fgsea was used.
Cell culture and cell transfection
A549 and BEAS-2B cells were obtained from the ATCC and maintained in RPMI 1640 culture medium (Gibco, Grand Island, USA) supplemented with 10% fetal bovine serum (FBS) (PAN) and penicillin-streptomycin (10 U/mL, Thermo Fisher) at 37°C in a 5% CO2 atmosphere. Lentiviruses of shNC (Negative control), shLRP1B#1, shLRP1B#2 (LRP1B knockdown) for humans were purchased from Genomeditech. The shRNA for the knockdown of LRP1B-#1 is “cgGCATTTACAGTCCCTGATA” and the shRNA for the knockdown of LRP1B-#2 is “gcTGTAAAGATCAATGAAT”. A549 cells were infected with 1640 medium supplemented with 10% FBS, penicillin-streptomycin (10 U/mL, Thermo Fisher), lentivirus, and polybrene (0.1%) for 48 h, and then selected with puromycin (1.6 μg/ml, MedChemExpress) for 7 days.
RT-qPCR
Total RNA was extracted from cells using TRIzol reagent (Invitrogen, China). Following the manufacturer’s instructions (Vazyme, China), total RNA was reverse transcribed into cDNA. Amplification was performed according to the manufacturer’s instructions of the RT-qPCR kit (Vazyme, China). GAPDH was used as a reference for mRNA. Gene and primer sequences can be seen in Supplementary Table 3. The relative expression levels of mRNA were calculated using the 2-ΔΔCt method.
Colony formation assay
500 cells per well were plated onto 6-well plates. The plates were placed in an incubator for 15 days, with the culture media changed every 4 days. After discarding the media, the cells were rinsed with PBS, fixed with paraformaldehyde for 30 minutes, and stained with crystal violet reagent for 30 minutes. The colonies were counted after washing off the remaining dye solution. Only colonies with a cell count exceeding 50 cells per colony were counted.
CCK-8 assay
Cells were plated in 96-well plates at a density of 4 × 10E4 cells/well in 100 μl of complete media. The Cell Counting Kit-8 (DOJINDO, Japan) was used to determine the absorbance of the medium in each well at 0 h, 24 h, 48 h, 72 h and 96 h.
Transwell assay
For migration assays, cell suspensions (4 × 10E5/mL) were seeded onto the top chamber of an 8-mm hole without Matrigel, whereas for invasion assays, cell suspensions (6 × 10E5/mL) were seeded onto the top chamber with Matrigel. In both conditions, 200 μl of serum-free medium was added to the top chamber, and 600 μl of 1640 culture medium supplemented with 10% FBS was added to the lower compartment. After 24 hours of incubation, the upper chambers were fixed in 4% paraformaldehyde for 20 minutes, stained with 0.1% crystal violet for 30 minutes, and then counted using random fields under a light microscope.
Cell wound scratch assay
Cells were inoculated in 6-well plates, and three wounds were created in each well using sterile 100 µl pipette tips. The cells were cultivated in the same culture system (1640 + 1% FBS) for 48 hours. The width of the scratches was measured and recorded at 0 h and 48 h in three randomly chosen microscopic fields. The wound closure ratio was calculated as the ratio of the migration distance to the starting wound distance.
Apoptosis assays
The Apoptosis Detection Kit I (559763, BD Biosciences, USA) was used to measure the apoptosis rates. Cells (1 × 10E5) were collected, washed with PBS, and resuspended in 100 μl of binding buffer. The buffer was then mixed with 5 μl of PE and 5 μl of 7AAD and incubated for 15 minutes at room temperature and in the dark. Within an hour, cells were analyzed using flow cytometry (Beckman Coulter).
Cell cycle analysis
Cell cycle was evaluated using the Cell Cycle Detection Kit (KGA512, KeyGEN bioTECH, China). Cells (1 × 10E6) were collected, washed with PBS, and fixed in ethanol. PI (450 μl) and RNase A solution (50 μl) were added, and cells were incubated in the dark for 30 minutes at room temperature. The DNA contents were detected by flow cytometry, and the cell cycle was analyzed using FlowJo software.
Enzyme-linked immunosorbent assay (ELISA)
The concentrations of cytokines in the cell culture system supernatant were estimated for each cell using ELISA kits (KE00139 and KE00006, Proteintech, USA) according to the manufacturers’ protocols. The absorbance of the ELISA plates was measured at a wavelength of 450 nm. A standard curve was created, and the concentration was calculated.
Western blotting and antibody
The cells were lysed using RIPA buffer, and the total protein was extracted and separated by polyacrylamide gel electrophoresis (SDS-PAGE). The separated proteins were transferred to a PVDF membrane. Membranes were blocked in 5% skimmed milk powder. The membrane was then incubated with primary antibodies overnight at 4°C. After rinsing with TBST, the appropriate amount of diluted secondary antibody (1:5000, SA00001-2, Proteintech, USA) was added and incubated for 1 hour at room temperature. After rinsing with TBST again, chemiluminescence detection and photography were performed using an appropriate instrument. The following primary antibodies were used: IL-6 (1:1000, 21865-1-AP, Proteintech, Chicago, USA), JAK1 (1:1000, #3344S, Cell Signaling Technology, USA), JAK2 (1:1000, #3230S, Cell Signaling Technology, USA), STAT3 (1:1000, #9239, Cell Signaling Technology, USA), P-STAT3 (1:1000, #94994, Cell Signaling Technology, USA).
RNA sequencing (RNA-seq)
Total RNA from different groups of cells were freshly extracted using the NEBNEXT Ultra RNA Library Prep Kit (NEBNEXT® Ultra™ RNA Library Prep Kit For Illumina®) following the manufacturer’s instructions. The extracted library was quantified using the Qubit 2.0 Fluorometer and the insert size was determined using the Agilent 2100 Bioanalyzer. After passing the quality check, the libraries were pooled according to the desired data concentration and sequenced using Illumina’s sequencing technology based on the principle of Sequencing by Synthesis.
Statistical analysis
Statistical analyses of the multi-omics database were performed using R-4.0.1. For quantitative data, two-tailed Student’s t-tests were used to determine statistical significance for normally distributed variables, while the Wilcoxon rank-sum test was employed for analyzing non-normally distributed variables. Contingency tables were analyzed using the χ2 test and Fisher’s exact test, depending on the specific grouping condition. Correlations between two quantitative variables were assessed using Spearman’s correlation coefficient. Statistical analyses for the experiments were conducted using Prism 8 (GraphPad), and all data were expressed as mean ± standard deviation. Statistical significance was determined using Student’s t-test or Wilcoxon’s rank-sum test (P < 0.05 was considered statistically significant).
Results
Relationship between LRP1B expression and clinical features, immune landscape in LUAD
Using the GEPIA2 portal and the Ualcan portal, we observed that the expression of LRP1B was significantly lower in LUAD tumor tissues compared to normal tissues (both P < 0.05, Figure 1A, Supplementary Figure 1A). Immunohistochemistry (IHC) staining of 65 LUAD tissue samples and matched normal tissues confirmed this, showing significantly reduced LRP1B expression in LUAD tissues (P < 0.001, Figure 1B). Protein-protein interaction (PPI) network analysis revealed that LRP1B is closely associated with 20 proteins, including APBB3, MMP15, APBB2, APBB1, MMP14, APH1A, PSENEN, et al. (Supplementary Figure 1B).
Figure 1.
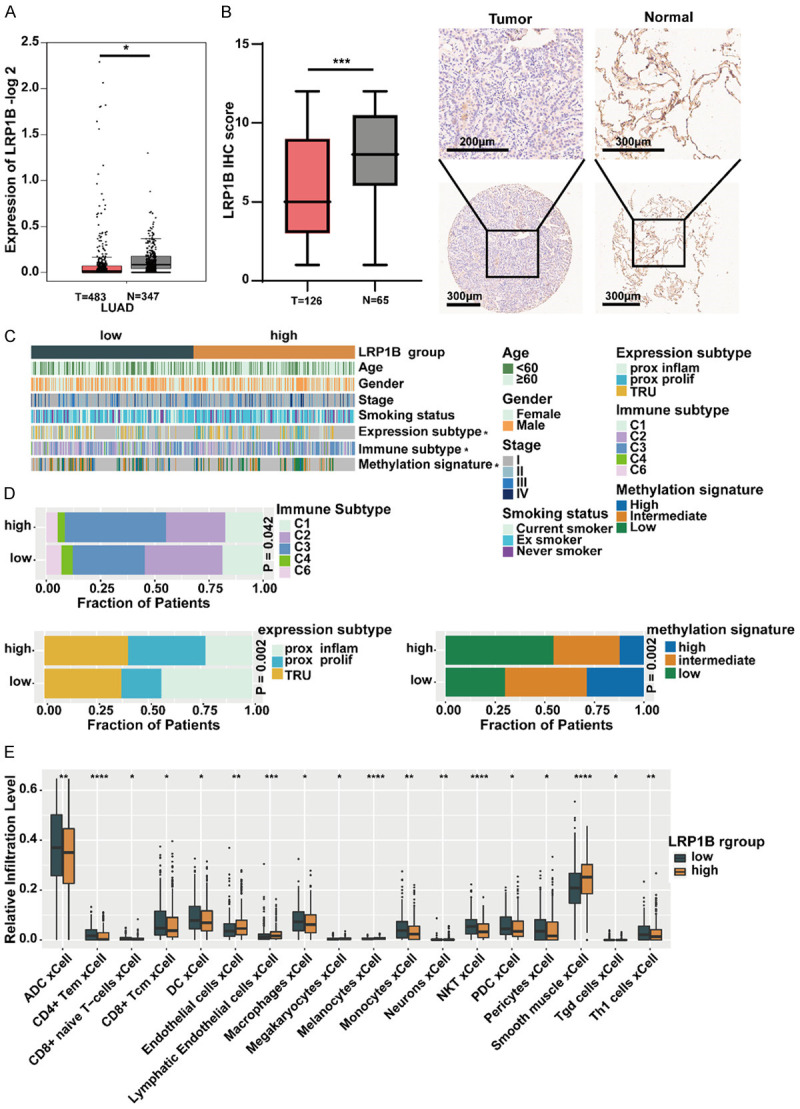
Relationship between LRP1B expression and clinical features, immune landscape in LUAD. A. Analysis of LRP1B gene expression in normal and tumor samples using GEPIA2 (*P < 0.05). B. Immunohistochemical (IHC) staining of LRP1B in LUAD tissues and paired normal tissues (***P < 0.001). C. The relationship between the expression of LRP1B and clinical features, immune subtypes, expression subtypes, and methylation subtypes (*P < 0.05). D. Proportions of immune subtypes, expression subtypes, and methylation subtypes in the two groups. E. Comparison of the relative infiltration level of immune and stromal cells in the two LRP1B subgroups of the TCGA cohort. Sporadic dots within each group represent immune cell expression levels. The thick line represents the median value. The bottom and top of the boxes represent the 25th and 75th percentiles (interquartile range), respectively. The whiskers cover a range of 1.5 times the interquartile range. The Kruskal-Wallis H test was used to assess statistical differences between the three gene clusters (*P < 0.05, **P < 0.01, ***P < 0.001).
TCGA divided LUAD tumors into different molecular subtypes based on transcriptomics, immune phenotypes, and methylation status [23-25]. We further explored the association between LRP1B expression and clinical characteristics, immune landscape, expression subtypes, and methylation subtypes in the LUAD cohort (Figure 1C). Interestingly, the LRP1B high-expression group had a higher proportion of C3 subtype. We also found that the prox-inflam type, Immune-C2, and high-methylation signature were more prevalent in the LRP1B low-expression group compared to the high-expression group (all P < 0.05, Figure 1D). Using the xCell algorithm, we digitally characterized the abundance of tumor-infiltrating lymphocytes in the LRP1B low-expression and high-expression groups. We observed that various immune cells (ADC cells, CD4+ T cells, CD8+ T cells, CD8+ naive T cells, DC cells, NK T cells, Th1 cells, et al.) were more enriched in the LRP1B low-expression group compared to the high-expression group (all P < 0.05, Figure 1E). These findings suggest that low expression of LRP1B may be associated with tumor progression in LUAD.
Comprehensive genomic profiles of LUAD patients
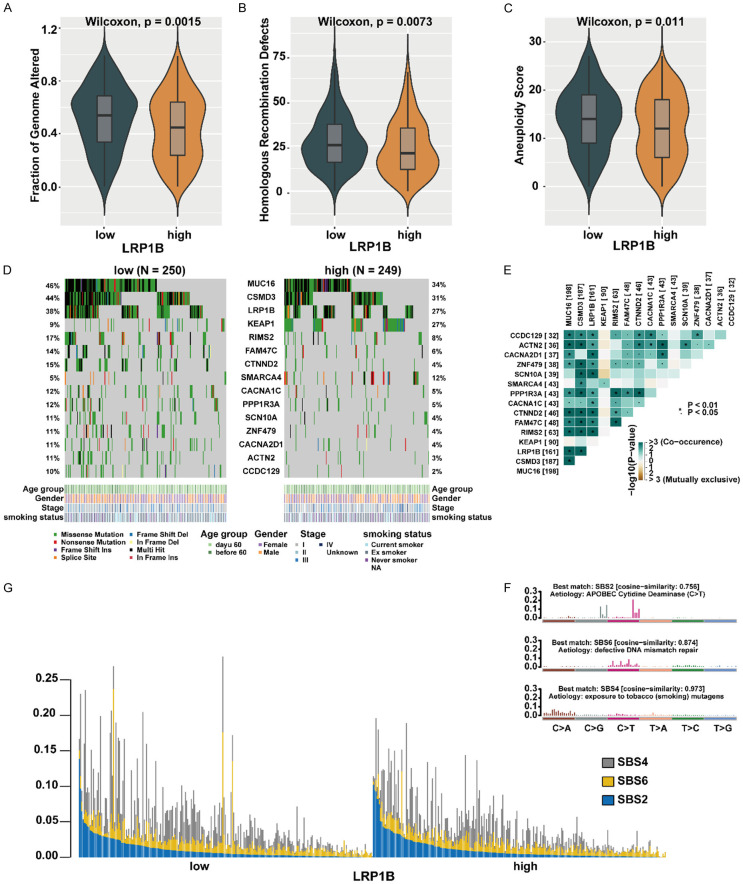
We further investigated the genomic landscape alterations in LUAD based on different LRP1B expression subgroups. The fraction of genome altered (FGA), which represents the percentage of genome affected by copy number gains or losses, was higher in the LRP1B low-expression group compared to the high-expression group (P = 0.0015, Figure 2A). Homologous recombination defect (HRD), a common driver of tumorigenesis resulting from impaired double-strand break repair [26], was more frequent in the LRP1B low-expression group than in the high-expression group (P = 0.0073, Figure 2B). Additionally, the LRP1B low-expression group exhibited significantly higher aneuploidy scores compared to the high-expression group (P = 0.011, Figure 2C). Furthermore, the non-silent mutation load in the LRP1B low-expression group was higher than that in the high-expression group (P = 0.056, Supplementary Figure 2A). These findings demonstrate a relationship between LRP1B expression and genomic features in the LUAD cohort. We identified 15 frequently mutated genes that showed significant differences between the two LRP1B expression groups using the somatic interaction function (Figure 2D). Among these genes, MUC16, CSMD3, LRP1B, RIMS2, FAM47C, CTNND2, CACNA1C, PPP1R3A, SCN10A, ZNF479, CACNA2D1, ACTN2, CCDC129 exhibited higher mutational frequency in the LRP1B low-expression subgroup, while KEAP1 and SMARCA4 exhibited higher mutational frequency in the high-expression subgroup (Fisher exact test, P < 0.05, Figure 2D). We also performed pairwise Fisher’s exact tests to examine the interrelationships between these 15 genes and found that most of these genes were mutually exclusive (Figure 2E). We extracted three mutational signatures from the lung cancer samples, namely signatures (1, 2, 3), and re-annotated them against the Cancer Somatic Mutation Catalog (COSMIC) signature nomenclature using cosine similarity analysis (Figure 2F, Supplementary Figure 2B). We observed that the SBS2 signature was primarily composed of C>T transitions associated with APOBEC Cytidine Deaminase, the SBS6 signature was mainly composed of C>T transitions due to defective DNA mismatch repair, and the SBS4 signature was mainly composed of C>A transitions resulting from exposure to tobacco (smoking) mutagens. We illustrated the proportions and activities of the three extracted signatures in each LUAD sample. The mutation counts attributed to the SBS4 signature showed a significant increase in the LRP1B low-expression group compared to the high-expression group (P < 0.05, Figure 2G), suggesting that smoking may be associated with reduced LRP1B expression. These findings indicate that decreased LRP1B expression may lead to increased genetic instability in LUAD.
Figure 2.
Comprehensive comparison of genomic profiles in patients with different LRP1B subgroups. A-C. Comparison of Fraction of Genome Altered, Homologous recombination deficiency and Aneuploidy Score between LRP1B low-expression group with LRP1B high-expression group in TCGA. D. Mutational landscape of significantly mutated genes in the TCGA cohort stratified by LRP1B low-expression and LRP1B high-expression groups. The middle panel shows the mutation relationship of significantly mutated genes across analyzed cases, with different mutation types color-coded. The upper panel describes the clinical features of patients. E. Relationships among these 15 mutated genes (including LRP1B) with different somatic mutation frequency. F. Mutational activities extracted from mutational signatures (APOBEC Cytidine Deaminase, defective DNA mismatch repair, exposure to tobacco (smoking) mutagens, named as COSMIC signature). The y-axis represents the percentages of mutations in the signature attributable to each mutation type, while the x-axis represents the type of trinucleotide base mutation. G. Distribution of mutational counts attributed to corresponding mutational signatures in LRP1B low-expression and LRP1B high-expression groups.
Knockdown of LRP1B promoted proliferation, invasion, migration, accelerated cell cycle, and inhibited apoptosis in A549 cells
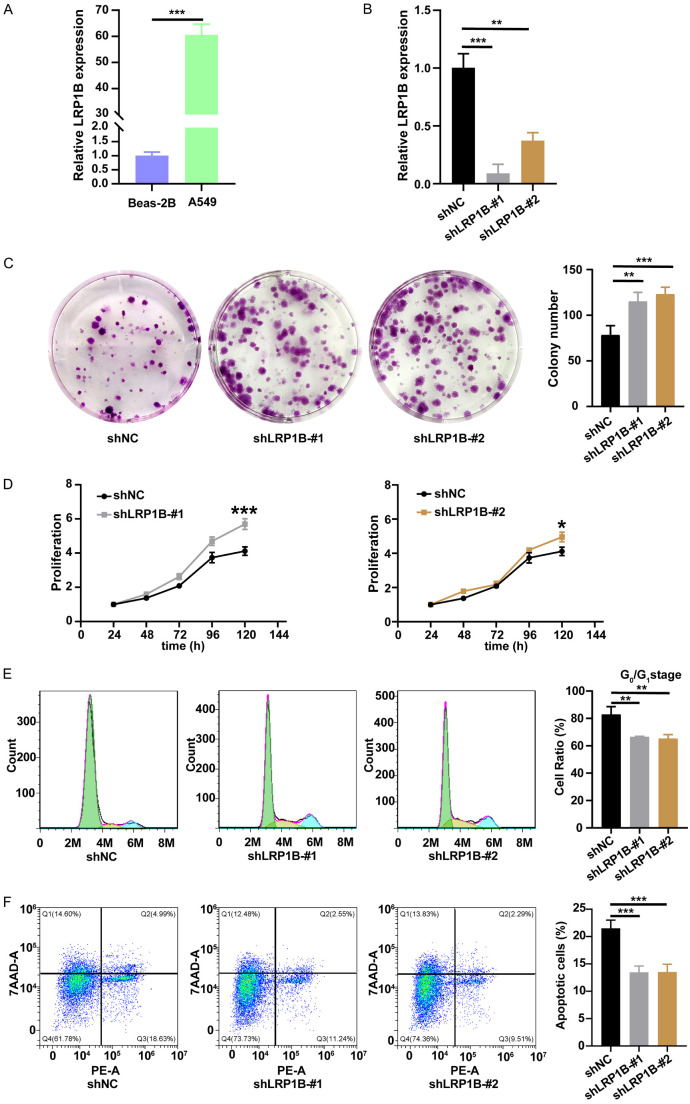
Firstly, we determined the mRNA expression level of LRP1B in bronchial epithelial cells (BEAS-2B) and LUAD cells (A549) through a qRT-PCR experiment (Figure 3A). We then transfected lentivirus to knock down the LRP1B gene in A549 cells (Figure 3B).
Figure 3.
Knockdown of LRP1B promotes proliferation, accelerates cell cycle, and inhibits apoptosis in A549 cells in vitro. A, B. LRP1B mRNA expression of different cells (**P < 0.01, ***P < 0.001). C. Colony formation assays were performed to detect the proliferation of shLRP1B or shNC transfected A549 cells (***P < 0.001, **P < 0.01). D. Absorbance at 450 nm of A549 cells undergoing shLRP1B via CCK8 analysis (***P < 0.001, *P < 0.05). E. Impact of LRP1B knockdown on A549 cells cycle via cell cycle analysis (**P < 0.01). F. Detection of impact of LRP1B knockdown on A549 cells apoptosis ratio via apoptosis analysis (***P < 0.001).
Colony formation assay (P < 0.01, Figure 3C) and CCK-8 proliferation assay (P < 0.05, Figure 3D) results indicated that the knockdown of LRP1B significantly increased cell proliferation of A549 cells. Next, we analyzed the cell cycle of A549 cells using flow cytometry and observed a significant reduction in the percentage of cells in the G0/G1 phase in the knockdown groups (P < 0.01, Figure 3E). We also quantified A549 cell apoptosis using the PE and 7AAD double staining kit. Flow cytometry results demonstrated a significant decrease in the proportion of apoptotic cells after LRP1B gene knockdown (P < 0.001, Figure 3F). These experiments showed that the knockdown of LRP1B promoted cell proliferation, accelerated DNA synthesis to advance the cell cycle, and inhibited cell apoptosis in A549 cells.
Transwell experiments revealed a significant increase in the number of cells passing through the pore membrane after LRP1B knockdown (P < 0.05, Figure 4A, 4B). Scratch assay results indicated that the wound closure ratio was significantly enhanced by LRP1B knockdown in A549 cells (P < 0.05, Figure 4C). These experiments demonstrated that LRP1B inhibited the migration and invasion of LUAD cells. In summary, LRP1B may potentially serve as a tumor suppressor during LUAD tumorigenesis.
Figure 4.
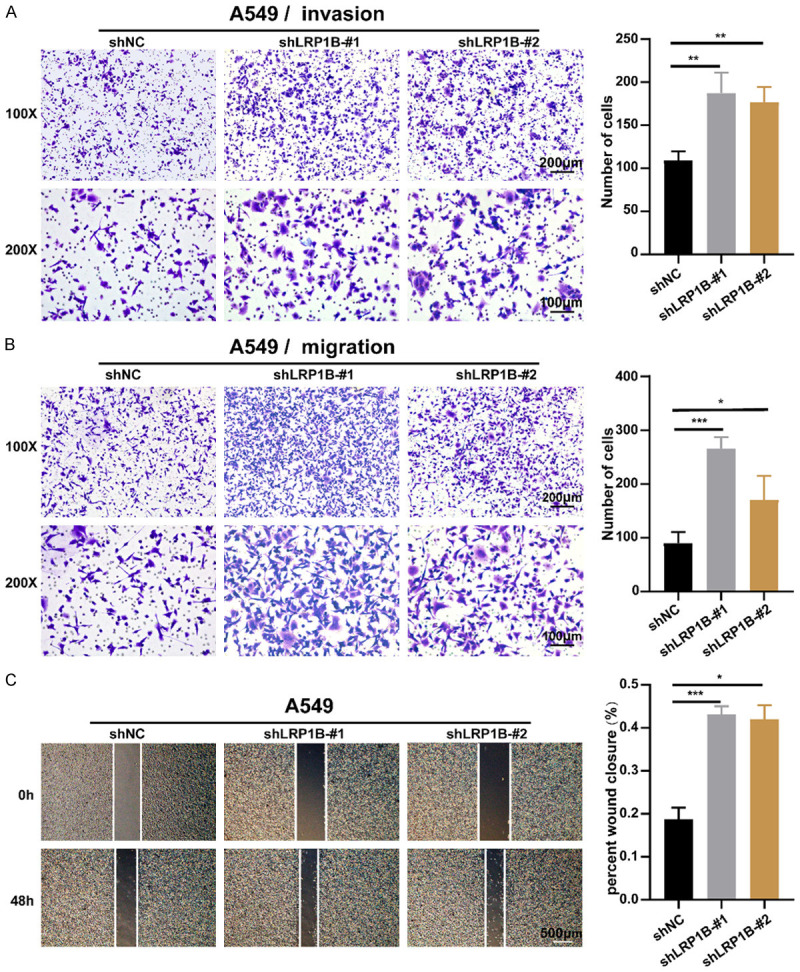
Knockdown of LRP1B promotes invasion and migration in A549 cells in vitro. A. Examination of the ability of A549 cells undergoing shLRP1B to invade via transwell assay (100 × and 200 ×, **P < 0.01). B. Examination of the ability of A549 cells undergoing shLRP1B to migrate via transwell assay (100 × and 200 ×, *P < 0.05, ***P < 0.001). C. Cell wound scratch assay to quantify the effect of shLRP1B on A549 migration over 48 hours (4 ×, *P < 0.05, ***P < 0.001).
Transcriptomic analysis revealed enrichment of the JAK-STAT pathway in the shLRP1B subgroup
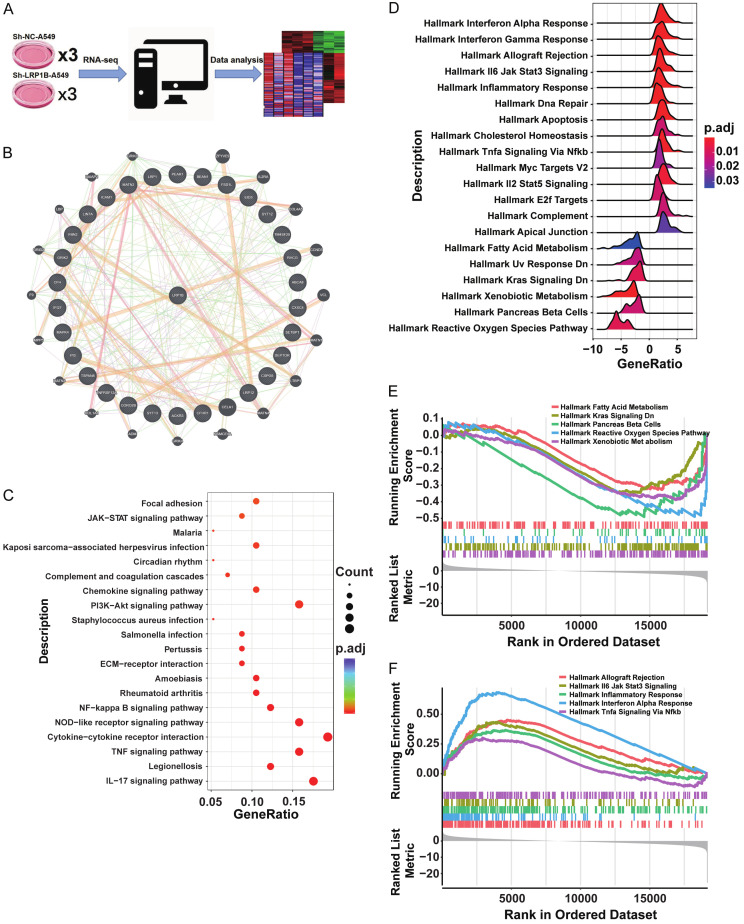
To gain mechanistic insights into the role of LRP1B in LUAD, we performed RNA-seq analysis in the shLRP1B and NC cell lines (Figure 5A). We identified 193 differentially up-regulated genes and 85 down-regulated genes in A549 cells with LRP1B knockdown (Supplementary Table 1). By integrating these differentially expressed genes with those derived from TCGA, we discovered that LRP1B regulated a protein-protein interaction (PPI) network involving SETBP1, SYT12, PEAR1, MATN2, EID3, MAPK4, ICAM1, CXXC4, CFHR1, TSPAN8, TM4SF20, LRP12, PI3, and SYT13, which collectively contributed to the regulation of the malignant phenotype of LUAD (Figure 5B). The up-regulated genes from the RNA-seq results were subjected to Gene Set Enrichment Analysis (GSEA) based on the KEGG pathway dataset. Analysis showed that the up-regulated genes were enriched in the JAK-STAT pathway, chemokine signaling, NF-kappa B signaling, IL-17 signaling, and other tumor inflammation pathways (Figure 5C). Furthermore, GO enrichment analysis of the up-regulated differentially expressed genes in LRP1B knockdown LUAD cell A549 revealed their involvement in biological pathways related to cellular response to tumor necrosis factor, inflammation and chemotaxis, extracellular matrix composition, and cytokine/chemokine activity (Supplementary Figure 3A). On the other hand, down-regulated differentially expressed genes were associated with cellular functions such as cell transmission, G-protein receptor signaling, and presynaptic membrane activities (Supplementary Figure 3B).
Figure 5.
Transcriptomic analysis reveals enrichment of JAK-STAT pathway in shLRP1B subgroup. A. Schematic diagram of RNA-seq in shLRP1B and shNC cell subsets. B. Differentially expressed genes in the LRP1B subgroup obtained from combined results of cell-line RNA-seq and TCGA RNA-seq. The 30 most differentially expressed genes were used to construct the Protein-Protein Interaction Networks. C. KEGG pathway analyses of differentially expressed genes in Control and Knockdown groups LRP1B of A549. D-F. Hallmark pathway enrichment analyses of differentially expressed genes in low and high LRP1B expression subgroups of TCGA.
We performed GSEA based on the Hallmark pathway using the differentially expressed genes from the LRP1B subgroups in TCGA. The LRP1B-low group showed enrichment primarily in pathways related to allograft rejection, IL-6-JAK-STAT3 signaling, inflammatory response, interferon alpha response, and TNFa signaling via NF-Kappa B (Figure 5D, 5E, Supplementary Figure 3C). The LRP1B-high group exhibited higher enrichment in pathways such as fatty acid metabolism, KRAS signalingy, Pancreas Beta Cells, Reactive Oxygen Species Pathway, and Xenobiotic Metabolism (Figure 5F). Importantly, the JAK-STAT pathway was enriched in both bulk and cell line transcriptomic sequencing data when LRP1B was down-regulated.
LRP1B potentially regulates the JAK-STAT3 pathway
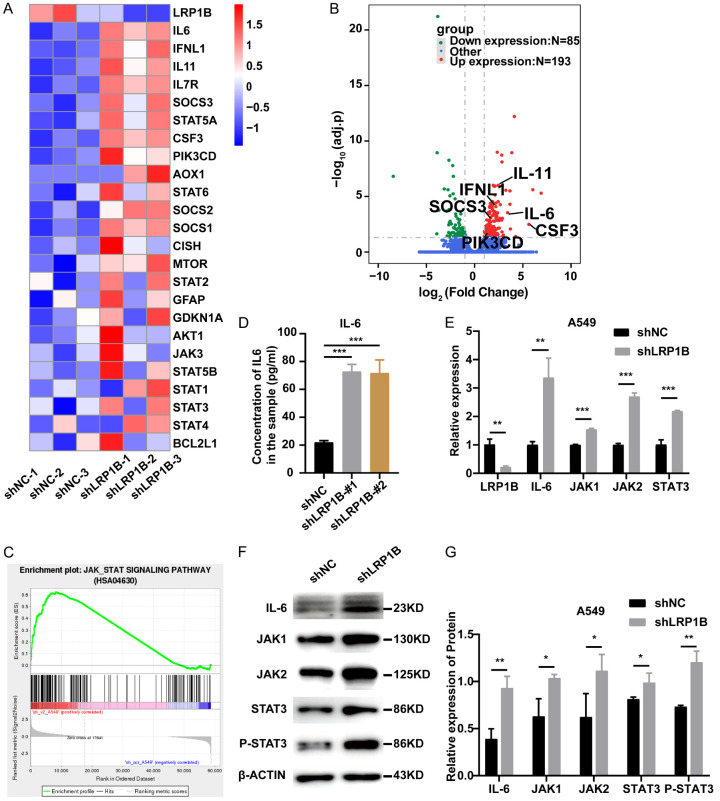
Based on the bioinformatics analysis of RNA-seq, we identified 24 genes (Supplementary Table 2) related to the JAK-STAT3 pathway in 6 groups of cell samples. The results showed significant up-regulation of key genes in the JAK-STAT3 pathway in shLRP1B-cell subsets (Figure 6A). Representative genes such as SOCS3, IL-6, IL11, IFNL1, CSF3, and PIK3CD were also visualized in the volcano plot (Figure 6B). GSEA analyses consistently demonstrated significant enrichment of the JAK-STAT pathway in the LRP1B knockdown group (Figure 6C). ELISA revealed that LRP1B knockdown in A549 cells significantly increased the concentrations of IL-6 and IL-8 (ligands of the JAK-STAT3 pathway) in the cell culture supernatants (P < 0.001, Figure 6D, Supplementary Figure 3D). qPCR experiments showed significant upregulation of IL-6, JAK1, JAK2, and STAT3 at the mRNA levels in the shLRP1B group (P < 0.01, Figure 6E). Furthermore, knockdown of the LRP1B gene led to a significant increase in IL-6, JAK1, JAK2, and STAT3 at the protein levels, as well as an elevation in STAT3 phosphorylation (P < 0.05, Figure 6F, 6G). Additionally, the IL17 signaling pathway, closely related to the JAK-STAT pathway [27], exhibited significant differences (Supplementary Figure 3E). Consistent with the predicted results from the GSEA database, these findings indicate that knockdown of LRP1B can activate the JAK-STAT3 pathway in LUAD cell lines.
Figure 6.
Association between LRP1B and JAK-STAT3 pathway. A. Heatmap shows the relative levels of JAK-STAT3 pathway-related molecules in A549 with knockdown of LRP1B versus control cells (n = 3). B. Volcano plot of RNA-seq data for A549 with knockdown of LRP1B versus control cells (adj.p). C. GSEA of JAK-STAT3 pathway to assess specific enrichment of LRP1B knockdown versus control cells. D. Before changing the media, A549 cells with LRP1B knockdown and control cells were seeded for 12 hours. 48 hours following medium replacement, culture supernatants were collected, and IL-6 levels were determined by ELISA (***P < 0.001). E. qPCR analysis of LRP1B, IL-6, JAK1, JAK2, and STAT3 mRNA levels in A549 cells with LRP1B knockdown compared to control (**P < 0.01, ***P < 0.001). F, G. Western blotting of IL-6, JAK1, JAK2, STAT3, P-STAT3 and β-Actin in A549 cells with LRP1B knockdown compared to control (*P < 0.05, **P < 0.01).
After the addition of IL-6-JAK-STAT3 pathway inhibitors, the proliferation, migration, and apoptosis abilities of shLRP1B cells were reversed
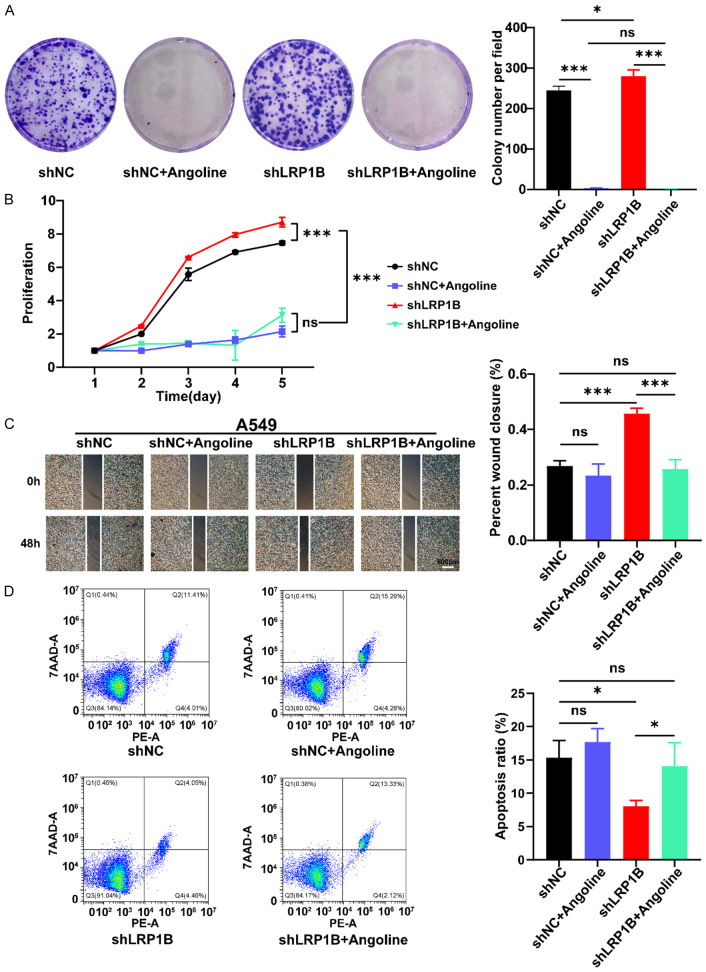
Angoline is one of the IL-6-JAK-STAT3 pathway inhibitor. In this study, we perform the proliferation, migration, and apoptosis experiments when shLRP1B and shNC group A549 cells were treated with the IL-6-JAK-STAT3 pathway inhibitor (a concentration of 14 μM of Angoline). The results of the colony formation assay (P < 0.05, Figure 7A) and CCK-8 proliferation assay (P < 0.001, Figure 7B) showed that the addition of Angoline to the culture medium could reverse the effects of LRP1B gene knockdown on the proliferation ability of A549 cells. The scratch test results showed that the IL-6-JAK-STAT3 pathway inhibitor was able to restore the increased migration ability of shLRP1B A549 cells (P < 0.001, Figure 7C). The flow cytometry experiments revealed that the proportion of apoptosis in shLRP1B group cells was significantly recovered after treatment of Angoline (P < 0.05, Figure 7D).
Figure 7.
Reversal of proliferation, migration, and apoptosis abilities of shLRP1B cells after addition of IL-6-JAK STAT3 pathway inhibitors. A. Colony formation assay to detect the proliferation capacity of A549 cells (*P < 0.05, ***P < 0.001). B. Absorbance of A549 at 450 nm by CCK8 assay (***P < 0.001). C. Detection of migration ability of A549 treated with Angoline stimulation via the cell wound scratch assay (4 ×, ***P < 0.001). D. Detection of apoptosis ratio of A549 treated with Angoline stimulation via cell Apoptosis experiment (*P < 0.05).
Discussion
The development of inflammatory and neoplastic processes has been linked to low-density lipoprotein receptor-associated protein 1 (LRP1) [28,29]. LRP1B is closely related to LRP1 due to its overlapping structural characteristics and shared common ligands, such as RAP, tPA, HRG, etc. [30]. These ligands are widely involved in biological processes, including fibrinolysis, cell proliferation, apoptosis, endocytosis, migration, immunity, host-virus interaction, etc. [30-34]. Although LRP1 and LRP1B share plenty of common ligands, receptor-mediated functions of the same ligand may be significantly different [30]. LRP1B has long been considered a tumor suppressor in many types of cancers. In renal cell carcinoma, the downregulation of LRP1B encourages cell migration by modifying the actin skeleton and the RhoA/Cdc42 pathway [35]. In prostate cancer, miR-500 can promote tumor cell proliferation by inhibiting LRP1B expression [36]. In thyroid cancer, chromosomal, epigenetic, and microRNA-mediated inactivation of LRP1B can enhance the growth and invasion of cancer cells [37]. Similar to previous studies, we found that the expression of LRP1B in LUAD tissues was significantly lower than that in normal tissues, both at the RNA and protein levels. Furthermore, knocking down LRP1B promoted proliferation, invasion, migration, accelerated the cell cycle, and inhibited apoptosis in A549 cells. Together, these results suggest that LRP1B is a tumor suppressor gene in lung adenocarcinoma.
Tumor molecular subtypes are associated with different genetic alterations, clinical prognosis, tumor microenvironment, and therapeutic regimens [38-40]. TCGA has divided tumors into six immune subtypes, where the C3 subtype has the best prognosis and the C4 and C6 subtypes have the worst prognosis [23]. We found that the proportion of LUAD with a better prognosis in the LRP1B high-expression group was higher than in the low-expression group [24,41]. The prox-inflam type, Immune-C2, and high-methylation signature were more prevalent in the LRP1B low-expression group than in the high-expression group. In addition, various immune cells were more enriched in the LRP1B low-expression group than in the high-expression group. It has been reported that LRP1B-mutated cancers may have improved outcomes with immune checkpoint inhibitors (ICI) [32]. In our previous studies, we found that LRP1B was frequently mutated in NSCLC, and its mutation was associated with a higher tumor mutation burden (TMB) [42]. In this study, the reduction of LRP1B expression may lead to increased genetic instability in LUAD.
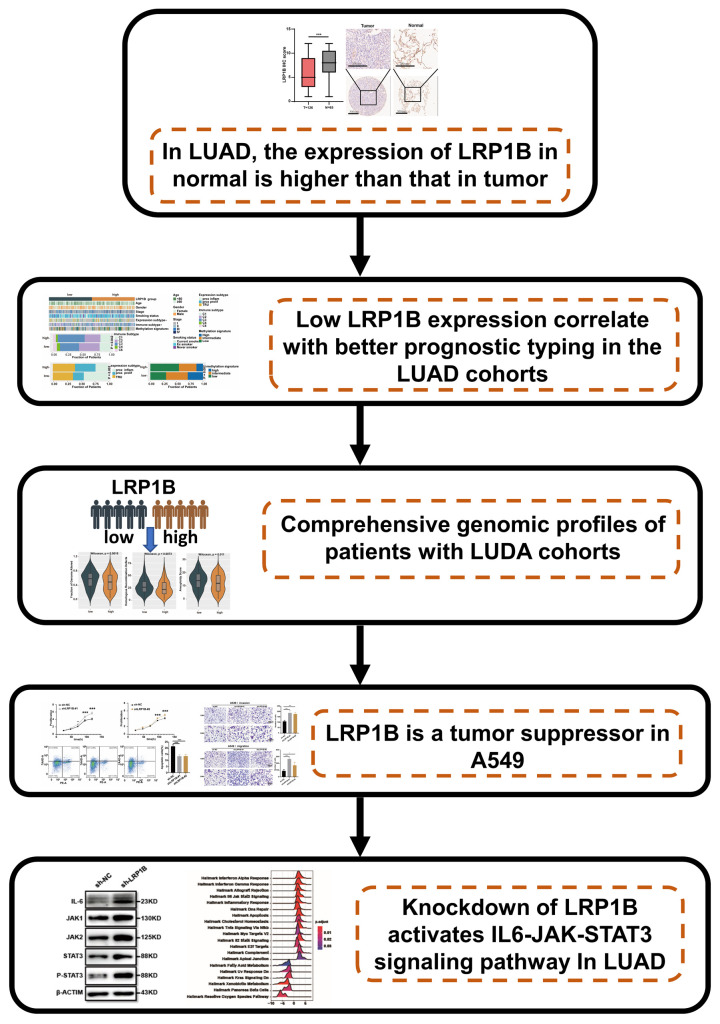
Knocking down the expression of LRP1B leads to IL-6-JAK-STAT3 pathway activation. IL-6 is one of the most typical tumor-promoting cytokines. It has long been recognized as a key cytokine linking inflammation and cancer and has the potential to serve as a therapeutic target [11]. Numerous studies have found a strong link between IL-6 and lung cancer [43-46]. The JAK-STAT pathway is a central pathway that mediates the cellular response to inflammation and promotes cancer progression [13,47]. Govindan et al. demonstrated that the JAK-STAT signaling pathway is significantly altered and promotes the oncogenic processes of lung cancer [14]. Inhibition of the JAK-STAT pathway can obviously attenuate the progression of KRAS- or EGFR-mutation-derived lung cancer [48-50]. In our research, enrichment analysis on bulk and cell-line transcriptomic data showed that the decreased expression of LRP1B could promote the activation of IL-6-JAK-STAT3, IL-17 pathway, chemokine, cytokine, and other inflammation signaling pathways. ELISA assay showed that LRP1B knockdown significantly enhanced the concentration of inflammatory factors IL-6 and IL-8 in LUAD [47]. PCR and WB were also illustrated reducing the expression of LRP1B significantly elevate the activity of the IL-6-JAK-STAT3 pathway. To further support the conclusion that LRP1B knockdown can promote malignant progression through the IL-6-JAK-STAT3 pathway in LUAD. In our study, IL-6-JAK-STAT3 pathway inhibitors were used to stimulate shLRP1B and shNC groups A549 cells, and their proliferation, migration and apoptosis were tested. After the addition of IL-6-JAK-STAT3 pathway inhibitors, the proliferation, migration, and apoptosis abilities of shLRP1B group cells were reversed. GO enrichment analysis of RNA-seq shows that after knocking down LRP1B, differentially expressed genes were mainly enriched in biological pathways including cellular response to tumor necrosis factor, inflammation, and chemotaxis; in vivo experiments and prospective clinical trials are needed to further validate the molecular mechanisms of LRP1B in mediating the inflammation phenotype via the IL-6-JAK-STAT3 pathway. The study flow-chart is shown in (Figure 8).
Figure 8.
Workflow illustrating the effect and mechanism of LRP1B on malignant progression in LUAD.
In summary, our results demonstrate that LRP1B may function as a tumor suppressor factor in LUAD. Additionally, LRP1B is a promising therapeutic target for LUAD, as low expression of LRP1B induces inflammation to promote malignant progression through the IL-6-JAK-STAT3 pathway.
Acknowledgements
This work was supported by Natural Science Foundation of Shandong Province of China (ZR2020QH180, ZR2021QH141), National Natural Science Foundation of China (82102702, 82103322), Youth Innovation Science and Technology Program of Shandong Provincial Universities (2022KJ187), China postdoctoral science foundation (2022M711970), Clinical Medical Science and Technology Innovation Project of Jinan (202225046), Key Research and Development Program of Shandong Province (No. 2021CXGC011104; No. 2019JZZY010104; No. 2019GSF108 146), Academic promotion programme of Shandong First Medical University (2019QL021), and Special Foundation for Taishan Scholars Program of Shandong Province (No. ts20190978).
Disclosure of conflict of interest
None.
Abbreviations
- LUAD
Lung adenocarcinoma
- LRP1B
Low density lipoprotein receptor associated protein 1B
- IL-6
Interleukin 6
- IL-8
Interleukin 8
- JAK
Janus kinases
- STAT3
Signal transducer and activator of transcription 3
- IHC
Immunohistochemistry
- PPI
Protein-Protein Interaction Networks
- TCGA
Cancer Genome Atlas
- TME
Tumor microenvironment
- GSEA
Gene set enrichment analysis
- ATCC
American type culture collection
- GO
Gene Ontology
- FGA
Fraction of Genome Altered
- HRD
Homologous Recombination Defect
- COSMIC
Cancer Somatic Mutation Catalog
- P-STAT3
Phosphorylation signal transducer and activator of transcription 3
- IL-17
Interleukin 17
- ICI
Immune checkpoint inhibitors
- TMB
Tumor mutation burden
Supporting Information
References
- 1.Sung H, Ferlay J, Siegel RL, Laversanne M, Soerjomataram I, Jemal A, Bray F. Global cancer statistics 2020: GLOBOCAN estimates of incidence and mortality worldwide for 36 cancers in 185 countries. CA Cancer J Clin. 2021;71:209–249. doi: 10.3322/caac.21660. [DOI] [PubMed] [Google Scholar]
- 2.Travis WD, Brambilla E, Riely GJ. New pathologic classification of lung cancer: relevance for clinical practice and clinical trials. J. Clin. Oncol. 2013;31:992–1001. doi: 10.1200/JCO.2012.46.9270. [DOI] [PubMed] [Google Scholar]
- 3.Liu CX, Musco S, Lisitsina NM, Forgacs E, Minna JD, Lisitsyn NA. LRP-DIT, a putative endocytic receptor gene, is frequently inactivated in non-small cell lung cancer cell lines. Cancer Res. 2000;60:1961–1967. [PubMed] [Google Scholar]
- 4.Pineau P, Marchio A, Nagamori S, Seki S, Tiollais P, Dejean A. Homozygous deletion scanning in hepatobiliary tumor cell lines reveals alternative pathways for liver carcinogenesis. Hepatology. 2003;37:852–861. doi: 10.1053/jhep.2003.50138. [DOI] [PubMed] [Google Scholar]
- 5.Langbein S, Szakacs O, Wilhelm M, Sukosd F, Weber S, Jauch A, Lopez Beltran A, Alken P, Kalble T, Kovacs G. Alteration of the LRP1B gene region is associated with high grade of urothelial cancer. Lab Invest. 2002;82:639–643. doi: 10.1038/labinvest.3780458. [DOI] [PubMed] [Google Scholar]
- 6.Sonoda I, Imoto I, Inoue J, Shibata T, Shimada Y, Chin K, Imamura M, Amagasa T, Gray JW, Hirohashi S, Inazawa J. Frequent silencing of low density lipoprotein receptor-related protein 1B (LRP1B) expression by genetic and epigenetic mechanisms in esophageal squamous cell carcinoma. Cancer Res. 2004;64:3741–3747. doi: 10.1158/0008-5472.CAN-04-0172. [DOI] [PubMed] [Google Scholar]
- 7.Wang Z, Sun P, Gao C, Chen J, Li J, Chen Z, Xu M, Shao J, Zhang Y, Xie J. Down-regulation of LRP1B in colon cancer promoted the growth and migration of cancer cells. Exp Cell Res. 2017;357:1–8. doi: 10.1016/j.yexcr.2017.04.010. [DOI] [PubMed] [Google Scholar]
- 8.Lu YJ, Wu CS, Li HP, Liu HP, Lu CY, Leu YW, Wang CS, Chen LC, Lin KH, Chang YS. Aberrant methylation impairs low density lipoprotein receptor-related protein 1B tumor suppressor function in gastric cancer. Genes Chromosomes Cancer. 2010;49:412–424. doi: 10.1002/gcc.20752. [DOI] [PubMed] [Google Scholar]
- 9.Philips RL, Wang Y, Cheon H, Kanno Y, Gadina M, Sartorelli V, Horvath CM, Darnell JE Jr, Stark GR, O’Shea JJ. The JAK-STAT pathway at 30: much learned, much more to do. Cell. 2022;185:3857–3876. doi: 10.1016/j.cell.2022.09.023. [DOI] [PMC free article] [PubMed] [Google Scholar]
- 10.Garbers C, Hermanns HM, Schaper F, Muller-Newen G, Grotzinger J, Rose-John S, Scheller J. Plasticity and cross-talk of interleukin 6-type cytokines. Cytokine Growth Factor Rev. 2012;23:85–97. doi: 10.1016/j.cytogfr.2012.04.001. [DOI] [PubMed] [Google Scholar]
- 11.Hunter CA, Jones SA. IL-6 as a keystone cytokine in health and disease. Nat Immunol. 2015;16:448–457. doi: 10.1038/ni.3153. [DOI] [PubMed] [Google Scholar]
- 12.Abaurrea A, Araujo AM, Caffarel MM. The role of the IL-6 cytokine family in epithelial-mesenchymal plasticity in cancer progression. Int J Mol Sci. 2021;22:8334. doi: 10.3390/ijms22158334. [DOI] [PMC free article] [PubMed] [Google Scholar]
- 13.Hu X, Li J, Fu M, Zhao X, Wang W. The JAK/STAT signaling pathway: from bench to clinic. Signal Transduct Target Ther. 2021;6:402. doi: 10.1038/s41392-021-00791-1. [DOI] [PMC free article] [PubMed] [Google Scholar]
- 14.Govindan R, Ding L, Griffith M, Subramanian J, Dees ND, Kanchi KL, Maher CA, Fulton R, Fulton L, Wallis J, Chen K, Walker J, McDonald S, Bose R, Ornitz D, Xiong D, You M, Dooling DJ, Watson M, Mardis ER, Wilson RK. Genomic landscape of non-small cell lung cancer in smokers and never-smokers. Cell. 2012;150:1121–1134. doi: 10.1016/j.cell.2012.08.024. [DOI] [PMC free article] [PubMed] [Google Scholar]
- 15.Thomas-Schoemann A, Batteux F, Mongaret C, Nicco C, Chereau C, Annereau M, Dauphin A, Goldwasser F, Weill B, Lemare F, Alexandre J. Arsenic trioxide exerts antitumor activity through regulatory T cell depletion mediated by oxidative stress in a murine model of colon cancer. J Immunol. 2012;189:5171–5177. doi: 10.4049/jimmunol.1103094. [DOI] [PubMed] [Google Scholar]
- 16.Camporeale A, Poli V. IL-6, IL-17 and STAT3: a holy trinity in auto-immunity? Front Biosci (Landmark Ed) 2012;17:2306–2326. doi: 10.2741/4054. [DOI] [PubMed] [Google Scholar]
- 17.Cui H, Jiang Z, Zeng S, Wu H, Zhang Z, Guo X, Dong K, Wang J, Shang L, Li L. A new candidate oncogenic lncRNA derived from pseudogene WFDC21P promotes tumor progression in gastric cancer. Cell Death Dis. 2021;12:903. doi: 10.1038/s41419-021-04200-x. [DOI] [PMC free article] [PubMed] [Google Scholar]
- 18.Mermel CH, Schumacher SE, Hill B, Meyerson ML, Beroukhim R, Getz G. GISTIC2.0 facilitates sensitive and confident localization of the targets of focal somatic copy-number alteration in human cancers. Genome Biol. 2011;12:R41. doi: 10.1186/gb-2011-12-4-r41. [DOI] [PMC free article] [PubMed] [Google Scholar]
- 19.Davoli T, Uno H, Wooten EC, Elledge SJ. Tumor aneuploidy correlates with markers of immune evasion and with reduced response to immunotherapy. Science. 2017;355:eaaf8399. doi: 10.1126/science.aaf8399. [DOI] [PMC free article] [PubMed] [Google Scholar]
- 20.Aran D, Hu Z, Butte AJ. xCell: digitally portraying the tissue cellular heterogeneity landscape. Genome Biol. 2017;18:220. doi: 10.1186/s13059-017-1349-1. [DOI] [PMC free article] [PubMed] [Google Scholar]
- 21.Ritchie ME, Phipson B, Wu D, Hu Y, Law CW, Shi W, Smyth GK. Limma powers differential expression analyses for RNA-sequencing and microarray studies. Nucleic Acids Res. 2015;43:e47. doi: 10.1093/nar/gkv007. [DOI] [PMC free article] [PubMed] [Google Scholar]
- 22.Subramanian A, Tamayo P, Mootha VK, Mukherjee S, Ebert BL, Gillette MA, Paulovich A, Pomeroy SL, Golub TR, Lander ES, Mesirov JP. Gene set enrichment analysis: a knowledge-based approach for interpreting genome-wide expression profiles. Proc Natl Acad Sci U S A. 2005;102:15545–15550. doi: 10.1073/pnas.0506580102. [DOI] [PMC free article] [PubMed] [Google Scholar]
- 23.Thorsson V, Gibbs DL, Brown SD, Wolf D, Bortone DS, Ou Yang TH, Porta-Pardo E, Gao GF, Plaisier CL, Eddy JA, Ziv E, Culhane AC, Paull EO, Sivakumar IKA, Gentles AJ, Malhotra R, Farshidfar F, Colaprico A, Parker JS, Mose LE, Vo NS, Liu J, Liu Y, Rader J, Dhankani V, Reynolds SM, Bowlby R, Califano A, Cherniack AD, Anastassiou D, Bedognetti D, Mokrab Y, Newman AM, Rao A, Chen K, Krasnitz A, Hu H, Malta TM, Noushmehr H, Pedamallu CS, Bullman S, Ojesina AI, Lamb A, Zhou W, Shen H, Choueiri TK, Weinstein JN, Guinney J, Saltz J, Holt RA, Rabkin CS Cancer Genome Atlas Research Network. Lazar AJ, Serody JS, Demicco EG, Disis ML, Vincent BG, Shmulevich I. The immune landscape of cancer. Immunity. 2018;48:812–830. e14. doi: 10.1016/j.immuni.2018.03.023. [DOI] [PMC free article] [PubMed] [Google Scholar]
- 24.Cancer Genome Atlas Research Network. Comprehensive molecular profiling of lung adenocarcinoma. Nature. 2014;511:543–550. doi: 10.1038/nature13385. [DOI] [PMC free article] [PubMed] [Google Scholar]
- 25.Bezzecchi E, Ronzio M, Semeghini V, Andrioletti V, Mantovani R, Dolfini D. NF-YA overexpression in lung cancer: LUAD. Genes (Basel) 2020;11:198. doi: 10.3390/genes11020198. [DOI] [PMC free article] [PubMed] [Google Scholar]
- 26.Toh M, Ngeow J. Homologous recombination deficiency: cancer predispositions and treatment implications. Oncologist. 2021;26:e1526–e1537. doi: 10.1002/onco.13829. [DOI] [PMC free article] [PubMed] [Google Scholar]
- 27.You T, Bi Y, Li J, Zhang M, Chen X, Zhang K, Li J. IL-17 induces reactive astrocytes and up-regulation of vascular endothelial growth factor (VEGF) through JAK/STAT signaling. Sci Rep. 2017;7:41779. doi: 10.1038/srep41779. [DOI] [PMC free article] [PubMed] [Google Scholar]
- 28.Garcia-Fernandez P, Uceyler N, Sommer C. From the low-density lipoprotein receptor-related protein 1 to neuropathic pain: a potentially novel target. Pain Rep. 2021;6:e898. doi: 10.1097/PR9.0000000000000898. [DOI] [PMC free article] [PubMed] [Google Scholar]
- 29.Xing P, Liao Z, Ren Z, Zhao J, Song F, Wang G, Chen K, Yang J. Roles of low-density lipoprotein receptor-related protein 1 in tumors. Chin J Cancer. 2016;35:6. doi: 10.1186/s40880-015-0064-0. [DOI] [PMC free article] [PubMed] [Google Scholar]
- 30.Principe C, Dionisio de Sousa IJ, Prazeres H, Soares P, Lima RT. LRP1B: a giant lost in cancer translation. Pharmaceuticals (Basel) 2021;14:836. doi: 10.3390/ph14090836. [DOI] [PMC free article] [PubMed] [Google Scholar]
- 31.Li Y, Knisely JM, Lu W, McCormick LM, Wang J, Henkin J, Schwartz AL, Bu G. Low density lipoprotein (LDL) receptor-related protein 1B impairs urokinase receptor regeneration on the cell surface and inhibits cell migration. J Biol Chem. 2002;277:42366–42371. doi: 10.1074/jbc.M207705200. [DOI] [PubMed] [Google Scholar]
- 32.Brown LC, Tucker MD, Sedhom R, Schwartz EB, Zhu J, Kao C, Labriola MK, Gupta RT, Marin D, Wu Y, Gupta S, Zhang T, Harrison MR, George DJ, Alva A, Antonarakis ES, Armstrong AJ. LRP1B mutations are associated with favorable outcomes to immune checkpoint inhibitors across multiple cancer types. J Immunother Cancer. 2021;9:e001792. doi: 10.1136/jitc-2020-001792. [DOI] [PMC free article] [PubMed] [Google Scholar]
- 33.Zheng H, Koo EH. Biology and pathophysiology of the amyloid precursor protein. Mol Neurodegener. 2011;6:27. doi: 10.1186/1750-1326-6-27. [DOI] [PMC free article] [PubMed] [Google Scholar]
- 34.Calvier L, Herz J, Hansmann G. Interplay of low-density lipoprotein receptors, LRPs, and lipoproteins in pulmonary hypertension. JACC Basic Transl Sci. 2022;7:164–180. doi: 10.1016/j.jacbts.2021.09.011. [DOI] [PMC free article] [PubMed] [Google Scholar]
- 35.Ni S, Hu J, Duan Y, Shi S, Li R, Wu H, Qu Y, Li Y. Down expression of LRP1B promotes cell migration via RhoA/Cdc42 pathway and actin cytoskeleton remodeling in renal cell cancer. Cancer Sci. 2013;104:817–825. doi: 10.1111/cas.12157. [DOI] [PMC free article] [PubMed] [Google Scholar]
- 36.Zhang Z, Cui R, Li H, Li J. miR-500 promotes cell proliferation by directly targetting LRP1B in prostate cancer. Biosci Rep. 2019;39:BSR20181854. doi: 10.1042/BSR20181854. [DOI] [PMC free article] [PubMed] [Google Scholar]
- 37.Prazeres H, Torres J, Rodrigues F, Pinto M, Pastoriza MC, Gomes D, Cameselle-Teijeiro J, Vidal A, Martins TC, Sobrinho-Simoes M, Soares P. Chromosomal, epigenetic and microRNA-mediated inactivation of LRP1B, a modulator of the extracellular environment of thyroid cancer cells. Oncogene. 2017;36:146. doi: 10.1038/onc.2016.143. [DOI] [PubMed] [Google Scholar]
- 38.Zhao L, Lee VHF, Ng MK, Yan H, Bijlsma MF. Molecular subtyping of cancer: current status and moving toward clinical applications. Brief Bioinform. 2019;20:572–584. doi: 10.1093/bib/bby026. [DOI] [PubMed] [Google Scholar]
- 39.Hanahan D. Hallmarks of cancer: new dimensions. Cancer Discov. 2022;12:31–46. doi: 10.1158/2159-8290.CD-21-1059. [DOI] [PubMed] [Google Scholar]
- 40.Chakravarty D, Solit DB. Clinical cancer genomic profiling. Nat Rev Genet. 2021;22:483–501. doi: 10.1038/s41576-021-00338-8. [DOI] [PubMed] [Google Scholar]
- 41.Ringner M, Jonsson G, Staaf J. Prognostic and chemotherapy predictive value of gene-expression phenotypes in primary lung adenocarcinoma. Clin Cancer Res. 2016;22:218–229. doi: 10.1158/1078-0432.CCR-15-0529. [DOI] [PubMed] [Google Scholar]
- 42.Chen H, Chong W, Wu Q, Yao Y, Mao M, Wang X. Association of LRP1B mutation with tumor mutation burden and outcomes in melanoma and non-small cell lung cancer patients treated with immune check-point blockades. Front Immunol. 2019;10:1113. doi: 10.3389/fimmu.2019.01113. [DOI] [PMC free article] [PubMed] [Google Scholar]
- 43.Che D, Zhang S, Jing Z, Shang L, Jin S, Liu F, Shen J, Li Y, Hu J, Meng Q, Yu Y. Macrophages induce EMT to promote invasion of lung cancer cells through the IL-6-mediated COX-2/PGE2/beta-catenin signalling pathway. Mol Immunol. 2017;90:197–210. doi: 10.1016/j.molimm.2017.06.018. [DOI] [PubMed] [Google Scholar]
- 44.Brown D, Zingone A, Yu Y, Zhu B, Candia J, Cao L, Ryan BM. Relationship between circulating inflammation proteins and lung cancer diagnosis in the national lung screening trial. Cancer Epidemiol Biomarkers Prev. 2019;28:110–118. doi: 10.1158/1055-9965.EPI-18-0598. [DOI] [PMC free article] [PubMed] [Google Scholar]
- 45.Pine SR, Mechanic LE, Enewold L, Chaturvedi AK, Katki HA, Zheng YL, Bowman ED, Engels EA, Caporaso NE, Harris CC. Increased levels of circulating interleukin 6, interleukin 8, C-reactive protein, and risk of lung cancer. J Natl Cancer Inst. 2011;103:1112–1122. doi: 10.1093/jnci/djr216. [DOI] [PMC free article] [PubMed] [Google Scholar]
- 46.Caetano MS, Zhang H, Cumpian AM, Gong L, Unver N, Ostrin EJ, Daliri S, Chang SH, Ochoa CE, Hanash S, Behrens C, Wistuba II, Sternberg C, Kadara H, Ferreira CG, Watowich SS, Moghaddam SJ. IL6 blockade reprograms the lung tumor microenvironment to limit the development and progression of K-ras-mutant lung cancer. Cancer Res. 2016;76:3189–3199. doi: 10.1158/0008-5472.CAN-15-2840. [DOI] [PMC free article] [PubMed] [Google Scholar]
- 47.Sabaawy HE, Ryan BM, Khiabanian H, Pine SR. JAK/STAT of all trades: linking inflammation with cancer development, tumor progression and therapy resistance. Carcinogenesis. 2021;42:1411–1419. doi: 10.1093/carcin/bgab075. [DOI] [PMC free article] [PubMed] [Google Scholar]
- 48.Cao W, Liu Y, Zhang R, Zhang B, Wang T, Zhu X, Mei L, Chen H, Zhang H, Ming P, Huang L. Homoharringtonine induces apoptosis and inhibits STAT3 via IL-6/JAK1/STAT3 signal pathway in Gefitinib-resistant lung cancer cells. Sci Rep. 2015;5:8477. doi: 10.1038/srep08477. [DOI] [PMC free article] [PubMed] [Google Scholar]
- 49.Miller A, McLeod L, Alhayyani S, Szczepny A, Watkins DN, Chen W, Enriori P, Ferlin W, Ruwanpura S, Jenkins BJ. Blockade of the IL-6 trans-signalling/STAT3 axis suppresses cachexia in Kras-induced lung adenocarcinoma. Oncogene. 2017;36:3059–3066. doi: 10.1038/onc.2016.437. [DOI] [PubMed] [Google Scholar]
- 50.Mohrherr J, Haber M, Breitenecker K, Aigner P, Moritsch S, Voronin V, Eferl R, Moriggl R, Stoiber D, Gyorffy B, Brcic L, Laszlo V, Dome B, Moldvay J, Dezso K, Bilban M, Popper H, Moll HP, Casanova E. JAK-STAT inhibition impairs K-RAS-driven lung adenocarcinoma progression. Int J Cancer. 2019;145:3376–3388. doi: 10.1002/ijc.32624. [DOI] [PMC free article] [PubMed] [Google Scholar]
Associated Data
This section collects any data citations, data availability statements, or supplementary materials included in this article.


