

Abstract
Background: Hypoxia is a significant feature of many solid tumors and can activate hypoxia-inducible factor 1α (HIF-1α)/vascular epidermal growth factor (VEGF) signaling pathway, which is closely related to the occurrence and development of primary liver cancer (PLC). Silymarin (SM) had been used as a traditional liver protective drug for decades. Recent studies have found that SM has chemopreventive and chemosensitizing effects on multiple cancers. In this study, we investigated the effects of SM on HIF-1α/VEGF signaling in human hepatocellular carcinoma cells under hypoxia conditions. Methods: HepG2 and Hep3B cells were divided into different experimental groups according to different culture conditions (aerobic or anaerobic) and the concentration of SM in the culture medium. The cellular proliferation, migration, invasion, colony formation, and apoptosis were observed by using methyl thiazolyl tetrazolium (MTT) assay, cell migration assay, in vitro invasion assay, soft agar colony formation assay, and Annexin V apoptosis assay, respectively. The cellular expressions of HIF-1α and VEGF were determined by real-time reverse transcription-polymerase chain reaction (RT-PCR) and western blot (WB) analyses. Results: SM reduced cellular proliferation, migration, invasion, and colony formation, but induced apoptosis in HepG2 and Hep3B cells under hypoxia conditions. The half inhibitory concentrations (IC50) of SM on HepG2 and Hep3B cells were 58.46 and 75.13 umol/L, respectively. SM also suppressed cellular expressions of HIF-1α and VEGF in HepG2 and Hep3B cells under hypoxia conditions at the mRNA and protein levels. All these effects of SM were dose dependent. Conclusions: The inhibitory effect of SM on HepG2 and Hep3B cells under hypoxia is partially via downregulating HIF-1α/VEGF signaling, which may serve as a potential drug therapy target for liver cancer based on SM.
Keywords: Silymarin, HepG2 cells, Hep3B cells, hypoxia, HIF-1α, VEGF
Introduction
Primary liver cancer (PLC) ranks the fourth in the cancer-related death and threatens human health severely [1]. China has the highest incidence of PLC in the world. According to Global Cancer Statistics 2020, there were about 840,000 new liver cancer patients worldwide every year, of which Chinese patients account for about 47% of the new cases [2].
Hypoxia is one of the most common characteristics of the microenvironment of solid tumors due to the rapid proliferation and excessive oxygen consumption, and plays a key role in promoting tumor growth, metastasis, and chemoradiotherapy resistance [3,4]. Hypoxia markers can be used as independent prognostic factors of liver cancer, and their expression predicts poor prognosis in PLC patients [5]. One important mechanism by which hypoxia participates in the invasion and metastasis of PLC is its regulatory effect on the hypoxia-inducible factor 1α (HIF-1α)/vascular epidermal growth factor (VEGF) pathway [6]. HIF-1α, an important nuclear transcription factor, is activated and stabilized under hypoxic conditions [7]. It can regulate the expressions of over 1000 downstream genes, many of which are related to tumor proliferation and metastasis, angiogenesis, as well as energy metabolism [8]. VEGF is an important target gene of HIF-1α and a key factor to promote tumor vascular growth [9]. Wei H et al. reported that lncRNA PAARH could promote the growth and angiogenesis of hepatocellular carcinoma (HCC) by activating HIF-1α/VEGF pathway [10]. Xiao H et al. reported that H2A histone family member X (γ-H2AX) could promote HCC angiogenesis via HIF-1α/VEGF pathways under hypoxic condition [11]. Liao ZH et al. reported that epigallocatechin gallate derivative Y could inhibit HCC via inhibiting angiogenesis in HIF-1α/VEGF dependent pathways [12]. Exploring effective anti-liver cancer drugs targeting HIF-1α/VEGF signaling pathway has become one of the current research hotspots.
Silymarin (SM) is a natural flavonolignans compound, which is extracted from the seed of the milk thistle plant and widely known for its liver-protective function [13,14]. Recent studies had found that SM could suppress the growth of tumor cells, especially under hypoxia conditions [15-17]. Miyazawa M et al. reported that SM suppressed HIF-1α expression under hypoxic conditions in ovarian clear-cell carcinoma cell lines and could be a potential anti-cancer drug [18]. Deep G et al. reported that SM could suppress hypoxia-induced HIF-1α pathway as well as lipogenesis in prostate cancer cells [19]. Jung HJ et al. reported that in prostate cancer cells, the inhibiting effect of SM on HIF-1α was associated with the decreased global protein translation [20]. However, its inhibitory effect on HCC cells under hypoxia has not been reported.
In this study, we hypothesized that SM could exert its inhibitory effects on proliferation of HepG2 and Hep3B cells under hypoxia by downregulating HIF-1α/VEGF pathway. Our research results will provide a potential drug therapy target for developing new anti-liver cancer agents based on SM.
Materials and methods
Cell culture and experimental design
Human hepatoma HepG2 and Hep3B cells (Shanghai Institute of Cell Biology, China) were cultured in RPMI-1640 medium (Wuhan Boster Biological Technology Co., Ltd., China) supplemented with 10% fetal bovine serum (FBS), 100 U/mL penicillin and 100 mg/L streptomycin (all from Shanghai Jitai Yikesai Biotechnology Co., Ltd., China). Cell growth was observed using inverted phase contrast microscope (Leica, Germany). The cells were sub-cultured after digestion with 0.25% trypsin (Shanghai Jitai Yikesai Biotechnology Co., Ltd., China), and the cells at logarithmic growth phase were adjusted to 1 × 10⁴/mL and used in the experiment.
HepG2 and Hep3B cells seeded in 96-well plate (2 × 10³ cells/well) were divided into the following experimental groups according to different culture conditions: 1) Control group; 2) Hypoxia group; 3) 5 umol/L SM (Nanjing Tisiaimo Institute of traditional Chinese medicine, China) group; 4) 10 umol/L SM group; 5) 20 umol/L SM group; 6) 40 umol/L SM group; 7) 80 umol/L SM group; 8) 160 umol/L SM group. In control group, cells were cultured in 37°C, 5% CO2, 95% O2 cell incubator (Thermo Scientific, MA, USA) for 48 h. In hypoxia group, cells were cultured in cell incubator (Thermo Scientific, MA, USA) at the condition of 37°C, 5% CO2, 94% N2 and 1% O2 for 48 h. For groups with different SM concentrations, cells were first cultured under anoxic condition (the same as group 2) for 24 h, and then SM at different concentrations were added to culture medium and the experimental cells were re-cultured for 24 h under anoxic condition. All experiments in this study were repeated for at least 3 times.
Cell proliferation detected by methyl thiazolyl tetrazolium (MTT) assay
After cell culture, 20 μL MTT (5 g/L) (Sigma-Aldrich Co., Ltd., USA) was add into each well to incubate with experimental cells for 4 h. Then the medium was discarded, and each well was added with 150 μL DMSO (Sigma-Aldrich Co., Ltd., USA) and cells were gently shaken for 15 min. The absorbance value (OD) at 492 nm was detected by a microplate reader (Thermo Fisher, USA), and the inhibition rate of cell proliferation was calculated using below equation: Proliferation inhibition rate = [(OD control group - OD treatment group)/OD control group] × 100%.
Cell migration detected by Transwell migration assay
Cells in each group were resuspended in a serum-free medium containing 0.2% bovine serum albumin (Gibco Invitrogen, Shanghai, China) and the concentration was adjusted to 5 × 10⁵ cells/mL. Then, 100 μl of cell suspension was added into the Transwell chamber (Beijing Solarbio Science & Technology Co., Ltd., China), and 500 μl medium comprising 20% FBS was placed in the lower compartment and the cells were left to migrate for 24 h at 37°C. Non-migrated cells were removed using a cotton swab and the transmigrated cells at the rear side of the filter were stained with Giemsa and counted at × 400 magnification to quantify cell migration.
Cell invasion detected by Transwell invasion assay
Cell invasion was evaluated using 24-well Transwell units with 8-µm pore filter (Corning Costar Corp., Cambridge, MA, USA). The filters were coated with 50 µl Matrigel (BD Biosciences) for 6 h at 37°C. Cells in each group were adjusted to 1 × 10⁶ cells/mL using serum free RPMI 1640 medium. A total of 200 μl cell suspension was added into each upper Transwell chamber and 600 μl RPMI 1640 medium containing 5% FBS was added into the lower chamber. Then, the cells were allowed to invade for 24 h at 37°C. After removing the cells that remained on the upper surface of the filter with a cotton swab, cells in the membrane of lower chamber were fixed with methanol and stained with Giemsa and then counted under a light microscope (CKX41; Olympus) at × 400 magnification.
Cell colony formation detected by soft agar assay
4 × 10³ experimental cells in each group were mixed with 0.35% soft agar (Sigma-Aldrich Co., Ltd., USA) and then plated into 24-well plates coated with 1% soft agar. Then the cells were cultured in a cell incubator (37°C, 5% CO2, 95% O2) for 8 days. Colonies with a diameter larger than 50 μm were counted in each well using a BX53 inverted microscope (Olympus, Tokyo, Japan).
Cell apoptosis detected by flow cytometry
After washing with PBS twice, experimental cells in each group were digested with 0.25% trypsin. Then the cells were centrifuged at 1000 r/min for 5 min at 4°C. The supernatant was abandoned, and the cells were added with 200 μL Annexin V-FITC binding solution, and then 5 μL Annexin V-FITC (all from Beyotime Company, China). The cells were incubated in dark at 20°C for 20 min. Finally, 10 µL of propidium iodide (PI) (Beyotime Company, China) was added and the apoptosis rate of experimental cells was detected by Flow cytometry (FACScan, BD Biosciences, USA).
Real-time reverse transcription-polymerase chain reaction (RT-PCR)
The cellular expressions of HIF-1α and VEGF in each group were measured using a Real-time RT-PCR kit (Dalian Takara company, China). The total RNA was extracted with Trizol (Dalian Takara company, China), and its purity and concentration were determined spectrophotometrically. cDNA was obtained by reverse transcription and target gene sequences were amplified by PCR using cDNA as template. All primers in this study were designed and synthesized by Shanghai Shenggong Bioengineering Technology Co., Ltd. (China). The primer sequences are listed in Table 1. The thermal profile was 95°C for 1 min, 40 cycles of 90°C for 20 sec, 55°C for 30 sec and 68°C for 50 sec on a RT-PCR system (CFX96, Bio-Rad, USA). Amplification specificity was controlled by melting curve analysis. Relative gene expression was calculated using the comparative threshold (CT) method. β-actin was used as an internal control.
Table 1.
Primer sequence
| Primer | Forward | Reverse | Product length |
|---|---|---|---|
| HIF-1α | 5’-CAGGATCAGACACCTAGTCCTCC-3’ | 5’-ATGTGGGTAGGAGATGGAATG-3’ | 458 bp |
| VEGF | 5’-TGACTTGACTCGAGTCCTG-3’ | 5’-TACGTCCTAGCCGAGATCG-3’ | 206 bp |
| β-actin | 5’-GCATGTACGACAGAGCCGTACGC-3’ | 5’-TCAACGCAGACATATCCAGC-3’ | 263 bp |
VEGF, vascular epidermal growth factor.
Western blot (WB) analysis
Cellular proteins were extracted by using protein lysate, and its concentration was determined using Bradford method. Twenty µg of protein per lane was electrophoresed on 10% acrylamide gels. The proteins fractionated by sodium dodecyl sulfate polyacrylamide gel electrophoresis (SDS-PAGE) were then transferred to polyvinylidene difluoride membranes blocked with 5% skim milk in Tris-buffed saline. The membrane was then incubated with primary antibodies HIF-1α (1:500) and VEGF (1:500) (all from Santa Cruz Biotechnology, Inc., USA) at 4°C for 12 h, and followed by secondary antibody incubation at room temperature for 2 h. The protein bands were detected using an enhanced chemiluminescence reagent kit (Sangon Biotech, Inc., Shanghai, China) and quantification was performed with the Quantity-One software (Bio-Rad Laboratories, USA). The rabbit anti-human β-actin antibody (Santa Cruz Biotechnology, Inc., USA) was used as an internal control.
Statistical analysis
Statistical analysis was conducted using SPSS 16.0 software (SPSS, Inc., Chicago, IL, USA). All data were presented as mean ± standard deviation. One-way ANOVA followed with Tukey post-hoc tests were used to compare the experimental groups. A P value < 0.05 was considered to be statistically significant.
Results
SM reduced proliferation of HepG2 and Hep3B cells under hypoxia
A MTT cell proliferation assay was performed to verify the inhibitory effect of SM on HepG2 and Hep3B cell growth under hypoxia. As presented in Figure 1, the cell proliferative ability of hypoxia group was lower than that of control group, and compared with hypoxia group, the cell proliferation ability in SM groups decreased significantly after 24 hours of treatment (all P < 0.05). Our results also demonstrated that the inhibitory effect of SM on HepG2 and Hep3B cells under hypoxia condition was positively correlated with its dose. Moreover, the MTT test showed that under hypoxia, the half inhibitory concentration (IC50) of SM on HepG2 and Hep3B cells was 58.46 umol/L and 45.71 umol/L, respectively (Figure 2).
Figure 1.

Inhibitory effect of Silymarin (SM) on proliferation of HepG2 and Hep3B cells under hypoxia. The inhibitory effect of SM on HepG2 (A) and Hep3B (B) cells under hypoxia was positively correlated with the dose. *P < 0.05 compared with hypoxia group.
Figure 2.

The half inhibitory concentration (IC50) of Silymarin (SM) on HepG2 and Hep3B cells. Under hypoxia, the IC50 of SM on HepG2 (A) and Hep3B cells (B) cells was 58.46 umol/L and 45.71 umol/L, respectively.
SM suppressed migration and invasion of HepG2 and Hep3B cells under hypoxia
Based on our above experiments, we continued to use 20 umol/L, 40 umol/L and 80 umol/L SM for subsequent experiments.
The Transwell migration and invasion assays revealed that the ability of HepG2 and Hep3B cells to pass through the basement membrane under hypoxia was significantly suppressed by SM. The number of migrated cells and invaded cells of the hypoxia group was lower than that of control group, and compared with hypoxia group, the cell numbers in each dose of SM group were significantly reduced (all P < 0.05). Moreover, the inhibitory effect of SM on HepG2 and Hep3B cell migration and invasion under hypoxia was positively correlated with its dose (Figures 3 and 4).
Figure 3.
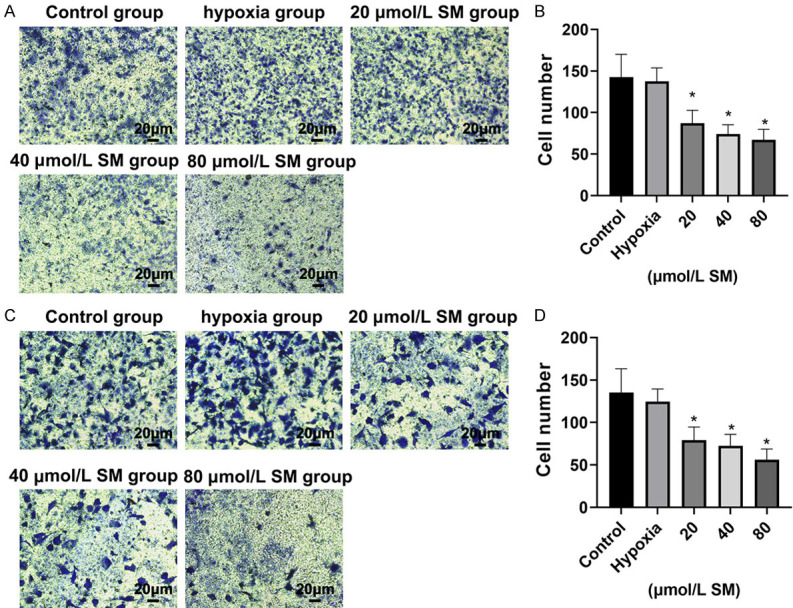
Silymarin (SM) reduced cell migration of HepG2 and Hep3B cells under hypoxia. Transwell migration assay was used to test the migration ability of HepG2 cell (A and B) and Hep3B cell (C and D) to pass through the basement membrane under hypoxia (magnification, × 40). Values represent the cell number (means ± SD) per visible field (*P < 0.05 compared with hypoxia group).
Figure 4.

Silymarin (SM) reduced the invasive ability of HepG2 and Hep3B cells under hypoxia. Transwell invasion assay was used to test the ability of HepG2 cell (A and B) and Hep3B cell (C and D) to invade the filter membrane under hypoxia (magnification, × 40). Values represent the cell number (means ± SD) per visible field (*P < 0.05 compared with hypoxia group).
SM reduced cell colony formation in HepG2 and Hep3B cells under hypoxia
The soft agar assay revealed that the clonogenesis of HepG2 and Hep3B cells under hypoxia was significantly suppressed by SM. The cell colony number of hypoxia group was lower than that of control group, and compared with hypoxia group, the cell colony number in each dose of SM group was significantly reduced (all P < 0.05). Moreover, the inhibitory effect of SM on clonogenesis of HepG2 and Hep3B cells under hypoxia was positively correlated with its dose (Figure 5).
Figure 5.

Silymarin (SM) reduced cell colony formation in HepG2 and Hep3B cells under hypoxia. SM treatment with different concentrations reduced HepG2 cell (A and B) and Hep3B cell (C and D) colony formation under hypoxia (magnification, × 40). Averaged colony numbers of three independent experiments (mean ± SD) are indicated by the histograms. Scale bar: 3 mm. *P < 0.05 compared with hypoxia group.
SM Induced apoptosis of HepG2 and Hep3B cells under hypoxia
The flow cytometry results were analyzed by FlowJo software (FlowJo, Ashland, USA). The results demonstrated that SM induced the apoptosis of HepG2 and Hep3B cells under hypoxia after 24 hours treatment. The cellular apoptosis rate was significantly higher in hypoxia group than in control group. Compared with hypoxia group, the cellular apoptosis rate in each dose of SM group increased significantly, and the increase was in a dose-dependent manner (all P < 0.05) (Figure 6).
Figure 6.

Silymarin (SM) induced apoptosis of HepG2 and Hep3B cells under hypoxia. Apoptosis of HepG2 (A and B) and Hep3B cells (C and D) was measured by flow cytometry with an Annexin V apoptosis detection kit. Averaged apoptosis rates of three independent experiments are shown as mean ± SD. *P < 0.05 compared with hypoxia group.
SM suppressed cellular HIF-1α and VEGF expression under hypoxia
The expressions of HIF-1α and VEGF in HepG2 and Hep3B cells under hypoxia was determined by real-time RT-PCR and Western blot. Compared with control group, both the gene expression and protein expression of the two molecules were increased in the hypoxia group significantly (all P < 0.05). Compared with hypoxia group, both mRNA and protein expressions of HIF-1α and VEGF were significantly downregulated in SM groups of different concentrations, and the decrease was in a dose-dependent manner (all P < 0.05) (Figures 7 and 8).
Figure 7.

Silymarin (SM) suppressed the expression of HIF-1α in HepG2 and Hep3B cells under hypoxia. HIF-1α mRNA level in HepG2 cells (A) and Hep3B cells (D) were determined by real-time reverse transcription-polymerase chain reaction (RT-PCR). Relative fold induction for HIF-1α mRNA (mean ± SD) in hypoxia and SM groups is presented relative to the expression in control group. Representative Western blot images of HIF-1α in HepG2 cells (B) and Hep3B cells (E) are shown, and the relative expression levels of HIF-1α protein in HepG2 cells (C) and Hep3B cells (F) were normalized to β-actin protein level (*P < 0.05 compared with hypoxia group).
Figure 8.

Silymarin (SM) suppressed the expression of vascular epidermal growth factor (VEGF) in HepG2 and Hep3B cells under hypoxia. mRNA level of VEGF in HepG2 cells (A) and Hep3B cells (D) were determined by real-time reverse transcription-polymerase chain reaction (RT-PCR). Relative fold induction for VEGF mRNA (mean ± SD) in hypoxia and SM groups is presented relative to the expression in control group. Representative Western blot images of VEGF in HepG2 cells (B) and Hep3B cells (E) are shown, and the relative expression levels of VEGF protein in HepG2 cells (C) and Hep3B cells (F) were normalized to β-actin protein level (*P < 0.05 compared with hypoxia group).
Discussion
PLC is a malignant tumor with high recurrence and metastasis rates, as well as a relatively poor prognosis [21,22]. Hypoxia microenvironment can contribute to tumor invasion and metastasis, as well as enhance the drug resistance of tumors including PLC [23], which is closely related to HIF-1α/VEGF pathway [12,24]. SM is a mixture of flavonoids extracted from seeds and fruits of the plant named Silybum marianum [25]. It has been used as a traditional liver protective drug for decades because of its role in promoting bile secretion, anti-inflammatory, anti-oxidation, anti-apoptosis and anti-fibrosis [26]. However, there are few reports on the effect of SM on liver cancer cells in hypoxic environment.
In this study, our results demonstrated that in a hypoxic environment, even 10 umol/L of SM could significantly inhibit the proliferation of HepG2 and Hep3B cells, and the suppressive effect was positively correlated with its dose. When SM concentration increased to 160 umol/L, the survival rates of HepG2 and Hep3B cells decreased to 4.13%. Moreover, our study demonstrated that under hypoxia, the IC50 of SM on HepG2 and Hep3B cells was 58.46 umol/L and 45.71 umol/L, respectively. A previous study found the IC50 of SM on B16-F10 melanoma cells was 67 umol/L [27], which is very close to our findings. In another study, it was reported that the IC50 of silymarin was 70 umol/L against DU145 cells [28]. These results indicate that various tumor cells, including hepatoma cells, are highly sensitive to SM, and SM has potential application value in the treatment of liver cancer. Based on above results, we continued to use different concentrations of SM (20 umol/L to 80 umol/L) for subsequent experiments, and the cell migration and invasion, colony formation experiment and flow cytometry experiment also achieved consistent research results. We found that under hypoxia, SM suppressed the migration, invasion and colony formation of HepG2 and Hep3B cells but induced cell apoptosis, and these effects were in a dose-dependent manner. When SM concentration reached 80 umol/L, the apoptosis rates of HepG2 and Hep3B cells were as high as 75.8% and 69.2%, respectively. These results are consistent with those of related studies on the anti-tumor effect of SM on PLC [29]. Due to its hepatoprotective effect and its killing effect on hepatoma cells, the development of SM as a new type of high-efficiency and low-toxicity anti-liver cancer drug has theoretical feasibility and broad application prospects.
A previous study using N-nitrosodiethylamine-induced HCC rat model reported that SM could inhibit cellular proliferation due to its ability to reduce the accumulation of β-catenin and cyclin D1, while the induction of tumor cell apoptosis was attributed to its ability to activate p53-related apoptosis [30]. Other studies reported that SM had suppressive effects on multiple cell lines via inhibition of HIF-1α/VEGF pathway. Miyazawa M et al. reported that SM suppressed HIF-1α expression under hypoxic conditions in ovarian clear-cell carcinoma cells [18]. Lin CH et al. reported that SM pretreatment inhibited HIF-1α subunit accumulation, as well as VEGF secretion in retinal pigmented epithelial cells [31]. Singh RP et al. reported the antiproliferative and proapoptotic effects of SM on human colorectal carcinoma HT29 cell were associated with down-regulated HIF-1α and VEGF expressions [32]. We thus continued to study the effect of SM on HIF-1α and VEGF expressions in HepG2 and Hep3B cells under hypoxia. Our results demonstrated both molecules at the gene transcription level and protein level were suppressed significantly by SM in a dose-dependent manner. Our results were consistent with those of other studies and suggested that SM suppressed HepG2 cells at least partly via downregulating HIF-1α/VEGF signaling. Sameri S et al. reported that SM decreased HIF-1α and VEGF expression by downregulating MAPK (ERK1/2) and Akt signaling [33]. Lin CH et al. reported that SM decreased HIF-1α and VEGF expressions via inhibiting phosphatidylinositol 3-kinase (PI3K)/Akt pathway [31]. García-Maceira P et al. reported the suppressive effect of SM on HIF-1α accumulation and VEGF release in HeLa and Hep3B cells could be potentiated by LY294002, a PI3K/Akt inhibitor [34]. Compared to these studies, a significant limitation of this study is that the detailed mechanism by which SM regulates HIF-1α and VEGF expression in the hypoxic condition has not been elucidated. In addition, our study is only an in vitro cytological test and has not been validated in animal models. Next, we will continue to conduct in-depth mechanism research and verify the relevant mechanisms through animal experiments.
In conclusion, our results provided evidence that SM exerted its antitumor effects via inhibiting HIF-1α/VEGF axis under hypoxia in a HepG2 cell line. HIF-1a/VEGF axis could be a potential drug therapy for liver cancer based on SM.
Acknowledgements
This study was supported by grants from the Key Research and Development Program of Shaanxi Province (No. 2020SF-231).
Disclosure of conflict of interest
None.
References
- 1.Yin L, He N, Chen C, Zhang N, Lin Y, Xia Q. Identification of novel blood-based HCC-specific diagnostic biomarkers for human hepatocellular carcinoma. Artif Cells Nanomed Biotechnol. 2019;47:1908–1916. doi: 10.1080/21691401.2019.1613421. [DOI] [PubMed] [Google Scholar]
- 2.Sung H, Ferlay J, Siegel RL, Laversanne M, Soerjomataram I, Jemal A, Bray F. Global cancer statistics 2020: GLOBOCAN estimates of incidence and mortality worldwide for 36 cancers in 185 countries. CA Cancer J Clin. 2021;71:209–249. doi: 10.3322/caac.21660. [DOI] [PubMed] [Google Scholar]
- 3.Bao MH, Wong CC. Hypoxia, metabolic reprogramming, and drug resistance in liver cancer. Cells. 2021;10:1715. doi: 10.3390/cells10071715. [DOI] [PMC free article] [PubMed] [Google Scholar]
- 4.Xu Q, Zhang Y, Yang Z, Jiang G, Lv M, Wang H, Liu C, Xie J, Wang C, Guo K, Gu Z, Yong Y. Tumor microenvironment-activated single-atom platinum nanozyme with H2O2 self-supplement and O2-evolving for tumor-specific cascade catalysis chemodynamic and chemoradiotherapy. Theranostics. 2022;12:5155–5171. doi: 10.7150/thno.73039. [DOI] [PMC free article] [PubMed] [Google Scholar]
- 5.Yang CB, Feng HX, Dai CL. Development and validation of an immune-related prognosis signature associated with hypoxia and ferroptosis in hepatocellular carcinoma. Cancer Med. 2022;11:2329–2341. doi: 10.1002/cam4.4556. [DOI] [PMC free article] [PubMed] [Google Scholar]
- 6.Li H, Zhao B, Liu Y, Deng W, Zhang Y. Angiogenesis in residual cancer and roles of HIF-1α, VEGF, and MMP-9 in the development of residual cancer after radiofrequency ablation and surgical resection in rabbits with liver cancer. Folia Morphol (Warsz) 2020;79:71–78. doi: 10.5603/FM.a2019.0059. [DOI] [PubMed] [Google Scholar]
- 7.Yuen VW, Wong CC. Hypoxia-inducible factors and innate immunity in liver cancer. J Clin Invest. 2020;130:5052–5062. doi: 10.1172/JCI137553. [DOI] [PMC free article] [PubMed] [Google Scholar]
- 8.Malekan M, Ebrahimzadeh MA, Sheida F. The role of hypoxia-inducible factor-1alpha and its signaling in melanoma. Biomed Pharmacother. 2021;141:111873. doi: 10.1016/j.biopha.2021.111873. [DOI] [PubMed] [Google Scholar]
- 9.Melincovici CS, Bosca AB, Susman S, Marginean M, Mihu C, Istrate M, Moldovan IM, Roman AL, Mihu CM. Vascular endothelial growth factor (VEGF) - key factor in normal and pathological angiogenesis. Rom J Morphol Embryol. 2018;59:455–467. [PubMed] [Google Scholar]
- 10.Wei H, Xu Z, Chen L, Wei Q, Huang Z, Liu G, Li W, Wang J, Tang Q, Pu J. Long non-coding RNA PAARH promotes hepatocellular carcinoma progression and angiogenesis via upregulating HOTTIP and activating HIF-1α/VEGF signaling. Cell Death Dis. 2022;13:102. doi: 10.1038/s41419-022-04505-5. [DOI] [PMC free article] [PubMed] [Google Scholar]
- 11.Xiao H, Tong R, Ding C, Lv Z, Du C, Peng C, Cheng S, Xie H, Zhou L, Wu J, Zheng S. γ-H2AX promotes hepatocellular carcinoma angiogenesis via EGFR/HIF-1α/VEGF pathways under hypoxic condition. Oncotarget. 2015;6:2180–2192. doi: 10.18632/oncotarget.2942. [DOI] [PMC free article] [PubMed] [Google Scholar]
- 12.Liao ZH, Zhu HQ, Chen YY, Chen RL, Fu LX, Li L, Zhou H, Zhou JL, Liang G. The epigallocatechin gallate derivative Y6 inhibits human hepatocellular carcinoma by inhibiting angiogenesis in MAPK/ERK1/2 and PI3K/AKT/HIF-1α/VEGF dependent pathways. J Ethnopharmacol. 2020;259:112852. doi: 10.1016/j.jep.2020.112852. [DOI] [PubMed] [Google Scholar]
- 13.Gillessen A, Schmidt HH. Silymarin as supportive treatment in liver diseases: a narrative review. Adv Ther. 2020;37:1279–1301. doi: 10.1007/s12325-020-01251-y. [DOI] [PMC free article] [PubMed] [Google Scholar]
- 14.Papackova Z, Heczkova M, Dankova H, Sticova E, Lodererova A, Bartonova L, Poruba M, Cahova M. Silymarin prevents acetaminophen-induced hepatotoxicity in mice. PLoS One. 2018;13:e0191353. doi: 10.1371/journal.pone.0191353. [DOI] [PMC free article] [PubMed] [Google Scholar]
- 15.Azadpour M, Farajollahi MM, Varzi AM, Hashemzadeh P, Mahmoudvand H, Barati M. Extraction, chemical composition, antioxidant property, and in-vitro anticancer activity of Silymarin from Silybum marianum on Kb and A549 cell lines. Curr Drug Discov Technol. 2021;18:511–517. doi: 10.2174/1570163817666200827111127. [DOI] [PubMed] [Google Scholar]
- 16.Delmas D, Xiao J, Vejux A, Aires V. Silymarin and cancer: a dual strategy in both in chemoprevention and chemosensitivity. Molecules. 2020;25:2009. doi: 10.3390/molecules25092009. [DOI] [PMC free article] [PubMed] [Google Scholar]
- 17.Khorsandi L, Saki G, Bavarsad N, Mombeini M. Silymarin induces a multi-targeted cell death process in the human colon cancer cell line HT-29. Biomed Pharmacother. 2017;94:890–897. doi: 10.1016/j.biopha.2017.08.015. [DOI] [PubMed] [Google Scholar]
- 18.Miyazawa M, Yasuda M, Miyazawa M, Ogane N, Katoh T, Yano M, Hirasawa T, Mikami M, Ishimoto H. Hypoxia-inducible factor-1α Suppression in ovarian clear-cell carcinoma cells by Silibinin administration. Anticancer Res. 2020;40:6791–6798. doi: 10.21873/anticanres.14702. [DOI] [PubMed] [Google Scholar]
- 19.Deep G, Kumar R, Nambiar DK, Jain AK, Ramteke AM, Serkova NJ, Agarwal C, Agarwal R. Silibinin inhibits hypoxia-induced HIF-1α-mediated signaling, angiogenesis and lipogenesis in prostate cancer cells: in vitro evidence and in vivo functional imaging and metabolomics. Mol Carcinog. 2017;56:833–848. doi: 10.1002/mc.22537. [DOI] [PMC free article] [PubMed] [Google Scholar]
- 20.Jung HJ, Park JW, Lee JS, Lee SR, Jang BC, Suh SI, Suh MH, Baek WK. Silibinin inhibits expression of HIF-1alpha through suppression of protein translation in prostate cancer cells. Biochem Biophys Res Commun. 2009;390:71–76. doi: 10.1016/j.bbrc.2009.09.068. [DOI] [PubMed] [Google Scholar]
- 21.Sun Q, Wu C, Fu C, Chen P, Chen C, Liu J, Li S, Zheng J. Knockout of LATS1 induces neoplastic phenotype in hepatic oval cells. Transl Cancer Res. 2020;9:3564–3572. doi: 10.21037/tcr-19-2847. [DOI] [PMC free article] [PubMed] [Google Scholar]
- 22.Zheng Y, Li Y, Feng J, Li J, Ji J, Wu L, Yu Q, Dai W, Wu J, Zhou Y, Guo C. Cellular based immunotherapy for primary liver cancer. J Exp Clin Cancer Res. 2021;40:250. doi: 10.1186/s13046-021-02030-5. [DOI] [PMC free article] [PubMed] [Google Scholar]
- 23.Bao MH, Yang C, Tse AP, Wei L, Lee D, Zhang MS, Goh CC, Chiu DK, Yuen VW, Law CT, Chin WC, Chui NN, Wong BP, Chan CY, Ng IO, Chung CY, Wong CM, Wong CC. Genome-wide CRISPR-Cas9 knockout library screening identified PTPMT1 in cardiolipin synthesis is crucial to survival in hypoxia in liver cancer. Cell Rep. 2021;34:108676. doi: 10.1016/j.celrep.2020.108676. [DOI] [PubMed] [Google Scholar]
- 24.Liu P, Atkinson SJ, Akbareian SE, Zhou Z, Munsterberg A, Robinson SD, Bao Y. Sulforaphane exerts anti-angiogenesis effects against hepatocellular carcinoma through inhibition of STAT3/HIF-1alpha/VEGF signalling. Sci Rep. 2017;7:12651. doi: 10.1038/s41598-017-12855-w. [DOI] [PMC free article] [PubMed] [Google Scholar]
- 25.Ahmed S, Ullah N, Parveen S, Javed I, Jalil NAC, Murtey MD, Sheikh IS, Khan S, Ojha SC, Chen K. Effect of Silymarin as an adjunct therapy in combination with sofosbuvir and ribavirin in hepatitis C patients: a miniature clinical trial. Oxid Med Cell Longev. 2022;2022:9199190. doi: 10.1155/2022/9199190. [DOI] [PMC free article] [PubMed] [Google Scholar]
- 26.Mohammed RA, Shawky HM, Rashed LA, Elhanbuli HM, Abdelhafez DN, Said ES, Shamardan RM, Mahmoud RH. Combined effect of hydrogen sulfide and mesenchymal stem cells on mitigating liver fibrosis induced by bile duct ligation: role of anti-inflammatory, anti-oxidant, anti-apoptotic, and anti-fibrotic biomarkers. Iran J Basic Med Sci. 2021;24:1753–1762. doi: 10.22038/IJBMS.2021.56477.12604. [DOI] [PMC free article] [PubMed] [Google Scholar]
- 27.Makhmalzadeh BS, Molavi O, Vakili MR, Zhang HF, Solimani A, Abyaneh HS, Loebenberg R, Lai R, Lavasanifar A. Functionalized caprolactone-polyethylene glycol based Thermo-responsive hydrogels of Silibinin for the treatment of malignant melanoma. J Pharm Pharm Sci. 2018;21:143–159. doi: 10.18433/jpps29726. [DOI] [PubMed] [Google Scholar]
- 28.Kacar S, Bektur Aykanat NE, Sahinturk V. Silymarin inhibited DU145 cells by activating SLIT2 protein and suppressing expression of CXCR4. Med Oncol. 2020;37:18. doi: 10.1007/s12032-020-1343-4. [DOI] [PubMed] [Google Scholar]
- 29.Feher J, Lengyel G. Silymarin in the prevention and treatment of liver diseases and primary liver cancer. Curr Pharm Biotechnol. 2012;13:210–217. doi: 10.2174/138920112798868818. [DOI] [PubMed] [Google Scholar]
- 30.Gopalakrishnan R, Sundaram J, Sattu K, Pandi A, Thiruvengadam D. Dietary supplementation of silymarin is associated with decreased cell proliferation, increased apoptosis, and activation of detoxification system in hepatocellular carcinoma. Mol Cell Biochem. 2013;377:163–176. doi: 10.1007/s11010-013-1582-1. [DOI] [PubMed] [Google Scholar]
- 31.Lin CH, Li CH, Liao PL, Tse LS, Huang WK, Cheng HW, Cheng YW. Silibinin inhibits VEGF secretion and age-related macular degeneration in a hypoxia-dependent manner through the PI-3 kinase/Akt/mTOR pathway. Br J Pharmacol. 2013;168:920–931. doi: 10.1111/j.1476-5381.2012.02227.x. [DOI] [PMC free article] [PubMed] [Google Scholar]
- 32.Singh RP, Gu M, Agarwal R. Silibinin inhibits colorectal cancer growth by inhibiting tumor cell proliferation and angiogenesis. Cancer Res. 2008;68:2043–2050. doi: 10.1158/0008-5472.CAN-07-6247. [DOI] [PubMed] [Google Scholar]
- 33.Sameri S, Mohammadi C, Mehrabani M, Najafi R. Targeting the hallmarks of cancer: the effects of silibinin on proliferation, cell death, angiogenesis, and migration in colorectal cancer. BMC Complement Med Ther. 2021;21:160. doi: 10.1186/s12906-021-03330-1. [DOI] [PMC free article] [PubMed] [Google Scholar]
- 34.García-Maceira P, Mateo J. Silibinin inhibits hypoxia-inducible factor-1alpha and mTOR/p70S6K/4E-BP1 signalling pathway in human cervical and hepatoma cancer cells: implications for anticancer therapy. Oncogene. 2009;28:313–324. doi: 10.1038/onc.2008.398. [DOI] [PubMed] [Google Scholar]