

Abstract
目的
探究基于不同磁共振序列构建的影像组学模型在直肠癌肝转移评估中的临床应用价值。
方法
回顾性纳入2015年4月−2018年5月经病理证实为直肠癌并在我院行治疗前基线磁共振检查的患者140例。根据肝脏穿刺活检、手术病理和影像结果分为肝转移组和未转移组。通过ITK-SNAP软件在T2加权图像(T2 weighted image,T2WI)、弥散加权图像(diffusion weighted image,DWI)和表观弥散系数(apparent diffusion coefficient,ADC)图像上对原发灶逐层勾画感兴趣区(region of interest,ROI)。3D ROI导入Artificial Intelligent Kit软件平台提取影像组学特征,每个序列图像提取396个特征。基于Python平台对特征数据进行预处理,使用支持向量机-合成少数类过采样法(Support Vector Machine-Synthetic Minority Over-Sampling Technique,SVM-SMOTE)对样本进行过采样,使截止随访时发生肝转移组和未发生肝转移组样本数平衡,之后按2∶1比例分为训练集和测试集。对影像组学特征进行筛选后,使用R软件构建logistic回归模型,用受试者工作特征(ROC)曲线和校准曲线对模型效果进行评价。
结果
纳入的患者中发生肝转移的有52例,截止随访时未发生肝转移的有88例,癌胚抗原(CEA)水平、MRI的T分期和N分期在肝转移组和未转移组的差异有统计学意义(P<0.05)。在对特征进行预处理和筛选后,最终,除去非影像组学特征17个,多序列联合数据集(T2WI+DWI+ADC)共筛选出32个特征,T2WI独立数据集10个特征,DWI独立数据集30个特征,ADC独立数据集15个特征。多序列联合数据集、T2WI独立数据集以及ADC独立数据集构建的模型能准确评估肝转移,训练集的ROC曲线下面积(AUC)为93.5%、89.2%、90.6%,测试集的AUC分别为80.8%、80.5%、81.4%,多序列联合数据集并未表现出高于独立数据集的AUC。DWI独立数据集表现稍差,训练集和测试集的AUC为90.3%、75.1%。校准曲线显示,联合数据集模型的波动最小,最接近参考线;3个独立数据集模型的波动范围相接近;4种模型的校准曲线均显示随着风险升高,模型预测从对风险的低估转为对风险的高估。总体而言,多序列联合数据集与独立T2WI数据集、独立ADC数据集都具有较高的AUC,而多序列联合数据集校准曲线偏离对角参考线最近,模型效果最好。独立T2WI和ADC数据集总体效果次之,独立DWI数据集效果欠佳。
结论
磁共振影像组学模型能够对直肠癌肝转移进行有效评估,为临床分期和诊治提供信息。
Keywords: 影像组学, 直肠癌, 肝转移
Abstract
Obejective
To explore the clinical value of using radiomics models based on different MRI sequences in the assessment of hepatic metastasis of rectal cancer.
Methods
140 patients with pathologically confirm edrectal cancer were included in the study. They underwent baseline magnetic resonance imaging (MRI) between April 2015 and May 2018 before receiving any treatment. According to the results of liver biopsy, surgical pathology, and imaging, patients were put into two groups, the patients with hepatic metastasis and those without. T2 weighted images (T2WI), diffusion weighted images (DWI) and apparent diffusion coefficient (ADC) images were used to draw the region of interest (ROI) of primary lesions on consecutive slices on ITK-SNAP. 3-D ROIs were generated and loaded into Artificial Intelligent Kit for extraction of radiomics features and 396 features were extracted for each sequence. The feature data were preprocessed on Python and the samples were oversampled, using Support Vector Machine-Synthetic Minority Over-Sampling Technique (SVM-SMOTE) to balance the number of samples in the group with liver metastasis and the group with no liver metastasis at the end of the follow-up. Then, the samples were divided into the training cohort and the test cohort at a ratio of 2∶1. The logistic regression models were developed with selected radionomic features on R software. The receiver operating characteristics (ROC) curves and calibration curves were used to evaluate the performance of the models.
Results
In total, 52 patients with liver metastasis and 88 patients without liver metastasis at the end of follow-up were enrolled. Carcinoembryonic antigen (CEA) and T stage and N stage evaluated on the MRI images showed statistically significant difference between the two groups (P<0.05). After data preprocessing and selecting, except for 17 non-radiomic features, the model combining T2WI, DWI and ADC features, the model of T2WI features alone, the model of DWI features alone and the model of ADC features alone were developed with 32 features, 10 features, 30 features and 15 features, respectively. The combined model (T2WI+DWI+ADC), the T2WI model, and the ADC model can assess hepatic metastasis accurately, with the area under curve (AUC) on the train set reaching 93.5%, 89.2%, 90.6% and that of the test set reaching 80.8%, 80.5%, 81.4%, respectively. The combined model did not show a higher AUC than those of the T2WI and ADC alone models. Model based on DWI features has a slightly insufficient AUC of 90.3% in the train set and 75.1% in the test set. The calibration curve showed the smallest fluctuation in the combined model, which is closest fit to the diagonal reference line. The fluctuation in the three independent data set models were similar. The calibration curves of all the four models showed that as the risk increased, the prediction of the models turned from an underestimation to an overestimating the risk. In brief, the combined model showed the best performance, with the best fit to the diagonal reference line in calibration curve and high AUC comparable to the AUC of the T2WI model and ADC model. The performance of T2WI and ADC alone models were second to that of the combined model, while the DWI alone model showed relatively poor performance.
Conclusion
Radiomics models based on MRI could be effectively used in assessing liver metastasis in rectal cancer, which may help determine clinical staging and treatment.
Keywords: Radiomics, Rectal cancer, Hepatic metastasis
结直肠癌是全球常见的恶性肿瘤之一,发病率和死亡率逐年升高,其中肿瘤发生于直肠者约占1/3[1-4]。转移的发生是直肠癌进展、恶化和死亡的重要因素,而肝脏是直肠癌转移的主要器官[3, 5]。早期发现并通过放化疗或外科手术干预治疗肝转移,可以明显改善患者预后。而受限于目前的检查手段,部分微转移灶及特征不典型的转移灶在直肠癌术前难以检出,从而延误了对转移病灶的治疗[6]。肝脏计算机断层成像(computed tomography,CT)和磁共振成像(magnetic resonance imaging,MRI) 是目前发现肝脏转移结节的主要手段,但都具有一定局限性[7-8]。CT难以区分小于10 mm的结节和血管瘤、囊肿等病灶[9-10]。而肝脏MRI图像质量受呼吸运动的影响大,常因患者状态和配合程度较差而影响小结节的检出。研究[11-12]显示,综合肿瘤原发灶病理分期和临床特征有助于评估直肠癌肝转移,但病理确切分期只能在术后得到。
近年来,影像组学以其能够高通量地提取图像特征,进而发掘肿瘤异质性和病理生理特点的优势而备受关注[13-15]。目前对于直肠癌的研究也显示出影像组学在病理分期、新辅助放化疗效果和淋巴结转移的预测中有较大潜力[16-19]。本研究通过基于原发灶的MRI影像组学特征,结合MRI的T分期、N分期和患者临床基本信息构建模型,旨在探究直肠MRI影像组学对直肠癌肝转移的评估和预测能力,及其作为参考信息在临床诊疗方案决策中的潜在价值。
1. 对象与方法
1.1. 研究对象
本研究回顾性纳入2015年4月−2018年5月在我院进行直肠MRI检查的患者,纳入标准如下:①病理证实为直肠癌;②无其他恶性肿瘤;③有治疗前完整的基线MRI图像且图像质量良好;④胸、腹、盆腔的CT图像。排除以下患者:①复发性直肠癌;②直肠黏液腺癌、神经内分泌腺癌;③基线MRI前做过相关治疗;④缺乏癌胚抗原(carcinoembryonic antigen,CEA)和糖抗原199(carbohydrate antigen 199,CA199)数据。本研究中肝转移通过MRI或CT上明显的转移特征、肝脏病灶活检或手术肝脏病灶切除病理结果确诊;判断为未转移的患者至少随访1年。年龄、性别、治疗前CEA和CA199水平和病理结果等临床基本信息通过医院信息系统获得。我院的检验方法将CEA高于3.4 ng/mL和CA199高于22 ng/mL 定义为高于正常值。本研究通过我院生物医学伦理委员会审核(2018年审140号)。
1.2. MRI影像采集
本组研究对象MRI检查均在3T磁共振检查仪(Magnetom Skyra;Siemens Healthcare,Erlangen,Germany)上进行,使用18通道相控阵体部线圈和其匹配的脊柱线圈。T2加权图像(T2 weighted image,T2WI)基于自旋回波序列,所扫描的影像包括标准矢状位、斜横断位(与直肠病灶长轴垂直)和斜冠状位(与直肠病灶长轴平行);弥散加权成像(diffusion weighted image,DWI)基于分段读出(readout-segmented echo-planar imaging,RESOLVE)方式,在斜横断位(与直肠病灶长轴垂直)上进行扫描,所对应的表观弥散系数(apparent diffusion coefficient,ADC)图像通过自动重建生成。具体扫描参数如下,斜横断位T2WI:重复时间(repetition time,TR)/回波时间(echo time,TE):6 890 ms/100 ms;视野(field of view,FOV):260 mm× 236 mm;矩阵:384 × 313;层厚:3 mm;层间距:0.9 mm;并行广义自校准并行采集(gene ralized autocalibrating partial parallel acquisition,GRAPPA)加速因子:2;不进行脂肪抑制。DWI:TR/TE:5 500 ms/61 ms;FOV:216 mm× 216 mm;矩阵:128 × 128;层厚:4.5 mm;层间距:0.45 mm;b值:0、600、1 000 s/mm2;GRAPPA加速因子:2。
1.3. 影像分析和特征提取
由一位有3年诊断经验的医生参考所有图像确定病变位置,在T2WI、DWI(b值为1 000)和ADC的斜横断位图像勾画感兴趣区(regions of interest,ROI),并对MRI肿瘤T分期(mrT stage)和N分期(mrN stage)进行评价,由一位有10年诊断经验的医生审核。两位医生对图像的分析在不知临床信息和病理结果的情况下进行。ROI的勾画在ITK-SNAP( www.itksnap.org)软件上进行,避开明显的坏死、囊腔、血管对整个肿瘤病灶逐层勾画,由各层ROI融合形成三维ROI。分割出的ROI信息导入Artificial Intelligent Kit软件(A.K. software; GE Healthcare,Shanghai,China)进行影像组学特征自动提取。每个序列图像提取396个特征,包括以下类型:直方图特征(histogram features)、形态学特征(form factor features)、灰度共生矩阵和harilick参数〔gray-level co-occurrence matrix (GLCM) and harilick features〕、游程矩阵特征〔run length matrix (RLM) features〕、灰度连通区域矩阵〔gray level size zone mtrix (GLSZM) features〕 和基于梯度的特征〔co-occurrence of local anisotropic gradient orientations (CoLIAGe) features〕。
1.4. 数据预处理和特征筛选
影像组学特征和临床信息数据处理过程基于anaconda下的python平台Jupyter lab,使用数据挖掘工具包sklearn、数据填充工具包imblearn,以及绘图工具包matplotlib等。通过以下方法进行预处理:①将非连续临床特征进行哑变量化处理,根据样本平衡性原则,将MRI肿瘤T分期划分为1~2期(mrT stage T1-2)、3期(mrT stage T3)和4期(mrT stage T4)三个组别;将MRI肿瘤N分期变量划分为无转移(mrN stage N0)和转移(mrN stage N1-2)两个组别。同时将年龄特征以整十年为一组,转变为哑变量进行分析。②对数据中的缺失值和无效值,采用邻近算法(K-Nearest Neighbor,KNN)方式进行填充,提高样本的有效利用率。③使用支持向量机-合成少数类过采样法(Support Vector Machine-Synthetic Minority Over-Sampling Technique,SVM-SMOTE)对样本进行过采样,使实验组和对照组样本数平衡,之后按照2∶1的样本数比例划分训练集和测试集。按照训练集数据均值和标准差,对两数据集进行标准化处理。
对影像组学特征通过以下方式进行筛选:①首先采用t检验和Z检验,将两项检验P值均大于0.05(标准值)的特征剔除。剔除后,筛选出多序列联合数据集(T2WI+DWI+ADC)180个特征,T2WI独立数据集21个特征,DWI独立数据集79个特征,ADC独立数据集59个特征。②对剩余特征分别进行Spearman系数判别特征间相关性关系,将相关性大于0.8的两组特征择一保留。
1.5. 模型构建
模型构建基于R软件(R Foundation for Statistical Computing,Vienna,Austria),将临床数据和筛选出的影像组学特征共同构建参数模型logistic回归。Logistic回归模型公式为:
 |
其中P为条件概率;β0是常数项,表示自变量取值全为0时,事件发生与不发生概率之比的自然对数值;
 为偏回归系数,表示当其他自变量固定的条件下,该自变量取值每改变一个单位时logit(P)的平均改变量。受试者工作特征(receiver operating characteristics,ROC)曲线和校准曲线被用于对模型效果的评估。校准曲线图中的对角线为参考线,参考线上的点表示模型预测结果与实际结果相同,偏离对角线越远表示与实际偏差越大。如果预测值等于实际值,则曲线与对角线完全重合;如果预测值大于实际值,则曲线在对角线之下,代表高估风险。如果预测值小于实际值,则曲线在对角线之上,代表低估风险。
1.6. 统计学方法
患者间分类资料的比较通过卡方检验进行,定量资料的比较通过t检验进行,P<0.05为差异有统计学意义。
2. 结果
2.1. 患者基本情况
本研究最终共纳入患者140例,其中男性96例,女性44例,平均年龄(59.85±12.32)岁。纳入的患者中发生肝转移者52例,截止随访时未发生肝转移88例。如表1所示,CEA水平、MRI的T分期和N分期在肝转移组和未转移组的差异有统计学意义(P<0.05)。
表 1. Clinical characteristics of the enrolled patients.
患者基本情况
| Characteristic | Patients with
hepatic metastasis (n=52) |
Patients without
hepatic metastasis (n=88) |
P |
| CEA: Carcinoembryonic antigen; CA199: Carbohydrate antigen 199; mrT stage: The T stage of primary site based on MR images; mrN stage: The N stage of lymph node based on MR images. | |||
| Age/yr. | 57.40±11.00 | 61.30±12.88 | 0.096 |
| Gender/case (%) | 0.613 | ||
| Male | 37 (71.2) | 59 (67.0) | |
| Female | 15 (28.8) | 29 (33.0) | |
| CEA level/case (%) | <0.001 | ||
| Normal (<3.4 ng/mL) | 9 (17.3) | 42 (47.7) | |
| Elevated (≥3.4 ng/mL) | 43 (82.7) | 46 (52.3) | |
| CA199 level/case (%) | 0.090 | ||
| Normal (<22 ng/mL) | 28 (53.8) | 60 (68.2) | |
| Elevated (≥22 ng/mL) | 24 (46.2) | 28 (31.8) | |
| mrT stage/case (%) | 0.002 | ||
| T1 | 1 (1.9) | 4 (4.5) | |
| T2 | 3 (5.8) | 10 (11.4) | |
| T3 | 23 (44.2) | 58 (65.9) | |
| T4 | 25 (48.1) | 16 (18.2) | |
| mrN stage/case (%) | <0.001 | ||
| N0 | 7 (13.5) | 43 (48.9) | |
| N1 | 23 (44.2) | 31 (35.2) | |
| N2 | 22 (42.3) | 14 (15.9) | |
| Primary tumor site/case (%) | 0.397 | ||
| <5 cm | 16 (30.8) | 18 (20.5) | |
| 5−10 cm | 23 (44.2) | 47 (53.4) | |
| >10 cm | 13 (25.0) | 23 (26.1) | |
2.2. 特征筛选
在对特征进行预处理和筛选后,最终,除去非影像组学特征17个,多序列联合的数据集共筛选出32个特征,T2WI独立数据集10个,DWI独立数据集30个,ADC独立数据集15个。
2.3. 模型构建
通过logistic回归,基于非影像组学特征和筛选出的影像组学特征构建模型,最终纳入模型的特征及其系数如表2~表5所示。所有构建的模型的ROC曲线如图1和图2所示。训练集的ROC曲线下面积(area under the curve,AUC),多序列联合数据集(T2WI+DWI+ADC)为93.5%,T2WI独立数据集为89.2%,DWI独立数据集为90.3%,ADC独立数据集为90.6%(图1)。测试集AUC,多序列联合数据集为80.8%,T2WI独立数据集为80.5%,DWI独立数据集为75.1%,ADC独立数据集为81.4%(图2)。多序列联合数据集、T2WI和ADC独立数据集的表现较好,DWI独立数据集AUC较低,多序列联合数据集未表现出高于所有独立数据集的AUC。
表 2. Radiomic features and partial regression coefficient in T2WI+DWI+ADC combined model.
多序列联合数据集(T2WI+DWI+ADC)构建模型的特征及其回归系数
| Radiomic features | β |
| β: Partial regression coefficient; CEA: Carcinoembryonic antigen; T2WI: T2 weighted image; DWI: Diffusion weighted image; ADC: Apparent diffusion coefficient; mrT stage: The T stage of primary site based on MR images; mrN stage: The N stage of lymph node based on MR images. | |
| Intercept | −0.576 |
| mrT stage T1-2 | 0.617 |
| mrT stage T3 | −0.258 |
| mrN stage N0 | −1.699 |
| mrN stage N1-2 | 0.574 |
| Primary tumor site <5 cm | 0.790 |
| Age 40-<50 yr. | −0.135 |
| Age 50-<60 yr. | 0.011 |
| Age 70-<80 yr. | −0.545 |
| Gender | 0.109 |
| CEA | 0.947 |
| T2WI ClusterProminence_AllDirection_offset1_SD | 0.322 |
| T2WI SumAverage | −0.125 |
| DWI ClusterShade_angle45_offset7 | −0.480 |
| DWI Correlation_angle45_offset4 | 0.372 |
| DWI GLCMEntropy_AllDirection_offset1_SD | 0.028 |
| DWI ShortRunEmphasis_AllDirection_offset7_SD | −0.172 |
| DWI SurfaceArea | 0.106 |
| ADC MaxIntensity | 0.119 |
| ADC MinIntensity | −0.163 |
| ADC Kurtosis | 0.222 |
| ADC ClusterShade_angle0_offset7 | 0.254 |
| ADC Correlation_AllDirection_offset4_SD | −0.149 |
| ADC Correlation_angle90_offset4 | 0.028 |
| ADC InverseDifferenceMoment_AllDirection_offset1_SD | −0.081 |
| ADC LongRunHighGreyLevelEmphasis_angle45_offset4 | −0.143 |
| ADC SurfaceVolumeRatio | −0.119 |
表 5. Radiomic features and partial regression coefficient in ADC model.
ADC独立数据集构建模型的特征及其回归系数
| Radiomic features | β |
| β, CEA, DWI, mrT stage, mrN stage: Note the same as table 2. | |
| Intercept | −0.787 |
| mrT stage T3 | −0.246 |
| mrN stage N0 | −1.283 |
| mrN stage N1-2 | 0.147 |
| Primary tumor site <5 cm | 0.859 |
| Age 40-<50 yr. | −0.364 |
| Age 50-<60 yr. | 0.462 |
| Age 70-<80 yr. | −0.156 |
| CEA | 1.278 |
| MinIntensity | −0.327 |
| Kurtosis | 0.367 |
| ClusterShade_AllDirection_offset7 | 0.243 |
| Correlation_AllDirection_offset4_SD | −0.155 |
| SurfaceVolumeRatio | −0.313 |
图 1.
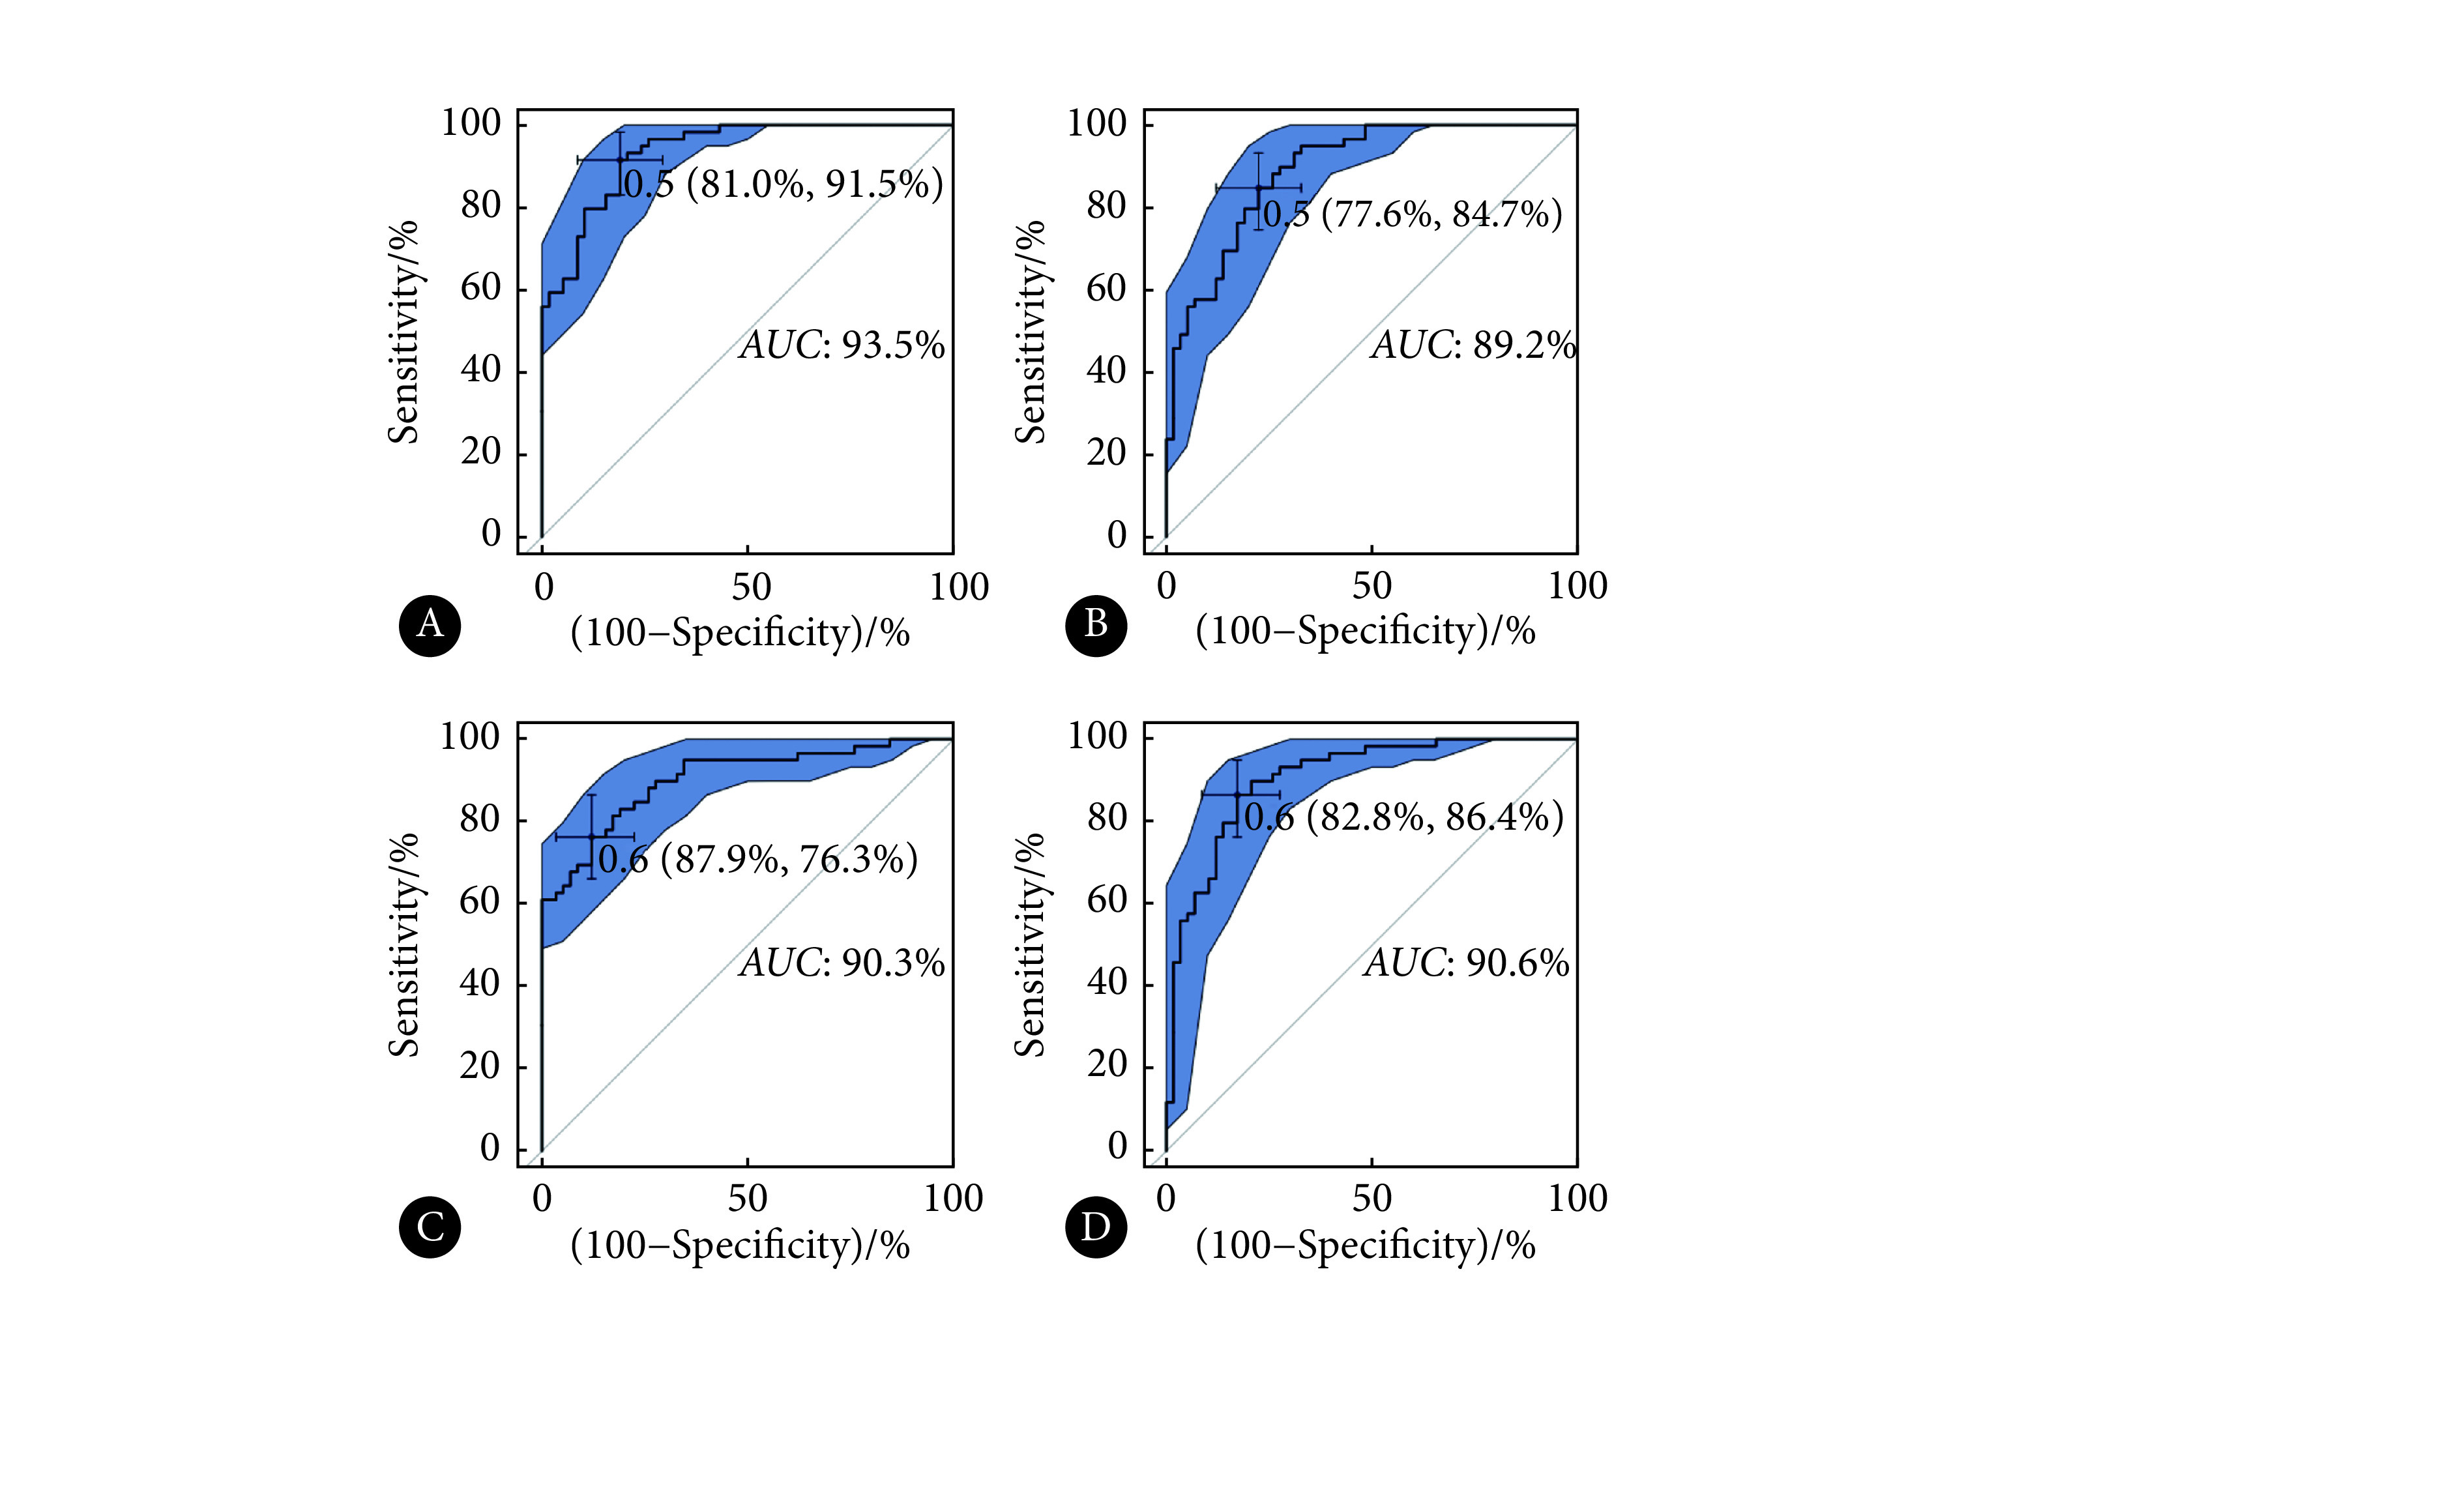
ROC curves of models in training cohort
各模型训练组的ROC曲线
A: T2WI+DWI+ADC combined model; B: T2WI model; C: DWI model; D: ADC model. Cut-off point (specificity, sensitivity) and 95%CIof AUC(boundary of blue area)are demonstrated in the figure.
图 2.

ROC curves of models in test cohorts
各模型测试组的ROC曲线
A: T2WI+DWI+ADC combined model; B: T2WI model; C: DWI model; D: ADC model. Cut-off point (specificity, sensitivity) and 95% CI ofAUC (boundary of blue area) are demonstrated in the figure.
表 3. Radiomic features and partical regression coefficient inT2WI model.
T2WI独立数据集构建模型的特征及其回归系数
| Radiomic features | β |
| β, CEA, DWI, mrT stage, mrN stage: Note the same as table 2. | |
| Intercept | −1.210 |
| mrT stage T4 | 0.457 |
| mrN stage N0 | −1.078 |
| mrN stage N1-2 | 0.426 |
| Primary tumor site <5 cm | 0.781 |
| Age 50-<60 yr. | 0.680 |
| Age 70-<80 yr. | −0.552 |
| Gender | 0.366 |
| CEA | 0.823 |
| VoxelValueSum | 0.214 |
| GLCMEntropy_AllDirection_offset4 | −0.037 |
| ShortRunEmphasis_angle0_offset7 | 0.361 |
| Maximun3DDiameter | 0.128 |
| SurfaceArea | 0.063 |
| SizeZoneVariability | 0.018 |
表 4. Radiomic features and partial regression coefficient in DWI model.
DWI独立数据集构建模型的特征及其回归系数
| Radiomic features | β |
| β, CEA, DWI, mrT stage, mrN stage: Note the same as table 2. | |
| Intercept | −0.623 |
| mrT stage T3 | −0.056 |
| mrN stage N0 | −0.897 |
| mrN stage N1-2 | 0.575 |
| Primary tumor site <5 cm | 0.766 |
| Age 50-<60 yr. | 0.214 |
| Age 70-<80 yr. | −0.437 |
| CEA | 0.722 |
| Correlation_angle45_offset4 | 0.339 |
| HarilickCorrelation_angle135_offset7 | −0.215 |
| LongRunEmphasis_AllDirection_offset4 | 0.070 |
| LongRunEmphasis_angle0_offset7 | 0.174 |
| LongRunEmphasis_angle45_offset4 | 0.135 |
| ShortRunEmphasis_AllDirection_offset7_SD | −0.306 |
| SurfaceArea | 0.066 |
| SurfaceVolumeRatio | −0.284 |
校准曲线如图3所示,各数据集校准曲线都距离参考线较近,说明预测结果与实际结果一致性较高。其中联合数据集模型的波动最小,最接近参考线;3个独立数据集模型的波动范围相接近。同时4种模型的校准曲线均显示相同的趋势,即在肝转移风险较低时,预测值小于实际值,模型一定程度上低估发生转移的风险;肝转移风险较高时,预测值大于实际值,模型一定程度上高估风险。
图 3.
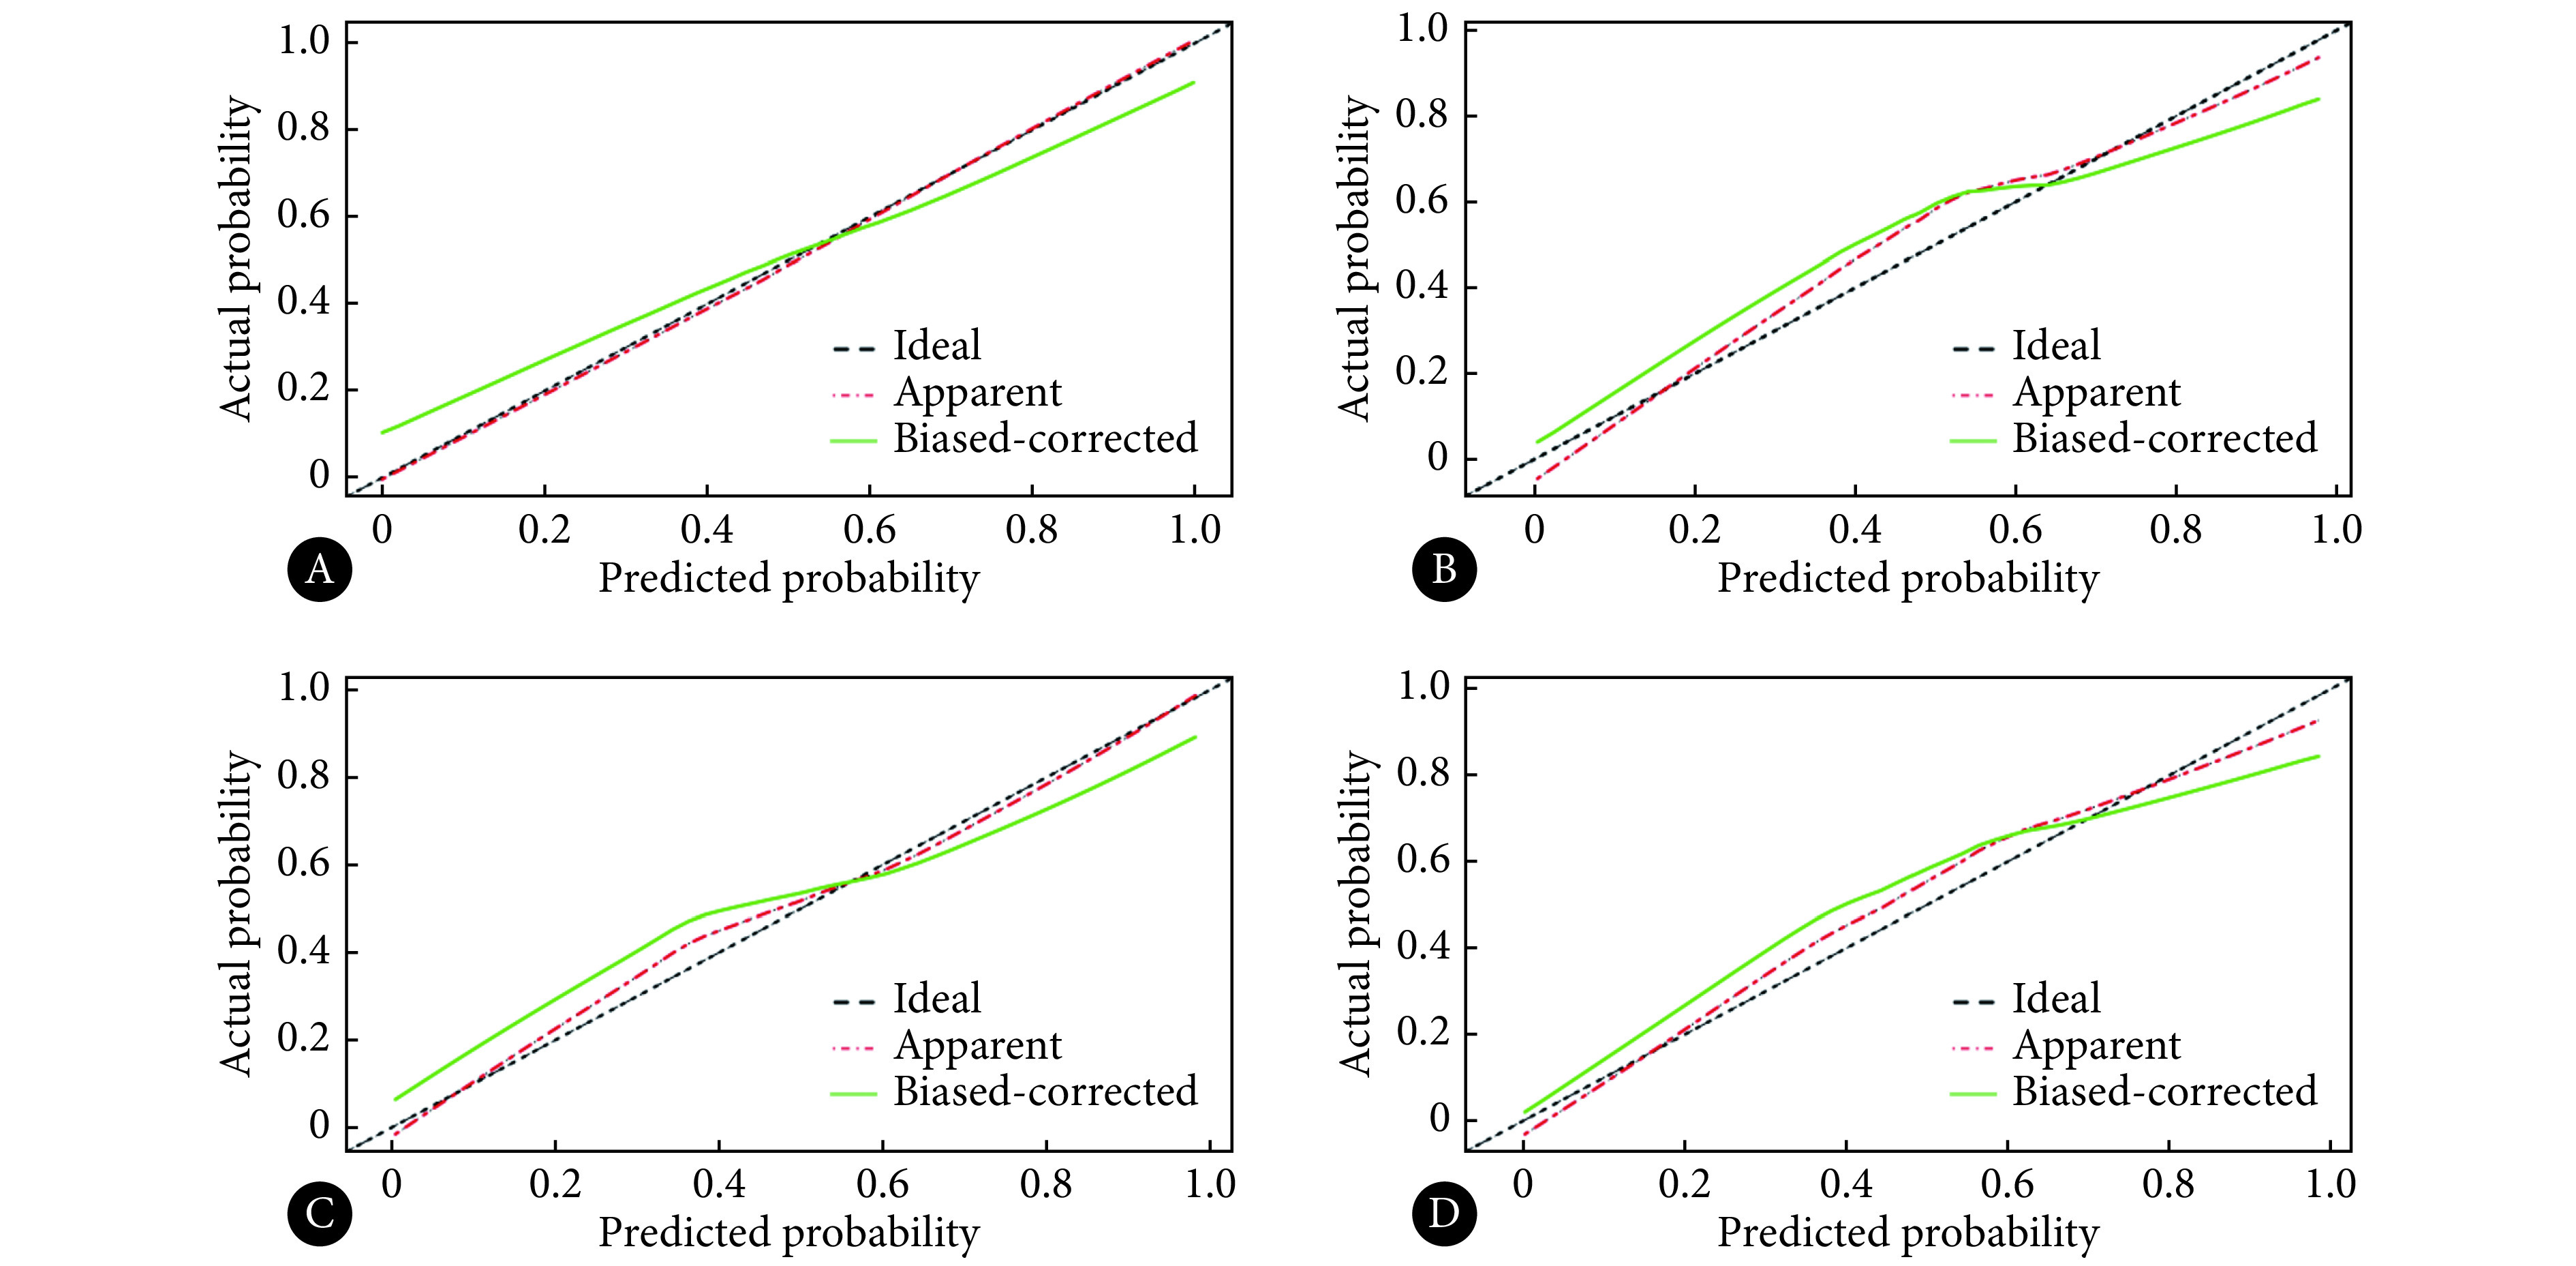
Calibration curves of models
各模型的校准曲线
A: T2WI+DWI+ADC combined model; B: T2WI model; C: DWI model; D: ADC model.
3. 讨论
早期识别肝转移并对其进行治疗,对直肠癌患者的预后有重要意义。本研究通过结合影像组学、MRI分期和临床基本信息构建模型,对直肠癌发生肝转移进行预测。盆腔磁共振是直肠癌评估的重要手段,而T2WI和DWI是直肠癌评估的常规序列[20-21]。本研究的结果表明,多序列联合数据集、T2WI和ADC独立数据集对肝转移的预测效果较优。
T2WI有良好的组织对比度,可以清晰显示原发灶形态、大小和浸润程度,从而提供与原发灶病理分期相关的特征。以往研究也认为,原发灶病理分期是肝转移预测的重要因素[11]。T2WI模型中筛选出以下的组学特征:VoxelValueSum,指ROI内像素的灰度值的总和;GLCMEntropy_AllDirection_offset4,属于GLCM特征,是从各个方向对步长为4的邻近区域的信号强度的计算;ShortRunEmphasis_angle0_offset7,指短游程的分布,是对正右方向步长为7的棒状性评估,值越大,则游程越短,图像越精细;Maximun3Ddiameter,形状特征,是将图像拟合成球形后,3D上的最大径;SurfaceArea,表面积;SizeZoneVariability,对体积形状的异质性的描述,评估ROI是否为规则的球形。与SHU等[22]通过T2WI建模的研究相比,本研究AUC稍低,可能与两个研究纳入病例的基本情况差异有关,本研究纳入的病例中,T3-4期的占比较大。此外,SHU等[22]的研究提取T2WI图像横断位最大层面绘制ROI,而我们的研究连续逐层勾画ROI,融合生成覆盖整个肿瘤的3D立体兴趣区。
而DWI及其生成的ADC图能够提供肿瘤内部环境相关的信息[23]。本研究ADC数据集的结果优于DWI数据集,这可能是由于我们在DWI图像ROI绘制中,仅使用高b值DWI图像,未体现随b值变化的弥散特征,而ADC图是通过不同b值的DWI图像计算得到。ADC值被认为是判断肿瘤侵袭性的重要无创手段[24-25]。本研究中ADC模型最终纳入的特征有MinIntensity:最小强度,与图像信号强度有关;Kurtosis:峰度,值越大,表示特征越集中;ClusterShade_AllDirection_offset7:簇影,GLCM特征,是从各个方向上对步长为7的区域的投影,与ROI形状相关,值越大,越不规则,不对称性也越突出;Correlation_AllDirection_offset4_SD:GLCM特征,从各个方向对步长为 4的区域中GLCM内灰度值与相应体素的相关性进行考察;SurfaceVolumeRatio:表面积体积比,形状特征,值越小,形状越紧密;值越大,表面突起越多,边缘越毛糙。
本研究中,多序列联合数据集、独立T2WI数据集和独立ADC数据集都具有较高的AUC且相接近,而多序列联合数据集校准曲线偏离对角参考线最近,总体上看,本研究中多序列联合数据集模型效果最好。独立T2WI和ADC数据集AUC较高,但校准曲线偏离参考线稍远,效果次之。独立DWI数据集AUC较低且校准曲线偏离参考线稍远,由此认为单独使用高b值的DWI模型进行肝转移评估效果欠佳。因此,在未来研究中应注意在多序列中选择使用更有效的序列联合进行模型构建。
本研究中多序列联合的数据集未表现出明显高于独立数据集的结果,一方面可能是因为受限于严格的纳入排除标准,本研究纳入患者数量有限(140例),单数据集影像组学特征数量为396个,而联合数据集影像组学特征数量明显增加(1 188个),更容易出现过拟合。另一方面,在联合数据集的模型中,独立数据集时效果不佳的DWI的某些影像组学特征,可能在特征筛选时表现得更为强势,这部分特征占据了模型中效果较好的T2WI和ADC数据集的某些特征的位置被选入模型,可能对整体效果造成影响。
为避免临床信息被掩盖,本研究未将临床信息与大量的影像组学特征一起进行降维,而是直接加入建模过程。结果表明,CEA水平对模型有重要贡献。以往研究也认为,CEA是提示结直肠癌进展过程的重要标志物[26-27]。
本研究存在一定的局限性。①本研究是回顾性研究;②本研究为单中心、单机型的研究,缺少外部验证;③与组学特征的数量相比,本研究纳入的样本量较小;④由于治疗方案、伦理要求并尊重患者意愿,部分肝转移的判断依靠影像学检查的典型征象而非病理结果。
本研究基于磁共振T2WI、DWI、ADC图像和临床特征构建组学模型,能在术前有效评估直肠癌患者肝转移情况,为解决微小隐匿性肝转移病灶的难以早期发现的问题提供了思路,有望为临床患者筛检、分期和诊疗方案的制订提供更多信息。
Funding Statement
四川省科技计划项目(No. 2019YFS0431)和四川大学华西医院学科卓越发展1·3·5工程项目(No. ZYGD18019)资助
Contributor Information
斯娴 胡 (Si-xian HU), Email: husixian0823@163.com.
真林 李 (Zhen-lin LI), Email: HX_lizhenlin@126.com.
References
- 1.SIEGEL R L, MILLER K D, GODING SAUER A, et al Colorectal cancer statistics, 2020. CA Cancer J Clin. 2020;70(3):145–164. doi: 10.3322/caac.21601. [DOI] [PubMed] [Google Scholar]
- 2.GOLDENBERG B A, HOLLIDAY E B, HELEWA R M, et al Rectal cancer in 2018: a primer for the gastroenterologist. Am J Gastroenterol. 2018;113(12):1763–1771. doi: 10.1038/s41395-018-0180-y. [DOI] [PMC free article] [PubMed] [Google Scholar]
- 3.许剑民, 汤文涛 朱德祥结直肠癌肝转移的治疗进展. 中华消化外科杂志. 2016;15(2):107–112. doi: 10.3760/cma.j.issn.1673-9752.2016.02.001. [DOI] [Google Scholar]
- 4.BOYLE P, FERLAY J Mortality and survival in breast and colorectal cancer. Nat Clin Pract Oncol. 2005;2(9):424–425. doi: 10.1038/ncponc0288. [DOI] [PubMed] [Google Scholar]
- 5.王崑 结直肠癌肝转移可切除性的再认识. 中华肝胆外科杂志. 2020;26(7):485–487. doi: 10.3760/cma.j.cn113884-20200421-00213. [DOI] [Google Scholar]
- 6.VAN CUTSEM E, CERVANTES A, NORDLINGER B, et al Metastatic colorectal cancer: ESMO Clinical Practice Guidelines for diagnosis, treatment and follow-up. Ann Oncol. 2014;25 (Suppl 3):iii1–iii9. doi: 10.1093/annonc/mdu260. [DOI] [PubMed] [Google Scholar]
- 7.ADAM R, DE GRAMONT A, FIGUERAS J, et al Managing synchronous liver metastases from colorectal cancer: a multidisciplinary international consensus. Cancer Treat Rev. 2015;41(9):729–741. doi: 10.1016/j.ctrv.2015.06.006. [DOI] [PubMed] [Google Scholar]
- 8.KULEMANN V, SCHIMA W, TAMANDL D, et al. Preoperative detection of colorectal liver metastases in fatty liver: MDCT or MRI? Eur J Radiol, 2011, 79(2): e1-e6 [2020-08-13]. https://doi.org/10.1016/j.ejrad.2010.03.004.
- 9.LEE K H, LEE J M, PARK J H, et al MR imaging in patients with suspected liver metastases: value of liver-specific contrast agent gadoxetic acid. Korean J Radiol. 2013;14(6):894–904. doi: 10.3348/kjr.2013.14.6.894. [DOI] [PMC free article] [PubMed] [Google Scholar]
- 10.SCHARITZER M, BA-SSALAMAH A, RINGL H, et al Preoperative evaluation of colorectal liver metastases: comparison between gadoxetic acid-enhanced 3.0-T MRI and contrast-enhanced MDCT with histopathological correlation. Eur Radiol. 2013;23(8):2187–2196. doi: 10.1007/s00330-013-2824-z. [DOI] [PubMed] [Google Scholar]
- 11.GAITANIDIS A, ALEVIZAKOS M, TSAROUCHA A, et al Predictive nomograms for synchronous distant metastasis in rectal cancer. J Gastrointest Surg. 2018;22(7):1268–1276. doi: 10.1007/s11605-018-3767-0. [DOI] [PubMed] [Google Scholar]
- 12.KANG K A, JANG K M, KIM S H, et al Risk factor assessment to predict the likelihood of a diagnosis of metastasis for indeterminate hepatic lesions found at computed tomography in patients with rectal cancer. Clin Radiol. 2017;72(6):473–481. doi: 10.1016/j.crad.2017.01.011. [DOI] [PubMed] [Google Scholar]
- 13.LAMBIN P, LEIJENAAR R T H, DEIST T M, et al Radiomics: the bridge between medical imaging and personalized medicine. Nat Rev Clin Oncol. 2017;14(12):749–762. doi: 10.1038/nrclinonc.2017.141. [DOI] [PubMed] [Google Scholar]
- 14.NAPEL S, MU W, JARDIM-PERASSI B V, et al Quantitative imaging of cancer in the postgenomic era: Radio(geno)mics, deep learning, and habitats. Cancer. 2018;124(24):4633–4649. doi: 10.1002/cncr.31630. [DOI] [PMC free article] [PubMed] [Google Scholar]
- 15.GILLIES R J, KINAHAN P E, HRICAK H Radiomics: images are more than pictures, they are data. Radiology. 2016;278(2):563–577. doi: 10.1148/radiol.2015151169. [DOI] [PMC free article] [PubMed] [Google Scholar]
- 16.LIU Z, ZHANG X Y, SHI Y J, et al Radiomics analysis for evaluation of pathological complete response to neoadjuvant chemoradiotherapy in locally advanced rectal cancer. Clin Cancer Res. 2017;23(23):7253–7262. doi: 10.1158/1078-0432.ccr-17-1038. [DOI] [PubMed] [Google Scholar]
- 17.NIE K, SHI L, CHEN Q, et al Rectal cancer: assessment of neoadjuvant chemoradiation outcome based on radiomics of multiparametric MRI. Clin Cancer Res. 2016;22(21):5256–5264. doi: 10.1158/1078-0432.ccr-15-2997. [DOI] [PMC free article] [PubMed] [Google Scholar]
- 18.CUI Y, YANG X, SHI Z, et al Radiomics analysis of multiparametric MRI for prediction of pathological complete response to neoadjuvant chemoradiotherapy in locally advanced rectal cancer. Eur Radiol. 2019;29(3):1211–1220. doi: 10.1007/s00330-018-5683-9. [DOI] [PubMed] [Google Scholar]
- 19.MA X, SHEN F, JIA Y, et al MRI-based radiomics of rectal cancer: preoperative assessment of the pathological features. BMC Med Imaging. 2019;19(1):86. doi: 10.1186/s12880-019-0392-7. [DOI] [PMC free article] [PubMed] [Google Scholar]
- 20.GOLLUB M J, ARYA S, BEETS-TAN R G, et al Use of magnetic resonance imaging in rectal cancer patients: Society of Abdominal Radiology (SAR) rectal cancer Disease-Focused Panel (DFP) recommendations 2017. Abdom Radiol (NY) 2018;43(11):2893–2902. doi: 10.1007/s00261-018-1642-9. [DOI] [PubMed] [Google Scholar]
- 21.BEETS-TAN R G H, LAMBREGTS D M J, MAAS M, et al Magnetic resonance imaging for clinical management of rectal cancer: updated recommendations from the 2016 European Society of Gastrointestinal and Abdominal Radiology (ESGAR) consensus meeting. Eur Radiol. 2018;28(4):1465–1475. doi: 10.1007/s00330-017-5026-2. [DOI] [PMC free article] [PubMed] [Google Scholar]
- 22.SHU Z, FANG S, DING Z, et al MRI-based radiomics nomogram to detect primary rectal cancer with synchronous liver metastases. Sci Rep. 2019;9(1):3374. doi: 10.1038/s41598-019-39651-y. [DOI] [PMC free article] [PubMed] [Google Scholar]
- 23.YAMASHITA Y, TANG Y, TAKAHASHI M Ultrafast MR imaging of the abdomen: echo planar imaging and diffusion-weighted imaging. J Magn Reson Imaging. 1998;8(2):367–374. doi: 10.1002/jmri.1880080216. [DOI] [PubMed] [Google Scholar]
- 24.CURVO-SEMEDO L, LAMBREGTS D M, MAAS M, et al Diffusion-weighted MRI in rectal cancer: apparent diffusion coefficient as a potential noninvasive marker of tumor aggressiveness. J Magn Reson Imaging. 2012;35(6):1365–1371. doi: 10.1002/jmri.23589. [DOI] [PubMed] [Google Scholar]
- 25.AKASHI M, NAKAHUSA Y, YAKABE T, et al Assessment of aggressiveness of rectal cancer using 3-T MRI: correlation between the apparent diffusion coefficient as a potential imaging biomarker and histologic prognostic factors. Acta Radiol. 2014;55(5):524–531. doi: 10.1177/0284185113503154. [DOI] [PubMed] [Google Scholar]
- 26.COMPTON C, FENOGLIO-PREISER C M, PETTIGREW N, et al American joint committee on cancer prognostic factors consensus conference: Colorectal Working Group. Cancer. 2000;88(7):1739–1757. doi: 10.1002/(sici)1097-0142(20000401)88:7<1739::aid-cncr30>3.0.co;2-t. [DOI] [PubMed] [Google Scholar]
- 27.THIRUNAVUKARASU P, TALATI C, MUNJAL S, et al Effect of incorporation of pretreatment serum carcinoembryonic antigen levels into AJCC staging for colon cancer on 5-year survival. JAMA Surg. 2015;150(8):747–755. doi: 10.1001/jamasurg.2015.0871. [DOI] [PubMed] [Google Scholar]