

Abstract
The CGL1 human hybrid cell system has been utilized for many decades as an excellent cellular tool for investigating neoplastic transformation. Substantial work has been done previously implicating genetic factors related to chromosome 11 to the alteration of tumorigenic phenotype in CGL1 cells. This includes candidate tumor suppressor gene FOSL1, a member of the AP-1 transcription factor complex which encodes for protein FRA1. Here we present novel evidence supporting the role of FOSL1 in the suppression of tumorigenicity in segregants of the CGL1 system. Gamma-induced mutant (GIM) and control (CON) cells were isolated from 7 Gy gamma-irradiated CGL1s. Western, Southern and Northern blot analysis were utilized to assess FOSL1/FRA1 expression as well as methylation studies. GIMs were transfected to reexpress FRA1 and in vivo tumorigenicity studies were conducted. Global transcriptomic microarray and RT-qPCR analysis were used to further characterize these unique cell segregants. GIMs were found to be tumorigenic in vivo when injected into nude mice whereas CON cells were not. GIMs show loss of Fosl/FRA1 expression as confirmed by Western blot. Southern and Northern blot analysis further reveals that FRA1 reduction in tumorigenic CGL1 segregants is likely due to transcriptional suppression. Results suggest that radiationinduced neoplastic transformation of CGL1 is in part due to silencing of the FOSL1 tumor suppressor gene promoter by methylation. The radiation-induced tumorigenic GIMs transfected to re-express FRA1 resulted in suppression of subcuta-neous tumor growth in nude mice in vivo. Global microarray analysis and RT-qPCR validation elucidated several hundred differentially expressed genes. Downstream analysis reveals a significant number of altered pathways and enriched Gene Ontology terms genes related to cellular adhesion, proliferation, and migration. Together these findings provide strong evidence that FRA1 is a tumor suppressor gene deleted and epigenetically silenced after ionizing radiation-induced neoplastic transformation in the CGL1 human hybrid cell system.
INTRODUCTION
The CGL1 cell line is a pre-neoplastic non-tumorigenic segregant from the hybridization of HeLa, a tumorigenic human cervical cancer cell, and a non-tumorigenic human skin fibroblast (1, 2). For several decades the CGL1 system has been utilized in both in vitro and in vivo studies as a unique model to study mechanisms of radiation induced neoplastic transformation (3–9). Gamma-irradiated mutant (GIM) and control (CON) segregants were isolated from CGL1 cells that had been irradiated with 7 Gy of ionizing gamma radiation (4). GIMs were found to express a previously established antigenic marker of neoplastic transformation, intestinal alkaline phosphatase (Alpi), and also formed tumors in vivo in nude mice (4). CON segregants isolated from irradiated CGL1 cells did not express Alpi and were found to be non-tumorigenic in vivo. Chromosomal and molecular studies identified a homozygous deletion on chromosome 11 in the majority of radiation-induced tumorigenic GIM cell lines. Therefore, we hypothesized that chromosome 11 may contain potential tumor suppressor genes that prevent radiation-induced tumorigenesis in the CGL1 cell model (10). We have previously performed a transcriptomic profiling study of GIM and CON cells. Here the FOSL1 gene was identified as a candidate tumor suppressor gene as its expression was found to be one of the most down regulated chromosome 11 genes in GIMs compared to CONs (11). Moreover, various other studies have also implicated a tumor suppressor locus at chromosome 11q13 with spontaneous and radiation-induced neoplastic transformation of CGL1 human hybrid cells, including the proposal of FOSL1 as a putative tumor suppressor gene at or near this locus (10, 12–16).
FOSL1 codes for the protein Fos-related antigen-1 (FRA1) and is part of the activator protein (AP-1) transcription factor family and complex. This complex also involves other members of the Fos and Jun family. The AP-1 complex and its constituents are known to influence a variety of important molecular events relevant to carcinogenesis such as cellular proliferation, invasion, metastasis, and apoptosis (17–19). It has previously been shown that molecular restructuring of the AP-1 complex can significantly influence the tumorigenic phenotype (18–22). Altered expression of the AP-1 complex, including down regulation of FOSL1 and cJun and up regulation of cFos, has been shown previously in cancer cells, including cervical cancer (19, 23–25). Microarray and sequencing experiments have previously shown that altered expression of FOSL1 can impact the expression of many genes (26).
The overall objectives of this study were to understand and characterize in vitro and in vivo the role of FOSL1/ FRA1 in the CGL1 system in the context of cancer formation and progression. Here, we show that FOSL1 mRNA and protein is expressed in all nontumorigenic CONs but lost in all radiation-induced tumorigenic GIMs. Further analysis confirmed that the observed loss of FRA1 expression in the GIMs is due to gene locus deletion and methylation of the FRA1 promoter. To directly investigate FRA1 tumor suppressor activity, FOSL1 cDNA was transfected and re-expressed in multiple tumorigenic GIM cell lines. When injected subcutaneously in nude mice these GIM-FRA1 clones were unable to induce tumors, in contrast to GIMs containing the vector control. FRA1 re-expressing GIMs were also analyzed by gene expression array to investigate on a global transcriptomic scale the effects of FRA1 reexpression in GIMs, and to investigate potential causal mechanisms for the association of FRA1 re-expression and suppression of tumorigenicity. We have previously shown utilizing transcriptomic profiling, among other molecular mechanistic findings, that cellular adhesion profiles are altered between GIMs and CONs (11). In this study we revealed that the re-expression of FRA1 in tumorigenic CGL1 segregants induces significant changes in expression of genes related to cellular adhesion, proliferation, migration and the extracellular matrix. Together these findings present novel evidence implicating FOSL1 as the tumor suppressor gene on Chromosome 11q13 that is lost or silenced after radiation-induced neoplastic transformation of CGL1 human hybrid cells.
MATERIALS AND METHODS
Cell Culture
The human hybrid cell lines were originally established and isolated as previously described (1, 2, 4). Briefly, CGL1 was isolated from the original ESH5 D98/AH2 x GM0077 hybridization. Independently isolated GIM and CON cells lines were isolated from CGL1 cells exposed to 7 Gy of γ radiation from a 137Cs source. The GIM cell lines re-expressing FRA1 (GIM12-FRA1, GIM19-FRA-1 and GIM31-FRA-1) and vector only controls (GIM12-pcDNA), GIM19-pcDNA and GIM31-pcDNA) were experimentally generated in house. Briefly, selected GIMs were transfected via a lipofectamine based reagent (Invitrogen, Thermo Fisher Scientific) with a commercially available pcDNA™3.1-FRA1/Gen plasmid or with a control/ empty pcDNA™3.1/Gen vector plasmid (Invitrogen, Thermo Fisher Scientific). After 24 to 48 h, selective antibiotic Geneticin sulfate G418 (Gibco, 11811–023) was added to the growth media and resistant clones allowed to develop. Individual resistant clones from FRA1 and vector control transfected cells were isolated, and FRA1 expression verified by Western blot analysis. All cell lines were incubated in humidity at 37°C with 5% CO2. CGL1, CON, GIM and HeLa cell lines were grown in 1X Minimum Essential Medium (Corning, 10–010CV) supplemented with 5% calf serum (Sigma, C8056) and 1% Penicillin-Streptomycin (Corning, 30–001-CI). The FRA1 re-expressing GIMs and pcDNA vector control cells lines were grown in the same media but additionally supplemented with Geneticin G418 at 300 μg mL–1. Routine cell splitting was performed with 0.05% trypsin-EDTA (Gibco, 25300) and cell counts achieved by trypan blue staining (MP, 1691049) on a hemocytometer. Tissue culture samples were tested for mycoplasma contamination using a Mycoplasma Detection Kit-QuickTest (Biotool, B39032) according to manufacturer’s instructions.
Western Blots
Proteins were isolated from each of the cell lines and were analyzed for protein expression by our standard Western blot analysis (27). Protein samples were electrophoresed in an SDS 12% polyacrylamide gels and transferred to a PVDF membrane (Millipore). The membranes were incubated with the following primary antibodies: anti-α-tubulin (cloneB-5–1-2, Sigma), anti-FRA1 anti-cJun, and anti-cFos (Santa Cruz Biotechnology). The membranes were washed and then incubated with appropriate secondary antibodies conjugated with horseradish peroxidase (Pierce, Rockford, IL). Blocking to reduce nonspecific antibody binding for both primary and secondary antibodies was done with 5% nonfat dry milk in TBS with 0.2% Tween 20. All Western blots were developed with enhanced chemiluminescence substrate (Amersham, Arlington Heights, IL) and exposed to X-ray film (Kodak). Autorads were digitized and analyzed visually or with ImageJ software (28).
Southern Blots
Genomic DNA was isolated and analyzed by our standard published procedures from each of the cell lines (10). In brief, 10 μg of genomic DNA from each cell line was digested with appropriate restriction enzyme. The digested DNAs were loaded and separated on a 0.8% agarose gels (Seakem, FMC Bioproducts, Rockland, MD), transferred to nylon membranes (Gene Screen Plus, Perkin Elmer, Boston, MA) and hybridized to random primed 32P-labeled probes of FOSL1 cDNA. After hybridization and washing, the blots were wrapped and exposed to Kodak film. Restriction length polymorphisms were analyzed either visually or scanned and analyzed with Image J software (28).
Northern Blots
Total RNA was isolated using Tri-Reagent (Sigma-Aldrich) from each of the cell lines by our published methods (10). RNA was loaded at 15 μg per lane and separated on a standard Northern gel. After transfer to a nylon membrane (Gene Screen Plus, Perkin Elmer, Boston, MA) the membranes were hybridized with 32P-labeled FOSL1 cDNA. After hybridization and washing, the Northern blots were wrapped and exposed to Kodak film (Kodak X-OMAT AR). The FOSL1 mRNA in each lane/cell line were analyzed either visually or scanned and analyzed with Image J software (28).
Electrophoretic Mobility Shift Assays
Nuclear extracts were isolated from HeLa, CGL1, CONs and GIM cell lines by our published methods (27). The nuclear protein extracts were incubated with an AP-1 oligonucleotide promoter fragment (5′-CGCTTGATGACTCAGCCGGAA-3′) obtained from Santa Cruz Biotechnology that was T4 kinase end-labelled with 32P (Perkin Elmer, Waltham, MA) and loaded onto an Electromobility Mobility Shift Assay (EMSA) gel for gel shift analysis by our published methods (27, 29). Supershift assays were done by adding the anti-FRA1, anti-cJUN, anti-cFos antibodies (Santa Cruz Biotechnology) to the nuclear protein extracts and labelled AP-1 consensus promoter fragment mixtures before loading onto the EMSA gel.
In Vivo Tumorigenicity
In vivo tumorgenicity studies were done with female nude nice purchased from Harlan following approved Indiana University IBC and IACUC protocols by published methods (27, 29). For each cell line tested 1 × 10⁷ cells per site were injected subcutaneously into the right and left flank of three nude mice for a total of six sites per cell line. Tumor presence and size was measured two times per week with calipers (L × W × H) and the animals were monitored for 30 days to assess tumor growth potential. Tumor volume was plotted versus days post-injection or tabulated as tumors that reached >100 mm3 at 30 days.
Methylation Inhibition and Bisulfite Treatment
CGL1, CON2, GIM4B, and GIM12D cells were treated with 2 μ M of methyl transferase inhibitor 5-azacytidine for 0, 24, 48 and 72 h. Protein and mRNA were isolated from GIM4B and GIM12D cells and the expression of FOSL1 mRNA and FRA1 protein were determined by Western blot and RT-PCR analysis respectively. Genomic DNA was isolated from the 5-azacytidine treated and nontreated CGL1, CON2, and GIM4B cells. PCR based analysis was performed with a primer designed to amplify sodium bisulfite treated FOSL1 promoter DNA that is unmethylated and not amplify sodium bisulfite DNA that is methylated.
Cell Morphology and In Vitro Growth
Representative photomicrographs of sub-confluent cultures in T-25 flasks were imaged on an EVOS XL Core microscope (Thermo Fisher Scientific). Cell lines were seeded into duplicate T25 tissue culture flasks at 1 × 10⁵ cells, total cells quantified by hemocytometer counts every day for 5 days (n = 3), and doubling times of each cell line calculated.
RNA Extraction for Transcriptome Analysis
Total RNA isolation was performed utilizing a kit-based extraction method. RNA was isolated using a RNeasy Mini Kit (Qiagen, 74104) with QIAshredder columns (Qiagen, 79654) including on column DNAse digestion (Qiagen, 79254) according to the manufacturer’s instructions. Purified RNA samples were eluted using nuclease free H2O. Quantity and quality of RNA was analyzed by NanoDrop spectrophotometry (Thermo Fisher, ND-1000). To prevent unwanted degradation of RNA during isolation, laboratory surfaces and instruments were decontaminated with RNase-OFF (Takara Bio, 9037).
cDNA Synthesis
cDNA was synthesized in 50 μL reactions with 2 μg DNase treated RNA and 1 μg random hexamers (Sigma, 11034731001), 2.5 μL of 10 mM per base mixed dNTPs (VWR, CA71003–178, CA71003–180, CA71003–182, CA71003–184), 10 μL of 5X M-MLV reaction buffer (Promega, M531A) and 2 μL of 200 U μL–1 M-MLV reverse transcriptase (Promega, M1708). Reaction tubes were mixed, briefly centrifuged and incubated at 37°C for 60 min. Synthesized cDNA was stored at –20C until downstream use.
Primer Design and Validation
Forward and reverse primer pairs for RT-qPCR analysis were independently designed and validated in house. Briefly, forward and reverse primer pairs for housekeeping genes and genes of interest were designed considering a base pair length of 16–25, melting temperature of 57–63°C and GC content of 50–60% to be optimal for downstream use. The reaction efficiency of each primer pair was calculated according to the formula E = [10(−1/slope)–1]. Primers with reaction efficiency between 90% to 110%, and R2 value greater than 0.99 were considered validated and acceptable for RT-qPCR analysis. In addition, optimal annealing temperature for each primer pair was identified by performing temperature gradient analysis.
RT-qPCR
For RT-qPCR experiments, SYBR green based 15μL volume reactions were performed utilizing the Quantstudio 5 RT-qPCR instrument (ThermoFisher Scientific). The final reaction mixture was prepared with 1X SensiFAST Sybr Lo-Rox mastermix (FroggaBio, CSA-01195), 600 nM forward and reverse primers and 7.5 ng of cDNA. Reactions took place in MicroAmp optical 96-well reaction plates (Applied Biosystems, N8010560) sealed with optical adhesive film (Applied Biosystems, 4360954). The thermocycling conditions included 95°C for 2 min, followed by 40 cycles at 95°C for 10 s, 57, 60 or 62°C for 15 s, 72°C for 20 s and then data readout. Following the 40 cycles, single amplicon specificity was validated by primer melt curve analysis. Cycle threshold (CT) data analysis was performed utilizing the QuantStudio™ Design and Analysis Software v1.4.1 (Applied Biosystems) with samples normalized to the geometric mean of housekeeping genes Hspc3, Rps18 and Gapdh. Relative expression of genes was calculated utilizing the ΔΔCT method using the following formula: 2ΔΔCT = 2(ΔCTgene − ΔCThousekeeping genes). Average 2ΔΔ CT and standard error of the means (SEMs) were calculated.
Human Transcriptome Array 2.0
CON1, CON2, CON3, CON5, GIM12-FRA1, GIM19-FRA1, GIM31-FRA1, as well as plasmid vector controls GIM12-pcDNA, GIM19-pcDNA and GIM31-pcDNA were subjected to transcriptomic analysis. Isolated RNA from selected cell lines was quantified by NanoDrop spectrophotometry (Thermo Fisher, ND-1000), and diluted using nuclease free H2O to 100 ng μL–1. Samples were shipped on dry ice to The Centre for Applied Genomics (TCAG) Microarray Facility at The Hospital for Sick Children, ON, Canada. Upon arrival at TCAG samples were subjected to RNA integrity analysis using either an Agilent 2100 Bioanalyzer (Agilent Technologies) or the Agilent 2200 RNA ScreenTape System (Agilent Technologies). Only samples with an acceptable RNA integrity number (>8.0) and A:260/280 as well as A:260/230 >1.95 were considered for downstream use. Experimental samples were assayed at TCAG utilizing the GeneChip Human Transcriptome Array (HTA) 2.0 (Affymetrix). Arrays were prepared with 400 ng RNA, utilizing the GeneChip WT Plus Reagent Kit (Thermo Fisher, 902280) according to manufacturer’s instructions. Biotin allonamide triphosphate was used as a labeling reagent and hybridization occurred for 16–18 h at 45°C with 5.5 μg input cDNA. Samples were washed utilizing the FS450_0001 fluidics protocol and scanned using a GeneChip Scanner 3000 (Thermo Fisher). Quality control was performed in Expression Console 1.4.1.46 (Affymetrix) to identify possible outlier samples, divergent probe intensities and signal concordance. Internal labeling and hybridization controls as well as positive vs. negative area under the curve thresholds were all required to pass quality control to be considered for analysis. Data obtained via HTA 2.0 array at TCAG were analyzed utilizing the Transcriptome Analysis Console (TAC) Software 4.0.0.25 (Thermo Fisher) and the Genome Reference Consortium Human Build 37 (hg19), as a reference genome. For data processing, sample number and statistical consideration samples were grouped for comparison: GIM-FRA1 (n = 3) vs. GIM-pcDNA (n = 3), and GIM-FRA1 (n = 3) vs. CON (n = 4). Differentially Expressed Gene (DEG) criteria were as follows,<–2 or >2 for gene fold change and <0.05 for P values.
iPG Analysis
The data (significantly impacted pathways, biological processes, molecular interactions, miRNAs, SNPs, etc.) were analyzed using Advaita Bio’s iPathwayGuide (www.advaitabio.com/ipathwayguide). This software analysis tool implements the Impact Analysis approach that takes into consideration the direction and type of all signals on a pathway, the position, role, and type of every gene, etc. as described (30, 31). Enrichment of Gene Ontology (GO) terms and significant pathways was performed in the context of the Kyoto Encyclopedia of Genes and Genomes and GO databases. Upstream regulators and network level analysis were performed in the context of the latest STRING (v.10.5) and BioGRID (v.3.4.154.) databases.
Alkaline Phosphatase Activity
Alkaline phosphatase activity was quantified using a quantitative colorimetric kit (abcam, ab83369) as per manufacturer’s instructions with a sample input of 1 × 10⁶ cells per cell line. The assay was prepared in 96-well plates and activity quantified at 405 nm using a microplate reader (Synergy HTX, BioTek).
Statistical Analysis
RT-qPCR data are presented as mean 6 SEM. Statistical comparisons between groups were performed in either SPSS (IBM) or Prism 6 (GraphPad Software Inc.) utilizing a one-way ANOVA followed by Tukey’s post-hoc analysis. A subsequent P value of < 0.05 was considered statistically significant. For comparisons between microarrays (GIM vs. CON compared to GIM-FRA1 vs. CON) a Student’s t-test with two-tailed distribution and two-sample unequal variance was performed, with a P < 0.05 considered significant. Statistical comparisons of ALP expression between FRA1 re-expressing GIMs between their parent GIM or pcDNA control were performed in Prism 9 (GraphPad Software Inc.) utilizing a one-way ANOVA The statistical approach utilized by TAC in microarray analysis while determining DEGs is outlined in the TAC User Guide (assets.thermofisher.com/TFS-Assets/LGS/manuals/tac_user_manual.pdf). In brief, one-way ANOVA (ebayes) was performed and a P < 0.05 was considered statistically significant for comparison between sample groups. For iPG analysis, the Impact Analysis method was utilized (32). Statistical methods for GO term enrichment (Elim pruning, Min DE genes/term:3), pathway, networks and upstream regulator analysis were performed as previously described, and a false discovery rate corrected P < 0.05 was considered significant for these analyses (33).
RESULTS
AP-1 Family Members are Differentially Expressed at the Gene and Protein Level
Western Blot screening of AP-1 family members (Fig. 1A) indicates loss of the FRA1 protein in the radiation induced tumorigenic GIMs compared to the non-tumorigenic CGL1s and CONs. Additionally, a loss of cJun expression and increase in cFos expression is observed in GIMs compared to CGL1 and CONs. Northern blot analysis (Fig. 1B) reveals the loss of FOSL1 mRNA expression in the radiation-induced neoplastically transformed GIMs. Isolated nuclear extracts from HeLa, CGL1, CONs and GIMs were incubated with a 32P end-labeled AP-1 consensus promoter fragment and loaded onto an EMSA gel for gel shift analysis (Fig. 1C). In the left panel, we show that the CGL1 and CON AP-1 gel shift appears more robust than the GIM AP-1 gel shifts. In the right panel, we show that when the CGL1, CON2, GIM5C, and GIM30DE extracts were incubated with an antibody against FRA1 only CGL1 and CON2 extracts demonstrated an AP-1 supershift which is not observed in the tumorigenic GIMs. EMSA gel shifts as well as EMSA supershifts with antibodies against either FRA1 (+) or cFos (++) were also performed using nuclear extracts isolated from CGL1, CON 4 and GIM 5B (Fig. 1D). We again observe that FRA1 is super shifted with FRA1 (+) antibody in the nontumorigenic CGL1 and CON4 cell lines. In addition, we show that cFos (++) is shifted in the tumorigenic GIM5B. We then examined whether cJun was present in AP-1 gel shift in CGL1, CONs 2 and 4, and GIMs 5B and 30DE (Fig. 1E). The data indicated that cJun was active and bound the AP-1 consensus sequence in both nontumorigenic CGL1, CON2, and CON4 cells and in the tumorigenic GIM5C and GIM30D cell lines, but significantly reduced in the GIMs. Taken together, these results demonstrate that FRA1 is part of the AP1 complex in non-tumorigenic cells, whereas in radiation induced tumorigenic cells, FRA1 expression is lost, and therefore is absent from the AP-1 complex. In addition, cFos demonstrates reciprocal expression pattern to FRA1. Here, absence of FRA1 in tumorigenic cells is accompanied by increased expression and presence of cFos in AP-1 complex of the tumorigenic cells.
FIG. 1.

AP-1 family members are differentially expressed at the gene and protein level in tumorigenic cell segregants. Panel A: Western blots for AP-1 transcription factor complex family members. Panel B: Northern blot validates loss of FRA1 expression in GIMs (panel B). Panel C: Altered AP-1 gel shifts in nontumorigenic CGL1 and CONs as compared to tumorigenic GIMs and HeLa (FP = free probe). Right-side panel EMSA gel shift confirms FRA1 is expressed and actively bound to the AP-1 promoter consensus sequence in CGL1 and CONs but not observed in GIMs (Ab-FRA1 = with FRA1 antibody). Panel D: AP-1 family member FRA1 (+) is supershifted in CGL1 and CONs while cFOS (++) can only be super shifted in GIMs. (E) cJUN (+) is active and binds to the AP-1 consensus sequence in nontumorigenic CGL1 and CONs as well as tumorigenic GIMs.
Re-Expression of FRA1 in GIM Cell Lines Alters the Expression Profile of AP-1 Transcription Factor Complex Family Members
In Fig. 2, we show that the FRA1 re-expressing GIMs show a significant increase in FOSL1 (FRA1) and cJun gene expression, and a reduction (non-significant) in cFos expression (Fig. 2A–C). Microarray analysis corroborated these findings (Fig. 2D). Here, GIM-pcDNA vs. CON compared to GIM-FRA1 vs. CON shows the shift in expression profile of Jun, Fos and FOSL1, whereas the expression of other AP-1 members are unaltered. A shift in expression profiles of cFos, cJun and FRA1 have been previously implicated as having an important role in FRA1 have been previously implicated as having an important role in influencing processes such as cellular proliferation, tumor invasion and transformation in cancer (19, 21, 22, 24, 34, 35).
FIG. 2.

Re-expression of FRA1 in GIM cell lines alters the expression profile of AP-1 transcription factor complex family members. Reexpression of FRA1 in GIM19 shifts AP-1 family member’s (panel A) FRA1, (panel B) cFOS and (panel C) cJUN expression profiles at the mRNA level. Panel D: Microarray analysis reveals FRA1 alters expression of multiple AP-1 family members FRA1 re-expressing GIMs (*P < 0.05, **P < 0.005), NS = not significant (P value).
Re-Expression of FRA1 in GIMs Affects Growth Rate and Cell Morphology In Vitro
The non-tumorigenic CON cells demonstrate fibroblast like morphology, whereas the tumorigenic GIM cells show an epithelial-like phenotype (Fig. 3A). The re-expression of FRA1 in GIMs alters the morphology of the cultures grown in vitro (Fig. 3A) as seen in representative GIM19 image, resulting in a more non-tumorigenic epithelial-like phenotype. Moreover, analysis of growth and doubling times reveal that FRA1 re-expressing GIM19s have similar response to CON cells in that a plateau in growth is observed (Fig. 3B) as cells reach confluency. However, the tumorigenic GIM19 and GIM19-pcDNA cells grow faster than the CON cells and demonstrate doubling times of 17 ± 4 h and 18 ± 3 h respectively, and do not appear to plateau by 5 days. The calculated doubling times for each cell line (Fig. 3C) reveal that the re-expression of FRA1 in GIM19 slows the doubling time to 23 ± 4 h very similar to the CON2 doubling time of 24 ± 2 h.
FIG. 3.
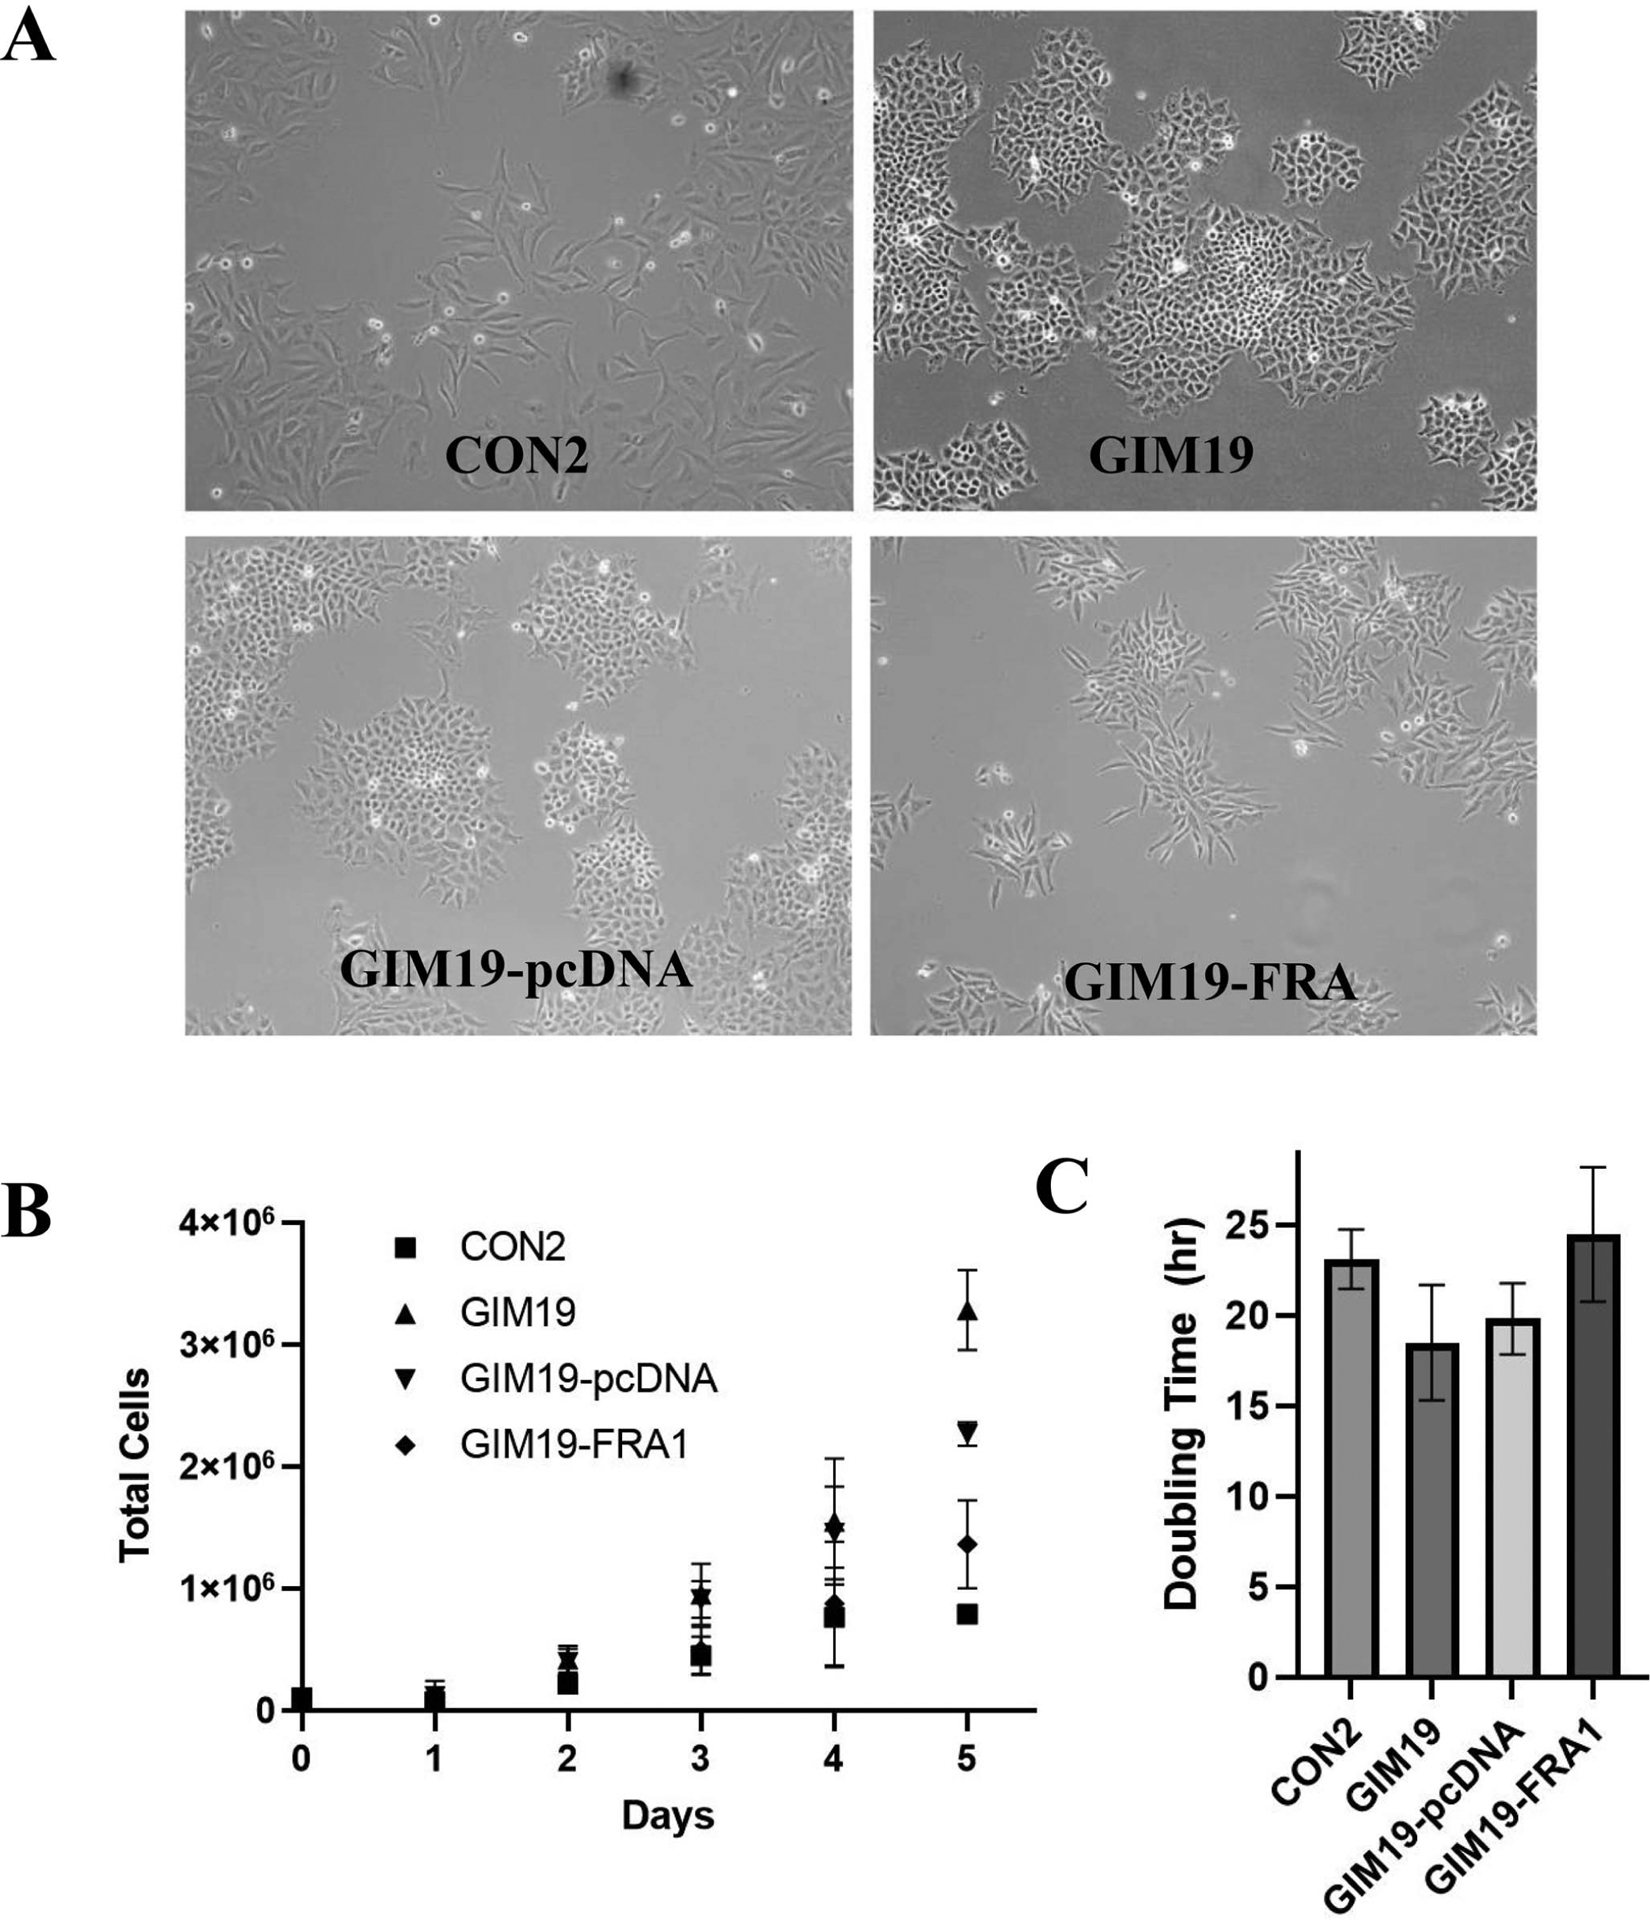
Re-expression of FRA1 in GIMs affects growth rate and cell morphology in vitro. Panel A: Representative photomicrographs of cell lines. Panel B: Five-day growth curve of cell lines and (panel C) calculated doubling times.
Transcriptomic Analysis and Alkaline Phosphatase Expression
Initial whole transcriptome analysis of GIM-FRA1 re-expressing clones compared to GIM-pcDNA clones revealed 365 DEGs meeting threshold filter criteria (Fig. 4A). Of this 225 were up-regulated and 140 down-regulated with greater than 75% of DEGs coding transcripts. FOSL1 was found to be the most statistically significant DEG in the comparison of GIM-FRA1 to GIM-pcDNA, and Alpi the second most downregulated gene (Fig. 4A, Table 1). Re-expression of FRA1 reduces levels of Alp expression below that of their corresponding pcDNA control in GIMs (Fig. 4B). Significant reduction in gene level expression of Alpi (Fig. 4C) was confirmed by RT-qPCR analysis. Microarray analysis (Fig. 4D) of GIM-pcDNA vs. CON compared to GIM-FRA1 vs. CON corroborated the Alpi results, however other alkaline phosphatase family members were not significantly reduced. The expression of Alpi has been previously established and validated in these cells as the invariable indicator of the tumorigenic phenotype. Therefore, reduced Alpi expression with re-expression of FRA1 in tumorigenic cells suggests that FRA1 may play an important role in suppressing tumorigenicity (4, 36).
FIG. 4.

Microarray analysis of FRA Re-expressing GIMs elucidates 365 DEGs and the suppression of invariable tumorigenic marker intestinal alkaline phosphatase. Panel A: Microarray analysis of GIM-FRA vs. GIM-pcDNA cell lines elucidates 365 up- (red) or down- (green) regulated DEGs. Panel B: ALP activity in CGL1, CON, GIM, GIM-pcDNA3 and GIM-FRA re-expressing and HeLa cell lines. Panel C: qRT-PCR validation that FRA1 re-expression suppresses invariable tumorigenic marker ALPI in GIMs (**P < 0.005). Panel D: Microarray analysis reveals FRA1 reduces expression of multiple alkaline phosphatases in FRA1 re-expressing GIMs (*P < 0.05).
TABLE 1.
Top 10 Down and Up-Regulated DEGs Includes ALPI as One of the Most Significantly Down-Regulated Genes in FRA1 Re-Expressing GIMs Compared to pcDNA Controls
| Fold change | P value | Gene symbol |
|---|---|---|
| −70.73 | 0.0001 | PI15 |
| −26.42 | 0.0073 | ALP1 |
| −6.97 | 0.0491 | HTRA3 |
| −6.2 | 0.0128 | H19; MIR675 |
| −5.43 | 0.0499 | |
| −5.33 | 0.0169 | ALPPL2 |
| −5.01 | 0.0205 | FAM102B |
| −4.66 | 0.0169 | LGSN |
| −4.49 | 0.0446 | MAMDC2 |
| −4.3 | 0.0423 | SCARA3 |
| 8.76 | 0.0026 | PSG5; PSG3 |
| 9.21 | 0.0003 | KRT80 |
| 10.68 | 0.0034 | ITGA2 |
| 11.1 | 0.0244 | FST |
| 17.92 | 0.0167 | LOC541472 |
| 20.72 | 0.008 | IR7R |
| 24.91 | 0.0131 | GDF15 |
| 26.71 | 6.81E-5 | LOC101927501 |
| 29.79 | 0.0011 | DKK1 |
Re-Expression of FRA1 in GIMs Alters the Expression Profile of AP-1 Complex Family Members and Suppresses Tumorigenicity In Vivo
As described above, the tumorigenic GIM cell lines re-expressing FRA1 (GIM12-FRA1, GIM19-FRA1 and GIM31-FRA1) and vector controls (GIM12-pcDNA), GIM19-pcDNA and GIM31-pcDNA) were generated in house. Independent FRA1 re-expressing GIM clones or vector controls were isolated and screened via Western blot for FRA1 expression (Fig. 5A). Western blotting confirmed robust expression of FRA1 protein in CGL1 and FRA1 re-expressing GIM clones but is highly reduced in GIM pcDNA vector controls. These clones were expanded for tumorigenicity testing by subcutaneous injection in nude mice. Here 1×10⁷ cells were injected subcutaneously into right and left flank of mice (n = 3) for a total of six sites per cell line. Representative in vivo tumor volume growth data for GIM19, GIM31 and GIM12 are presented (Fig. 5B and C) showing suppression of tumor growth in FRA1 re-expressing GIMs. For all GIMs injected into nude mice 6/6 sites had tumors ≥100 mm3 at day 30, however for all FRA1 re-expressing GIMs this was 0/6 showing robust suppression of tumor formation.
FIG. 5.

Re-expression of FRA1 in GIMs suppresses tumorigenicity in vivo. Panel A: Expression of FRA1 protein in clones of GIM19E, Gim31DA, and GIM 12D cells that were transfected with a pcDNA3 vector control or pcDNA3-FRA1 vector and clones were isolated. FRA1 protein levels were determined by Western blot. Panel B: The vector control and FRA1 expressing clones were tested for tumorgenicity by injecting 107 cells of each cell type subcutaneously into the right and left flank of nude mice (n = 3) for a total of six sites per cell line. Representative tumor growth profiles of pcDNA control and FRA1 re-expressing GIM clones are shown. Panel C: Re-expression of FRA1 in GIMs 19E, 31DA, and 12D suppressed tumor growth in vivo. *P < 0.05, **P < 0.01 (t-test, two-tailed).
FOSL1 is Methylated and Expression is Suppressed after Gamma Radiation-Induced Neoplastic Transformation
Previously published analysis of the GIMs by chromosome painting as well as Southern Blot and PCR-based genomic DNA analysis of the tumorigenic GIMs have clearly shown that the GIMs have lost one or the other copy of fibroblast chromosome 11 (10). It was unclear whether the other copy of the proposed tumor suppressor allele was intact. In Fig. 6A a Southern blot restriction fragment length polymorphism (RFLP) analysis was performed using genomic DNA cut with HindIII isolated from the nontumorigenic parental CGL1 cells and eight of the tumorigenic GIMs is shown. There is visual and densitometric evidence of reduced intensity of the hybridized 32P-labeled probes designed for FOSL1, suggesting loss of at least one of the FRA1 alleles on chromosome 11 in the majority of the GIM cells (GIMS 5C, 18A, 19E, 30DE, and 31DA). These results match previous chromosomal painting studies (37). In addition, this FOSL1 RFLP analysis also demonstrates the presence of at least one intact copy of the FOSL1 gene in the remaining genomic DNA with no major evidence of deletion or genomic rearrangement. We hypothesized that the intact copy of FOSL1 may have been silenced by promoter methylation. To test his hypothesis, GIMs were treated with 2 μM of methyl transferase inhibitor 5-azacytidine for 0, 24, 48 and 72 h. PCR (Fig. 6B) and Western blot (Fig. 6C) analysis show clearly that treatment with 5-AZA results in the re-expression of FOSL1/FRA1 mRNA and protein respectively. Methylation promoter status by PCR was performed on cells following bisulfite treatment (Fig. 6D). PCR primers were designed to amplify the unmethylated FOSL1 promoter sequence. After bisulfite treatment, there is clear evidence of amplification of the unmethylated FOSL1 promoter sequence in the nontumorigenic CGL1 and CONs which express FRA1, but the primers were unable to amplify the methylated FOSL1 promoter in the tumorigenic GIM4B, which does not express the FOSL1 mRNA or FRA1 protein. Taken together, these results demonstrate that the intact copy of the FOSL1 tumor suppressor gene is silenced by promoter methylation.
FIG. 6.

FRA1 is methylated and expression is suppressed after gamma-radiation-induced neoplastic transformation. Panel A: Southern blot shows loss of FRA expression is not due homozygous loss or rearrangement of the FRA1 genomic DNA. Panels B and C: FRA1 expression is induced in GIMs by treatment with methyl transferase inhibitor 5-azacytidine (+) at the mRNA and protein level. Panel D: PCR-based methylation analysis of the FRA1 promoter with (T) and without (U) sodium bisulfite treatment.
Exploratory Grouping, Principal Component and Transcriptomic Analysis
Exploratory grouping and principal component analysis of GIM-FRA1, GIM-pcDNA and CON cell lines showed that they group closely within their associated cell type (Fig. 7A and B). There is discrete grouping with the three principal components accounting for 71.1% of dataset variance. More importantly, the FRA1 re-expressing GIMs and the GIM-pcDNA cell lines demonstrate distinct clustering into spatially disparate regions. This emphasizes that FRA1 repression alters various gene changes at the global scale.
FIG. 7.

Exploratory grouping and principal component analysis of GIM-pcDNA, GIM-FRA1 and CON cell lines. Exploratory grouping (panel A) and principal component (panel B) analysis of GIM-pcDNA, GIM-FRA and CON cell lines.
In our previous transcriptome study analyzing GIM vs. CON, Pi15 was found to be the fourth highest and Il7R the third most downregulated genes out of over 1,000 DEGs (11). This current study reveals that FRA1 re-expression has a significant influence on the expression of these genes (Table 1). Here, re-expression of FRA1 in GIM cells reduced Pi15 expression (70 fold), whereas Il7r expression is elevated 20 fold. Significantly impacted GO terms in GIMs re-expressing FRA1 included negative regulation of cell proliferation, integrin binding, focal adhesion, anchored component of the membrane, basal part of cell and proteoglycan binding based on DEGs (Table 2). Analysis of GIM-FRA1 cells compared to GIM-pcDNA revealed shifts in expression of genes associated to ECM ligands and related integrins (Fig. 8A and B). Fibronectin integrins Itga4 and Itga5 were significantly affected by the re-expression of FRA1. Many of the top 10 significantly enriched biological process, molecular function and cellular component GO terms were related to these changes (Table 2). Significant downregulation of Lama1 in GIM-FRA1 compared to GIMpcDNA was confirmed by RT-qPCR analysis (Fig. 9B). The up-regulation of Rhob and significant down-regulation of Rhov were observed by RT-qPCR in comparison of GIM-FRA1 to GIM-pcDNA (Fig. 9C and D). GIM vs. CON microarray analysis compared to GIM-FRA1 vs. CON additionally indicated reduction in multiple genes related to cellular migration and adhesion including Rhob, Rhof, Rhov, Myo1e and substantial downregulation of Mylk3. In addition, cell adhesion molecules were predicted to be one of the most significantly impacted pathways in iPG analysis (Table 3).
TABLE 2.
Top Enriched GO Terms for Molecular Functions, Biological Processes and Cellular Components
| GO term | Molecular functions | No. genes (DEG/ALL) | P value |
|---|---|---|---|
| GO:0004035 | Alkaline phosphatase activity | 3/4 | 6.40E-06 |
| GO:0047144 | 2-acylglycerol-3-phosphate O-acyltransferase activity | 3/9 | 1.30E-04 |
| GO:0043236 | Laminin binding | 4/29 | 3.50E-04 |
| GO:0003841 | 1-acylglycerol-3-phosphate O-acyltransferase activity | 3/19 | 1.36E-03 |
| GO:0008083 | Growth factor activity | 7/158 | 2.69E-03 |
| GO:0005178 | Integrin binding | 5/110 | 9.72E-03 |
| GO:0043394 | Proteoglycan binding | 4/38 | 1.83E-02 |
| GO:0005160 | TGFβ receptor binding | 3/48 | 1.89E-02 |
| GO:0019899 | Enzyme binding | 36/2,079 | 3.16E-02 |
| GO:0042826 | Histone deacetylase binding | 4/103 | 3.35E-02 |
| GO:0048649 | Anatomical structure formation involved in merphogenesis | 27/990 | 1.69E-03 |
| GO:0032496 | Response to lipopolysaccharide | 12/307 | 1.69E-03 |
| GO term | Biological process | No. gene (DEG/ALL) | P value |
| GO:0007565 | Female pregnancy | 11/185 | 1.20E-05 |
| GO:0001889 | Liver development | 9/20 | 2.20E-05 |
| GO:0008285 | Negative regulation of cell proliferation | 20/666 | 1.20E-04 |
| GO:0009612 | Response to mechanical stimulus | 10/206 | 1.70E-04 |
| CO:0070673 | Response to interleukin-18 | 3/10 | 1.80E-04 |
| CO:0051592 | Response to calcium ion | 7/115 | 4.20E-4 |
| CO:0030512 | Negative regulation of TGFβ receptor signaling pathway | 5/67 | 1.15E-03 |
| CO:0001936 | Regulation of endothelial cell proliferation | 6/103 | 1.36E-03 |
| CO:0048646 | Anatomical structure formation involved in morphogensis | 27/990 | 1.59E-03 |
| CO:0032496 | Response to lipopolysaccharide | 12/30 | 1.69e-03 |
| GO term | Cellular components | No. genes (DEG/ALL) | P value |
| GO:0009897 | External side of plasma membrane | 10/248 | 6.60E-04 |
| GO:0031093 | Platelet alpha granule lumen | 5/66 | 1.01E-03 |
| GO:0005911 | Cell-cell junction | 13/409 | 1.01E-03 |
| GO:0000786 | Nucleosome | 5/86 | 3.27E-03 |
| GO:0005925 | Focal adhesion | 11/382 | 5.15E-03 |
| GO:0070062 | Extracellular exosome | 44/2,665 | 8.79E-03 |
| GO:0031225 | Anchored component of membrane | 6/154 | 9.24E-03 |
| GO:0045178 | Basal part of cell | 4/46 | 1.42E-02 |
| GO:0016324 | Apical plasma membrane | 8/286 | 1.88E-02 |
| GO:0005903 | Brush border | 4/95 | 2.48E-02 |
FIG. 8.

Microarray of ECM ligands, receptors and phosphodiesterases in FRA1 Re-expressing GIMs. Panel A: Microarray expression profiles of ECM ligands (panel B) receptors and (panel C) AP-1 complex family members. Panel D: Representative qPCR validation of PDE DEG revealed in transcriptomic anaylsis (*P < 0.05, **P < 0.005).
FIG. 9.

Representative qPCR validation of DEGs revealed in transcriptomic analysis of FRA re-expressing GIMs. Representative qPCR validation of DEGs revealed in transcriptomic analysis for (panel A) ECM components, (panel B) PDEs as well as (panels C, D) genes related to migration (*P < 0.05, **P < 0.005).
TABLE 3.
Top Predicted Impacted Pathways
| Impacted pathway | P value |
|---|---|
| Proteoglycans in cancer | 2.36E-03 |
| AGE-RAGE signaling pathway in diabetic complications | 8.35E-03 |
| Inflammatory bowel disease (IBD) | 8.35E-03 |
| Regulation of acting cytoskeleton | 8.35E-03 |
| TGF-beta signaling pathway | 8.35E-03 |
| Thiamine metabolism | 8.35E-03 |
| Cell adhesion molecules (CAMs) | 8.35E-03 |
| FoxO signaling pathway | 8.35E-03 |
| TNF signaling pathway | 1.57E-02 |
| Transcriptional misregulation in cancer | 1.77E-02 |
FRA1 regulation has previously been shown to be influenced by phosphorylation and phosphodiesterases in cancer cells (11, 38). The downregulation of PDEs 3B, 7B, 1A and 10A in GIM-FRA1 cells compared to GIMpcDNA was observed in RT-qPCR analysis (Fig. 9A). qPCR validation of a representative PDE DEGs (Figs. 8D and 9A) confirms the directionality of the gene expression shift.
DISCUSSION
AP-1 Family Members are Differentially Expressed at the Gene and Protein Level
Western Blot screening of AP-1 family members (Fig. 1A) indicates complete loss of the FRA1 protein in the radiation induced tumorigenic GIMs compared to the control radiation exposed, non-tumorigenic CONs. This expression pattern is expected in a candidate tumor suppressor gene. Northern blot analysis (Fig. 1B) reveals the loss of FOSL1 expression in the radiation-induced neoplastically transformed GIMs appears to be transcriptional due to loss of FOSL1 mRNA expression. We have previously hypothesized based on our published data that the proposed tumor suppressor allele/gene would be a negative transcriptional regulator (11), and FOSL1, a member of the AP-1 family fits that profile (26). EMSA gel shift results (Fig. 1C) show that FRA1 is not only expressed in nontumorigenic CGL1 and CON2, but that it actively bound the AP-1 promoter consensus sequence. In the absence of FRA1 in tumorigenic GIM cells, cFos expression is increased and is actively bound to AP-1 promoter regions. Moreover, the expression of AP-1 complex family members at the gene and protein level are significantly altered when FRA1 is re-expressed in tumorigenic GIMs (Figs. 1A and 2). Taken together, our results demonstrate that re-expression of FRA1 in GIMs reverts these expression patterns of the AP-1 complex back to CON like levels.
FRA1 is a member of the AP-1 transcription factor complex, which also involves other members of the Fos and Jun family. The AP-1 complex is known to influence a variety of important molecular events relevant to carcinogenesis such as cellular proliferation, invasion, tumor metastasis and apoptosis (18, 19, 34). RT-qPCR showed that GIM-FRA1 cells significantly upregulate AP-1 complex family members cJUN and FOSL1 when compared to vector controls whereas cFos was observed to be downregulated (Fig. 2A–C). This suggests a reorganization of the AP-1 transcription factor complex, which consists of Jun and Fos family member heterodimers. Dysregulation of Jun and Fos family members Jun, Fos and FOSL1 was observed in transcriptomic analysis of FRA1 re-expressing GIMs compared to pcDNA controls (Fig. 2D). Differential expression profiles of AP-1 family members at the gene and protein level have been shown in representative GIMs and CONs (Fig. 1A and B). We show here for the first time in FRA1 re-expressing GIMs induces a shift in AP-1 family members FOSL1, Fos and Jun (Fig. 2).
It is proposed that the observed shifts are due to changes in dimer composition. In our model the Jun-Fos dimeric complex drives neoplastic transformation while the presence of Fra1 suppresses this through disruption of the complex and establishment of a Fra1-Jun dimer. Reexpression of Fra1 suppresses the Jun-Fos heterodimerization which then alters the oncogenic transcription profile.
Alkaline Phosphatase Expression
The re-expression of Alpi is well established and utilized as the invariable marker of the neoplastically transformed tumorigenic phenotype in the CGL1 human hybrid system and its segregants (4, 6, 36). FOSL1 was found to be the most statistically significant DEG in the comparison of GIMFRA to GIM-pcDNA and Alpi the second most downregulated gene (Fig. 4A). Re-expression of FRA reduces levels of Iap expression below that of their corresponding pcDNA control in GIMs (Fig. 4B). This reduction is especially pronounced in GIM19 and GIM31. However, we have shown that the re-expression of FRA1 in GIMs 12, 19 and 31 is sufficient to suppress tumorigenic growth in vivo. In each cell line assayed, the levels of Alp expressed in each FRA1 re-expressing GIM is reduced to CON like levels. GIM-FRA1 cells overexpressing FRA1 were shown to have highly significant (P < 0.005) reductions of Alpi as compared to GIM-pcDNA vector controls as determined by RT-qPCR (Fig. 4C). This initial finding by Alp expression assay, microarray and RT-qPCR analysis is indicative that GIMs that overexpress FRA1 are shifted phenotypically and demonstrate reduced tumorigenic phenotype in vitro and in vivo. There have long been reported associations in the literature as to elevated alkaline phosphatase levels in cancer cells, as well as investigation into the biological relevance of this observation (39–41). Although the mechanisms regulating re-expression of Alpi in CGL1 cell members is not yet fully known, it is clear there is a direct correlation between its expression and the tumorigenic phenotype. It has been formerly proposed and evidence provided that trans-regulatory control of Alpi is correlated to chromosome 11 (15, 42). It is therefore suggested, especially considering GIM-FRA1 re-expression studies presented here, that FOSL1 acts as a negative transcriptional regulator of Alpi, the established and validated antigenic marker of neoplastic transformation in CGL1 cells.
FRA1 is Methylated and expression is Suppressed after Gamma Radiation-Induced Neoplastic Transformation
We show that loss of FOSL1 expression is not due to homozygous loss or rearrangement of genomic DNA, and that epigenetic mechanisms are involved (Fig. 6). To test the hypothesis that FRA1 is silenced in GIMs by epigenetic mechanisms, we treated the tumorigenic cell lines with a methyl transferase inhibitor. Our results suggests that radiation-induced neoplastic transformation of CGL1 is not only due to loss of one of the chromosome 11 FRA1 alleles (13, 37) but demonstrate that the intact copy of the FRA1 tumor suppressor gene is silenced by promoter methylation. Although this study does not address global gene level effects in terms of methylation, evidence shows that at this locus, methylation induced silencing is the driving mechanism. The CGL1 cells were exposed to low-LET radiation which is associated with hypermethylation of genomic DNA leading to silencing of transcriptional elements. Future studies utilizing single-nucleotide resolution methylation sequencing would provide genome-wide understanding of methylated regions and overall levels of methylation in radiation-induced tumorigenic CGL1 segregants. An additional next experimental step could include the use of anti-methylation strategies to test if this would alter the tumorigenicity of GIM cells.
Exploratory Grouping Analysis and Principal Component Analysis
Exploratory grouping analysis (EGA) and principal component analysis (PCA) were performed on the CON, GIM-FRA1 and GIM-pcDNA cell lines utilized in this study. Graphical representations of large complex biological data sets are advantageous during initial examination and analysis of, for example, transcriptomics microarray data. EGA analysis of the GIM-FRA1, GIM-pcDNA and CON cell lines utilized in this experiment revealed that they group closely within cell types, all three exhibiting spatially distinct grouping (Fig. 7A). PCA analysis (Fig. 7B) shows that although there is some variance between cell lines within a group, there is discrete grouping with the three principal components. We have previously shown that there are over a thousand differentially expressed genes in GIM cells compared to CONs (11). In this study, although there is not a complete shift of all genes, we show with the re-expression of FRA1 in GIMs that FOSL1 likely controls a subset of these previously identified DEGs in its capacity as a tumor suppressor.
ECM Ligands, Receptors and Phosphodiesterases
We observed that re-expression of FRA1 in GIMs vs. CONs has altered gene expression related to ECM ligands and receptors (Fig. 8A and B). Downregulation of Lama1 expression as compared to GIM vs. CON was observed, and although there is a recovery of expression for fibronectin related integrins Itga5 and Itga6, there is downregulation of related integrin Itga4 and Itgb8, and an observed further downregulation of Fn1. The downregulation of genes related to cell migration was also observed in GIMs that overexpress FRA1 vs. CON compared to GIM vs. CON. Numerous collagens which have been shown to influence cancer formation were observed including Col1a1, Col1a2 and Col12a1. In addition, multiple genes related to cellular adhesion and migration were observed in comparison of the microarrays including Rhob, Rhof, Rhov, Myo1e and downregulation of Mylk3. Many of the top 10 significantly enriched biological process, molecular function and cellular component GO terms were related to these changes (Table 2). This included negative regulation of cell proliferation, laminin binding, integrin binding, external side of the plasma membrane, focal adhesion, anchored component of the membrane and basal part of the cell. One of the top impacted pathways (Table 3) was cell adhesion molecules (CAMs). Remodeling of the ECM has previously been shown to have a significant effect on tumorigenic phenotype (43, 44). FRA1 has been shown to control certain hallmarks of cancer formation such as cellular adhesion and ECM components (26). Our results demonstrate that re-expression of FRA1 in tumorigenic GIM cells returns several integrins back to non-tumorigenic CON like levels (Fig. 8B). Epithelial cells, for example HeLa, use laminin to bind to basement membranes and laminins have been shown to promote an invasive tumorigenic phenotype (43). We have previously shown that GIMs upregulate laminin and downregulate fibronectin compared to CONs (11). We propose that GIMs, which have altered integrin expression, have altered binding to the basement membrane and can therefore grow anchorage independently, resulting in tumor formation.
Previous microarray analysis of GIM vs. CON cell lines revealed robust re-expression of many PDE isoforms (11). It is observed in this study that GIM-FRA1 cells compared to CON downregulate several of these members including PDEs 7B, 1A and 10A (Fig. 8C). This suggests partial recovery of the previously disrupted cAMP signaling. The AP-1 transcription factor complex family members have the ability to bind to cAMP response elements (CREs), and interaction between AP-1 and Creb. Normal cAMP production leads to activation of Creb which together are involved in downstream gene regulation. In our previous transcriptomic study, Creb5 was found to be significantly downregulated in GIM vs. CON analysis. It appears that re-expression of FRA1 in GIMs may lead to some recovery of dysregulated cAMP mediated signaling in GIMs. qPCR validation of selected DEGs elucidated by transcriptomic analysis verified the directionality of the gene expression shift (Figs. 8D and 9) including Pde10a, which has been shown to be essential for tumor formation in some cancers (45, 46).
Tgfβ Related Signaling
In our previous transcriptomic analysis of tumorigenic GIMs compared to nontumorigenic CONs (11), one of the most significant findings was reduced Tgfβ signaling in GIMs. In the current study, Tgfβ was again found to be one of the most significantly enriched molecular function GO terms and Tgfβ signaling was identified as one of the most impacted pathways in iPG analysis (Tables 2 and 3). Further analysis of DEGs revealed that there is up-regulation of Tgfβ signaling pathway genes Thbs1 and follistatin (Fst) in GIM-FRA1 vs. CON as compared to GIM vs. CON analysis in which both genes were significantly downregulated. Thbs1 has been shown to be a key activator of Tgfβ in vivo and expressed significantly lower in cervical cancer tumors (47–49). Based on iPG perturbation analysis of the Tgfβ signaling pathway, it is proposed that the significant upregulation of Thbs1 results in a regulatory interaction with latent Tgfβ binding proteins resulting in up regulation of Tgfβ signaling. A significant increase in canonical Tgfβ signaling pathway cofactor Smad2 was observed in GIM-FRA1 compared to GIM-pcDNA. iPG pathway perturbation analysis suggests that the increase in Fst in GIMFRA compared to GIM-pcDNA further supports up-regulation of Tgfβ signaling. Additionally, the upregulation of Fst in iPG pathway perturbation analysis was proposed to as well upregulate Tgfβ signaling. Fst has also been shown to be an inhibitor of metastasis and invasiveness of cancer (50–52). Although further functional assay validation is warranted, it is proposed that FRA1 re-expression may recover previously observed downregulation of the canonical Tgfβ signaling in tumorigenic GIM vs. non-tumorigenic CON analysis.
FRA1 as a Master Regulator of Differential Gene Expression and Altered Tumorigenic Phenotype in GIM-FRA Cells
We present in this article novel evidence implicating that suppression or loss of FOSL1 a member of the AP-1 transcription factor family is one of the key events that drives radiation-induced neoplastic transformation of CGL1 human hybrid cells. We show that re-expression of FRA1 in the tumorigenic GIMs results in the up-regulation of Jun and the down-regulation of Fos proteins. It has previously been shown that molecular restructuring of the AP-1 complex can significantly influence the tumorigenic phenotype (18–22). AP-1 transcription factor complex reorganization has been linked to observed altered phenotypes in these studies such as cellular proliferation and invasion (19, 23, 25, 34). Based on this and other published data we proposed that the FOSL1 is a master transcription factor for expression of proteins that regulate tumorigenicity in radiation induced segregants of the CGL1 system. The shift in phenotype is strongly supported by the in vivo data presented here.
CONCLUSIONS
Our analyses and interpretation of the data presented above has allowed us to establish the molecular basis and a new molecular model of radiation-induced neoplastic transformation of CGL1 human hybrid cells. Our data indicate that CGL1 is non-tumorigenic due to expression of the FOSL1 tumor suppressor gene, a member of the AP-1 transcription factor family. We further propose that radiation-induced neoplastic transformation of CGL1 is due to loss of FOSL1 gene expression by whole chromosome 11 loss and methylation silencing of the remaining copy of the FOSL1 on the intact chromosome 11.
ACKNOWLEDGMENTS
The authors acknowledge Bruce Power and the Nuclear Innovation Institute for industrial research funding and the Mitacs Accelerate Fellowship program for support as well as support from the American Cancer Society, Indiana University Simon Comprehensive Cancer Center, the Indiana Lions Club, the Indiana University Department of Radiation Oncology, the Showalter Research Trust, and NIH grant 1 R01 CA090885-01A2. The authors would additionally like to thank Dr. Christine Lalonde for assistance with statistical analysis of data.
REFERENCES
- 1.Stanbridge EJ, Flandermeyer RR, Daniels DW, Nelson-Rees WA. Specific chromosome loss associated with the expression of tumorigenicity in human cell hybrids. Somatic cell genet. 1981; 7(6):699–712. [DOI] [PubMed] [Google Scholar]
- 2.Stanbridge EJ, Wilkinson J. Dissociation of anchorage indepen-dence form tumorigenicity in human cell hybrids. Int J Cancer. 1980; 26(1):1–8. [DOI] [PubMed] [Google Scholar]
- 3.Bettega D, Calzolari P, Belloni F, Di Lena F, Genchi S, Lupi M,et al. Solar UV radiation: differential effectiveness of UVB subcomponents in causing cell death, micronucleus induction and delayed expression of heritable damage in human hybrid cells. Int J Radiat Biol. 2001; 77(9):963–70. [DOI] [PubMed] [Google Scholar]
- 4.Mendonca MS, Antoniono RJ, Latham KM, Stanbridge EJ, Redpath JL. Characterization of intestinal alkaline phosphatase expression and the tumorigenic potential of gamma-irradiated HeLa x fibroblast cell hybrids. Cancer Res. 1991; 51(16):4455–62. [PubMed] [Google Scholar]
- 5.Pant MC, Liao XY, Lu Q, Molloi S, Elmore E, Redpath JL.Mechanisms of suppression of neoplastic transformation in vitro by low doses of low LET radiation. Carcinogenesis. 2003; 24(12): 1961–5. [DOI] [PubMed] [Google Scholar]
- 6.Pirkkanen JS, Boreham DR, Mendonca MS. The CGL1 (HeLa x Normal Skin Fibroblast) Human Hybrid Cell Line: A History of Ionizing Radiation Induced Effects on Neoplastic Transformation and Novel Future Directions in SNOLAB. Radiat Res. 2017; 188(4.2):512–24. [DOI] [PubMed] [Google Scholar]
- 7.Redpath JL, Lu Q, Lao X, Molloi S, Elmore E. Low doses of diagnostic energy X-rays protect against neoplastic transformation in vitro. Int J Radiat Biol. 2003; 79(4):235–40. [DOI] [PubMed] [Google Scholar]
- 8.Redpath JL, Sun C, Colman M, Stanbridge EJ. Radiobiological studies of human hybrid cells (skin fibroblasts X HeLa) and their tumourigenic segregants. Int J Radiat Biol Relat Stud Phys Chem Med. 1985; 48(4):479–83. [DOI] [PubMed] [Google Scholar]
- 9.Redpath JL, Sun C, Colman M, Stanbridge EJ. Neoplastic transformation of human hybrid cells by gamma radiation: a quantitative assay. Radiat Res. 1987; 110(3):468–72. [PubMed] [Google Scholar]
- 10.Mendonca MS, Farrington DL, Mayhugh BM, Qin Y, Temples T,Comerford K, et al. Homozygous deletions within the 11q13 cervical cancer tumor-suppressor locus in radiation-induced, neoplastically transformed human hybrid cells. Genes Chromosomes Cancer. 2004; 39(4):277–87. [DOI] [PubMed] [Google Scholar]
- 11.Pirkkanen J, Tharmalingam S, Morais IH, Lam-Sidun D, Thome C, Zarnke AM, et al. Transcriptomic profiling of gamma ray induced mutants from the CGL1 human hybrid cell system reveals novel insights into the mechanisms of radiation-induced carcinogenesis. Free Radic Biol Med. 2019; 145:300–11. [DOI] [PubMed] [Google Scholar]
- 12.Srivatsan ES, Chakrabarti R, Zainabadi K, Pack SD, Benyamini P,Mendonca MS, et al. Localization of deletion to a 300 Kb interval of chromosome 11q13 in cervical cancer. Oncogene. 2002; 21(36): 5631–42. [DOI] [PubMed] [Google Scholar]
- 13.Mendonca MS, Howard K, Desmond LA, Derrow CW. Previous loss of chromosome 11 containing a suppressor locus increases radiosensitivity, neoplastic transformation frequency and delayed death in HeLa x fibroblast human hybrid cells. Mutagenesis. 1999; 14(5):483–90. [DOI] [PubMed] [Google Scholar]
- 14.Srivatsan ES, Benedict WF, Stanbridge EJ. Implication of chromosome 11 in the suppression of neoplastic expression in human cell hybrids. Cancer Res. 1986; 46:6174–9. [PubMed] [Google Scholar]
- 15.Saxon PJ, Srivatsan ES, Stanbridge EJ. Introduction of human chromosome 11 via microcell transfer controls tumorigenic expression of HeLa cells. EMBO J. 1986; 5(13):3461–6. [DOI] [PMC free article] [PubMed] [Google Scholar]
- 16.Mendonca MS, Howard K, Fasching CL, Farrington DL,Desmond LA, Stanbridge EJ, et al. Loss of suppressor loci on chromosomes 11 and 14 may be required for radiation-induced neoplastic transformation of HeLa x skin fibroblast human cell hybrids. Radiat Res. 1998; 149(3):246–55. [PubMed] [Google Scholar]
- 17.Ibrahim SAE, Abudu A, Johnson E, Aftab N, Conrad S, Fluck M.The role of AP-1 in self-sufficient proliferation and migration of cancer cells and its potential impact on an autocrine/paracrine loop. Oncotarget. 2018; 9(76):34259–78. [DOI] [PMC free article] [PubMed] [Google Scholar]
- 18.Milde-Langosch K The Fos family of transcription factors and their role in tumourigenesis. Eur J Cancer. 2005; 41(16):2449–61. [DOI] [PubMed] [Google Scholar]
- 19.Soto U, Denk C, Finzer P, Hutter KJ, zur Hausen H, Rosl F.Genetic complementation to non-tumorigenicity in cervicalcarcinoma cells correlates with alterations in AP-1 composition. Int J Cancer. 2000; 86(6):811–7. [DOI] [PubMed] [Google Scholar]
- 20.Soto U, Das BC, Lengert M, Finzer P, zur Hausen H, Rosl F.Conversion of HPV 18 positive non-tumorigenic HeLa-fibroblast hybrids to invasive growth involves loss of TNF-alpha mediated repression of viral transcription and modification of the AP-1 transcription complex. Oncogene. 1999; 18(21):3187–98. [DOI] [PubMed] [Google Scholar]
- 21.Verde P, Casalino L, Talotta F, Yaniv M, Weitzman JB.Deciphering AP-1 function in tumorigenesis: fra-ternizing on target promoters. Cell Cycle. 2007; 6(21):2633–9. [DOI] [PubMed] [Google Scholar]
- 22.Zhang W, Hart J, McLeod HL, Wang HL. Differential expression of the AP-1 transcription factor family members in human colorectal epithelial and neuroendocrine neoplasms. Am J Clin Pathol. 2005; 124(1):11–9. [DOI] [PubMed] [Google Scholar]
- 23.Prusty BK, Das BC. Constitutive activation of transcription factor AP-1 in cervical cancer and suppression of human papillomavirus (HPV) transcription and AP-1 activity in HeLa cells by curcumin. Int J Cancer. 2005; 113(6):951–60. [DOI] [PubMed] [Google Scholar]
- 24.Tyagi A, Vishnoi K, Kaur H, Srivastava Y, Roy BG, Das BC,et al. Cervical cancer stem cells manifest radioresistance: Association with upregulated AP-1 activity. Sci Rep. 2017; 7(1):4781. [DOI] [PMC free article] [PubMed] [Google Scholar]
- 25.Xiao S, Zhou Y, Yi W, Luo G, Jiang B, Tian Q, et al. Fra-1 is downregulated in cervical cancer tissues and promotes cervical cancer cell apoptosis by p53 signaling pathway in vitro. Int J Oncol. 2015; 46(4):1677–84. [DOI] [PubMed] [Google Scholar]
- 26.Sobolev VV, Khashukoeva AZ, Evina OE, Geppe NA, Cheby-sheva SN, Korsunskaya IM, et al. Role of the Transcription Factor FOSL1 in Organ Development and Tumorigenesis. Int J Mol Sci. 2022; 23(3). [DOI] [PMC free article] [PubMed] [Google Scholar]
- 27.Mendonca MS, Turchan WT, Alpuche ME, Watson CN Estabrook NC, Chin-Sinex H, et al. DMAPT inhibits NF-kappaB activity and increases sensitivity of prostate cancer cells to X-rays in vitro and in tumor xenografts in vivo. Free Radic Biol Med. 2017; 112:318–26. [DOI] [PMC free article] [PubMed] [Google Scholar]
- 28.Schneider CA, Rasband WS, Eliceiri KW. NIH Image to ImageJ:25 years of image analysis. Nat Methods. 2012; 9(7):671–5. [DOI] [PMC free article] [PubMed] [Google Scholar]
- 29.Estabrook NC, Chin-Sinex H, Borgmann AJ, Dhaemers RM,Shapiro RH, Gilley D, et al. Inhibition of NF-kappaB and DNA double-strand break repair by DMAPT sensitizes non-small-cell lung cancers to X-rays. Free Radic Biol Med. 2011; 51(12): 2249–58. [DOI] [PubMed] [Google Scholar]
- 30.Donato M, Xu Z, Tomoiaga A, Granneman JG, Mackenzie RG,Bao R, et al. Analysis and correction of crosstalk effects in pathway analysis. Genome Res. 2013; 23(11):1885–93. [DOI] [PMC free article] [PubMed] [Google Scholar]
- 31.Draghici S, Khatri P, Tarca AL, Amin K, Done A, Voichita C,et al. A systems biology approach for pathway level analysis. Genome Res. 2007; 17(10):1537–45. [DOI] [PMC free article] [PubMed] [Google Scholar]
- 32.Tarca AL, Draghici S, Khatri P, Hassan SS, Mittal P, Kim JS, et al.A novel signaling pathway impact analysis. Bioinformatics. 2009; 25(1):75–82. [DOI] [PMC free article] [PubMed] [Google Scholar]
- 33.Ahsan S, Draghici S. Identifying Significantly Impacted Pathways and Putative Mechanisms with iPathwayGuide. Curr Protoc Bioinformatics. 2017; 57:7 15 1–7 30. [DOI] [PubMed] [Google Scholar]
- 34.Ibrahim SAE, Abudu A, Jonhson E, Aftab N, Conrad S, Fluck M.The role of AP-1 in self-sufficient proliferation and migration of cancer cells and its potential impact on an autocrine/paracrine loop. Oncotarget. 2018; 9(76):34259–78. [DOI] [PMC free article] [PubMed] [Google Scholar]
- 35.Hess J, Angel P, Schorpp-Kistner M. AP-1 subunits: quarrel and harmony among siblings. J Cell Sci. 2004; 117(Pt 25):5965–73. [DOI] [PubMed] [Google Scholar]
- 36.Latham KM, Stanbridge EJ. Identification of the HeLa tumor-associated antigen, p75/150, as intestinal alkaline phosphatase and evidence for its transcriptional regulation. Proc Natl Acad Sci U S A. 1990; 87:1263–7. [DOI] [PMC free article] [PubMed] [Google Scholar]
- 37.Mendonca MS, Fasching CL, Srivatsan ES, Stanbridge EJ,Redpath JL. Loss of a putative tumor suppressor locus after gamma-ray-induced neoplastic transformation of HeLa x skin fibroblast human cell hybrids. Radiat Res. 1995; 143(1):34–44. [PubMed] [Google Scholar]
- 38.Bejjani F, Tolza C, Boulanger M, Downes D, Romero R, Maqbool MA, et al. Fra-1 regulates its target genes via binding to remote enhancers without exerting major control on chromatin architecture in triple negative breast cancers. Nucleic Acids Res. 2021; 49(5): 2488–508. [DOI] [PMC free article] [PubMed] [Google Scholar]
- 39.Millan JL. Oncodevelopmental expression and structure of alkaline phosphatase genes. Anticancer Res. 1988; 8(5A):995–1004. [PubMed] [Google Scholar]
- 40.Harris H The human alkaline phosphatases: what we know and what we don’t know. Clin Chim Acta. 1990; 186(2):133–50. [DOI] [PubMed] [Google Scholar]
- 41.Millan JL. Oncodevelopmental alkaline phosphatases: in search for a function. Prog Clin Biol Res. 1990; 344:453–75. [PubMed] [Google Scholar]
- 42.Latham KM, Stanbridge EJ. Examination of the oncogenic potential of a tumor-associated antigen, intestinal alkaline phosphatase, in HeLa x fibroblast cell hybrids. Cancer Res. 1992; 52(3):616–22. [PubMed] [Google Scholar]
- 43.Fullar A, Dudas J, Olah L, Hollosi P, Papp Z, Sobel G, et al.Remodeling of extracellular matrix by normal and tumor-associated fibroblasts promotes cervical cancer progression. BMC Cancer. 2015; 15:256. [DOI] [PMC free article] [PubMed] [Google Scholar]
- 44.Liu S, Liao G, Li G. Regulatory effects of COL1A1 on apoptosis induced by radiation in cervical cancer cells. Cancer Cell Int. 2017; 17:73. [DOI] [PMC free article] [PubMed] [Google Scholar]
- 45.Zhu B, Lindsey A, Li N, Lee K, Ramirez-Alcantara V, Canzoneri JC, et al. Phosphodiesterase 10A is overexpressed in lung tumor cells and inhibitors selectively suppress growth by blocking beta-catenin and MAPK signaling. Oncotarget. 2017; 8(41): 69264–80. [DOI] [PMC free article] [PubMed] [Google Scholar]
- 46.Li N, Lee K, Xi Y, Zhu B, Gary BD, Ramirez-Alcantara V, et al.Phosphodiesterase 10A: a novel target for selective inhibition of colon tumor cell growth and beta-catenin-dependent TCF transcriptional activity. Oncogene. 2015; 34(12):1499–509. [DOI] [PMC free article] [PubMed] [Google Scholar]
- 47.Kodama J, Hashimoto I, Seki N, Hongo A, Yoshinouchi M,Okuda H, et al. Thrombospondin-1 and −2 messenger RNA expression in invasive cervical cancer: correlation with angiogenesis and prognosis. Clin Cancer Res. 2001; 7(9):2826–31. [PubMed] [Google Scholar]
- 48.Murphy-Ullrich JE, Poczatek M. Activation of latent TGF-beta by thrombospondin-1: mechanisms and physiology. Cytokine Growth Factor Rev. 2000; 11(1–2):59–69. [DOI] [PubMed] [Google Scholar]
- 49.Crawford SE, Stellmach V, Murphy-Ullrich JE, Ribeiro SM,Lawler J, Hynes RO, et al. Thrombospondin-1 is a major activator of TGF-beta1 in vivo. Cell. 1998; 93(7):1159–70. [DOI] [PubMed] [Google Scholar]
- 50.Zabkiewicz C, Resaul J, Hargest R, Jiang WG, Ye L. Increased Expression of Follistatin in Breast Cancer Reduces Invasiveness and Clinically Correlates with Better Survival. Cancer Genomics Proteomics. 2017; 14(4):241–51. [DOI] [PMC free article] [PubMed] [Google Scholar]
- 51.Seachrist DD, Sizemore ST, Johnson E, Abdul-Karim FW, Weber Bonk KL, Keri RA. Follistatin is a metastasis suppressor in a mouse model of HER2-positive breast cancer. Breast Cancer Res. 2017; 19(1):66. [DOI] [PMC free article] [PubMed] [Google Scholar]
- 52.Talmadge JE. Follistatin as an inhibitor of experimental metastasis. Clin Cancer Res. 2008; 14(3):624–6. [DOI] [PubMed] [Google Scholar]