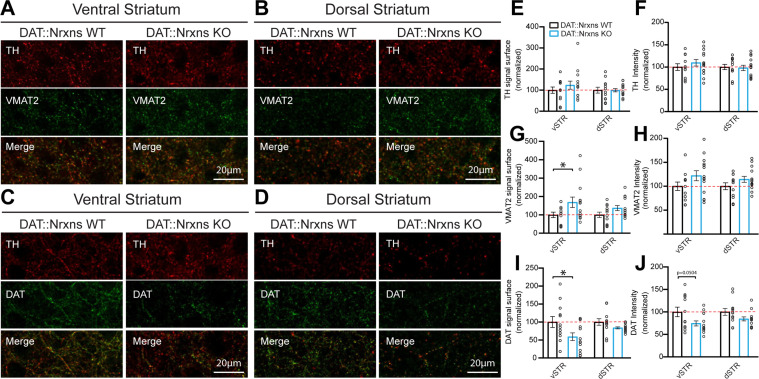
Figure 2. Increased vesicular monoamine transporter (VMAT2) but decreased dopamine transporter (DAT) expression in dopamine (DA) axon terminals lacking neurexins (Nrxns).
(A and B) Immunohistochemistry characterization of ventral (A) and dorsal (B) striatal slices from 8-week-old DAT::NrxnsKO and DAT::NrxnsWT mice (60× confocal) using tyrosine hydroxylase (TH, red) and VMAT2 (green) antibodies. (C and D) Immunohistochemistry of ventral (C) and dorsal (D) striatal slices from DAT::NrxnsKO and DAT::NrxnsWT mice using TH (red) and DAT (green) antibodies. (E–J) Quantification of signal intensity and signal surface (% of WT) for TH, VMAT2, and DAT in the different striatal regions examined: ventral striatum (vSTR) and dorsal striatum (dSTR) (DAT::NrxnsKO = 14 hemispheres/7 mice; DAT::NrxnsWT = 12 hemispheres/6 mice). TH surface area: vSTR = 123.6 ± 18.99% and dSTR = 99.49 ± 7.73% of control. TH signal intensity: vSTR = 109.6 ± 7.36% and dSTR = 97.96 ± 5.98% of control. VMAT2 surface area: vSTR = 168.3 ± 28.27% and dSTR = 136.7 ± 13.85% of control. VMAT2 signal intensity: vSTR = 122.1 ± 10.48% and dSTR = 114.4 ± 6.25% of control. DAT surface area: vSTR = 59.00 ± 10.71% and dSTR1=83.70 ± 2.70% of control DAT signal intensity: vSTR = 74.37 ± 5.56% and dSTR = 84.42 ± 4.40% of control. Statistical analysis was carried out by unpaired t-test for each substructure. Surface and intensity for each signal were measured in striatal slice from bregma + 0.74 mm, with a total of seven different spots for each hemisphere from six DAT::NrxnsWT mice and seven DAT::NrxnsKO mice. Error bars represent ± SEM (*p<0.05).

