

Abstract
Social isolation has robust adverse effects on health, well-being, dementia risk, and longevity. Although most studies suggest similar effects of isolation on the health of men and women, there has been much less attention to gendered patterns of social isolation over the life course—despite decades of research suggesting gender differences in social ties. We build on theoretical frames of constrained choice and gender-as-relational to argue that gender differences in isolation are apparent but depend on timing in the life course and marital/partnership history. Results indicate that boys/men are more isolated than girls/women through most of the life course, and this gender difference is much greater for the never married and those with disrupted relationship histories. Strikingly, levels of social isolation steadily increase from adolescence through later life for both men and women.
Keywords: aging, gender, life course, relationships, social isolation
Over three decades of research shows that people who are socially isolated experience worse mental and physical health and are more likely to die compared to their less isolated peers (Holt-Lunstad et al. 2015; House, Landis, and Umberson 1988; Steptoe et al. 2013). Social connection is clearly fundamental to human health and well-being. It is easy to forget that this profound and accepted premise of population health research was not always so. It is a great honor to have contributed to this research and to receive the Reeder Award acknowledging that work. From the beginning of my career, I was intrigued by the powerful impact of social connection, and its absence, on health and well-being. As a graduate student, I worked with Walt Gove on the delicate balance of costs and rewards of social connection through family ties, with an emphasis on the “dark side” of social ties (reflecting both Walt’s and my own personal proclivities). But it was as a postdoc at the University of Michigan, working with Jim House, that the power of social isolation to influence health emerged as solid scientific pursuit.
I was fortunate to work with Jim on a seminal article on “Social Relationships and Health” published in Science (House et al. 1988). At the time, the scientific (and medical) community was beginning to recognize the power of stress to undermine health. But the evidence linking social isolation to health was just beginning to emerge. The Science article pulled together compelling evidence from prospective studies across several countries to show that social isolation rivaled smoking in its power to undermine health over time. The field progressed by a kind of systematic expansion, as all science does, and the solid link between social isolation and health is now widely accepted (National Academies of Sciences, Engineering, and Medicine 2020). Our Science article called for greater attention to the biopsychosocial mechanisms through which social ties influence population health, and over years, the research grew increasingly sophisticated in identifying those pathways (e.g., Uchino et al. 2012; Yang, McClintock, et al. 2013). My own work included a focus on marital and family ties and when they are most and least beneficial to health. I focused particularly on the social control of health behaviors as a gendered behavioral pathway linking social ties to health (Umberson 1992; Umberson, Donnelly, and Pollitt 2018). Adding to my good fortune, several talented graduate students led me down new paths including the ways in which gendered relationship and health dynamics vary over the life course and for same-sex compared to different-sex couples (Liu and Umberson 2008; Reczek et al. 2018; Thomeer, Umberson, and Reczek 2020; Williams and Umberson 2004).
The Science article also emphasized the need to understand the predictors of social isolation, but this topic has received much less research attention. A fundamental sociological question concerns how structural position contributes to the unequal distribution of resources. Social connection is clearly a potent resource that, like other social resources, is not equally available to all. For example, in my recent work, I have considered how structural racism leads to an unequal burden of bereavement for Black Americans, beginning in childhood (Umberson et al. 2017). In turn, the death of close family members shapes life experiences that may contribute to social isolation later in life (Umberson 2017). In the following article, I extend the focus on predictors of isolation and consider the power of gender to shape patterns of social isolation across the life course. In the spirit of continuing my (and Jim’s) long-standing tradition of working closely with postdocs and graduate students, I collaborate on this project with Zhiyong Lin and Hyungmin Cha.
One would expect gender to be a key predictor of social isolation given the vast literature—both scholarly and popular—pointing to gender differences in relationship experiences and proclivities, generally with women more concerned with and involved in social relationships (Taylor et al. 2000; Umberson et al. 1996). Yet the evidence concerning gender and social isolation has been inconsistent—some studies indicate women are more isolated (Naito et al. 2021), some show men are more isolated (Cudjoe et al. 2020), and others suggest no difference (Kotwal et al. 2021). In this article, we draw on conceptual frameworks of constrained choice (Bird and Rieker 2008) and of gender-as-relational (Springer, Hankivsky, and Bates 2012; West and Zimmerman 1987) to argue that gender differences in social isolation are apparent, vary over the life course, and must be considered in the context of marital/partnership histories that shape the lives of men and women in different ways.
Gendered experiences of social isolation need to be better understood because the degree to which men and women are isolated, when in the life course isolation is most likely to occur, and why men and women are isolated matter for wide-ranging health and quality-of-life outcomes and for developing effective interventions and policies to reduce isolation. The following study relies on data from two national longitudinal surveys to address the following questions:
Research Question 1: Are there gender differences in isolation and trajectories of isolation from adolescence through later life?
Research Question 2: Do gender differences in isolation depend on marital/partnership histories?
BACKGROUND
Social Isolation and Why It Matters across Social Groups
Social isolation refers to the “objective state of having few social relationships or infrequent social contact with others” and is distinguished from subjective feelings of isolation and loneliness (Steptoe et al. 2013:5797). Indeed, social isolation and loneliness are generally not highly correlated (Coyle and Dugan 2012; Perissinotto and Covinsky 2014), and objective measures of social isolation are more strongly associated with health outcomes than are subjective feelings of loneliness (Steptoe et al. 2013; Tanskanen and Anttila 2016).
The effects of social isolation on health are profound, wide-ranging, and irrefutable. Extensive research based on longitudinal, prospective evidence across nations shows that people who are more socially isolated are more likely to die than are those who are more connected, even net of baseline physical health and demographic variables known to affect mortality risk (Holt-Lunstad et al. 2015). Isolation also increases the risk for a number of specific health conditions, including heart disease, stroke (Valtorta et al. 2016), and dementia (Kuiper et al. 2015; Penninkilampi et al. 2018).
The preponderance of the evidence is that the mortality risk associated with social isolation is consistent regardless of gender (National Academies of Sciences, Engineering, and Medicine 2020; Pantell et al. 2013; Yang, McClintock, et al. 2013). A recent meta-analysis also points to isolation as a clear risk factor for heart disease and stroke with no gender difference in these effects (Valtorta et al. 2016). Other studies address whether there are gender differences in the biological (e.g., inflammation), social (stress), psychological (depression), and behavioral (e.g., alcohol consumption) pathways through which isolation affects health and mortality. Although the evidence is mixed, a few studies report gender differences in some of these pathways. For example, Yang, McClintock, and colleagues (2013) conclude that isolation increases inflammatory response more for men than women, and in turn, inflammatory response is a pathway linking isolation to mortality risk. Regardless of the precise pathways, there is no doubt that social isolation increases health and mortality risk for both men and women. Although empirical research has focused a great deal on the effects of isolation on health and pathways linking isolation to health, we know much less about who is most at risk for social isolation—with the exception of increased risk in older populations (National Academies of Sciences, Engineering, and Medicine 2020). From a sociological perspective, we would expect social forces to shape demographic patterns of isolation. Although a range of demographic predictors should be elucidated, the focus here is on gender. Even if isolation has exactly the same effects on men and women, it is important to identify who is most at risk of isolation, when, and why.
Understanding Gender Differences in Social Isolation
Gender is a powerful structural system characterized by different opportunities, demands, and constraints for men and women that in turn shape social experiences, including social ties (Bird and Rieker 2008; Ridgeway 2011). We draw on two theoretical perspectives of gender—constrained choice and gender-as-relational—to shed light on gendered patterns of social isolation over the life course. A constrained choice perspective emphasizes that individual choices are influenced by such structural forces as public policy, laws, community ties, and family and work relationships (Bird and Rieker 2008). For example, social forces push men to be physically and emotionally strong, self-reliant, stoic, and inattentive to their social relationships (Rosenfield and Mouzon 2013; Umberson, Thomeer, and Lodge 2015). Thus, men may be more isolated and more likely than women to rely on others, particularly spouses/romantic partners, to maintain their social ties. In comparison, social forces push women to be more attentive to social relationships and to read and respond to the emotions and needs of others, both at home and in the workplace (Erickson 2005; Hochschild 2012; Umberson et al. 2015). These gender dynamics play out in family relationships wherein women are pressured to place the needs of others above their own and to be “kin keepers” (Reczek and Umberson 2016). Policies and systems of discrimination also mean that women are more likely than men to have lower-wage jobs that involve attending to the needs of others (Ridgeway 2011). These social forces likely come together over the life course to influence patterns of social isolation and connectivity. Social network research indicates that women typically maintain more connections to family members, friends, and neighbors and are more involved in the community (Cornwell and Schafer 2016).
As independent actors, both men and women are strongly influenced by structural systems of gender and stratification in ways that influence their social ties. But a gender-as-relational perspective emphasizes that how men and women enact gender is influenced by their social interactions within relational contexts (Springer et al. 2012; Thomeer et al. 2020; West and Zimmerman 1987). In particular, the ways in which men and women are socially connected or isolated may be influenced by whether or not they are in a marital/intimate relationship. Among the married, both men and women are more likely to name their spouse than another person as their closest confidant, but men are less likely than women to have close ties with anyone other than their spouse (Taylor 2011; Umberson et al. 1996). Marriage is known as a “greedy institution” that may impose even more constraints on women than men, particularly when women are mothers (Coser 1974; Sarkisian and Gerstel 2008). In turn, constraints and expectations within relationships suggest that marital/intimate relationships would contribute to gendered patterns of social isolation. This approach also underscores the importance of thinking about trajectories of change in gendered isolation through the formation, maintenance, and dissolution of such relationships over the entire life course. For example, young unmarried men and women may be similar in levels of social connectivity and isolation, or women may be less isolated than men because women experience fewer constraints on their social ties at this point in the life course. Romantic relationships, particularly if children are involved, may impinge more on women’s social connections than men’s in early to middle adulthood, but following widowhood (or divorce), women may be less isolated than men because of their stronger ties with family and friend networks (Chatters et al. 2018; Cornwell and Schafer 2016).
Given processes of social advantage and disadvantage that accrue from childhood through end of life, we should consider gendered patterns of isolation throughout the entire life course. Yet most of what we know about gender and isolation is based on studies of older populations with more limited information on adolescence to middle adulthood. Adolescence may be a particularly important period as major sources of social connection for youth begin to extend beyond the immediate family and connection to peers and romantic partners become more salient (Crosnoe and Johnson 2011). The structural forces that encourage and coerce gender differences take hold early with more pressure on girls than boys to “attend to the emotions and evaluations of others, foster and maintain social ties, and prioritize others in social relationships at the expense of the self” (Kamis and Copeland 2020:440; Rosenfield and Mouzon 2013). This may play out in a variety of ways, including greater sociality of girls than boys in adolescence (Kamis and Copeland 2020).
Marital Status and Measures of Social Isolation
Prior studies suggest that at older ages, women may be at higher risk than men for isolation (National Academies of Sciences, Engineering, and Medicine 2020). This conclusion is largely based on studies that include marital status as a key indicator of social connection in adulthood. Women are much more likely than men to be widowed/divorced in late life; if being married is a key item in social isolation measures, then older women may score lower than men on such measures. Indeed, studies of midlife to later life populations that include marital status in their measure of social isolation yield inconsistent results about gender differences, and a few studies point to the role that marital status may play. For example, in a sample of primarily single adults, Vandervoort (2000:229) speculates “that men are generally more socially isolated than women because they do not create adequate emotional intimacy when they are not in partnership with a significant other.” Similarly, Russell and Taylor (2009) suggest that marital status may matter less for social isolation of women because they tend to be more involved with family and friends regardless of marital status. Michael and colleagues (2001) find that women (ages 60–72) who live alone are not more socially isolated or at greater risk for psychological distress than are women who live with a spouse. Taken together, these studies point to the potential importance of considering gendered social isolation separately for the married and unmarried.
Gender differences in social isolation may be understated and inconsistent because they are conflated with and work differently by marital status. Commonly used measures of social isolation include marital status, frequency of contact with friends and relatives, and participation in organizations and groups (Steptoe et al. 2013). It makes sense that marital status is embedded in most measures of social isolation because marriage is a key source of social integration for both men and women (Umberson and Montez 2010). However, because gender is relational, it is also important to consider gender differences in isolation within married and unmarried populations. Marriage is particularly likely to exaggerate gender differences of hegemonic masculinity and femininity; that is, traditional cultural portrayals of how men and women should behave in relation to one another, with women more focused on/expert at the domestic/relational sphere and men more focused on/expert at matters of strength, stoicism, and control within heterosexual couples (Thomeer et al. 2020). Moreover, because women are more likely than men to be unmarried in later life, women may score lower on standard measures of social isolation yet may not actually be more socially isolated than men. By not considering marital/partnership status, we likely miss key details about the ways in which being unmarried or married shape gendered patterns of isolation.
Much of the research on gender and social isolation focuses on older populations, for whom social isolation is more common (National Academies of Sciences, Engineering, and Medicine 2020). However, levels of social connection and isolation in late life reflect lifelong patterns of social connection. Indeed, Yang and colleagues (2016:578) show that the physiological effects of relationships “emerge uniquely in adolescence and midlife and persist into old age.” It is important to examine gendered patterns of isolation beginning early in the life course if we are to understand how these patterns unfold over time and perhaps in different ways for men and women. Thus, the following analysis considers patterns of social isolation beginning in adolescence as well as how these patterns change from young adulthood to later life for people depending on their marital/partnership histories. Specifically, data from two national longitudinal surveys—the National Longitudinal Study of Adolescent to Adult Health (Add Health, respondents ages 12–42) and the Health and Retirement Study (HRS, respondents ages 50 and older)—are analyzed to address the following questions:
Are there gender differences in social isolation in the Add Health sample, ages 12 to 42, and the HRS sample, ages 50 and older? Do individual trajectories of social isolation change as people age from adolescence to early midlife (Add Health data) or from midlife to later life (HRS data), and do these trajectories differ for girls/women and boys/men?
Do gendered isolation trajectories depend on marital/partnership histories?
DATA AND METHODS
Data
Data for this study came from two nationally representative longitudinal studies: Add Health and HRS. Add Health is a nationally representative cohort study of adolescents in Grades 7 to 12 in the United States in 1994 to 1995 who have been followed through adolescence and into adulthood with five interviews in 1995 (Wave I), 1996 (Wave II), 2001 to 2002 (Wave III), 2008 to 2009 (Wave IV), and 2016 to 2018 (Wave V; Waves I –IV in person, Wave V online survey; Harris et al. 2019). The current study included 7,358 women and 6,698 men ages 12 to 19 years at Wave I (adolescence) and followed up when they were ages 18 to 26 at Wave III (early adulthood), 24 to 32 at Wave IV (early to middle adulthood), and 32 to 42 at Wave V (middle adulthood) with valid responses on all variables of interest, yielding 37,649 person-year observations.
The HRS is an ongoing biannual survey launched in 1992. The initial sample included adults born between 1931 and 1941 a d their spouses and partners of any age. Every six years, the HRS adds new cohorts of adults ages 50 to 55 years old. The present study uses the HRS samples from 1998 to 2012 to maximize measurement consistency for social isolation (described in the next section). The final analytic sample contained 12,885 women and 9,271 men, yielding 126,225 person-year observations.
Measures
The dependent variable, social isolation, was a summary index indicating social connection across several domains, including romantic relationships, family/friends, and the community. Items used in the social isolation index for the Add Health and HRS were similar but used slightly different measures for some specific life stages. In the Add Health sample, social isolation was assessed across four domains: parent contact (during adolescence) or serious relationship status (starting at age 18), friend count, religious attendance, and volunteer activities. Following previous studies using the Add Health data (Yang et al. 2016, 2017), specific criteria were set for isolation in each domain and assigned 1 point for each domain in which respondents were isolated. For adolescent respondents, fewer than three activities with parents during the previous month indicated isolation from parents. For Add Health adult respondents (ages 18–42), relationship status was coded as 1 for currently not partnered (i.e., not married, cohabiting, or in other types of serious romantic relationships for more than six months) and 0 otherwise. Both adolescent and adult respondents in Add Health were considered isolated if they were in the bottom quartile for number of friendship contacts, had less than monthly religious attendance, and had not volunteered in the past 12 months. The sum of nonmissing values for all domains was the individuals’ social isolation score (0–4), and isolation scores were standardized (0, 1) for the present study.
Social isolation in the HRS was measured with the Social Network Index, originally formulated by Berkman and Syme (1979) and revised by Yang and colleagues (2016). This is a standard measure of isolation in population-level studies (Ertel, Glymour, and Berkman 2008; Yang, Li, and Ji 2013) and included the following items: marital status (0 = married/cohabiting, 1 = not married/cohabiting), contact with parents (1 = less than one time per week), children (1= less than one time per week), neighbors (1 = less than one time per week), and volunteering (1 = never volunteered in the past 12 months). This index reflects the nature and the number of social ties across different relationship domains (Yang et al. 2016). The sum of nonmissing values for all domains was the individuals’ social isolation score (range = 0–5), with scores standardized (0, 1) for this study. If respondents were missing all domains, their social isolation score was set to missing.
The primary independent variables were gender (1 = women, 0 = men), age, and partnership history. Consistent with prior research (Cha and Crosnoe 2022; Lin et al. 2019; Sasson and Umberson 2014), we constructed three marital/partnership groups: never married (i.e., never married or cohabiting at baseline and continuously thereafter), stably partnered (i.e., married or cohabiting throughout the study period), and ever disrupted (i.e., transitioned to widowhood/divorce/disrupted cohabitation during follow-up). All analyses were adjusted for educational attainment (less than high school, high school graduate, some college, and college), race-ethnicity (White, Black, and U.S.- and foreign-born Hispanic), and self-rated health (1–5; higher scores indicate better self-rated health). Consistent with prior research, we included wave-specific indicators (1 = dropout at a given follow-up) to consider potential bias due to attrition (Muthén et al. 2011).
Analytic Approach
We estimated growth curve models to investigate gendered social isolation trajectories of individuals from adolescence to later life. Growth curve modeling distinguishes within (Level 1) and between (Level 2) individual heterogeneities in estimating social isolation trajectories using the longitudinal structure of the data (Fitzmaurice, Laird, and Ware 2011). The analysis began with a change trajectory model of social isolation using age as the analysis time metric. Age was centered at age 12 for the Add Health and at age 50 for the HRS so that the intercept reflected the level of social isolation at baseline. The interaction of gender with age was incorporated in Level 1 to examine how the rate of change in isolation may differ between women and men. The Level 1 model can be specified as follows:
| (1) |
where represents the dependent variable (i.e., social isolation index of individual at wave ). Time-varying covariates (e.g., self-rated health) indicated by were included at the Level 1 model. Level 2 submodels were estimated for between-individual differences in change, where the intercept and coefficients were further modeled as dependent variables. All time-constant covariates were included at Level 2 to predict intercept and age slope (indicated as and , respectively). The Level 2 model can be specified as follows:
| (2) |
| (3) |
Growth curve models in this study followed two steps. First, the model examined whether there are gender differences in social isolation at baseline (i.e., intercept) and the rate of change in social isolation (i.e., slope). Second, we considered whether/how gendered social isolation trajectories depend on the partnership history. For some analyses, we stratified the sample by partnership history to compare gendered trajectories of social isolation across different groups (and excluding the partnership item from the isolation index).
RESULTS
Descriptive Results
Weighted descriptive statistics for all variables at baseline are presented in Table 1 for the total sample and by gender. Descriptive results on social isolation (measured with the traditional social isolation index including the partnership status item) are illustrated in Figure 1 (Panel A for Add Health and Panel B for the HRS). Panel A shows that girls/women are less isolated than boys/men in the Add Health sample. We see a different pattern of results in Panel B, which indicates that women are significantly more isolated than men in the older HRS sample. Thus, the descriptive results suggest a male disadvantage prior to midlife (in Add Health) and a female disadvantage after midlife (in HRS). Relationship status and history also differed significantly for women and men. In the Add Health sample (ages 18–42), men were more likely than women to be never married/partnered, whereas women were more likely than men to be stably married/partnered or to have experienced disruptions in significant relationships. However, in the HRS sample (ages 50 and older), women were more likely than men to be never married or have experienced relationship disruptions, whereas men were more likely than women to remain stably partnered. Other variables are in the expected direction by gender based on prior research.
Table 1.
Weighted Descriptive Statistics of Sample Characteristics at Baseline.
| Panel A. Add Health | Panel B. HRS | |||||
|---|---|---|---|---|---|---|
|
|
|
|||||
| Total | Women | Men | Total | Women | Men | |
|
| ||||||
| Social isolation | .44 | .41 | .47* | .44 | .45 | .43* |
| Relationship history (%)a | ||||||
| Stably married/partnered | 51 | 53 | 50* | .62 | .52 | .76* |
| Experienced disruptions | 29 | 31 | 26* | .33 | .43 | .20* |
| Never married/partnered | 20 | 16 | 24* | .05 | .05 | .04* |
| Age | 21.63 | 21.05 | 22.19* | 60.48 | 60.50 | 60.45* |
| Educational attainment (%)b | ||||||
| Less than high school | 11 | 11 | 11 | 24 | 24 | 24 |
| High school graduate | 28 | 28 | 27 | 32 | 35 | 29* |
| Some college | 31 | 31 | 32 | 22 | 23 | 21* |
| College and more | 30 | 30 | 30 | 22 | 19 | 25* |
| Race-ethnicity (%) | ||||||
| White | 71 | 71 | 71 | 70 | 68 | 71* |
| Black | 16 | 16 | 16 | 18 | 19 | 16* |
| U.S.-born Hispanic | 10 | 10 | 10 | 5 | 5 | 5 |
| Foreign-born Hispanic | 3 | 3 | 3 | 8 | 7 | 8 |
| Self-rated health (1–5) | 3.86 | 3.81 | 3.91* | 3.25 | 3.30 | 3.22* |
| N of persons | 14,056 | 7,358 | 6,698 | 22,156 | 12,885 | 9,271 |
Note: Values for categorical variables are in percentages. Standard deviations are available on request; Add Health = National Longitudinal Study of Adolescent to Adult Health; HRS = Health and Retirement Study.
Indicates a significant gender difference (p < .05) based on chi-square test or t test.
Add Health sample was restricted to adults ages 18 and older.
Parental education for Add Health sample.
Figure 1.
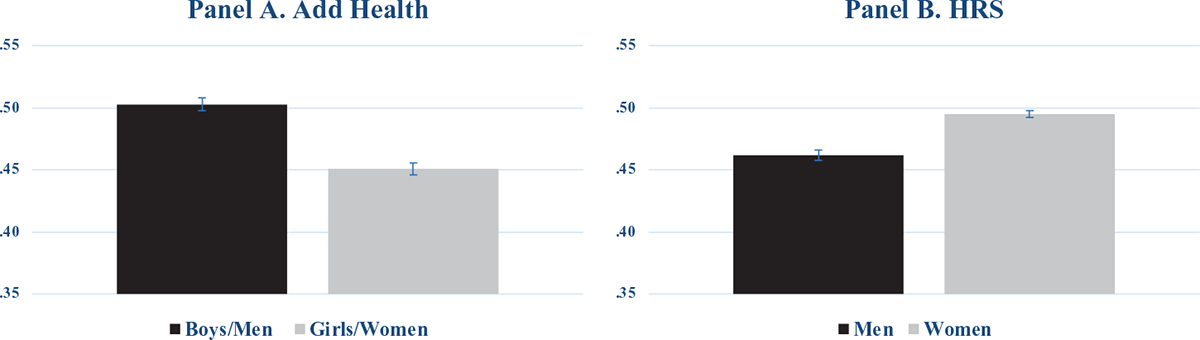
Gender Differences in Social Isolation (Including the Partnership Item).
Note: Add Health = national Longitudinal Study of Adolescent to Adult Health; HRS = Health and Retirement Study.
Gender Differences in Isolation Over the Life Course
We first address whether there are baseline gender differences in isolation and whether gender differences in social isolation change from adolescence through later life. Specifically, we ask: Are there gender differences in social isolation in the Add Health sample (ages 12–42), the HRS sample (ages 50 and older), or in individual trajectories of social isolation as people age from adolescence to early midlife (Add Health data) or from midlife to later life (HRS data)? Table 2 and Figure 2 present both Add Health (Panel A) and HRS (Panel B) results from growth curve models in which we consider whether there are gender differences in overall levels of isolation at baseline as well as the rate of change in isolation trajectories by age, net of other covariates.
Table 2.
Growth Curve Models Predicting Social Isolation (Including the Partnership Item) by Gender across the Life Course.
| Panel A. Add Health | Panel B. HRS | |||
|---|---|---|---|---|
|
|
|
|||
| Model 1A | Model 2A | Model 1B | Model 2B | |
|
| ||||
| Women (reference = men) | −.051*** | −.063*** | .034*** | −.149*** |
| (.003) | (.005) | (.002) | (.012) | |
| Age | .005*** | .005*** | .005*** | .004*** |
| (.000) | (.000) | (.000) | (.000) | |
| Women × Age | .001** | .003*** | ||
| (.000) | (.000) | |||
| Educational attainment (reference = less than high school)a | ||||
| High school graduate | −.019** | −.019** | −.032*** | −.032*** |
| (.006) | (.006) | (.003) | (.003) | |
| Some college | −.054*** | −.054*** | −.049*** | −.050*** |
| (.006) | (.006) | (.003) | (.003) | |
| College and more | −.099*** | −.099*** | −.077*** | −.076*** |
| (.006) | (.006) | (.004) | (.003) | |
| Black (reference = white) | .011** | .011** | .047*** | .047*** |
| (.004) | (.004) | (.003) | (.003) | |
| U.S.-born Hispanic | .018** | .018*** | .016** | .016** |
| (.005) | (.005) | (.005) | (.005) | |
| Foreign-born Hispanic | .029** | .029** | .029*** | .029*** |
| (.009) | (.009) | (.004) | (.004) | |
| Self-rated health | −.024*** | −.024*** | −.012*** | −.012*** |
| (.001) | (.001) | (.001) | (.001) | |
| Censoring | .030*** | .030*** | .019*** | .020*** |
| (.004) | (.004) | (.002) | (.002) | |
| Constant | .544*** | .551*** | .158*** | .271*** |
| (.009) | (.010) | (.007) | (.010) | |
| N of persons | 14,056 | 14,056 | 22,156 | 22,156 |
| N of person-year observations | 37,649 | 37,649 | 126,225 | 126,225 |
Note: Estimates are rounded to the fourth decimal place. Standard errors are in parentheses. Add Health = National Longitudinal Study of Adolescent to Adult Health; HRS = Health and Retirement Study.
Parental education for Add Health sample.
p < .01
p < .001 (two-tailed tests).
Figure 2.
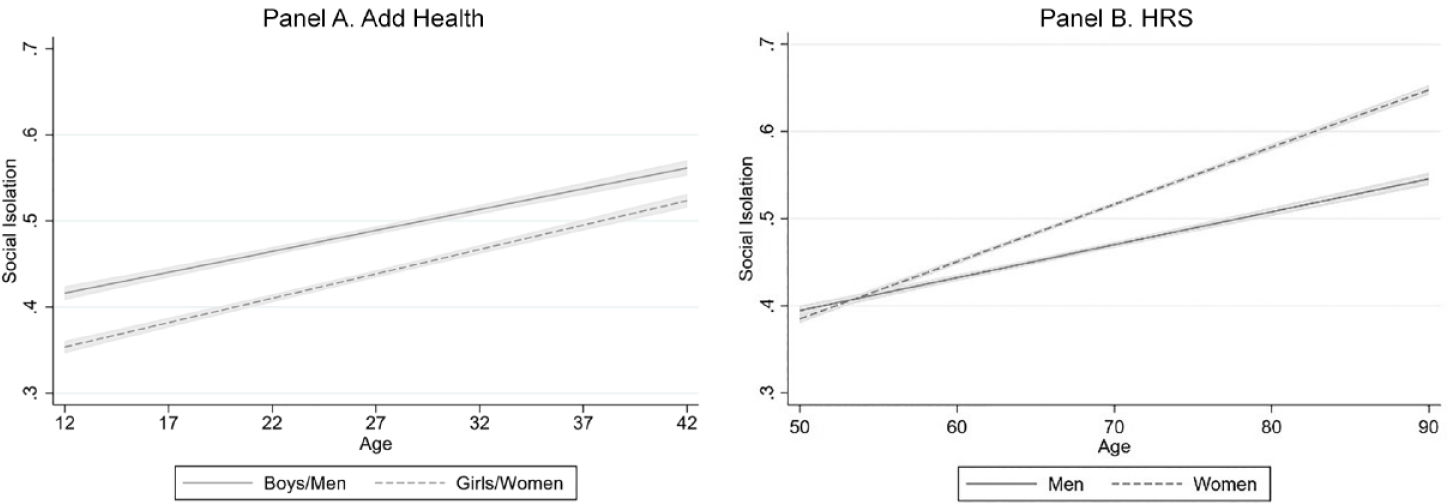
Age Trajectories of Social Isolation (Including the Partnership Item).
Note: Add Health = national Longitudinal Study of Adolescent to Adult Health; HRS = Health and Retirement Study.
Add Health results.
Results presented in Table 2 and Figure 2 rely on the traditional measure of isolation that includes the partnership item. The Add Health results are presented in Panel A. These results show not only a clear gender difference in isolation at baseline (β = −.063, p < .001)—with women less isolated than men—but also a significant interaction effect of gender and age (β = .001, p < .001), suggesting that gender differences in social isolation change from adolescence to middle adulthood. Overall, it appears that gender differences narrow significantly with age from ages 12 to 42. Based on estimates from Model 2A, Panel A of Figure 2 illustrates the Add Health results and indicates that the gender gap in isolation remains but narrows somewhat from age 12 to 42.
HRS results.
The estimates in Panel B, Model 1B indicate a significant gender difference in social isolation (β = .034, p < .001)—with women more isolated than men overall. However, Model 2B, which provides estimates from growth curve models of social isolation, reveals a more complete picture of gendered trajectories in midlife to late life. Consistent with the Add Health results (ages 12–42), women are less isolated than men at age 50 (Model 2B, β = −.149, p < .001). However, there is a significant interaction effect of gender and age (Model 2B, β = .003, p < .001), suggesting that the gendered trajectory of social isolation diverges from midlife to later life. Results in Panel B of Figure 2 provide a visual portrait. Consistent with Model 2B, there is a small but statistically significant gender gap, with women less isolated than men at age 50. However, confidence intervals of men’s and women’s social isolation trajectories overlap by age 55. Then, women become increasingly more isolated than men with advancing age. Notably, in both the younger Add Health sample and the older HRS sample, there is a clear pattern of steadily increasing levels of social isolation as people age.
Do Gender Differences in Isolation Depend on Marital/Partnership History?
To address how gendered trajectories of social isolation might depend on marital/partnership history, we estimate gender differences in isolation trajectories using an isolation measure that excludes the marital/partnership status item and analyze respondents separately according to their partnership histories (i.e., never married, stably partnered, disrupted relationship histories). Table 3 addresses the role of marital/partnership status in shaping gendered patterns of social isolation by estimating growth models separately by marital/partnership history for both the Add Health (Panel A) and HRS (Panel B) samples. The pattern of results is also illustrated in Figure 3, which shows age trajectories of social isolation by gender and partnership history for those who were stably partnered, those who experienced relationship disruption, and those who never married while holding all covariates at their means (for continuous variables) and modes (for dummy variables).
Table 3.
Growth Curve Models Predicting Social Isolation (Excluding the Partnership Item) by Gender and Relationship History across the Life Course.
| Stably Married/Partnered | Experienced Disruptions | Never Married/Partnered | ||||
|---|---|---|---|---|---|---|
|
| ||||||
| Panel A. Add Health | ||||||
|
| ||||||
| Model 1A | Model 2A | Model 3A | Model 4A | Model 5A | Model 6A | |
|
| ||||||
| Women (reference = men) | −.049*** | −.046** | −.040*** | −.029** | −.069*** | −.075*** |
| (.006) | (.010) | (.007) | (.011) | (.009) | (.016) | |
| Age | .003*** | .003*** | .006*** | .007*** | .006*** | .005*** |
| (.000) | (.001) | (.000) | (.001) | (.001) | (.001) | |
| Women × age | −.000 | −.001 | .001 | |||
| (.001) | (.001) | (.001) | ||||
| N of persons | 7,036 | 7,036 | 4,102 | 4,102 | 2,774 | 2,774 |
| N of person-year observations | 14,501 | 14,501 | 11,025 | 11,025 | 4,905 | 4,905 |
|
| ||||||
| Panel B. HRS | ||||||
|
| ||||||
| Model 1B | Model 2B | Model 3B | Model 4B | Model 5B | Model 6B | |
|
| ||||||
| Women (reference = men) | −.005+ | −.092*** | −.034*** | −.126*** | −.064*** | −.033 |
| (.003) | (.016) | (.004) | (.024) | (.012) | (.064) | |
| Age | .004*** | .003*** | .003*** | .002*** | .004*** | .005*** |
| (.000) | (.000) | (.000) | (.000) | (.000) | (.001) | |
| Women × age | .001*** | .001*** | −.001 | |||
| (.000) | (.000) | (.001) | ||||
| N of persons | 13,696 | 13,696 | 7,413 | 7,413 | 1,047 | 1,047 |
| N of person-year observations | 75,987 | 75,987 | 45,426 | 45,426 | 4,812 | 4,812 |
Note: All models control for all covariates included in Table 2. Estimates are rounded to the fourth decimal place. Standard errors are in parentheses. Add Health = National Longitudinal Study of Adolescent to Adult Health; HRS = Health and Retirement Study.
p < .1
p < .01
p < .001 (two-tailed tests).
Figure 3.
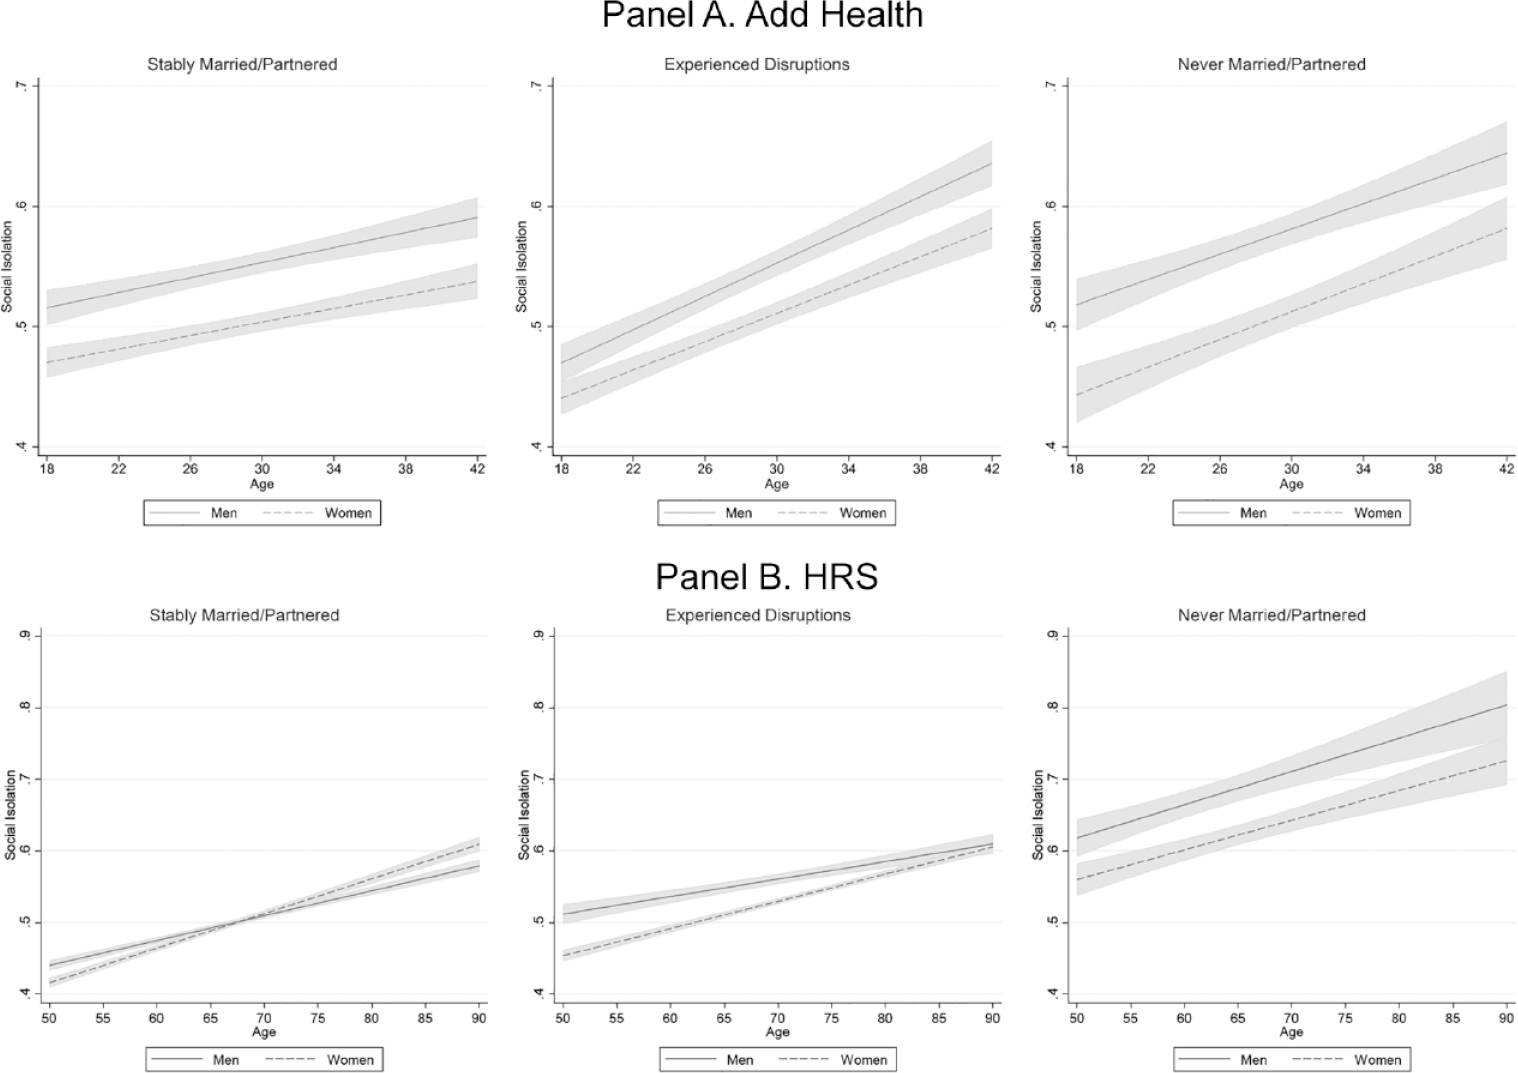
Age Trajectories of Social Isolation (Excluding the Partnership Item) by Gender and Relationship History.
Note: Add Health = national Longitudinal Study of Adolescent to Adult Health; HRS = Health and Retirement Study.
Add Health results.
In the Add Health sample, men are more isolated than women across all partnership history groups, but isolation trajectories are conditioned on partnership history (Table 3, Panel A; Figure 3, Panel A). Levels of isolation generally increase with age for both men and women in the Add Health sample, but this increase is steeper for those with disrupted relationship histories and those who never married compared to the stably partnered. The stably partnered begin the study period with higher levels of isolation than those who never married or experienced disruptions but exhibit more stable trajectories over time. Thus, as they grow older, stably married/partnered adults show greater stability and less isolation than never married respondents and those with disrupted partnership histories in the Add Health sample. Notably, among the stably married/partnered, women remain less isolated than men across all ages.
HRS results.
Results for the HRS sample are shown in Table 3, Panel B, and illustrated in Figure 3, Panel B. Results indicate higher baseline levels of isolation among the never married and those who experienced disruptions compared to the stably partnered—for both men and women. Among the stably partnered, men and women do not widely diverge, but there is a significant pattern suggesting women are somewhat less isolated than men until about age 65. At baseline, women with disrupted partnership histories are significantly less isolated than their male counterparts, but this gap narrows and then converges only in very late life, at about age 90. Among the never married, men are more socially isolated than women throughout the life course.
Sensitivity check.
Given that the previous results suggest that gender differences in patterns of social isolation and change in isolation with age vary depending on marital/partnership history, we reestimated Table 2 results using an isolation index that excludes the partnership item, and we included a covariate for partnership status. This approach suggests how conclusions might differ for analyses that include partnership as a measure of isolation compared to those that do not.
Results from Add Health (Table 4, Panel A) with the revised isolation measure (excluding partnership status) are similar to those obtained using the measure of social isolation that included marital/partnership status. These gendered patterns from Add Health indicate that men remain more isolated than women through age 42, and gender differences in isolation remain stable during adolescence to middle adulthood.
Table 4.
Growth Curve Models Predicting Social Isolation (Excluding the Partnership Item) by Gender across the Life Course.
| Panel A. Add Health | Panel B. HRS | |||
|---|---|---|---|---|
|
|
|
|||
| Model 1A | Model 2A | Model 1B | Model 2B | |
|
| ||||
| Women (reference = men) | −.051*** | −.049*** | −.011*** | −.085*** |
| (.004) | (.006) | (.002) | (.013) | |
| Age | .006*** | .007*** | .004*** | .003*** |
| (.000) | (.000) | (.000) | (.000) | |
| Women × Age | −.000 | .001*** | ||
| (.000) | (.000) | |||
| N of persons | 14,056 | 14,056 | 22,156 | 22,156 |
| N of person-year observations | 37,649 | 37,649 | 126,225 | 126,225 |
Note: All models control for all covariates included in Table 2 and the partnership status. Estimates are rounded to the fourth decimal place. Standard errors are in parentheses. Add Health = National Longitudinal Study of Adolescent to Adult Health; HRS = Health and Retirement Study.
p < .001 (two-tailed tests).
Results from the HRS (Table 4, Panel B) show that social isolation intercepts and age slopes vary by gender. While the initial analysis that includes partnership status as an item in the isolation measure (Table 2, Panel B) suggests that women are more likely than men to be isolated at baseline, our sensitivity check suggests that women are less likely than men to be isolated at baseline when excluding the marital/partnership item. This pattern is not consistent with Table 2 (Panel B), which included marital/partnership status in the isolation index. Therefore, the estimates suggest that marital/partnership status may play a significant role in shaping gendered patterns of social isolation for adults in midlife to later life but not prior to midlife (as suggested by the Add Health analysis).
DISCUSSION
Social isolation is profoundly detrimental to the health and well-being of both men and women (Holt-Lunstad 2022; Steptoe et al. 2013). Although the consequences of social isolation for health are well documented, we know much less about the predictors of social isolation throughout the life course, apart from the possible impact of advanced age (National Academies of Sciences, Engineering, and Medicine 2020). Yet social conditions shape life experiences in ways that may foster inequality in social isolation (Taylor, Chatters, and Taylor 2019; Umberson 2017). Identifying who is most at risk for social isolation is a public health imperative if we are to reduce the isolation of vulnerable Americans. Gender has received surprisingly little attention as a predictor of social isolation even though theoretical and empirical research across academic disciplines points to gender differences in the structure and function of social ties (Cornwell and Schafer 2016; Kamis and Copeland 2020; Umberson et al. 1996). While some biological perspectives point to reasons to expect gender differences in social isolation (Taylor 2011), we emphasize the power of social contexts and social forces to shape gender differences in isolation risk across the life course. Thus, in this article, we draw on theoretical perspectives of constrained choice and gender-as-relational and analyze data from two national, longitudinal data sets to examine gendered trajectories of change in social isolation from adolescence to late life.
Overall, the results point to a story of increasing social isolation across the life course, a story beginning in late adolescence and emerging adulthood and continuing through late life for both men and women. This finding is consistent with prior research indicating a greater risk of social isolation at older ages but adds disturbing evidence of a lifelong process of steadily declining social connection for men and women that begins in emerging adulthood. Despite men and women’s shared pattern of increasing social isolation across the life course, the nature of gender differences in isolation varies by age and partnership status.
Gender Matters Over the Life Course
Taken together, prior studies on gender and social isolation provide mixed results about whether men or women are more isolated. With traditional approaches, marital status is an item within the isolation measure and age is a covariate. We began with that approach in this study. As shown in Figure 1, it appears that men are more isolated than women in the younger Add Health sample and that women are more isolated than men in the older HRS sample. Yet additional analyses of age trajectories in social isolation demonstrate the importance of life course change in understanding gendered experiences of social isolation. In the Add Health sample (Figure 2, Panel A), girls/women remain less isolated than boys/men from ages 12 to 42, and the gap narrows only slightly over time. In the older HRS sample (Figure 2, Panel B), there was a narrow gender gap at age 50, with women a bit less isolated than men, but women became more isolated than men at around age 55, and the gender gap continued to grow through late life. However, when we take marital/partnership history into account, an even more complicated picture emerges.
Marital History Matters
Gendered trajectories of isolation unfold differently depending on marital/partnership histories. In the younger Add Health sample, as shown in Figure 3 (Panel A), men and women exhibit similar patterns of increasing isolation from ages 18 to 42 regardless of partnership status, with higher levels of isolation for men than women at all ages. However, these patterns vary somewhat depending on partnership histories. At younger ages (up to about age 25), the stably partnered are more isolated than those who never married or have disrupted-partnership histories, but the stably partnered also experience more stability in their isolation levels over time. By contrast, their never married and disrupted-partnership peers exhibit a steeper increase in isolation over time so that from age 28, the stably partnered are comparatively less isolated (results not shown, available on request). This pattern may emerge, in part, because younger unpartnered adults have more opportunities to socialize and sustain their more diverse friendship networks (Kalmijn 2012). The earlier years of marriage may be more isolating for men and women as they focus more on their relationship and family formation. Yet as the stably partnered grow older, their connections to extended family and community (including through children) may lead to greater stability and less isolation relative to their unmarried and disrupted-partnership peers. Notably, regardless of partnership history, women seem to be less isolated than men from age 18 to 42.
In the older HRS sample, as shown in Figure 3 (Panel B), we get a glimpse into how patterns may continue to change with advancing age. Unfortunately, we continue to see increasing levels of social isolation with age for both men and women. In contrast to the Add Health results, the HRS gender gap is smaller for the stably partnered than for those with disrupted-partnership histories and the never married. Among the stably partnered, women are less isolated than men to about age 60 (the gender gap is no longer statistically significant after age 62), but women experience a faster rate of increase in isolation than do men such that women become steadily more isolated than men beginning around age 68. Thus, for older women, the partnered may be at a disadvantage compared to the unpartnered. This may occur because partnered women become increasingly likely with age to play a role in caregiving for their spouse and other family members, and caregiving is a known risk factor for social isolation in later life (National Academies of Sciences, Engineering, and Medicine 2020). This finding of increasing social isolation for older partnered women warrants greater attention from practitioners and policy makers. Neoliberal policies have increasingly pushed family members, particularly wives/women, into caregiving roles that may increase isolation, with health-damaging results (Polivka 2017). Gender differences may converge for some groups at advanced ages because increasing health and mobility problems contribute more to social isolation among women (National Academies of Sciences, Engineering, and Medicine 2020). Notably, never married men and women are substantially more isolated than the partnered and previously partnered from midlife through later life.
Gender and Constrained Choices
A constrained choice framework (Bird and Rieker 2008) suggests that the ways in which men and women connect (or not) to those around them reflect lifelong exposure to structural forces that tend to promote or to discourage social connection (Umberson and Montez 2010), and there is abundant evidence that these social forces differ for men and women (Ridgeway 2011). A gender-as-relational perspective (Springer et al. 2012) further suggests these social forces may play out differently for men and women who are married/partnered compared to those who are not. Gender influences what we do on a daily and long-term basis, including activities that foster social connectivity and isolation. Gender constraints imposed on men and women contribute to lifelong differences in their social connectivity, but some types of constraints, such as women’s greater responsibility for kin-keeping and child care, may actually promote and sustain social connections over the life course, whereas other types of constraints, such as women’s greater involvement in caregiving for their spouse, may promote greater social isolation, particularly at older ages (National Academies of Sciences, Engineering, and Medicine 2020). Men’s greater reliance on women to sustain their social connections may help to explain why married men are less isolated than unmarried men even apart from their connection to a spouse/partner.
Measuring Social Isolation
The present findings point to the need to consider when to include marital/partnership status in measures of social isolation and when to examine the partnered and unpartnered separately. Certainly, having a spouse/partner is an important source of social connection, but the present results suggest that men tend to be more isolated than women among the married and the unmarried. Perhaps future research should consider both approaches—with a measure that includes partnership status and then also looking separately at the partnered/unpartnered. This may become even more important in the future as the proportion of the population that is unmarried continues to increase (Raley and Sweeney 2020; Smock and Schwartz 2020). This also raises the possibility that measures of social isolation should assess a broader range of social connections. As House (2001) has argued, it is not a particular social connection that matters; rather, a broad range of social connections may be interchangeable in their ability to promote health. We might begin to think of social “poly-dosing” as a more comprehensive approach of assessing degree of social connection/isolation. This approach might also have greater utility in helping us understand how gendered patterns of isolation change over the life course and how certain types of connections impose greater constraints or more opportunities than others for social connectivity.
Future Research
Returning to the 1988 Science (House et al. 1988) article’s call for more research on how social position shapes patterns of social isolation, future research should attend to race, ethnicity, and socioeconomic status in addition to gender and intersectionality as predictors of social isolation (Chatters et al. 2018; Taylor et al. 2019). In the present study, we addressed gender differences in heterosexual relationships, but future research should attend to how gendered patterns of social isolation may differ for LGBTQ+ populations. Prior research suggests higher levels of social isolation in LGBTQ+ populations (Fredriksen-Goldsen et al. 2013), yet we know little about sexual/gender diversity in isolation for those who are partnered/married compared to those who are not. A growing body of evidence built on a gender-as-relational perspective shows that the relationship dynamics of gay and lesbian couples often differ from those of heterosexual couples in ways that influence patterns of social connection and isolation (Thomeer et al. 2020). For example, gay and lesbian spouses are more likely than heterosexual spouses to share in caregiving for aging parents and to play a more equitable role in caring for each other during periods of physical illness (Reczek and Umberson 2016).
Limitations
We relied on two national longitudinal data sets to provide a more comprehensive picture of life course change in social isolation from adolescence to late adulthood, but these two data sets are not directly comparable. These data sets include different samples, different age cohorts, slightly different measures of isolation, and different frequencies and number of data collections, among other important differences. Thus, any conclusions about overall life course change in social isolation should be viewed as suggestive and with some caution. Also, the scope of this study does not encompass the entire life course because adults ages 43 to 49 could not be analyzed with the data. Nonetheless, the results in this study offer a baseline for further investigation of life course factors when examining gendered patterns of social isolation. Moreover, gendered social isolation across the life course identified here is likely to vary based on a host of additional social factors, such as race and social class. Future investigations of gender-based differences in social isolation have the potential for enhancing knowledge of how social connectedness contributes to broader processes of cumulative advantage/disadvantage for diverse populations across the life course.
CONCLUSION
Perhaps the most striking finding from this study is the steady increase in social isolation experienced throughout by both men and women, albeit with generally more disadvantage for boys/men than girls/women. It is a sad commentary that humans who rely on social connection for physical and mental health, and even survival, begin to experience diminishing levels of connection as early as emerging adulthood. Yet the present study suggests that social contexts associated with partnership status have the potential to alter gendered trajectories of social isolation over time. We need a much deeper understanding of the social conditions that may stabilize or reduce social isolation throughout the life course. Although here have been recent calls for more public health attention to social isolation in the United States (Holt-Lunstad 2022), very little attention has been directed toward isolation as it emerges in the early life course or toward predictors of social isolation throughout the life course. Rising rates of mental health problems and suicidality among youth (Han et al. 2018) as well as increased isolation associated with the COVID pandemic (Kim and Jung 2021; Peng and Roth 2021) point to a potentially growing problem of social isolation in the United States. We must recognize the power of social isolation to diminish quality and length of life. This means devoting policy efforts and resources to identifying those most at risk (e.g., based on gender, race, life course stage) and to fostering and supporting a community of social connection from childhood through end of life.
FUNDING
The author(s) disclosed receipt of the following financial support for the research, authorship, and/or publication of this article: This research was supported, in part, by grant R01AG69969 from the National Institute on Aging (PI, Debra Umberson); grant P30AG066614 awarded to the Center on Aging & Population Sciences at the University of Texas at Austin by the National Institute on Aging, and grant P2CHD042849 awarded to the Population Research Center at The University of Texas at Austin by the Eunice Kennedy Shriver National Institute of Child Health and Human Development.
Biographies
Debra Umberson is professor of sociology and director of the Center on Aging and Population Sciences at the University of Texas-Austin. Her research focuses on social factors that influence population health over the life course. With support from the National Institute on Aging, she is collecting longitudinal data from gay, lesbian, and straight couples to assess how spouses influence each other’s health from midlife to later life. She also examines racial-ethnic differences in exposure to the death of family members and the implications for health and mortality risk.
Zhiyong Lin is a postdoctoral fellow in the Population Research Center and Center on Aging and Population Sciences at the University of Texas at Austin. He studies family dynamics and health inequalities over the life course. His work covers various country settings, including the United States, China, and India.
Hyungmin Cha is a doctoral candidate in the Department of Sociology and the Population Research Center and Center on Aging and Population Sciences at the University of Texas at Austin. His research explores how inequalities in adult health and mortality arise from a key fundamental cause of diseases, with current work examining dementia and mortality in later life related to socioeconomic and social resources across the life course.
REFERENCES
- Berkman Lisa F., and Syme Leonard. 1979. “Social Networks, Host Resistance and Mortality: A Nine-Year Follow-Up Study of Alameda County Residents.” American Journal of Epidemiology 109(2):186–204. doi: 10.1093/aje/kwx103. [DOI] [PubMed] [Google Scholar]
- Bird Chloe E., and Rieker Patricia P.. 2008. Gender and Health: The Effects of Constrained Choices and Social Policies. Cambridge, UK: Cambridge University Press. [Google Scholar]
- Cha Hyungmin, and Crosnoe Robert. 2022. “The Health of Mothers of Adult Children with Serious Conditions.” Journal of Marriage and Family 84(3):734–51. doi: 10.1111/jomf.12823. [DOI] [PMC free article] [PubMed] [Google Scholar]
- Chatters Linda M., Taylor Harry Owen, Nicklett Emily J., and Taylor Robert Joseph. 2018. “Correlates of Objective Social Isolation from Family and Friends among Older Adults.” Healthcare 6(24):1–14. doi: 10.3390/healthcare6010024. [DOI] [PMC free article] [PubMed] [Google Scholar]
- Cornwell Benjamin, and Schafer Markus H.. 2016. “Social Networks in Later Life.” Pp. 181–201 in Handbook of Aging and the Social Sciences. 8th ed., edited by George LK and Ferraro KF. Amsterdam: Elsevier. [Google Scholar]
- Coser Lewis A. 1974. Greedy Institutions: Patterns of Undivided Commitment. New York, NY: Free Press. [Google Scholar]
- Coyle Caitlin E., and Dugan Elizabeth. 2012. “Social Isolation, Loneliness and Health among Older Adults.” Journal of Aging and Health 24(8):1346–63. doi: 10.1177/0898264312460275. [DOI] [PubMed] [Google Scholar]
- Crosnoe Robert, and Johnson Monica Kirkpatrick. 2011. “Research on Adolescence in the Twenty-First Century.” Annual Review of Sociology 37:439–60. doi: 10.1146/annurev-soc-081309-150008. [DOI] [PMC free article] [PubMed] [Google Scholar]
- Cudjoe Thomas K. M., Roth David L., Szanton Sarah L., Wolff Jennifer L., Boyd Cynthia M., and Thorpe Roland J.. 2020. “The Epidemiology of Social Isolation: National Health and Aging Trends Study.” Journals of Gerontology, Series B: Psychological Sciences and Social Sciences 75(1):107–13. doi: 10.1093/geronb/gby037. [DOI] [PMC free article] [PubMed] [Google Scholar]
- Erickson Rebecca J. 2005. “Why Emotion Work Matters: Sex, Gender, and the Division of Household Labor.” Journal of Marriage and Family 67(2):337–51. doi: 10.1111/j.0022-2445.2005.00120.x. [DOI] [Google Scholar]
- Ertel Karen A., Glymour M. Maria, and Berkman Lisa F.. 2008. “Effects of Social Integration on Preserving Memory Function in a Nationally Representative U.S. Elderly Population.” American Journal of Public Health 98(7):1215–20. doi: 10.2105/AJPH.2007.113654. [DOI] [PMC free article] [PubMed] [Google Scholar]
- Fitzmaurice Garrett M., Laird Nan M., and Ware James H.. 2011. Applied Longitudinal Analysis. 2nd ed. Hoboken, NJ: John Wiley & Sons. [Google Scholar]
- Fredriksen-Goldsen Karen I., Kim Hyun-Jun, Barkan Susan E., Muraco Anna, and Hoy-Ellis Charles P.. 2013. “Health Disparities among Lesbian, Gay, and Bisexual Older Adults: Results from a Population-Based Study.” American Journal of Public Health 103(10):1802–809. doi: 10.2105/AJPH.2012.301110. [DOI] [PMC free article] [PubMed] [Google Scholar]
- Han Beth, Compton Wilson M., Blanco Carlos, Colpe Lisa, Huang Larke, and McKeon Richard. 2018. “National Trends in the Prevalence of Suicidal Ideation and Behavior among Young Adults and Receipt of Mental Health Care among Suicidal Young Adults.” Journal of the American Academy of Child and Adolescent Psychiatry 57(1):20–27. doi: 10.1016/j.jaac.2017.10.013. [DOI] [PubMed] [Google Scholar]
- Harris Kathleen Mullan, Carolyn Tucker Halpern Eric A. Whitsel, Hussey Jon M., Killeya-Jones Ley A., Tabor Joyce, and Dean Sarah C.. 2019. “Cohort Profile: The National Longitudinal Study of Adolescent to Adult Health.” International Journal of Epidemiology 48(5):1415–1415k. doi: 10.1093/ije/dyz115. [DOI] [PMC free article] [PubMed] [Google Scholar]
- Hochschild Arlie Russell. 2012. The Managed Heart: Commercialization of Human Feeling. Oakland: University of California Press. [Google Scholar]
- Holt-Lunstad Julianne. 2022. “Social Connection as a Public Health Issue: The Evidence and a Systemic Framework for Prioritizing the ‘Social’ in Social Determinants of Health.” Annual Review of Public Health 43:193–213. doi: 10.1146/annurev-publhealth-052020-110732. [DOI] [PubMed] [Google Scholar]
- Holt-Lunstad Julianne, Smith Timothy B., Baker Mark, Harris Tyler, and Stephenson David. 2015. “Loneliness and Social Isolation as Risk Factors for Mortality: A Meta-analytic Review.” Perspectives on Psychological Science 10(2):227–37. doi: 10.1177/1745691614568352. [DOI] [PubMed] [Google Scholar]
- House James S. 2001. “Social Isolation Kills, but How and Why?” Psychosomatic Medicine 63(2):273–74. doi: 10.1097/00006842-200103000-00011. [DOI] [PubMed] [Google Scholar]
- House James S., Landis Karl R., and Umberson Debra. 1988. “Social Relationships and Health.” Science 241(4865):540–45. doi: 10.1126/science.3399889. [DOI] [PubMed] [Google Scholar]
- Kalmijn Matthijs. 2012. “Longitudinal Analyses of the Effects of Age, Marriage, and Parenthood on Social Contacts and Support.” Advances in Life Course Research 17(4):177–90. doi: 10.1016/j.alcr.2012.08.002. [DOI] [Google Scholar]
- Kamis Christina, and Copeland Molly. 2020. “The Long Arm of Social Integration: Gender, Adolescent Social Networks, and Adult Depressive Symptom Trajectories.” Journal of Health and Social Behavior 61(4):437–52. doi: 10.1177/0022146520952769. [DOI] [PubMed] [Google Scholar]
- Kim Harris Hyun Soo, and Jung Jong Hyun. 2021. “Social Isolation and Psychological Distress during the COVID-19 Pandemic: A Cross-national Analysis.” The Gerontologist 61(1):103–13. doi: 10.1093/geront/gnaa168. [DOI] [PMC free article] [PubMed] [Google Scholar]
- Kotwal Ashwin A., Cenzer Irena S., Waite Linda J., Covinsky Kenneth E., Perissinotto Carla M., Boscardin W. John, Hawkley Louise C., Dale William, and Smith Alexander K.. 2021. “The Epidemiology of Social Isolation and Loneliness among Older Adults during the Last Years of Life.” Journal of the American Geriatrics Society 69(11):3081–91. doi: 10.1111/jgs.17366. [DOI] [PMC free article] [PubMed] [Google Scholar]
- Kuiper Jisca S., Zuidersma Marij, Oude Voshaar Richard C., Zuidema Sytse U., van den Heuvel Edwin R., Stolk Ronald P., and Smidt Nynke. 2015. “Social Relationships and Risk of Dementia: A Systematic Review and Meta-analysis of Longitudinal Cohort Studies.” Ageing Research Reviews 22:39–57. doi: 10.1016/j.arr.2015.04.006. [DOI] [PubMed] [Google Scholar]
- Lin I-Fen, Brown Susan L., Wright Matthew R., and Hammersmith Anna M.. 2019. “Depressive Symptoms Following Later-Life Marital Dissolution and Subsequent Repartnering.” Journal of Health and Social Behavior 60(2):153–68. doi: 10.1177/0022146519839683. [DOI] [PMC free article] [PubMed] [Google Scholar]
- Liu Hui, and Umberson Debra J.. 2008. “The Times They Are a Changin’: Marital Status and Health Differentials from 1972 to 2003.” Journal of Health and Social Behavior 49(3):239–53. doi: 10.1177/002214650804900301. [DOI] [PMC free article] [PubMed] [Google Scholar]
- Michael Yvonne L., Berkman Lisa F., Colditz Graham A., and Kawachi Ichiro. 2001. “Living Arrangements, Social Integration, and Change in Functional Health Status.” American Journal of Epidemiology 153(2):123–31. doi: 10.1093/aje/153.2.123. [DOI] [PubMed] [Google Scholar]
- Muthén Bengt, Asparouhov Tihomir, Hunter Aimee M., and Leuchter Andrew F.. 2011. “Growth Modeling with Nonignorable Dropout: Alternative Analyses of the STAR*D Antidepressant Trial.” Psychological Methods 16(1):17–33. doi: 10.1037/a0022634. [DOI] [PMC free article] [PubMed] [Google Scholar]
- Naito Ryo, Leong Darryl P., Shrikant Ishver Bangdiwala Martin Mckee, Subramanian SV, Rangarajan Sumathy, Islam Shofiqul, et al. 2021. “Impact of Social Isolation on Mortality and Morbidity in 20 High-Income, Middle-Income and Low-Income Countries in Five Continents.” BMJ Global Health 6(3):e004124. doi: 10.1136/bmjgh-2020-004124. [DOI] [PMC free article] [PubMed] [Google Scholar]
- National Academies of Sciences, Engineering, and Medicine. 2020. Social Isolation and Loneliness in Older Adults: Opportunities for the Health Care System. Washington, DC: The National Academies Press. [PubMed] [Google Scholar]
- Pantell Matthew, Rehkopf David, Jutte Douglas, Syme S. Leonard, Balmes John, and Adler Nancy. 2013. “Social Isolation: A Predictor of Mortality Comparable to Traditional Clinical Risk Factors.” American Journal of Public Health 103(11):2056–62. doi: 10.2105/AJPH.2013.301261. [DOI] [PMC free article] [PubMed] [Google Scholar]
- Peng Siyun, and Roth Adam R.. 2021. “Social Isolation and Loneliness Before and during the COVID-19 Pandemic: A Longitudinal Study of U.S. Adults Older than 50.” Journals of Gerontology, Series B: Psychological Sciences and Social Sciences. doi: 10.1093/geronb/gbab068. [DOI] [PMC free article] [PubMed] [Google Scholar]
- Penninkilampi Ross, Casey Anne-Nicole, Singh Maria Fiatarone, and Brodaty Henry. 2018. “The Association between Social Engagement, Loneliness, and Risk of Dementia: A Systematic Review and Meta-analysis.” Journal of Alzheimer’s Disease 66(4):1619–33. doi: 10.3233/JAD-180439. [DOI] [PubMed] [Google Scholar]
- Perissinotto Carla M., and Covinsky Kenneth E.. 2014. “Living Alone, Socially Isolated or Lonely—What Are We Measuring?” Journal of General Internal Medicine 29(11):1429–31. doi: 10.1007/s11606-014-2977-8. [DOI] [PMC free article] [PubMed] [Google Scholar]
- Polivka Larry J. 2017. “Women and the Crisis of Care in the United States.” Generations: Journal of the American Society on Aging 41(4):29–35. doi: 10.2307/26556314. [DOI] [Google Scholar]
- Raley R. Kelly, and Sweeney Megan M.. 2020. “Divorce, Repartnering, and Stepfamilies: A Decade in Review.” Journal of Marriage and Family 82(1):81–99. doi: 10.1111/jomf.12651. [DOI] [PMC free article] [PubMed] [Google Scholar]
- Reczek Corinne, Gebhardt-Kram Lauren, Kissling Alexandra, and Umberson Debra. 2018. “Healthcare Work in Marriage: How Gay, Lesbian, and Heterosexual Spouses Encourage and Coerce Medical Care.” Journal of Health and Social Behavior 59(4):554–68. doi: 10.1177/0022146518808718. [DOI] [PMC free article] [PubMed] [Google Scholar]
- Reczek Corinne, and Umberson Debra. 2016. “Greedy Spouse, Needy Parent: The Marital Dynamics of Gay, Lesbian, and Heterosexual Intergenerational Caregivers.” Journal of Marriage and Family 78(4):957–74. doi: 10.1111/jomf.12318. [DOI] [PMC free article] [PubMed] [Google Scholar]
- Ridgeway Cecilia. 2011. Framed by Gender: How Gender Inequality Persists in the Modern World. New York, NY: Oxford University Press. [Google Scholar]
- Rosenfield Sarah, and Mouzon Dawne. 2013. “Gender and Mental Health.” Pp. 277–96 in Handbook of the Sociology of Mental Health, edited by Aneshensel CS, Phelan JC, and Bierman A. Dordrecht: Springer. [Google Scholar]
- Russell David, and Taylor John. 2009. “Living Alone and Depressive Symptoms: The Influence of Gender, Physical Disability, and Social Support among Hispanic and Non-Hispanic Older Adults.” Journals of Gerontology, Series B: Psychological Sciences and Social Sciences 64(1):95–104. doi: 10.1093/geronb/gbn002. [DOI] [PMC free article] [PubMed] [Google Scholar]
- Sarkisian Natalia, and Gerstel Naomi. 2008. “Till Marriage Do Us Part: Adult Children’s Relationships with Their Parents.” Journal of Marriage and Family 70(2):360–76. doi: 10.1111/j.1741-3737.2008.00487.x. [DOI] [Google Scholar]
- Sasson Isaac, and Umberson Debra J.. 2014. “Widowhood and Depression : New Light on Gender Differences, Selection, and Psychological Adjustment.” Journals of Gerontology, Series B: Psychological Sciences and Social Sciences 69(1):135–45. doi: 10.1093/geronb/gbt058. [DOI] [PMC free article] [PubMed] [Google Scholar]
- Smock Pamela J., and Schwartz Christine R.. 2020. “The Demography of Families: A Review of Patterns and Change.” Journal of Marriage and Family 82(1):9–34. doi: 10.1111/jomf.12612. [DOI] [PMC free article] [PubMed] [Google Scholar]
- Springer Kristen W., Hankivsky Olena, and Bates Lisa M.. 2012. “Gender and Health: Relational, Intersectional, and Biosocial Approaches.” Social Science & Medicine 74:1661–66. doi: 10.1016/j.socscimed.2012.03.001. [DOI] [PubMed] [Google Scholar]
- Steptoe Andrew, Shankar Aparna, Demakakos Panayotes, and Wardle Jane. 2013. “Social Isolation, Loneliness, and All-Cause Mortality in Older Men and Women.” Proceedings of the National Academy of Sciences of the United States of America 110(15):5797–801. doi: 10.1073/pnas.1219686110. [DOI] [PMC free article] [PubMed] [Google Scholar]
- Tanskanen Jussi, and Anttila Timo. 2016. “A Prospective Study of Social Isolation, Loneliness, and Mortality in Finland.” American Journal of Public Health 106(11):2042–49. doi: 10.2105/AJPH.2016.303431. [DOI] [PMC free article] [PubMed] [Google Scholar]
- Taylor Robert Joseph, Chatters Linda M., and Taylor Harry O.. 2019. “Race and Objective Social Isolation: Older African Americans, Black Caribbeans, and Non-Hispanic Whites.” Journals of Gerontology, Series B: Psychological Sciences and Social Sciences 74(8):1429–40. [DOI] [PMC free article] [PubMed] [Google Scholar]
- Taylor Shelley E. 2011. “Social Support: A Review.” Pp. 189–214 in The Oxford Handbook of Health Psychology, edited by Friedman HS. New York, NY: Oxford University Press. [Google Scholar]
- Taylor Shelley E., Klein Laura Cousino, Lewis Brian P., Gruenewald Tara L., Gurung Regan A. R., and Updegraff John A.. 2000. “Biobehavioral Responses to Stress in Females: Tend-and-Befriend, Not Fight-or-Flight.” Psychological Review 107(3):411–29. doi: 10.1037//0033-295X.107.3.411. [DOI] [PubMed] [Google Scholar]
- Thomeer Mieke Beth, Umberson Debra, and Reczek Corinne. 2020. “The Gender-as-Relation Approach for Theorizing about Romantic Relationships of Sexual and Gender Minority Mid- to Later-Life Adults.” Journal of Family Theory & Review 12(2):220–37. doi: 10.1111/jftr.12368. [DOI] [PMC free article] [PubMed] [Google Scholar]
- Uchino Bert N., Bowen Kimberly, Carlisle McKenzie, and Birmingham Wendy. 2012. “Psychological Pathways Linking Social Support to Health Outcomes: A Visit with the ‘Ghosts’ of Research Past, Present, and Future.” Social Science & Medicine 74(7):949–57. doi: 10.1016/j.socscimed.2011.11.023. [DOI] [PMC free article] [PubMed] [Google Scholar]
- Umberson Debra. 1992. “Gender, Marital Status and the Social Control of Health Behavior.” Social Science & Medicine 34(8):907–17. doi: 10.1016/0277-9536(92)90259-S. [DOI] [PubMed] [Google Scholar]
- Umberson Debra. 2017. “Black Deaths Matter: Race, Relationship Loss, and Effects on Survivors.” Journal of Health and Social Behavior 58(4):405–20. doi: 10.1177/0022146517739317. [DOI] [PMC free article] [PubMed] [Google Scholar]
- Umberson Debra, Chen Meichu D., House James S., Hopkins Kristine, and Slaten Ellen. 1996. “The Effect of Social Relationships on Psychological Well-Being: Are Men and Women Really So Different?” American Sociological Review 61(5):837–57. doi: 10.2307/2096456. [DOI] [Google Scholar]
- Umberson Debra, Donnelly Rachel, and Pollitt Amanda M.. 2018. “Marriage, Social Control, and Health Behavior: A Dyadic Analysis of Same-Sex and Different-Sex Couples.” Journal of Health and Social Behavior 59(3):429–46. doi: 10.1177/0022146518790560. [DOI] [PMC free article] [PubMed] [Google Scholar]
- Umberson Debra, and Montez Jennifer Karas. 2010. “Social Relationships and Health: A Flashpoint for Health Policy.” Journal of Health and Social Behavior 51(Suppl.):S54–66. doi: 10.1177/0022146510383501. [DOI] [PMC free article] [PubMed] [Google Scholar]
- Umberson Debra, Olson Julie Skalamera, Crosnoe Robert, Liu Hui, Pudrovska Tetyana, and Donnelly Rachel. 2017. “Death of Family Members as an Overlooked Source of Racial Disadvantage in the United States.” Proceedings of the National Academy of Sciences 114(5):915–20. doi: 10.1073/pnas.1605599114. [DOI] [PMC free article] [PubMed] [Google Scholar]
- Umberson Debra, Thomeer Mieke Beth, and Lodge Amy C.. 2015. “Intimacy and Emotion Work in Lesbian, Gay, and Heterosexual Relationships.” Journal of Marriage and Family 77(2):542–56. doi: 10.1111/jomf.12178. [DOI] [PMC free article] [PubMed] [Google Scholar]
- Valtorta Nicole K., Kanaan Mona, Gilbody Simon, Ronzi Sara, and Hanratty Barbara. 2016. “Loneliness and Social Isolation as Risk Factors for Coronary Heart Disease and Stroke: Systematic Review and Meta-analysis of Longitudinal Observational Studies.” Heart 102:1009–16. doi: 10.1136/heartjnl-2015-308790. [DOI] [PMC free article] [PubMed] [Google Scholar]
- Vandervoort Debra. 2000. “Social Isolation and Gender.” Current Psychology 19(3):229–36. [Google Scholar]
- West Candace, and Zimmerman Don H.. 1987. “Doing Gender.” Gender & Society 1(2):125–51. doi: 10.1177/0891243287001002002. [DOI] [Google Scholar]
- Williams Kristi, and Umberson Debra. 2004. “Marital Status, Marital Transitions, and Health: A Gendered Life Course Perspective.” Journal of Health and Social Behavior 45(1):81–98. doi: 10.1177/002214650404500106. [DOI] [PMC free article] [PubMed] [Google Scholar]
- Yang Yang Claire, Boen Courtney, Gerken Karen, Li Ting, Schorpp Kristen, and Harris Kathleen Mullan. 2016. “Social Relationships and Physiological Determinants of Longevity across the Human Life Span.” Proceedings of the National Academy of Sciences of the United States of America 113(3):578–83. doi: 10.1073/pnas.1511085112. [DOI] [PMC free article] [PubMed] [Google Scholar]
- Yang Yang Claire, Johnson Moira P., Schorpp Kristen M., Boen Courtney E., and Harris Kathleen Mullan. 2017. “Young Adult Risk Factors for Cancer: Obesity, Inflammation, and Sociobehavioral Mechanisms.” American Journal of Preventive Medicine 53(3S1):S21–29. doi: 10.1016/j.amepre.2017.04.025. [DOI] [PMC free article] [PubMed] [Google Scholar]
- Yang Yang Claire, Li Ting, and Ji Yinchun. 2013. “Impact of Social Integration on Metabolic Functions: Evidence from a Nationally Representative Longitudinal Study of U.S. Older Adults.” BMC Public Health 13:1210. doi: 10.1186/1471-2458-13-1210. [DOI] [PMC free article] [PubMed] [Google Scholar]
- Yang Yang Claire, McClintock Martha K., Kozloski Michael, and Li Ting. 2013. “Social Isolation and Adult Mortality: The Role of Chronic Inflammation and Sex Differences.” Journal of Health and Social Behavior 54(2):183–203. doi: 10.1177/0022146513485244. [DOI] [PMC free article] [PubMed] [Google Scholar]