

Abstract
Rapid, low-cost, and multiplexed biomolecule detection is an important goal in the development of effective molecular diagnostics. Our recent work has demonstrated a microfluidic biochip device that can electrically quantitate a protein target with high sensitivity. This platform detects and quantifies a target analyte by counting and capturing micron-sized beads in response to an immunoassay on the bead surface. Existing microparticles limit the technique to the detection of a single protein target and lack the magnetic properties required for separation of the mciroparticles for direct measurements from whole blood. Here, we report new precisely engineered microparticles that achieve electrical multiplexing and adapt this platform for low-cost and label-free multiplexed electrical detection of biomolecules. Droplet microfluidic synthesis yielded highly-monodisperse populations of magnetic hydrogel beads (MHBs) with the necessary properties for multiplexing the electrical Coulter counting on a chip. Each bead population was designed to contain a different amount of the hydrogel material, resulting in a unique electrical impedance signature during Coulter counting, thereby enabling unique identification of each bead. These monodisperse bead populations span a narrow range of sizes ensuring that all can be captured sensitively and selectively under simultaneously flow. Incorporating these newly synthesized beads, we demonstrate versatile and multiplexed biomolecule detection of proteins or DNA targets. This development of multiplexed beads for the electrical detection of biomolecules, provides a critical advancement towards multiplexing of the Coulter counting approach and the development of a low cost point-of-care diagnostic sensor.
Graphical Abstract

Electrically distinct microparticles enable rapid, versatile, and multiplexed electrical detection of biomolecules using Coulter counting-based detection.
1. Introduction
Accurate and timely monitoring of biomarker levels can dramatically improve the treatment of disease by improving diagnosis.1–7 It is well understood that the combination of multiple biomarker measurements results in increased predictive and diagnostic power when compared to a single measurement.8–14 Accordingly, there is considerable interest in the development of improved methods for multiplexed biomarker screening. Existing methods for multiplexed biomarker measurement typically require chemical labeling schemes that encode the presence and quantity of each biomolecule target using color and intensity of light,15–19 or using electrochemical20,21 or mass spectrometry -based detection.22 However, these techniques typically require complex, expensive instrumentation and technical expertise to achieve multiplexing, and are not suitable for widespread clinical adoption. Label free electrical detection of biomolecules presents a promising, low-cost alternative. Previous work has demonstrated a strategy of protein quantification using a coulter counter that relies on biomolecule mediated bead aggregation to increase particle impedance in response to the quantity of the target.23 However, this technique requires the full range of impedance signals to quantify a single biomolecule target, making it inherently singleplex. Our recent work has demonstrated a simplified alternative method that requires only a limited impedance range to electrically quantify either cells or a single protein target.24–26 This differential counting technology requires three components connected in series: an entrance Coulter counter, a capture chamber, and an exit Coulter counter (Figure 1). When detecting proteins, the device enumerates the total number of micron-sized particles that enter by electrical counting. Subsequently, these beads are captured on an array of pillars in proportion to the target analyte, using a sandwich-immunoassay, before the remaining uncaptured beads are counted as they pass the exit counter. The sandwiched immunoassay that takes place on the surface of each bead, tags the bead with biotin capture groups in proportion to the target analyte. This biotin increases the likelihood of bead capture which is measured by the difference in bead counts at the entrance and exit of the device. Using this platform, we demonstrated physiologically significant and sensitive detection of IL-6, a well-studied sepsis biomarker, (LOD: 127 pg mL−1).24 Despite its potential for further multiplexing, a lack of suitable microparticles limited this technique to the detection of a single target. Moreover, the beads used in this iteration of the device were not magnetic. Magnetic beads enable facile separation from cells which would be useful for a combined analysis of cells and proteins from whole blood.
Figure 1.

Schematic for the multiplexed bead counting device. Beads are counted as they flow past the aperture of the entrance Coulter counter (A). Beads are designed to produce distinct impedance signatures to enable multiplexing. After counting, the beads are captured as they flow through an array of pillars (B) inside the capture chamber. The beads pass a second Coulter counter as they exit the device. The capture percentage is measured and correlated to the concentration of the target analyte.
Multiplexed bead counting can be achieved straightforwardly by varying the size of the microparticles to result in distinct electrical signals.27 However, differently sized particles experience a different flow profile inside the device impacting the likelihood of capturing each bead. Multiplexed biomolecule detection requires a uniform capture response across multiple different beads on a single device. Accordingly, the size differences between each bead population must be minimized so that each bead type interacts with the capture pillars similarly and a proportional and sensitive capture response is obtained across all populations. Although microparticles of various sizes and material properties are available commercially, they are not currently designed with their impedance signal in mind. Consequently, there is lack of microparticles with the key set of properties required for multiplexing. Solid magnetic beads tend to have broad size distributions which necessitates even larger differences in size to obtain unique, non-overlapping populations. As a result, these particles fail to respond uniformly during multiplexed bead capture. To address the challenges and achieve electrical multiplexing, precisely engineered microparticles are needed. We synthesized new tightly spaced, monodisperse magnetic hydrogel bead populations that produce distinct impedance signatures to enable multiplexed electrical biomarker monitoring. A schematic overview of the proposed multiplex device is detailed in Figure 1.
In summary, suitable microparticles for electrical multiplexing must meet the following key requirements; (i) Each bead population must yield distinct electrical impedance signatures so that all beads can be uniquely identified during Coulter counting. Since the impedance of a particle measured by a Coulter counter is proportional to the volume of the conductive medium that it occupies, each distinct population must displace a unique volume of electrolyte.28 (ii) All populations should fit within a narrow range of sizes so that the capture efficiency of each bead is uniform and nonspecific capture is low across all beads. (iii) Each bead population must also have useful surface chemistry. Surface functional groups are needed to conjugate targeting biomolecules such as antibodies, aptamers, DNA sequences, etc. These targeting biomolecules are used to convert increased biomarker levels into an increased probability of bead capture through a sandwich assay. (iv) Magnetic properties are also necessary for on-chip manipulations of the beads. In addition, these magnetic properties allow for an additional level of multiplexing through an orthogonal measurement of non-magnetic microparticles. As an example, cells, which would otherwise produce overlapping impedances with similarly sized beads, could be counted and resolved by the device by using a magnet to isolate the two measurements. In this way, magnetic properties would enable cell and protein measurements on a single platform. Our previous publications,25,26 details a method of leukocyte counting and cell surface antigen-mediated cell capture that could be readily combined with a measurement of magnetic bead capture for multiplexed cell and biomolecule detection.
2. Experimental
2.1. Fabrication of Microfluidic Devices.
The electrical bead counting devices and capture chambers were fabricated according to previously detailed procedures.24 SEM images of the Coulter counting aperture and capture chamber were collected using a Hitachi S-2250N. Prior to imaging a layer of gold was sputtered to coat the capture chamber. The Microfluidic dropmaking devices were prepared using standard photolithography techniques. Device masters were prepared using SU-8 2010 (MicroChem) negative photoresist to coat a 3-inch silicon wafer to a height of 10 microns. The device structures (Figure S1) are patterned onto the photoresist using standard photolithography techniques. PDMS prepolymer and curing agent (Sylgard) are mixed in a 10:1 ratio and poured to coat the device master. The PDMS is degassed then cured at 90 °C for at least 1 hour. Cured PDMS slabs are cut from the master, and device ports are cast using a 1 mm biopsy punch (TedPella Inc.). Prior to bonding, the surfaces of the PDMS and glass slide (Corning) are activated for 10–15 seconds using a 30 W plasma cleaner (Harrick Plasma). The PDMS is pressed onto the glass slide forming an irreversible bond. The channels of the device are flushed with Aquapel (PPG Industries) and then purged with Nitrogen rendering the surface hydrophobic.
2.2. Hydrogel Synthesis.
Polyacrylamide-based hydrogels were prepared using a flow-focusing droplet generation device. The carboxyl-modified monomer, Acryloyl β-alanine (ABA), was synthesized from acryloyl chloride and β-alanine (Sigma Aldrich) and confirmed by 1H NMR (Figure S2). Acrylamide and bis-acrylamide were purchased from BioRad. The dispersed phase, a gel forming mixture consisting of 19:1 acrylamide monomers and crosslinkers, 1% ammonium persulfate and suspended magnetic nanoparticles (200 nm silica-coated, Creative Diagnostics) at a concentration of 5×10⁹ particles per mL, was prepared immediately prior to device operation. The continuous phase contains 2% 008-FluoroSurfactant (Ran Biotechnologies) in HFE-7500 fluorinated oil (3M) and is passed through a 0.2 μm PTFE syringe filter to exclude debris. Suitable flowrates that yielded 11 and 13 μm beads were determined experimentally. Smaller drops (~8 μm) were produced at 15:125 μL h−1 aq:oil which would swell to 11 μm in 1X PBS. Larger drops (~10 μm) were produced at 25:75 μL h−1 aq:oil which would swell to 13 μm in 1X PBS. The resulting droplets are collected in a 1.5 mL tube under mineral oil, which prevents evaporation. The emulsion is then heated to 90 °C to induce polymerization. The hydrogels are fully solidified after 1 hour. The magnetic hydrogels are released from the droplets by the addition of an excess of 20% 1H,1H,2H,2H-Perfluoro-1-octanol (Fisher Scientific) in HFE. The tube is vortexed and centrifuged. Then the fluorinated oil is removed. The hydrogels are washed once with hexanes to dissolve any unreacted monomers then washed 3 times with 0.2% Tween-20 in 1X PBS.
2.3. Characterization of Bead Properties.
ζ-potentials were measured on a Malvern Zetasizer Nano ZS (Malvern Instruments). A dilute bead suspension (1×10⁵ beads mL−1) in 0.01 M PB buffer (pH 7.4) was loaded into a disposable folded capillary cell and measured. Values are reported as the average of triplicate runs consisting of 100 scans each. To obtain transmission electron microscope (TEM) images, the hydrogels were washed 3 times with water to remove excess salts. 5 μL of a solution containing dispersed hydrogels were spotted on a TEM grid and freeze-dried. Samples were imaged at 20 kV using a JEOL 2010 Lab6 TEM. The bulk magnetic properties of each population of magnetic hydrogels was assessed using a Vibrating Sample Magnetometer (VSM). The magnetization of the hydrogels in response to an applied external magnetic field is detected as a current in an inductively coupled superconducting detection coil which is converted to voltage using a superconducting quantum interference device (SQUID). The SQUID output voltage is monitored as the applied field is varied from 10 kOe to −10 kOe measuring the magnetic response of the sample. The SQUID measurements are obtained at 5K and 300K for each sample.
Magnetic separation from cells was performed as follows; U-2 OS cells were trypsinized then resuspended in in a 2 μg mL−1 solution of Hoechst dye at 37 °C for 15 mins. These cells were resuspended in PBS and complete staining was confirmed by imaging. Stained cells and beads were mixed in an approximate 1:1 ratio and imaged again. The mixed suspension of beads and cells was placed on a magnet and the solution was removed. The remaining beads were resuspended in PBS and imaged again. Electrical measurements were obtained on a custom chip and analyzed as described previously.24 Fluorescent labeling of biotinylated beads was achieved using a 6.7 μg mL−1 solution of streptavidin, R-phycoerythrin conjugate (Fisher Scientific). The beads were incubated for approximately 15 minutes then washed to remove unbound dyes. Confocal images were obtained using a Zeiss 710 confocal scanner, an Axio Observer Z1 microscope, and a Spectra-Physics Ti:Sapphire laser. Other fluorescence measurements were obtained using a Guava easyCyte plus flow cytometer (Millipore).
2.4. Hydrogel Bead Functionalization.
Biomolecules were conjugated to the bead populations using carbodiimide coupling chemistry. The beads are washed with MES buffer: 0.1 M 2-(N-morpholino)ethansulfonic acid (pH 6). Then resuspended in 1 mM 1-Ethyl-3-(3-dimethylaminopropyl)carbodiimide (EDC) with 0.5 mM N-hydroxysulfosuccinimide (NHS) in MES and mixed for 15 min to activate the carboxyl groups on the bead. The beads are centrifuged or separated using a magnet and the solution is removed. The amine-containing molecule is then added, and the beads are mixed for 2 hours enabling covalent coupling through amide bond formation. For biotin functionalization, 4 or 20 μg mL−1 NH2-(PEG)2-Biotin (Fisher Scientific) in PBS (pH 7.4) was used. For antibody functionalization, 0.5 mg mL−1 Ab1IL6 (Fisher) or Ab1PCT (Abbexa) were used. For DNA functionalization, 90 μM DNA capture oligos with 3’ amine modification (IDT) were used. Following conjugation, unreacted biomolecules are removed during three washes with PBS. The functionalized hydrogels were then resuspended in a 1% BSA in PBS solution to block nonspecific interactions between the bead surface and the capture pillars.
2.5. Sandwiched Assays for Multiplexed Biomolecule Measurements.
The multiplexed biomolecule assays were adapted from our previously described protocol.24 For protein detection, MHB1, MHB2-Ab1IL6, and MHB4-Ab1PCT were mixed equally and incubated with a 500 ng mL−1 IL-6 (Shenandoah). The solution was removed, and the beads were resuspended in 5 μg mL−1 Ab2IL6-biotin and Ab2PCT-biotin probes to label proteins on the beads with biotin capture tags. For DNA detection, MHB1, MHB2-TP53CaptureOligo, MHB4-PIK3CACaptureOligo, were mixed equally and incubated in 15 μM TP53 gene fragments. Next, the solution was removed, and the beads were resuspended in 50 μM biotin labeled probes specific to each fragment in the assay. The solution was then heated to 65 °C then slowly cooled to 37 °C for sequence annealing. The sequences used in this protocol (Integrated DNA Technologies) are included as supplementary data. The prepared beads from each sandwiched assay were washed 3 times in PBS to remove any unbound probes prior to on-chip counting and capture.
3. Results and Discussion
3.1. Droplet Microfluidic Synthesis of Magnetic Hydrogel Beads.
Using droplet microfluidic techniques, we synthesized magnetic hydrogel beads (MHBs) with the properties required for electrical multiplexing of the differential bead counting device. To ensure that each bead population is highly monodisperse, we leveraged established drop microfluidic synthesis methods.29–33 Microfluidics generates monodisperse droplets that are used to template polymerization, creating nearly identical functional microparticles. The droplet generation rate is on the order of 10 kHz resulting the high throughput generation of tens of millions of beads per hour. Precise control of the particle size is achieved by varying the flow rate of the two immiscible phases during droplet formation. The chemical and physical properties of the resulting beads are controlled through the contents of the solution that is encapsulated into droplets. We used a polyacrylamide-based hydrogel scaffold to produce the multiplex beads due to its fast and simple aqueous-phase polymerization chemistry, low viscosity, water solubility, biocompatibility, and thermostability. Additionally, polyacrylamide hydrogels absorb large volumes of water to more closely match the density of the solution in which they are suspended. This density matching reduces settling during measurement, which would otherwise be counted as false positive bead capture. Conjugation of biomolecules to the hydrogel was enabled by the incorporation of a carboxylic acid moiety containing acrylamide monomer as shown in Figure 2A. The carboxyl groups incorporated in the hydrogel can be conjugated to various capture groups using established amide coupling chemistry.34,35 We also include 200 nm magnetic nanoparticles in solution along with the monomers and crosslinkers, to impart magnetic properties to the beads. The crosslinking ratio and total monomer content were chosen to form gels with an average pore size less than 40 nm,36 physically trapping the nanoparticles during polymerization.
Figure 2.
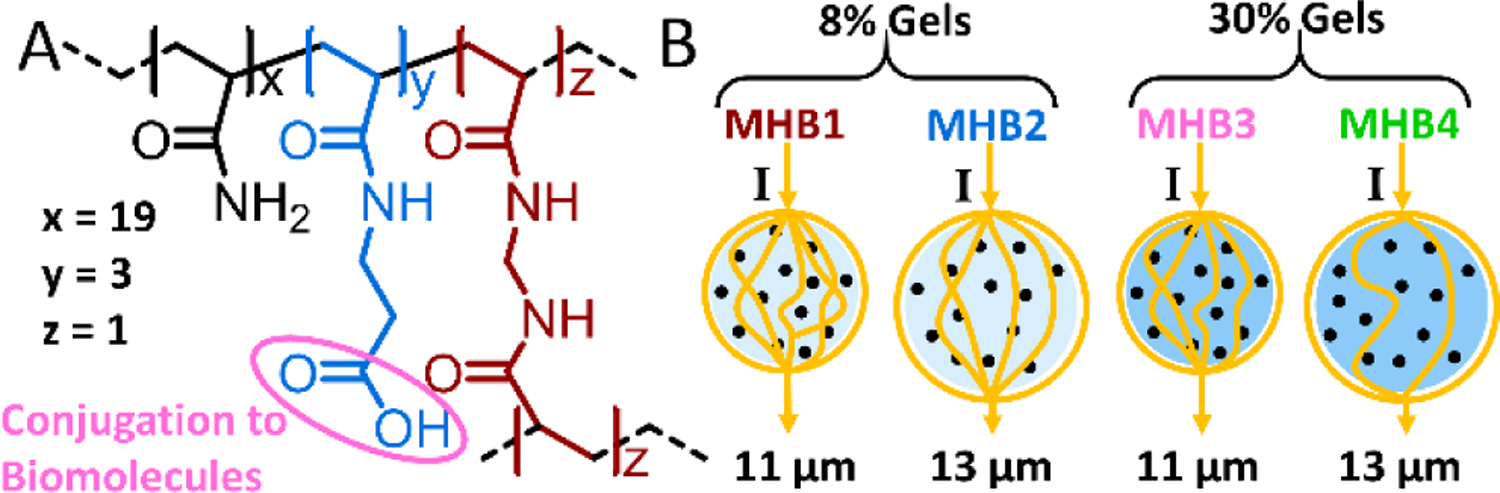
A) Chemical structure of the polyacrylamide-based hydrogel. B) Newly synthesized electrically distinct MHBs. Yellow lines indicate the current (I) at the Coulter counter. Black circles denote magnetic nanoparticles. The impedance signal produced by each bead is proportional to the amount of hydrogel material it contains.
As explained previously, the impedance signal produced by a microparticle corresponds to the volume of the conductive buffer it displaces. To synthesize beads with distinct impedance signatures, we varied the size and density of the hydrogel microparticles to produce beads with different solid volumes as shown in Figure 2B. Since these beads are hydrogels, electrical current (yellow lines) is partially able to flow through the buffer that fills the porous gel mesh. As such, beads with an increased gel density displace more conductive buffer without increasing the diameter of the microparticle. We produced 11 μm and 13 μm polyacrylamide hydrogel particles at ~8% w/v of acrylamide, denoted as MHB1 and MHB2 respectively. Additional 11 μm and 13 μm polyacrylamide hydrogel populations were produced at ~30% w/v which are respectively labeled MHB3 and MHB4. This size range was chosen so that the beads are compatible with mammalian cell sizes for simultaneous measurements of cells and proteins in the future.
As shown in Figure 3, monodisperse populations of MHBs are synthesized using drop microfluidic templated polymerization. The aqueous phase, composed of acrylamide monomers, crosslinkers, iron oxide nanoparticles, and ammonium persulfate, is pinched-off into droplets by fluorinated oil using a flow-focusing dropmaker (Figure 3A). The emulsion is collected off-chip and heated to facilitate polymerization. The surfactants in the fluorinated oil stabilize the droplet emulsion during heat induced polymerization preventing merging. (Figure 3B). The emulsion is then broken, and the hydrogel particles are dispersed in buffer where they absorb water and swell considerably (Figure 3C). The dispersed hydrogels remain monodisperse.
Figure 3.

A) The gel forming solution is encapsulated into monodisperse droplets in fluorocarbon oil. B) Image of the droplet emulsion after heat induced polymerization. C) Image of the same population of beads after swelling in PBS. D) Phase contrast images of the four bead populations. Scale bar is 20 μm. E) A suspension of stained cells was mixed with similarly sized magnetic hydrogel beads. The cells and beads can be easily distinguished by fluorescence. Following magnetic separation, the cells are removed.
3.2. Physical Characterization of Bead Properties.
We characterized the size, monodispersity, and morphology of the synthesized bead populations by microscope imaging and analysis. Optical images of the four synthesized MHB populations are shown in Figure 3D. Phase contrast was used to increase the visibility of the gels. The hydrogels are spherical in shape. MHB3 and MHB4 show heightened contrast compared to the lower density gels (MHB1 and MHB2) due to their increased gel content. The bead diameters of at least 100 hydrogels from each population were measured. MHB1 was synthesized with an average bead diameter of 10.9 μm and a standard deviation of 0.29 μm. MHB2 was 13.3 ±0.39 μm in diameter. Likewise, MHB3 and MHB4 had an average bead diameter of 11.1 ±0.33 μm and 13.1 ±0.38 μm respectively. These measurements confirm that each of the synthesized MHB populations are highly monodisperse with a coefficient of variation in the diameter of <3%.
The swelling of the hydrogel beads was also assessed by comparing the droplet size and the corresponding bead size when dispersed in PBS. The volume of the swelled beads was found to be ~2.2 times the droplet volume. This swelling factor was observed across bead types and is lower than the typical value for unmodified polyacrylamide microspheres.37 The observed degree of swelling is likely reduced due to the salt concentration of the buffer solution (137 mM NaCl) and the ionic character of the hydrogel. Ionic polyacrylamide hydrogels are known to show suppressed swelling behavior at mM concentrations of NaCl.38 The incorporation of ABA monomers is expected to yield a polyanionic gel in PBS (pH 7.4). The anionic character of the gels at pH 7.4 was confirmed by zeta potential measurements (−21.7 ±0.25 mV). Compact hydrogels are advantageous for Coulter detection due to their increased impedance relative to their size.
The magnetic properties of the synthesized beads were also assessed. TEM images of MHB1 following multiple washes (Figure S3) show magnetic nanoparticles distributed throughout the gels confirming that the nanoparticles are trapped within the hydrogel during polymerization. The incorporation of these particles imparts magnetic properties to the beads so that the gels can be pulled from solution using an external magnet (Figure S4). To demonstrate a magnetic separation, we mixed the MHBs with fluorescently labeled cells (Figure 3E). The mixed suspension of beads and cells was placed on a magnet and the solution was removed. The hydrogels were resuspended and imaged again to verify the magnetic separation. A SQUID magnetometer was used to measure the bulk magnetization and hysteresis behavior of the dried hydrogel beads (Figure S5) confirming that the hydrogel microparticles are paramagnetic. The saturation magnetization (Ms) of each sample was also obtained from the hysteresis plots. As an example, the Ms of MHB1 was 0.8 emu g−1 which was used to estimate that each microsphere contained on average 20 magnetic nanoparticles. A more detailed description of this calculation is provided in the supporting information. These experiments demonstrate the potential of these magnetic hydrogel beads for magnetic separation from cells, which is critical for the direct analysis of protein biomarkers in blood.
3.3. Electrical Characterization of MHBs.
The electrical impedance signatures of the bead populations were assessed by Coulter counting. The counter contains three microfabricated co-planar metallic electrodes aligned with the narrow apertures of a microfluidic channel. This impedance sensor design has been demonstrated to effectively measure the impedance of microparticles even at high flow speeds.39 When a bead passes through the aperture, it displaces a large fraction of conductive buffer, producing a spike in impedance (a drop in the conductivity of the medium). Figure 4 shows the differential impedance signal as the hydrogel beads flow past the electrodes of the Coulter counter. The biphasic impedance pulse enables particles with weaker signals to be more easily resolved from the noise.
Figure 4.

Electrical impedance traces of A) MHB1, B) MHB2, and C) MHB4 passing the Coulter counting electrodes at the entrance to the device. The biphasic signal helps to resolve particles from the noise. D) Histogram of bead counts obtained from a mixed sample containing MHB1, MHB2, and MHB4. Each bead population produces a distinct electrical signature. The black region at low impedance results from electrical noise and is excluded from bead counting analysis. E) Electrical impedance trace recorded as three beads pass the Coulter counter in sequence. The measured impedance signals are sufficient to identify each bead.
The electrical properties of the synthesized hydrogels were assessed using our microfluidic Coulter counter. MHB1 (Figure 4A and Figure S6A) was designed through its size (11 μm) and gel content to produce a minimal impedance signal that can still be readily resolved from the noise. MHB2 (Figure 4B and S6B) was designed to be compositionally identical to MHB1 by just large enough (13 μm) to produce an impedance signal that does not overlap. Due to the monodispersity of the particles a minimal difference in size is sufficient to yield distinct impedance signatures. MHB3 (Figure S6C) likewise was designed to be the same size as MHB1 but to contain sufficient gel content to produce a non-overlapping impedance signature. MHB2 and MHB3 are not electrically distinguishable from each other but demonstrate orthogonal methods used to control the impedance signals produced by hydrogel particles during Coulter counting. MHB4 (Figure 4C and S6D) was designed to produce the largest impedance signature by increasing both bead size and gel content. Figure 4D shows the histogram of electrical impedance signals obtained from a mixed sample of MHB1, MHB2, and MHB4. The three distinct bead populations are clearly visible. Figure 4E shows an example of the voltage reading of the impedance sensor as 3 beads pass the counter in sequence. During analysis, each recorded impedance spike is assigned to its corresponding bead population. These results demonstrate the successful synthesis of narrowly spaced particles for electrical multiplexing by Coulter counting.
3.4. Comparison of MHBs and commercial magnetic beads for electrical multiplexing.
Existing commercially available magnetic particles can provide distinct electrical signatures, but they cannot be used for multiplexed detection due to their behavior during capture. A uniform capture response across the set of electrically distinct particles is crucial to this method of multiplexed detection. Both a low degree of nonspecific capture and a high capture efficiency upon binding to the target are needed for sensitive multiplexing. Figure 5A, shows a comparison of the nonspecific capture of various beads under a single flow condition (20 μL min−1). Notably, the solid magnetic particles show high nonspecific capture across all populations, likely due to their increased density. To reduce this rate of non-specific capture a higher flow rate could be used (Figure S7). However, increased flow rates also negatively impact the efficiency of specific capture. As an example from our previous work, the percent capture of CD8+ T cells (~8 μm diameter) dropped from 90% to 40%, when the flow rate increased from 20 to 25 uL min-1.25 A similar inverse relationship between the rate of capture and the flow velocity has been observed independently in different device geometries.40,41 Additionally, higher flow rates negatively impact Coulter detection. As the flow rate increases the sampling depth of the impedance measurement is reduced, the signal to noise ratio decreases, and the baseline noise rises.26 To balance nonspecific capture, capture efficiency, and electrical detection we use a flow rate of 20 μL min−1 which has been shown as effective for sensitive capture of cells and solid (~7 μm) latex beads.24–26 Accordingly, it is critical for a set of multiplexed beads to display a suitable capture response at this flow rate. The new MHB designs address the limitations of existing solid magnetic beads by exhibiting a low nonspecific capture across all populations, likely due to the closely matched the density of hydrogels to the suspending buffer.
Figure 5.

A) Comparison of nonspecific capture between three electrically distinct solid magnetic beads and MHBs at the same flow rate. Each type of bead was captured by separate chambers. B) Fluorescent intensity of MHBs and solid magnetic beads after biotin conjugation. The MHBs show greater functional group density.
Another critical limitation of existing commercial particles is the variability in their capture response. In order to achieve 3 electrically distinct populations on our Coulter counter, we selected magnetic beads with average diameters of 7 um, 9 um, and 12 μm. Unfortunately, these solid magnetic beads are somewhat heterogeneous in size (Figure S8). As a result, a much larger range of diameters (6–14 μm) was needed to achieve the same level of electrical multiplexing as the set of MHBs (11–13 μm). Accordingly, the set of solid magnetic beads displayed considerable variability in the capture response at a shared flow rate. This result can be seen in Figure 5A. The rate of nonspecific capture for each bead population was tested under the same flow conditions. The non-specific capture varies significantly across the electrically distinct solid bead populations while the MHBs show a consistent response. Particles of different sizes experience different flow profiles inside the capture chamber which impacts their capture response (Figure S9). Accordingly, these solid magnetic beads respond differently to the same flow conditions, making them unsuitable for multiplexing.
Lastly, surface functionalization of commercially available magnetic particles has limitations. The polyacrylamide synthesis method used to make the MHBs is highly modular. We can readily increase, decrease, or change the functional groups on the beads by adjusting the concentration or type of monomers during polymerization. In contrast, the surface chemistry of commercial magnetic beads cannot be easily adjusted. Figure 5B shows a comparison of the functional group density of the different beads. When conjugated to biotin under the same conditions, the hydrogel beads displayed substantially higher levels of surface functionalization. Because the hydrogels were designed to have a higher functional group density than the commercial beads, they allow for a greater degree of conjugation to biomolecules (Figure 5B and S10). This increased functional group density enables a more sensitive response during biomolecular binding assays. From these results it is clear that these newly synthesized hydrogels address the current limitations in electrical detection and multiplexing.
3.5. Sensitivity of Bead Capture to Surface Biotin.
During the proposed multiplexed biomolecular sandwich assay, each bead type is linked to biotin-probes in proportion to the concentration of its target analyte. Since the capture chamber is functionalized with streptavidin, each of the individual assays can be detected using a shared capture mechanism. This same configuration can also use secondary antibodies to mediate capture; however, due to the higher affinity and specificity of the biotin-streptavidin interaction,42,43 it was selected for robust and sensitive bead capture. It is critical that each bead type displays a sensitive capture response to the biotin on its surface. In order to assess the relationship between the surface biotin and the bead capture, we conjugated each bead type to biotin (20 μg mL−1) and labeled them with an excess of fluorescent streptavidin. The fluorescence of the functionalized beads was then measured by confocal imaging. The confocal images shown in Figure 6A and S11 indicate that the fluorescent signal is localized in a thin fluorescent shell at the surface of each bead. The average thickness of the fluorescent region varies slightly between bead types: 1.8 μm for MHB1, 1.5 μm for MHB2, and 0.9 μm for MHB4. Importantly, any biotin that is conjugated inside the hydrogel cannot contribute to the capture, which occurs at the surface. but does not impact the capture response which depends only on the surface biotin. Accordingly, total fluorescence measurements provide a suitable estimate of the degree of surface functionalization produced during conjugation. We repeated the conjugation protocol using different concentrations of biotin before labeling the beads with fluorescent streptavidin. The flow cytometry measurements shown in Figure 6B, provide the average total fluorescent signal of each bead population and conjugation condition. The fluorescent intensity varied with the concentration of biotin during conjugation, confirming this method can produce populations with various degrees of surface biotinylation. The decreasing trend in total fluorescence across bead types results from the differences in diffusion into each bead type during conjugation. These bead populations were measured by differential bead counting device determining the percent capture for each bead type and level of surface biotin. The results of these experiments are shown in Figure 6C. When no biotin is conjugated, the capture % for each bead type was minimal (<10%). As the accessible biotin on the beads increased, the capture percentage also increased then saturates close to 100% capture demonstrating the sensitivity of capture to the surface biomolecules. We are able to access the full range of bead capture at this flow rate by varying the degree of conjugation. Figure S12 and supplemental video 1, provide examples of bead capture; biotinylated beads can be seen sticking to a streptavidin-coated pillar as they flow through the device. Importantly, these capture experiments were performed at a single optimized flow rate (20 μL min−1), confirming that the different bead types are suitable for simultaneous, biotin-sensitive capture.
Figure 6.

A) Inset: 3-D reconstruction of a fluorescently labeled MHB. Orthographic projection of the same bead reveals the distribution of fluorescence on the surface of the bead. B) Fluorescent intensity each population of beads following conjugation at different biotin concentrations, measured by flow cytometry. C) Percent capture for MHB1, 2 and 4 at different levels of accessible biotin. D-E) Bead counting histograms obtained from a mixed sample containing MHB1, MHB2, and MHB4, one population is conjugated to biotin: D) MHB1 or E) MHB2. The overlaid exit counts show a significant drop for the biotin conjugated bead as it is captured.
Next, the selectivity of bead capture was tested by simultaneously flowing a mix of all three bead types. In each experiment one of the populations was conjugated to biotin while the others were left unconjugated. Figure 6D and E shows the entrance and exit histograms obtained in this way. As expected, only the MHB population that was conjugated to biotin shows a significant drop in the exit count as all 3 populations are processed simultaneously. The unconjugated beads are not captured and as a result show similar entrance and exit counts. From these experiments, we show that the electrically distinct bead populations can be captured sensitively and selectively in response to the surface biotin.
3.6. Application for DNA and Protein Monitoring.
Finally, we tested and validated the new MHBs for multiplexed monitoring of biomolecules. This platform has been previously shown to sensitively detect and quantify a single protein target in a physiologically relevant range using the capture response of a single population of latex beads.24 To confirm the multiplexing capabilities of the MHBs for protein detection we determined the impact of conjugation and analyte binding on the capture response of each bead (Figure 7). MHB1 was used as a negative control and was left unconjugated to measure the background rate of nonspecific capture. MHB2 and MHB4 were separately conjugated to primary antibodies against two of the most well-studied biomarkers for sepsis, IL-6 and PCT respectively.44–47 The three bead populations were mixed with a sample containing IL-6 and biotin-tagged secondary antibodies against IL-6 and PCT. MHB2 is a positive for its analyte and forms a sandwiched complex that affixes biotin capture groups to the bead surface. MHB4 acts as a no target control. By comparing MHB1 and MHB4 we confirm that the conjugation of primary antibodies to the beads does not result in an increase in capture. Compared to MHB1 and MHB4, only MHB2 which is positive for its target analyte shows a significant increase in capture. This configuration confirms that each bead type responds independently to its target analyte which is fundamental to a multiplexed measurement. The rate of non-specific capture was found to increase slightly during these multiplexed measurements. As the total number of beads processed by the capture chamber increases, the probability of collisions between flowing beads and those that have already been captured also rises, which can result in further bead capture. This effect can be minimized by increasing the total size of the capture chamber and the inter-pillar spacing.
Figure 7.

A) Multiplexed protein measurement showing specific capture of IL-6. B) Multiplexed DNA measurement showing specific capture of TP53 fragments. In both cases MHB1, MHB2, and MHB4 are flowed simultaneously through the same chamber.
In order to demonstrate the versatility of the bead counting platform we also validated the MHBs for a multiplexed a DNA detection assay as shown in Figure 7B. Using the same principles from the protein detection experiment, MHB1 was unconjugated and acts as the negative control, while MHB2 and MHB4 were separately conjugated to short (~20 bp) DNA binding oligos complementary to unique gene fragments. The chosen sequence fragments correspond to TP53 and PIK3CA circulating tumor DNA which has been observed in elevated levels in the blood of patients with colorectal cancer.48 After functionalization, the 3 bead populations were mixed with a sample containing TP53 fragments and biotin-tagged DNA probes against all targets. Sequence annealing results in the linkage of beads to biotin in the presence of the correct DNA fragment. As expected, the level of nonspecific capture of the two controls, MHB1 and MHB4, was similar, confirming that the conjugation of DNA targeting sequences does not result in an increased nonspecific capture response. The positive control, MHB2 was the only bead type to show significantly elevated capture in response to the presence of its target analyte. These experiments confirm the unique, analyte dependence of the capture response for each bead type. The newly designed MHBs enable a simple, multiplexed electrical method of monitoring multiple types of biomolecules by bead counting and capture.
Conclusions
Leveraging droplet microfluidics, we have designed, synthesized, and characterized multiple electrically distinct populations of magnetic, polyacrylamide hydrogel beads. These beads enable a new method of multiplexed biomolecule measurement using only electrical detection by Coulter counting. We confirmed the sensitive and selective capture of each bead population under simultaneous flow in a microfluidic device. These newly synthesized beads overcome the challenges associated with multiplexing the bead counting device and provide a critical foundation for the development of rapid multiplexed electrical quantification of proteins and biomolecules. Importantly, we detect multiple types of biomolecules using a single versatile platform. Moreover, the magnetic properties of these beads present a new opportunity for orthogonal measurements of cells and biomolecules or for enhanced multiplexing using an additional set of non-magnetic electrically distinct hydrogels. Using these new beads, it is now possible to develop a single integrated electrical point-of-care device capable of a combined measurement of cell count, the levels of a cell surface antigen, and multiple protein concentrations for improved rapid diagnostics.
Supplementary Material
Acknowledgements
The authors thank C. García, M. Akhand, V. Font-Bartumeus, G. Oshana, J. Heredia, M. Saadah, V. Kindratenko, and A. Bobat for their help on devices fabrication. This work was carried out in part in the Materials Research Laboratory Central Research Facilities, University of Illinois. Confocal imaging was performed using the Core Facilities at the Carl R. Woese Institute for Genomic Biology. We also thank the SCS NMR Lab for its technical support. The Varian Inova 400-MHz NMR spectrometer was obtained with the financial support of the Roy J. Carver Charitable Trust. The authors acknowledge the support of Center for Integration of Medicine and Innovative Technology Innovation’s Point-of-Care Technology Center in Primary Care Grant, the support of NIH (project number: 1-R21-AI146865-A), and funding from University of Illinois at Urbana-Champaign.
Footnotes
Electronic Supplementary Information (ESI) available: [Supporting information (pdf), Video of Bead Capture (mov)]. See DOI: 10.1039/x0xx00000x
Conflicts of interest
R.B. has financial interests in Prenosis, Inc. a company that is focusing on stratification and identification of conditions in critical care. The other authors declare no other competing financial interests.
References
- 1.Shen WJ, Zhuo Y, Chai YQ, Yang ZH, Han J and Yuan R, ACS Appl. Mater. Interfaces, 2015, 7, 4127–4134. [DOI] [PubMed] [Google Scholar]
- 2.Jayanthi VSPKSA, Das AB and Saxena U, Biosens. Bioelectron, 2017, 91, 15–23. [DOI] [PubMed] [Google Scholar]
- 3.Kruger D, Yako YY, Devar J, Lahoud N and Smith M, PLoS One, 2019, 14, e0221169. [DOI] [PMC free article] [PubMed] [Google Scholar]
- 4.Park JJ, Harari O, Dron L, Mills EJ and Thorlund K, Contemp. Clin. Trials Commun, DOI: 10.1016/j.conctc.2019.100396. [DOI] [PMC free article] [PubMed] [Google Scholar]
- 5.Seymour CW, Liu VX, Iwashyna TJ, Brunkhorst FM, Rea TD, Scherag A, Rubenfeld G, Kahn JM, Shankar-Hari M, Singer M, Deutschman CS, Escobar GJ and Angus DC, JAMA - J. Am. Med. Assoc, 2016, 315, 762–774. [DOI] [PMC free article] [PubMed] [Google Scholar]
- 6.Su D, Zhang D, Jin J, Ying L, Han M, Chen K, Li B, Wu J, Xie Z, Zhang F, Lin Y, Cheng G, Li JY, Huang M, Wang J, Wang K, Zhang J, Li F, Xiong L, Futreal A and Mao W, Nat. Commun, 2019, 10, 5076. [DOI] [PMC free article] [PubMed] [Google Scholar]
- 7.Zhao K, Tang M, Wang H, Zhou Z, Wu Y and Liu S, Biosens. Bioelectron, 2019, 126, 767–772. [DOI] [PubMed] [Google Scholar]
- 8.Peng H, Huang Z, Wu W, Liu M, Huang K, Yang Y, Deng H, Xia X and Chen W, ACS Appl. Mater. Interfaces, 2019, 11, 24812–24819. [DOI] [PubMed] [Google Scholar]
- 9.Dolin HH, Papadimos TJ, Stepkowski S, Chen X and Pan ZK, SHOCK, 2018, 49, 364–370. [DOI] [PMC free article] [PubMed] [Google Scholar]
- 10.Gibot S, Béné MC, Noel R, Massin F, Guy J, Cravoisy A, Barraud D, Bittencourt MDC, Quenot JP, Bollaert PE, Faure G and Charles PE, Am. J. Respir. Crit. Care Med, 2012, 186, 65–71. [DOI] [PubMed] [Google Scholar]
- 11.Oved K, Cohen A, Boico O, Navon R, Friedman T, Etshtein L, Kriger O, Bamberger E, Fonar Y, Yacobov R, Wolchinsky R, Denkberg G, Dotan Y, Hochberg A, Reiter Y, Grupper M, Srugo I, Feigin P, Gorfine M, Chistyakov I, Dagan R, Klein A, Potasman I and Eden E, PLoS One, DOI: 10.1371/journal.pone.0120012. [DOI] [PMC free article] [PubMed] [Google Scholar]
- 12.Sun L, Tu H, Chen T, Yuan Q, Liu J, Dong N and Yuan Y, Sci. Rep, DOI: 10.1038/s41598-017-12022-1. [DOI] [PMC free article] [PubMed] [Google Scholar]
- 13.Tang L and Casas J, Biosens. Bioelectron, 2014, 61, 70–75. [DOI] [PMC free article] [PubMed] [Google Scholar]
- 14.Wong HR, Weiss SL, Giuliano JS, Wainwright MS, Cvijanovich NZ, Thomas NJ, Allen GL, Anas N, Bigham MT, Hall M, Freishtat RJ, Sen A, Meyer K, Checchia PA, Shanley TP, Nowak J, Quasney M, Chopra A, Fitzgerald JC, Gedeit R, Banschbach S, Beckman E, Harmon K, Lahni P and Lindsell CJ, PLoS One, 2014, 9, e92121. [DOI] [PMC free article] [PubMed] [Google Scholar]
- 15.Anderson JP, Rascoe LN, Levert K, Chastain HM, Reed MS, Rivera HN, McAuliffe I, Zhan B, Wiegand RE, Hotez PJ, Wilkins PP, Pohl J and Handali S, PLoS Negl. Trop. Dis, DOI: 10.1371/journal.pntd.0004168. [DOI] [PMC free article] [PubMed] [Google Scholar]
- 16.Appleyard DC, Chapin SC and Doyle PS, Anal. Chem, 2011, 83, 193–199. [DOI] [PMC free article] [PubMed] [Google Scholar]
- 17.Cohen L and Walt DR, Chem. Rev, 2019, 119, 293–321. [DOI] [PubMed] [Google Scholar]
- 18.Leng SX, McElhaney JE, Walston JD, Xie D, Fedarko NS and Kuchel GA, Journals Gerontol. Ser. A Biol. Sci. Med. Sci, 2008, 63, 879–884. [DOI] [PMC free article] [PubMed] [Google Scholar]
- 19.Reslova N, Michna V, Kasny M, Mikel P and Kralik P, Front. Microbiol, 2017, 8, 55. [DOI] [PMC free article] [PubMed] [Google Scholar]
- 20.Munge BS, Stracensky T, Gamez K, DiBiase D and Rusling JF, Electroanalysis, 2016, 28, 2644–2658. [DOI] [PMC free article] [PubMed] [Google Scholar]
- 21.Liu F, Ni L and Zhe J, Biomicrofluidics, DOI: 10.1063/1.5022168. [DOI] [Google Scholar]
- 22.Ludwig KR and Hummon AB, Mol. Biosyst, 2017, 13, 648–664. [DOI] [PMC free article] [PubMed] [Google Scholar]
- 23.Rodriguez-Trujillo R, Ajine MA, Orzan A, Mar MD, Larsen F, Clausen CH and Svendsen WE, Sensors Actuators, B Chem, 2014, 190, 922–927. [Google Scholar]
- 24.Valera E, Berger J, Hassan U, Ghonge T, Liu J, Rappleye M, Winter J, Abboud D, Haidry Z, Healey R, Hung NT, Leung N, Mansury N, Hasnain A, Lannon C, Price Z, White K and Bashir R, Lab Chip, 2018, 18, 1461–1470. [DOI] [PubMed] [Google Scholar]
- 25.Watkins NN, Hassan U, Damhorst G, Ni HK, Vaid A, Rodriguez W and Bashir R, Sci. Transl. Med, DOI: 10.1126/scitranslmed.3006870. [DOI] [PubMed] [Google Scholar]
- 26.Hassan U, Ghonge T, Reddy B, Patel M, Rappleye M, Taneja I, Tanna A, Healey R, Manusry N, Price Z, Jensen T, Berger J, Hasnain A, Flaugher E, Liu S, Davis B, Kumar J, White K and Bashir R, Nat. Commun, DOI: 10.1038/ncomms15949. [DOI] [PMC free article] [PubMed] [Google Scholar]
- 27.Murali S, Xia X, Jagtiani AV, Carletta J and Zhe J, Smart Mater. Struct, DOI: 10.1088/0964-1726/18/3/037001. [DOI] [Google Scholar]
- 28.Pellegrini M, Cherukupalli A, Medini M, Falkowski R and Olabisi R, Tissue Eng. - Part C Methods, 2015, 21, 1246–1250. [DOI] [PMC free article] [PubMed] [Google Scholar]
- 29.Amato DV, Lee H, Werner JG, Weitz DA and Patton DL, ACS Appl. Mater. Interfaces, 2017, 9, 3288–3293. [DOI] [PubMed] [Google Scholar]
- 30.Femmer T, Jans A, Eswein R, Anwar N, Moeller M, Wessling M and Kuehne AJC, ACS Appl. Mater. Interfaces, 2015, 7, 12635–12638. [DOI] [PubMed] [Google Scholar]
- 31.Islam MM, Loewen A and Allen PB, Sci. Rep, 2018, 8, 8763. [DOI] [PMC free article] [PubMed] [Google Scholar]
- 32.Kim JW, Utada AS, Fernández-Nieves A, Hu Z and Weitz DA, Angew. Chemie - Int. Ed, 2007, 46, 1819–1822. [DOI] [PubMed] [Google Scholar]
- 33.Teh SY, Lin R, Hung LH and Lee AP, Lab Chip, 2008, 8, 198–220. [DOI] [PubMed] [Google Scholar]
- 34.Sehgal D and Vijay IK, Anal. Biochem, 1994, 218, 87–91. [DOI] [PubMed] [Google Scholar]
- 35.Valera E, Muriano A, Pividori I, Sánchez-Baeza F and Marco MP, Biosens. Bioelectron, 2013, 43, 211–217. [DOI] [PubMed] [Google Scholar]
- 36.Holmes DL and Stellwagen NC, Electrophoresis, 1991, 12, 612–619. [DOI] [PubMed] [Google Scholar]
- 37.Yang B, Lu Y and Luo G, in Industrial and Engineering Chemistry Research, 2012, vol. 51, pp. 9016–9022. [Google Scholar]
- 38.Okay O, 2009, pp. 1–14.
- 39.Morgan H, Holmes D and Green NG, Curr. Appl. Phys, 2006, 6, 367–370. [Google Scholar]
- 40.Cheng X, Irimia D, Dixon M, Sekine K, Demirci U, Zamir L, Tompkins RG, Rodriguez W and Toner M, Lab Chip, 2007, 7, 170–178. [DOI] [PMC free article] [PubMed] [Google Scholar]
- 41.Cheng X, Gupta A, Chen C, Tompkins RG, Rodriguez W and Toner M, Lab Chip, 2009, 9, 1357–1364. [DOI] [PMC free article] [PubMed] [Google Scholar]
- 42.Chivers CE, Koner AL, Lowe ED and Howarth M, Biochem. J, 2011, 435, 55–63. [DOI] [PMC free article] [PubMed] [Google Scholar]
- 43.Laitinen OH, Hytönen VP, Nordlund HR and Kulomaa MS, Cell. Mol. Life Sci, 2006, 63, 2992–3017. [DOI] [PMC free article] [PubMed] [Google Scholar]
- 44.Kumar S, Tripathy S, Jyoti A and Singh SG, Biosens. Bioelectron, 2019, 124–125, 205–215. [DOI] [PubMed] [Google Scholar]
- 45.Reddy B, Hassan U, Seymour C, Angus DC, Isbell TS, White K, Weir W, Yeh L, Vincent A and Bashir R, Nat. Biomed. Eng, 2018, 2, 640–648. [DOI] [PubMed] [Google Scholar]
- 46.Russell C, Ward AC, Vezza V, Hoskisson P, Alcorn D, Steenson DP and Corrigan DK, Biosens. Bioelectron, 2019, 126, 806–814. [DOI] [PubMed] [Google Scholar]
- 47.Seshadri P, Manoli K, Schneiderhan-Marra N, Anthes U, Wierzchowiec P, Bonrad K, Di Franco C and Torsi L, Biosens. Bioelectron, 2018, 104, 113–119. [DOI] [PubMed] [Google Scholar]
- 48.Diehl F, Schmidt K, Choti MA, Romans K, Goodman S, Li M, Thornton K, Agrawal N, Sokoll L, Szabo SA, Kinzler KW, Vogelstein B and Diaz LA, Nat. Med, 2008, 14, 985–990. [DOI] [PMC free article] [PubMed] [Google Scholar]
Associated Data
This section collects any data citations, data availability statements, or supplementary materials included in this article.