

Abstract
Thyroid cancer (TC) is the most common endocrine cancer, accounting for 1.7% of all cancer cases. It has been reported that the existing approach to diagnosing TC is problematic. Therefore, it is essential to develop molecular biomarkers to improve the accuracy of the diagnosis. This study aimed to screen hub lncRNAs in the ceRNA network (ceRNET) connected to TC formation and progression based on the overall survival rate. In this study, first, RNA-seq data from the GDC database were collected. A package called edgeR in R programming language was then used to obtain differentially expressed lncRNAs (DElncRNAs), miRNAs (DEmiRNAs), and mRNAs (DEmRNAs) in TC patients' samples compared to normal samples. Second, DEmRNAs were analyzed for their functional enrichment. Third, to identify RNAs associated with overall survival, the overall survival of these RNAs was analyzed using the Kaplan-Meier plotter database to create a survival associated with the ceRNA network (survival-related ceRNET). Next, the GeneMANIA plugin was used to construct a PPI network to better understand survival-related DEmRNA interactions. The survival ceRNET was then visualized with the Cytoscape software, and hub genes, including hub lncRNAs and hub mRNAs, were identified using the CytoHubba plugin. We found 45 DElncRNAs, 28 DEmiRNAs, and 723 DEmRNAs among thyroid tumor tissue and non-tumor tissue samples. According to KEGG, GO and DO analyses, 723 DEmRNAs were mainly enriched in cancer-related pathways. Importantly, the results found that ten DElncRNAs, four DEmiRNAs, and 68 DEmRNAs are associated with overall survival. In this account, the PPI network was constructed for 68 survival-related DEmRNAs, and ADAMTS9, DTX4, and CLDN10 were identified as hub genes. The ceRNET was created by combining six lncRNAs, 109 miRNAs, and 22 mRNAs related to survival using Cytoscape. in this network, ten hub RNAs were identified by the CytoHubba plugin, including mRNAs (CTXND1, XKRX, IGFBP2, ENTPD1, GALNT7, ADAMTS9) and lncRNAs (AC090673.1, AL162511.1, LINC02454, AL365259.1). This study suggests that three lncRNAs, including AL162511.1, AC090673.1, and AL365259.1, could be reliable diagnostic biomarkers for TC. The findings of this study provide a basis for future studies on the therapeutic potential of these lncRNAs.
Graphical abstract
Supplementary Information
The online version contains supplementary material available at 10.1007/s12079-022-00697-9.
Keywords: Bioinformatics analysis, ceRNA network (ceRNET), LncRNA, Hub genes, Thyroid cancer
Introduction
Thyroid cancer (TC) presents as an enlarging lump in the neck and is the most common endocrine malignancy with the highest incidence rate (See et al. 2017). Globally, it accounts for 1.7% of all new cancer cases (Tam et al. 2018). In many regions and demographic groups, the ratio of women to men is 3:1, making it more common for women (Kilfoy et al. 2009). Over the past three decades, TC morbidity has increased significantly (Seib and Sosa 2019). It is estimated that 10% of TC are malignant (Brito et al. 2013), and in 2020, 7% of all TC patients died (Sung et al. 2021). There are several common treatments for TC, including radiation therapy, chemotherapy, and surgery, but none of them is incredibly effective (Nagaiah et al. 2011). TC is diagnosed with ultrasound, but this method relies on the quality of sonography and the skills of radiologists, so an accurate diagnosis has always been challenging (Park et al. 2010). Several studies have suggested that epigenetic changes may contribute significantly to TC development in addition to environmental and genetic factors (Feinberg et al. 2006). According to the Human Genome Project (US Doe Joint Genome Institute 2001), untranslated transcripts, also known as non-protein-coding sequences, account for 97 percent of the human genome. These transcripts are classified as short (19–31 nucleotides), mid (20–200 nucleotides), and long (> 200 nucleotides) sequences (Esteller 2011). Identifying the function of non-coding RNAs (ncRNAs) in the initiation and progression of cancer is a promising area in cancer genetics (Grillone et al. 2020). Hence, it is crucial to understand molecular mechanisms to identify new biomarkers for the early diagnosis of TC.
In 2011, Leonardo Salmena and colleagues suggested the competing endogenous RNA (ceRNA) hypothesis. According to this hypothesis, ceRNAs are partial transcription products that form a vast network of regulatory molecules throughout the transcriptome, including microRNAs (miRNAs), circular RNAs (circRNAs), long non-coding RNAs (lncRNAs), and pseudogenic RNAs. These transcripts compete for miRNAs and regulate each other at the post-transcriptional level. Disruption of this network can cause numerous diseases, including coronary artery disease, neurodegenerative disease, and different types of cancers. (Cai and Wan 2018; Bian et al. 2021; Salmena et al. 2011).
LncRNAs are an endogenous form of non-coding RNA with over 200 nucleotides that are structurally similar to mRNA but cannot encode proteins (Quinn and Chang 2016). LncRNA contains miRNA response element (MRE) sites, allowing them to function as ceRNAs, by binding to miRNAs and indirectly regulating the activity and expression of the target genes. In addition, increasing experimental evidence indicates that dysregulation of lncRNAs in the ceRNA network may be associated with the occurrence and development of many cancers (Jiang et al. 2019; Su et al. 2021). Numerous studies have proven that lncRNAs acting as ceRNAs can be used as potential biomarkers and is of critical significance for molecular diagnosis and targeted therapy in many cancer types, including lung cancer, pancreatic cancer, and colorectal cancer (Seo et al. 2020; Xu et al. 2022; Wang et al. 2019).
In recent studies, lncRNAs have been found to play critical roles in the occurrence and progression of TC and may act as oncogenes (Peng et al. 2020). For example, X Liu et al. showed that lncRNA HOTAIR could increase thyroid carcinoma cell survival, migration, and invasion by decreasing miR-17-5p levels (Liu et al. 2020). A study by Kai Guo et al. showed that lncRNA-MIAT suppresses EZH2 expression and promotes PTC cell invasion by sponging miR-150-5p (Guo et al. 2021). On the other hand, other studies suggest that lncRNAs may act as tumor suppressors. C Wang et al. revealed that long non-coding RNA MEG3, acts as a tumor suppressor by suppressing the invasion and migration of thyroid carcinomas by targeting the RAC1 gene (Wang et al. 2015). Among other things, Julia Ramrez-Moya et al. found that lncRNA SPTY2D1-AS1 is a potent tumor suppressor in vitro and in vivo and downregulates miR-221 processing (Ramírez-Moya et al. 2022).
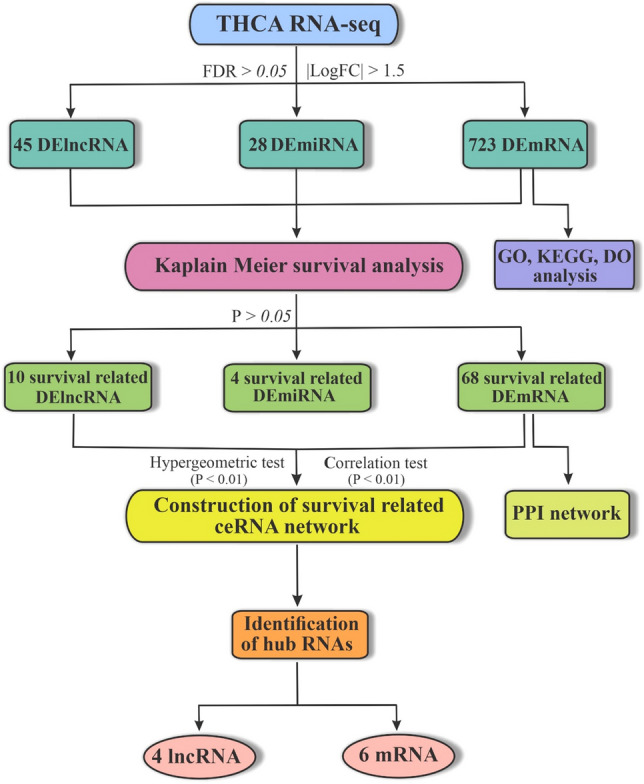
These findings suggest that further investigations should be conducted on lncRNAs as potential biomarkers and therapeutic targets for TC diagnosis. Recent advances in high-throughput RNA sequencing technologies have led to the discovery of many lncRNAs; however, their possible mechanism in TC is still unclear. This study utilized bioinformatics analysis to identify reliable and robust lncRNAs that may function as ceRNAs to sponge miRNAs and regulate mRNAs expression in TC. The flowchart of this study is depicted in Fig. 1.
Fig. 1.

Flowchart of this study
The Cancer Genome Atlas (TCGA) project began in 2005. It comprises 33 different types of cancer. This project will enhance our understanding of cancer by utilizing sequencing technologies and bioinformatics tools. Additionally, this databank provides a variety of datasets from different studies, allowing other researchers to analyze them further. The present study performed an integrated data analysis of the lncRNAs, miRNAs, and mRNAs profiles of TC, which were taken from the TCGA database (THCA-TCGA). Using the edgeR package, we identified differentially expressed lncRNAs (DElncRNAs), miRNAs (DEmiRNAs), and mRNAs (DEmRNAs). Survival analysis was conducted to identify lncRNAs, miRNAs, and mRNAs associated with the overall survival of TC patients. Afterward, the PPI network for survival-related DEmRNAs was established to improve understanding of interactions and identify hub genes. A ceRNA network (ceRNET) was also built to find hub lncRNAs and hub mRNAs related to survival. Overall, we hope this study could pave the way for a new line of prognosis, diagnosis, and treatment of TC.
Materials and methods
RNA sequencing data preprocessing
The level three THCA-RNAseq expression profile data of 510 thyroid carcinoma patients and 58 adjacent non-tumor tissue samples containing lncRNA and mRNA, also the level three THCA-miRNAseq expression profile data of 514 thyroid carcinoma patients, and 59 adjacent non-tumor tissue samples were obtained from the GDC ( https://portal.gdc.cancer.gov ) on January 10, 2022. In addition, from the GDC portal associated with the TCGA project, we also retrieved corresponding clinical data on thyroid cancer (TCGA-THCA). After removing duplicate samples and those with incomplete clinical stage and vital status data in both RNAseq and miRNAseq, the number of RNA samples in the tumor tissue and adjacent non-tumor tissue samples decreased to 500 and 58, respectively. Also, the number of miRNA samples in the tumor tissue and adjacent non-tumor tissue samples decreased by 504 and 59, respectively.
Differential expression analysis of THCA data
The first step in this process was the standardization by data normalization. The data were normalized using TMM (Robinson and Oshlack 2010) and Voom (Law et al. 2014) methods by the GDCRNAtools package in the R programming language (Li et al. 2018). In addition, differentially expressed lncRNAs (DElncRNAs), miRNAs (DEmiRNAs), and mRNAs (DEmRNAs) were analyzed between tumor and adjacent non-tumor tissue samples using the edgeR package (Robinson et al. 2010). DElncRNAs, DEmiRNAs, and DEmRNAs were chosen based on |log2FoldChange| > 1.5 and FDR < 0.05 criteria.
Survival analysis of differentially expressed RNAs
The Kaplan-Meier method (Goel et al. 2010), provided by the R survival tool package, was used to compare overall survival (OS) between the two groups based on the high and low expression of input genes derived from the median value of gene expression (Gray 2002). Furthermore, the hazard ratio (HR) at 95% confidence interval, log-rank test, and their statistical differences were analyzed by using Kaplan–Meier procedure in our study. Statistics were considered significant if the p-value was lower than 0.05.
Functional enrichment analysis
Using the clusterProfiler package in R, functional enrichment analysis was conducted in Gene Ontology (GO, http://geneontology.org/ ) (Expansion of the Gene 2017), Kyoto Encyclopedia of Genes and Genomes (KEGG, https://www.genome.jp/kegg/ ) (Kanehisa et al. 2017), and Disease Ontology (DO, https://disease-ontology.org/ ) (Schriml et al. 2019). As a result of the hypergeometric distribution test by clusterProfiler package (Yu et al. 2012), enriched DEmRNAs were identified through three methods: groupGo, enrichGO, and enrichKEGG. The criteria used to determine statistically significant entries were FDR < 0.01 and fold enrichment > 1.5.
Construction of PPI network
GeneMANIA ( https://genemania.org/ ), a Cytoscape plugin, was used to build the PPI (Protein-Protein Interaction) network related to survival-related DEmRNAs (Warde-Farley et al. 2010). To better understand interactions between survival-related DEmRNAs, we used GeneMANIA, a platform for predicting protein-protein, protein-DNA, and genetic interactions, pathways analysis, gene and protein expression inspection, protein domains, and phenotypic screening profiles.
Formation of survival-related ceRNET
MiRcode ( http://www.mircode.org/ ) is a database that enables the identification of putative microRNA recognition elements (MRE) in lncRNAs of interest or predicted targets of microRNAs (Jeggari et al. 2012). The MiRcode database was used to predict lncRNA-miRNA interactions. On the other hand, the miRTarBase database ( https://mirtarbase.cuhk.edu.cn/ ) was used to predict miRNA-mRNA interactions. MiRTarBase database currently contains more than 360,000 MREs compiled manually by systematically surveying pertinent literature after using Natural Language Processing (NLP) of the text to filter out research articles related to the miRNA function. The collected MREs are generally validated with a variety of experiments, including reporter assay, western blot, microarray, and NGS experiments (Huang et al. 2020).
Based on the ceRNA hypothesis (Salmena et al. 2011), miRNAs can regulate RNAs containing specific miRNA response elements (MREs). The lncRNAs and mRNAs share a significant number of common miRNAs together and act as ceRNAs. To construct the ceRNET, we used the GDCRNATools package, which uses three different statistical tests: First: Hypergeometric test that identifies miRNAs common to both lncRNA and mRNA. Second: Pearson correlation analysis is required for determining the relationship between the expression of lncRNAs and mRNAs. Third: Regulation pattern analysis uses two methods to measure the regulatory role of miRNAs on lncRNAs and mRNAs (Paci et al. 2014). Cytoscape, a powerful software for analyzing and visualizing data networks, was utilized to construct the lncRNA-miRNA-mRNA network associated with survival analysis (survival-related ceRNET) (Shannon et al. 2003).
Identification of hub RNAs in ceRNET
CytoHubba, a Cytoscape plugin, provides a simple user interface for network analysis with eleven scoring methods to assess the importance of nodes in a biological network (Chin et al. 2014). To increase the sensitivity and specificity, the MCC (Maximal Clique Centrality) method was used to detect specific nodes. MCC captures more essential RNAs in the top-ranked list of both high-degree and low-degree RNAs.
Results
Identification of survival-related RNAs
The edgeR package in R version 4.2.0 was used to identify differentially expressed RNAs in the TC group (number of RNAseq samples = 510, number of miRNAseq samples = 514) compared to the normal control group (number of RNAseq samples = 58, number of miRNAseq samples = 59). Consequently, 43 DElncRNAs, 24 DEmiRNAs, and 567 DEmRNAs were found to be upregulated, whereas 2 DElncRNAs, 4 DEmiRNAs, and 156 DEmRNAs were downregulated (Fig. 2). The association between these differentially expressed RNAs and survival time was analyzed using a Univariate Kaplan-Meier survival analysis. Finally, 10 DElncRNAs, 4 DEmiRNAs, and 68 DEmRNAs with a survival p.value < 0.05 were found (Table 1, 2, 3).
Fig. 2.

Volcano plots of differentially expressed RNAs (DE RNAs). A DElncRNAs , B DEmiRNAs, C DEmRNAs. The black color defines genes with no significant expression differences between THCA and adjacent normal tissue, the green color indicates downregulated DE RNAs, and the red color represents upregulated DE RNAs
Table 1.
The characteristic of all survival-related DElncRNAs
| Differential expression analysis | Kaplan-Meier survival analysis | |||||
|---|---|---|---|---|---|---|
| Symbol | log2FC | FDR | HR | Lower 95 | Upper 95 | p value |
| AC005479.3 | 2.16 | 3.49E-31 | 0.2319 | 0.0856 | 0.6280 | 0.0053 |
| AC007255.1 | 4.91 | 1.15E-39 | 0.2962 | 0.1110 | 0.7905 | 0.0249 |
| AC079630.1 | 3.95 | 6.49E-43 | 0.2161 | 0.0811 | 0.5761 | 0.0085 |
| AC090673.1 | 2.84 | 8.97E-37 | 0.2216 | 0.0832 | 0.5905 | 0.0098 |
| AL162511.1 | 1.91 | 3.09E-23 | 0.2977 | 0.1116 | 0.7945 | 0.0253 |
| AL365259.1 | 1.95 | 1.13E-18 | 0.3295 | 0.1237 | 0.8778 | 0.0430 |
| DOCK9-AS2 | 1.90 | 9.49E-38 | 0.2907 | 0.1089 | 0.7763 | 0.0224 |
| KCNJ2-AS1 | 1.85 | 1.09E-30 | 0.3279 | 0.1231 | 0.8738 | 0.0420 |
| LINC02454 | 4.59 | 3.49E-55 | 0.2309 | 0.0866 | 0.6151 | 0.0124 |
| LINC02555 | 6.19 | 1.62E-37 | 0.3372 | 0.1266 | 0.8984 | 0.0480 |
lncRNA Long non coding RNAs, FDR False discovery rate, FC Fold change, HR Hazard ratio, DE Differential expressed
Table 2.
The characteristic of all survival-related DEmiRNAs
| Differential expression analysis | Kaplan-Meier survival analysis | |||||
|---|---|---|---|---|---|---|
| Symbol | log2FC | FDR | HR | Lower 95 | Upper 95 | p Value |
| hsa-miR-144-5p | − 2.19 | 1.04E-50 | 0.3097 | 0.1162 | 0.8257 | 0.0316 |
| hsa-miR-181b-2-3p | 1.96 | 7.40E-40 | 0.3227 | 0.1211 | 0.8600 | 0.0387 |
| hsa-miR-221-5p | 2.36 | 4.39E-21 | 0.2352 | 0.0869 | 0.6360 | 0.0057 |
| hsa-miR-375 | 2.87 | 2.17E-22 | 0.3609 | 0.1346 | 0.9679 | 0.0475 |
miRNAs micrornas, FDR False discovery rate, FC Fold change, HR Hazard ratio, DE Differential expressed
Table 3.
The characteristic of all survival-related DEmRNAs
| Differential expression analysis | Kaplan-Meier survival analysis | |||||
|---|---|---|---|---|---|---|
| Symbol | log2FC | FDR | HR | Lower 95 | Upper 95 | p value |
| ADAM33 | − 1.72 | 7.85E-30 | 4.5128 | 1.6934 | 12.0263 | 0.0097 |
| ADAMTS9 | 2.66 | 9.03E-38 | 0.2230 | 0.0837 | 0.5944 | 0.0102 |
| ADRA1B | 2.24 | 8.26E-40 | 0.2190 | 0.0822 | 0.5838 | 0.0091 |
| AGPAT4 | − 1.69 | 2.53E-49 | 7.2233 | 2.7107 | 19.2483 | 0.0021 |
| ALPL | 1.72 | 1.40E-17 | 3.2487 | 1.2183 | 8.6625 | 0.0306 |
| ANK2 | − 2.21 | 2.99E-40 | 4.6355 | 1.7388 | 12.3579 | 0.0083 |
| APOC1 | 1.65 | 5.35E-09 | 0.3130 | 0.1174 | 0.8345 | 0.0333 |
| B3GNT7 | 2.57 | 1.64E-46 | 0.2623 | 0.0977 | 0.7037 | 0.0122 |
| CDHR3 | − 2.12 | 7.09E-94 | 3.4540 | 1.2932 | 9.2252 | 0.0217 |
| CLDN1 | 3.15 | 8.23E-39 | 0.2916 | 0.1092 | 0.7785 | 0.0227 |
| CLDN10 | 6.30 | 5.53E-30 | 0.2856 | 0.1069 | 0.7632 | 0.0202 |
| CLDN16 | 5.12 | 1.38E-41 | 0.3060 | 0.1147 | 0.8160 | 0.0297 |
| CLDN2 | 3.66 | 1.61E-24 | 0.1278 | 0.0479 | 0.3411 | 0.0012 |
| CTXND1 | 3.78 | 4.80E-29 | 0.2304 | 0.0865 | 0.6138 | 0.0123 |
| DTX4 | 3.13 | 2.28E-42 | 0.1967 | 0.0736 | 0.5256 | 0.0046 |
| E2F1 | 1.98 | 2.11E-37 | 0.3024 | 0.1134 | 0.8066 | 0.0276 |
| ENTPD1 | 2.49 | 1.33E-64 | 0.3229 | 0.1212 | 0.8604 | 0.0390 |
| FAM111B | 2.23 | 1.99E-23 | 0.2022 | 0.0757 | 0.5400 | 0.0055 |
| FAM124A | − 1.60 | 3.23E-25 | 2.7845 | 1.0380 | 7.4697 | 0.0462 |
| FAM43A | 2.18 | 1.08E-36 | 0.3606 | 0.1344 | 0.9671 | 0.0474 |
| FIBCD1 | 4.48 | 4.15E-26 | 0.2944 | 0.1103 | 0.7859 | 0.0241 |
| FNDC4 | 2.53 | 3.48E-31 | 0.2860 | 0.1070 | 0.7641 | 0.0205 |
| FRMD3 | 2.60 | 3.42E-39 | 0.2084 | 0.0781 | 0.5559 | 0.0068 |
| GALNT7 | 2.25 | 1.04E-60 | 0.2856 | 0.1069 | 0.7632 | 0.0202 |
| GGCT | 2.19 | 4.80E-49 | 0.3566 | 0.1329 | 0.9570 | 0.0449 |
| GHR | − 1.76 | 2.10E-49 | 4.8898 | 1.8320 | 13.0517 | 0.0060 |
| GIPR | 1.73 | 6.20E-21 | 0.3285 | 0.1233 | 0.8752 | 0.0422 |
| GLDN | 4.40 | 2.04E-21 | 0.3160 | 0.1186 | 0.8424 | 0.0350 |
| GLT1D1 | 2.68 | 4.78E-48 | 0.2263 | 0.0849 | 0.6029 | 0.0111 |
| GLT8D2 | − 1.86 | 2.90E-31 | 3.5926 | 1.3430 | 9.6105 | 0.0175 |
| HLA-G | 2.24 | 1.66E-12 | 0.3076 | 0.1154 | 0.8203 | 0.0305 |
| IGFBP2 | 1.59 | 1.79E-21 | 2.9541 | 1.1087 | 7.8711 | 0.0489 |
| INHBB | 1.77 | 2.09E-21 | 0.1806 | 0.0673 | 0.4847 | 0.0025 |
| KLK7 | 6.12 | 5.90E-30 | 0.3501 | 0.1303 | 0.9407 | 0.0409 |
| LAYN | − 1.81 | 6.11E-56 | 3.1039 | 1.1648 | 8.2712 | 0.0385 |
| LCN6 | 3.88 | 1.33E-19 | 0.3168 | 0.1189 | 0.8443 | 0.0354 |
| LIPH | 5.62 | 4.18E-66 | 0.3064 | 0.1149 | 0.8170 | 0.0297 |
| LPAR5 | 3.39 | 1.15E-52 | 0.1825 | 0.0680 | 0.4896 | 0.0027 |
| LRG1 | 3.43 | 4.85E-34 | 0.2691 | 0.1004 | 0.7210 | 0.0144 |
| MAMLD1 | 2.83 | 9.50E-41 | 0.3630 | 0.1354 | 0.9732 | 0.0488 |
| MUM1L1 | − 2.17 | 2.25E-27 | 3.6987 | 1.3807 | 9.9080 | 0.0148 |
| NELL2 | 2.70 | 3.49E-20 | 0.2192 | 0.0822 | 0.5841 | 0.0092 |
| NOD1 | 2.55 | 5.31E-36 | 0.2968 | 0.1112 | 0.7921 | 0.0251 |
| NPC2 | 2.51 | 1.01E-61 | 0.2190 | 0.0822 | 0.5838 | 0.0091 |
| PAPSS2 | − 2.35 | 1.39E-69 | 3.2900 | 1.2335 | 8.7752 | 0.0287 |
| PDLIM3 | − 1.96 | 1.95E-39 | 7.8129 | 2.9280 | 20.8476 | 0.0013 |
| PLEKHG4B | − 1.91 | 4.14E-22 | 3.0296 | 1.1370 | 8.0722 | 0.0433 |
| POU2F3 | 1.69 | 5.28E-26 | 0.1971 | 0.0737 | 0.5267 | 0.0047 |
| PRR15 | 5.80 | 3.28E-52 | 0.2982 | 0.1118 | 0.7958 | 0.0258 |
| QPCT | 3.45 | 4.36E-50 | 0.3114 | 0.1168 | 0.8303 | 0.0320 |
| RDH5 | 2.90 | 3.40E-34 | 0.3639 | 0.1358 | 0.9756 | 0.0497 |
| RXRG | 5.16 | 2.81E-54 | 0.3125 | 0.1172 | 0.8329 | 0.0331 |
| S100A1 | 1.84 | 4.66E-27 | 0.1866 | 0.0696 | 0.4998 | 0.0031 |
| SCG5 | 2.32 | 4.72E-26 | 0.2868 | 0.1073 | 0.7662 | 0.0209 |
| SEMA6B | 1.60 | 1.09E-30 | 4.1969 | 1.5750 | 11.1838 | 0.0148 |
| TACSTD2 | 4.15 | 1.42E-29 | 0.3440 | 0.1279 | 0.9254 | 0.0368 |
| THBS4 | 1.66 | 7.55E-08 | 3.0126 | 1.1307 | 8.0268 | 0.0446 |
| THRSP | 3.45 | 1.03E-35 | 0.2489 | 0.0933 | 0.6636 | 0.0185 |
| TM4SF4 | 3.79 | 4.14E-21 | 0.2057 | 0.0771 | 0.5490 | 0.0062 |
| TMEM215 | 5.73 | 6.52E-32 | 0.3333 | 0.1251 | 0.8881 | 0.0455 |
| TNFRSF12A | 1.70 | 2.65E-18 | 0.3184 | 0.1176 | 0.8616 | 0.0237 |
| TPD52L1 | 1.84 | 5.02E-45 | 0.2843 | 0.1064 | 0.7599 | 0.0199 |
| TUSC3 | 3.14 | 1.51E-63 | 0.2681 | 0.1000 | 0.7184 | 0.0139 |
| TYRO3 | 2.01 | 3.76E-47 | 0.3067 | 0.1150 | 0.8178 | 0.0297 |
| WNT10A | 2.90 | 9.55E-16 | 0.2889 | 0.1082 | 0.7718 | 0.0216 |
| XKRX | 3.79 | 4.77E-38 | 0.2857 | 0.1069 | 0.7634 | 0.0202 |
| YPEL4 | 1.97 | 2.67E-22 | 0.2113 | 0.0792 | 0.5635 | 0.0073 |
| ZFPM2 | − 1.97 | 6.71E-49 | 16.1836 | 6.0697 | 43.1501 | 0.0002 |
mRNAs Messenger RNAs, FDR False discovery rate, FC Fold change, HR Hazard ratio, DE Differentially expressed
Functional enrichment analysis of DEmRNAs
The biological functions and signaling mechanisms of 723 DEmRNAs (567 upregulated DEmRNA + 156 downregulated DEmRNA) associated with TC were investigated using enrichment analysis that included disease ontology (DO), gene ontology (GO), and Kyoto Encyclopedia of Genes and Genomes (KEGG). According to the GO results for biological process (BC), these genes were mainly enriched in the extracellular matrix organization, extracellular structure organization, and cell-substrate adhesion. Furthermore, based on the cellular components (CC), these genes were mainly enriched in the collagen-containing extracellular matrix, endoplasmic reticulum lumen, and synaptic membrane. Likewise, for molecular components (MC) terms, these genes were mainly enriched in extracellular matrix structural constituents, growth factor binding, and glycosaminoglycan binding.
As a result of the KEGG pathway analysis, the top three identified pathways included protein digestion and absorption, cell adhesion molecules, and bladder cancer. Besides, according to the disease ontology (DO) findings, these genes were mainly enriched in endocrine gland cancers, thyroid cancers, and papillary thyroid cancers (Fig. 3).
Fig. 3.

GO and DO enrichment analysis and KEGG enrichment analysis. A–B Gene ontology (GO) findings for DEmRNAs using the ClusterProfiler tool in R. BP represents the biological process, MF represents the molecular function, and CC represents the cellular component of targets. C Analysis of disease ontology (DO) enrichment. D KEGG analysis for identifying enriched pathways of DEmRNAs
Construction of PPI network and detecting hub genes
The GeneMANIA plugin in Cytoscape software was used to explore the protein-protein interactions of the 68 survival-related DEmRNAs based on co-expression, physical interactions, shared protein domains, and co-localization. It was found that these intersecting genes had complicated interactions (Fig. 4). The hub genes in the PPI network with the highest degree were ADMTS9, DTX4, and CLDN10.
Fig. 4.

Protein-protein interaction (PPI) network of survival-related DEmRNAs with co-expression, physical interactions, shared protein domains and co-localization
Construction of survival-related ceRNET
Survival-related ceRNET were constructed using the GDCRNATools package. First, we selected lncRNAs and mRNAs associated with survival from our present study analysis. Next, we used the miRcode database to identify lncRNA-miRNA interactions, and the miRTarbase database to identify miRNA-mRNA interactions. Survival-related lncRNAs and mRNAs were chosen using a hypergeometric test (P < 0.01), Pearson correlation analysis (P < 0.01), and regulation pattern analysis to create a ceRNET. Finally, our survival-related ceRNET, with 136 nodes and 527 edges, included 22 mRNA, 109 miRNAs, and six lncRNAs (Fig. 5).
Fig. 5.

The ceRNA network of survival-related DElncRNAs and DEmRNAs is created of 6 lncRNAs, 21 mRNAs, and 109 miRNAs. The green nodes represent lncRNAs, the red nodes represent mRNAs, and the blue nodes represent miRNAs. The edges represent potential relationships between lncRNAs, miRNAs, and mRNAs
Identification of hub lncRNAs and mRNAs in the ceRNET
Our analysis detected hub genes in the ceRNET using the cytoHubba plugin in Cytoscape. Based on the Maximal Clique Centrality (MCC) ranking, The top hub mRNAs were CTXND1, XKRX, IGFBP2, ENTPD1, GALNT7, and ADAMTS9, whereas the top hub lncRNAs were AL162511.1, LINC02454, and AL365259.1. The maximal clique centrality (MCC) algorithm was found to be the most effective method of locating hub nodes in a co-expression network. In THCA tissue samples, all hub genes showed a higher level of expression than in normal tissue (Fig. 6).
Fig. 6.

MCC scores were used to identify the top ten hub RNAs in the ceRNA network using the CytoHubba plugin of the Cytoscape program. The picture depicts the significance of hubs using a color scale ranging from red to yellow, with red being the most essential and yellow being the least significant
Discussion
The most common method of diagnosing thyroid cancer (TC) is based on histological characteristics, but these methods are not always accurate. Also, it has been demonstrated that different diagnoses based on the therapeutic and professional backgrounds of physicians sometimes lead to a lack of consistency and reliability in diagnosis (Zargari and Mokhtari 2019; Zhang 2019). Because of this, to develop better diagnostic methods, there is a critical need to understand the molecular mechanism of TC expansion and recurrence. One of the best ways to identify these molecular mechanisms is through the understanding of ceRNETs and focusing on the role of ncRNAs in these networks.
LncRNAs are the most important type of ncRNA and play an important role in regulatory mechanisms. Various reports have also suggested that lncRNAs may act as ceRNAs and protect target mRNAs from repression and degradation by miRNAs. Therefore, we investigated the significance of survival-related lncRNAs in the ceRNET, which is related to the development and progression of TC. Lastly, after obtaining RNA-seq data from the GDC portal, differentially expressed lncRNAs, miRNAs, and mRNAs were identified between TC patients and normal samples.
KEGG, GO, and DO analysis results demonstrated the enrichment of cancer pathways, including extracellular matrix (ECM), collagen-containing extracellular matrix, extracellular matrix structural constituent, protein digestion, and absorption, and endocrine gland cancer. The survival-related DEmRNAs and survival-related DElncRNAs were chosen using Kaplan-Meier survival analysis for the establishment of the survival-related ceRNET.
Through the MCC method, hub-lncRNAs that may play a role in TC progression and development were identified. Finally, three lncRNAs were found in TC data using bioinformatics: AL162511.1, AC090673.1, and AL365259.1.
According to the ceRNA hypothesis, lncRNA overexpression is associated with miRNA downregulation and increased mRNA expression. Our analysis indicated that AL162511.1 overexpression reduced the miR-24-3p level while the E2F1 level increased (Fig. 7B). Kang et al. conducted a 2017 study to investigate the tumor-suppressive role of miR-24-3p, which found that low expression of this miRNA has a direct contribution to a poor survival outcome for cancer patients (Kang et al. 2017).
Fig. 7.

Hub lncRNA expression levels and Kaplan-Meier curves. The boxplot shows the expression levels of lncRNAs in Tumor samples compared to Normal tissue samples: A AC090673.1, B AL162511.1, and C AL365259.1 In Kaplan-Meier plots, red lines indicate patients with lower lncRNA expression and green lines reflect patients with greater lncRNA expression
E2F1 is one of the most well-known transcription factors, which plays an important role in many cancers. Studies have shown that the E2F1 mRNA and protein expression levels are upregulated in TC, supporting the idea that it plays an important role in developing TC (Al-Hashimi et al. 2020). In this study, Pearson correlation analysis revealed a positive correlation between AL162511.1 and E2F1 (Fig. 9A), which suggests that AL162511.1 regulates E2F1 by trapping miR-24-3p (Fig. 8).
Fig. 9.

Pearson correlation analysis of paired lncRNAs and mRNAs. A AL162511.1 and E2F1, B AL365259.1 and FAM111B, C AC090673.1 and GGCT, D AC090673.1 and GLDN
Fig. 8.

This figure demonstrates how miR-24-3p suppresses E2F1 in the absence of AL162511.1 in normal cells, and then how AL162511.1 inhibits miR-24-3p to elevate E2F1 expression and activation in THCA cells
The association between AC090673.1 and GGCT and their miRNAs (hsa-let-7b, hsa-miR-30a-5p) suggests that this ceRNA network plays an important regulatory role in TC patients (Fig. 7A). Several studies have been conducted to date to investigate GGCT's role in cell proliferation, invasion, and migration in various cancers (Zhang et al. 2016; Taniguchi et al. 2018; Huang et al. 2020). According to several published studies, hsa-let-7b suppresses cell proliferation in Hepatocellular Carcinoma (HCC). Zili He et al. found that hsa-let-7b via p21 upregulation inhibited HCC cell proliferation; hsa-let-7b inhibited the growth of HCC cells when triggered by PLK1 (Hui et al. 2020; He et al. 2018). In another study, hsa-let-7b was found to affect melanoma cell proliferation by targeting UHRF1 (Lu et al. 2020). Therefore, downregulation of hsa-let-7b is consistent with promoting cancer cell growth and proliferation. There has also been evidence that hsa-miR-30a-5p is downregulated in several cancers. A study by Li et al. in 2017 showed that the expression of LDHA, a key enzyme in glycolysis, was inhibited by hsa-miR-30a-5p upregulation. As a result, hsa-miR-30a-5p downregulation can promote the proliferation and growth of cancer cells (Li et al. 2017). In another study, hsa-miR-30a-5p was shown to reduce CD73 expression and ultimately repress non-small cell lung cancer (NSCLC) proliferation. Consequently, hsa-miR-30a-5p downregulation is associated with cancer cell growth and proliferation (Zhu et al. 2017). Thus, AC090673.1 expression is expected to rise due to competing with hsa-miR-30a-5p and hsa-let-7b and regulating and increasing GGCT expression in TC patients, which is consistent with this gene's tumorigenesis role (Fig. 9C).
In addition, ceRNA analysis showed a negative correlation between AC090673.1 and hsa-miR-7-5p and a positive correlation between AC090673.1 and GLDN, indicating that they could play a regulatory role. Data from several studies suggest that hsa-miR-7-5p has been downregulated in many cancers. In a study conducted by Mingjun Dong et al., it was shown that hsa-miR-7-5p inhibits colorectal cancer cell proliferation and migration by suppressing KLF4 oncogene protein, suggesting that downregulation of hsa-miR-7-5p is associated with proliferation and migration of colorectal cancer cells (Dong et al. 2019).
According to another study, hsa-miR-7-5p inhibits cell proliferation, migration, and invasion in non-small cell lung cancer cells (NSCLC) when targeting NOVA2 (Xiao 2019). In a recent study, it was determined that hsa-miR-7-5p targeted the 3′-UTR of SOX18 to suppress the gp130/JAK2/STAT3 signaling pathway, thereby inhibiting pancreatic ductal adenocarcinoma cell growth and proliferation (Zhu et al. 2018 Mar). More research is needed to determine the role of GLDN and its regulatory relationships in THCA patients and other cancers. Nevertheless, this research suggests that increased AC090673.1 expression in THCA patients will lead to decreased expression of hsa-miR-7-5p, leading to increased expression of GLDN (Fig. 9D).
Hsa-miR-192-5p has been demonstrated to possess tumor suppressor properties, and its downregulation promotes cell cycle progression and reduces apoptosis of cells (Khella et al. 2013; Yan-Chun et al. 2017 Feb).
In the present study, we found that overexpression of AL365259.1 arrests hsa-miR-192-5p (Fig. 7C) and reduces its anti-oncogenic potency, which, according to Pearson correlation analysis, contributes to FAM111B abandonment (Fig. 9B). There have been relatively few studies on the function of FAM111B in tumorigenesis. Haijun Sun et al. demonstrated that FAM111B plays a functional role in lung adenocarcinoma cell proliferation, migration, invasion, and inhibiting apoptosis. Additionally, they suggested that FAM111B may play a role in tumor formation and progression via the p53 pathway (Sun et al. 2019). Kawasaki et al. established a study in 2020 to investigate the role of FAM111B for the first time. They found that FAM111B degraded p16 protein and promoted cyclin D1CDK4 activity, which causes cell cycle progression and cell proliferation (Kawasaki et al. 2020).
Juan Tan et al., through a study of 104 patients with papillary thyroid carcinoma, confirmed that LINC02454 is highly expressed in tumoral tissue and has a functional role as an oncogene in the carcinogenesis of papillary thyroid carcinoma (Tan et al. 2020). Several significant limitations restricted the study. The lack of biological confirmation has limited this study because it relies on the TCGA database. Computational prediction in RNA research is just the beginning. More research is needed to verify these findings using a broader range of clinical samples and more laboratory techniques comprising qRT-PCR, western blotting, and luciferase reporter assay. To determine and test the regulation mechanism of the ceRNA network, further in vivo and in vitro research will be required.
Conclusion
By employing bioinformatics techniques, the present study constructed a ceRNET of lncRNA-miRNA-mRNA axis involved in the survival of THCA patients. The result was the retrieval of four hub lncRNAs (AL162511.1, AC090673.1, AL365259.1, LINC02454). The present study has contributed to our understanding of TC development by identifying a new ceRNET. It is necessary to conduct more research into the biological processes of ceRNAs and the importance of AL162511.1, AC090673.1, and AL365259.1 in the survival of TC patients. Further laboratory studies will need to be conducted to determine whether these targets' expression and function abnormally.
Supplementary Information
Below is the link to the electronic supplementary material.
Acknowledgments
We wish to acknowledge The Cancer Genome Atlas (TCGA) project, miRcode, Cytoscape, GO, KEGG, and GeneMANIA databases, and their contributors for presenting these valuable public data sets.
Authors contribution
PM and SM wrote the manuscript comprehensively in all parts, MH, FGZM, and MJK accompanied in many other sections of the paper, and AAS edited the manuscript scientifically and technically. All the authors read the manuscript comprehensively and confirmed the final edited version. Importantly, there is no conflict of interest.
Declarations
Conflict of interest
There is no conflict of interest.
Footnotes
Publisher's Note
Springer Nature remains neutral with regard to jurisdictional claims in published maps and institutional affiliations.
References
- Al-Hashimi A, Venugopalan V, Sereesongsaeng N, Tedelind S, Pinzaru AM, Hein Z, et al. Significance of nuclear cathepsin V in normal thyroid epithelial and carcinoma cells. Biochim Biophys Acta Mol Cell Res. 2020;1867(12):118846. doi: 10.1016/j.bbamcr.2020.118846. [DOI] [PubMed] [Google Scholar]
- Bian W, Jiang XX, Wang Z, Zhu YR, Zhang H, Li X, et al. Comprehensive analysis of the ceRNA network in coronary artery disease. Sci Rep. 2021;11(1):1–11. doi: 10.1038/s41598-021-03688-9. [DOI] [PMC free article] [PubMed] [Google Scholar]
- Brito JP, Morris JC, Montori VM (2013)Thyroid cancer: zealous imaging has increased detection and treatment of low risk tumours. Bmj 347 [DOI] [PubMed]
- Cai Y, Wan J. Competing endogenous RNA regulations in neurodegenerative disorders: current challenges and emerging insights. Front Mol Neurosci. 2018;11:370. doi: 10.3389/fnmol.2018.00370. [DOI] [PMC free article] [PubMed] [Google Scholar]
- Chin CH, Chen SH, Wu HH, Ho CW, Ko MT, Lin CY. cytoHubba: identifying hub objects and sub-networks from complex interactome. BMC Syst Biol. 2014;8(Supp 4):S11. doi: 10.1186/1752-0509-8-S4-S11. [DOI] [PMC free article] [PubMed] [Google Scholar]
- Dong M, Xie Y, Xu Y. miR-7-5p regulates the proliferation and migration of colorectal cancer cells by negatively regulating the expression of Krüppel-like factor 4. Oncol Lett. 2019;17(3):3241–3246. doi: 10.3892/ol.2019.10001. [DOI] [PMC free article] [PubMed] [Google Scholar]
- Esteller M. Non-coding RNAs in human disease. Nat Rev Genet. 2011;12(12):861–74. doi: 10.1038/nrg3074. [DOI] [PubMed] [Google Scholar]
- Expansion of the Gene Ontology knowledgebase and resources. Nucleic Acids Res. 2017;45(D1):D331–D338. doi: 10.1093/nar/gkw1108. [DOI] [PMC free article] [PubMed] [Google Scholar]
- Feinberg AP, Ohlsson R, Henikoff S. The epigenetic progenitor origin of human cancer. Nat rev genet. 2006;7(1):21–33. doi: 10.1038/nrg1748. [DOI] [PubMed] [Google Scholar]
- Goel MK, Khanna P, Kishore J. Understanding survival analysis: kaplan-meier estimate. Int J Ayurveda Res. 2010;1(4):274. doi: 10.4103/0974-7788.76794. [DOI] [PMC free article] [PubMed] [Google Scholar]
- Gray RJ. Modeling survival data: extending the cox model. J Am Stat Assoc. 2002;97(457):353–4. doi: 10.1198/jasa.2002.s447. [DOI] [Google Scholar]
- Grillone K, Riillo C, Scionti F, Rocca R, Tradigo G, Guzzi PH, et al. Non-coding RNAs in cancer: platforms and strategies for investigating the genomic dark matter. J Exp Clin Cancer Res. 2020;39(1):117. doi: 10.1186/s13046-020-01622-x. [DOI] [PMC free article] [PubMed] [Google Scholar]
- Guo K, Qian K, Shi Y, Sun T, Wang Z. LncRNA-MIAT promotes thyroid cancer progression and function as ceRNA to target EZH2 by sponging miR-150-5p. Cell Death Dis. 2021;12(12):1–12. doi: 10.1038/s41419-021-04386-0. [DOI] [PMC free article] [PubMed] [Google Scholar]
- He Z, Deng W, Jiang B, Liu S, Tang M, Liu Y, et al. Hsa-let-7b inhibits cell proliferation by targeting PLK1 in HCC. Gene. 2018;673:46–55. doi: 10.1016/j.gene.2018.06.047. [DOI] [PubMed] [Google Scholar]
- Huang Q, Zhou Y, Li Y, Liao Z. GGCT promotes colorectal cancer migration and invasion via epithelial-mesenchymal transition. Oncol Lett. 2020;20(2):1063–70. doi: 10.3892/ol.2020.11692. [DOI] [PMC free article] [PubMed] [Google Scholar]
- Huang HY, Lin YCD, Li J, Huang KY, Shrestha S, Hong HC, et al. miRTarBase 2020: updates to the experimentally validated microRNA-target interaction database. Nucleic Acids Res. 2020;48(D1):D148–D154. doi: 10.1093/nar/gkz896. [DOI] [PMC free article] [PubMed] [Google Scholar]
- Hui L, Zheng F, Bo Y, Sen-Lin M, Ai-Jun L, Wei-Ping Z, et al. MicroRNA let-7b inhibits cell proliferation via upregulation of p21 in hepatocellular carcinoma. Cell Biosci. 2020;10(1):83. doi: 10.1186/s13578-020-00443-x. [DOI] [PMC free article] [PubMed] [Google Scholar]
- Jeggari A, Marks DS, Larsson E. miRcode: a map of putative microRNA target sites in the long non-coding transcriptome. Bioinformatics. 2012;28(15):2062–2063. doi: 10.1093/bioinformatics/bts344. [DOI] [PMC free article] [PubMed] [Google Scholar]
- Jiang MC, Ni JJ, Cui WY, Wang BY, Zhuo W. Emerging roles of lncRNA in cancer and therapeutic opportunities. Am J Cancer Res. 2019;9(7):1354. [PMC free article] [PubMed] [Google Scholar]
- Kanehisa M, Furumichi M, Tanabe M, Sato Y, Morishima K. KEGG: new perspectives on genomes, pathways, diseases and drugs. Nucleic Acids Res. 2017;45(D1):D353–61. doi: 10.1093/nar/gkw1092. [DOI] [PMC free article] [PubMed] [Google Scholar]
- Kang H, Rho JG, Kim C, Tak H, Lee H, Ji E, et al. The miR-24-3p/p130Cas: a novel axis regulating the migration and invasion of cancer cells. Sci Rep. 2017;7:44847. doi: 10.1038/srep44847. [DOI] [PMC free article] [PubMed] [Google Scholar]
- Kawasaki K, Nojima S, Hijiki S, Tahara S, Ohshima K, Matsui T, et al. FAM111B enhances proliferation of KRAS-driven lung adenocarcinoma by degrading p16. Cancer Sci. 2020;111(7):2635–46. doi: 10.1111/cas.14483. [DOI] [PMC free article] [PubMed] [Google Scholar]
- Khella HWZ, Bakhet M, Allo G, Jewett MAS, Girgis AH, Latif A, et al. miR-192, miR-194 and miR-215: a convergent microRNA network suppressing tumor progression in renal cell carcinoma. Carcinogenesis. 2013;34(10):2231–2239. doi: 10.1093/carcin/bgt184. [DOI] [PubMed] [Google Scholar]
- Kilfoy BA, Zheng T, Holford TR, Han X, Ward MH, Sjodin A, et al. International patterns and trends in thyroid cancer incidence, 1973–2002. Cancer causes control. 2009;20(5):525–31. doi: 10.1007/s10552-008-9260-4. [DOI] [PMC free article] [PubMed] [Google Scholar]
- Law CW, Chen Y, Shi W, Smyth GK. voom: precision weights unlock linear model analysis tools for RNA-seq read counts. Genome Biol. 2014;15(2):R29. doi: 10.1186/gb-2014-15-2-r29. [DOI] [PMC free article] [PubMed] [Google Scholar]
- Li L, Kang L, Zhao W, Feng Y, Liu W, Wang T, et al. miR-30a-5p suppresses breast tumor growth and metastasis through inhibition of LDHA-mediated warburg effect. Cancer Lett. 2017;400:89–98. doi: 10.1016/j.canlet.2017.04.034. [DOI] [PubMed] [Google Scholar]
- Li R, Qu H, Wang S, Wei J, Zhang L, Ma R, et al. GDCRNATools: an R/Bioconductor package for integrative analysis of lncRNA, miRNA and mRNA data in GDC. Bioinformatics. 2018;34(14):2515–7. doi: 10.1093/bioinformatics/bty124. [DOI] [PubMed] [Google Scholar]
- Liu X, Liu G, Lu Y, Shi Y. Long non-coding RNA HOTAIR promotes cell viability, migration and invasion in thyroid cancer by sponging miR-17-5p. Neoplasma. 2020;67(2):229–37. doi: 10.4149/neo_2019_190310N208. [DOI] [PubMed] [Google Scholar]
- Lu NH, Wei CY, Qi FZ, Gu JY. Hsa-let-7b suppresses cell proliferation by targeting UHRF1 in melanoma. Cancer Invest. 2020;38(1):52–60. doi: 10.1080/07357907.2019.1709482. [DOI] [PubMed] [Google Scholar]
- Nagaiah G, Hossain A, Mooney CJ, Parmentier J, Remick SC (2011) Anaplastic thyroid cancer: a review of epidemiology, pathogenesis, and treatment. J Oncol [DOI] [PMC free article] [PubMed]
- Paci P, Colombo T, Farina L. Computational analysis identifies a sponge interaction network between long non-coding RNAs and messenger RNAs in human breast cancer. BMC Syst Biol. 2014;8(1):83. doi: 10.1186/1752-0509-8-83. [DOI] [PMC free article] [PubMed] [Google Scholar]
- Park CS, Kim SH, Jung SL, Kang BJ, Kim JY, Choi JJ, et al. Observer variability in the sonographic evaluation of thyroid nodules. J Clin Ultrasound. 2010;38(6):287–93. doi: 10.1002/jcu.20689. [DOI] [PubMed] [Google Scholar]
- Peng X, Zhang K, Ma L, Xu J, Chang W. The role of long non-coding RNAs in thyroid cancer. Front Oncol. 2020;10:941. doi: 10.3389/fonc.2020.00941. [DOI] [PMC free article] [PubMed] [Google Scholar]
- Quinn JJ, Chang HY. Unique features of long non-coding RNA biogenesis and function. Nat Rev Genet. 2016;17(1):47–62. doi: 10.1038/nrg.2015.10. [DOI] [PubMed] [Google Scholar]
- Ramírez-Moya J, Wert-Lamas L, Acuña-Ruíz A, Fletcher A, Wert-Carvajal C, McCabe CJ, et al. Identification of an interactome network between lncRNAs and miRNAs in thyroid cancer reveals SPTY2D1-AS1 as a new tumor suppressor. Sci Rep. 2022;12(1):1–13. doi: 10.1038/s41598-022-11725-4. [DOI] [PMC free article] [PubMed] [Google Scholar]
- Robinson MD, Oshlack A. A scaling normalization method for differential expression analysis of RNA-seq data. Genome Biol. 2010;11(3):R25. doi: 10.1186/gb-2010-11-3-r25. [DOI] [PMC free article] [PubMed] [Google Scholar]
- Robinson MD, McCarthy DJ, Smyth GK. edgeR: a Bioconductor package for differential expression analysis of digital gene expression data. Bioinformatics. 2010;26(1):139–140. doi: 10.1093/bioinformatics/btp616. [DOI] [PMC free article] [PubMed] [Google Scholar]
- Salmena L, Poliseno L, Tay Y, Kats L, Pandolfi PP. A ceRNA hypothesis: the Rosetta Stone of a hidden RNA language? Cell. 2011;146(3):353–8. doi: 10.1016/j.cell.2011.07.014. [DOI] [PMC free article] [PubMed] [Google Scholar]
- Schriml LM, Mitraka E, Munro J, Tauber B, Schor M, Nickle L, et al. Human Disease Ontology 2018 update: classification, content and workflow expansion. Nucleic Acids Res. 2019;47(D1):D955–D962. doi: 10.1093/nar/gky1032. [DOI] [PMC free article] [PubMed] [Google Scholar]
- See A, Iyer NG, Tan NC, Teo C, Ng J, Soo KC, et al. Distant metastasis as the sole initial manifestation of well-differentiated thyroid carcinoma. Europ Arch Oto-Rhino-Laryngol. 2017;274(7):2877–82. doi: 10.1007/s00405-017-4532-9. [DOI] [PubMed] [Google Scholar]
- Seib CD, Sosa JA. Evolving understanding of the epidemiology of thyroid cancer. Endocrinology and Metabolism Clinics. 2019;48(1):23–35. doi: 10.1016/j.ecl.2018.10.002. [DOI] [PubMed] [Google Scholar]
- Seo D, Kim D, Chae Y, Kim W.( 2020) The ceRNA network of lncRNA and miRNA in lung cancer. Genomics Informa 18(4) [DOI] [PMC free article] [PubMed]
- Shannon P, Markiel A, Ozier O, Baliga NS, Wang JT, Ramage D, et al. Cytoscape: a software environment for integrated models of biomolecular interaction networks. Genome Res. 2003;13(11):2498–504. doi: 10.1101/gr.1239303. [DOI] [PMC free article] [PubMed] [Google Scholar]
- Su K, Wang N, Shao Q, Liu H, Zhao B, Ma S. The role of a ceRNA regulatory network based on lncRNA MALAT1 site in cancer progression. Biomed Pharmacother. 2021;137:111389. doi: 10.1016/j.biopha.2021.111389. [DOI] [PubMed] [Google Scholar]
- Sun H, Liu K, Huang J, Sun Q, Shao C, Luo J, et al. FAM111B, a direct target of p53, promotes the malignant process of lung adenocarcinoma. Onco Targets Ther. 2019;12:2829. doi: 10.2147/OTT.S190934. [DOI] [PMC free article] [PubMed] [Google Scholar]
- Sung H, Ferlay J, Siegel RL, Laversanne M, Soerjomataram I, Jemal A, et al. Global cancer statistics 2020: GLOBOCAN estimates of incidence and mortality worldwide for 36 cancers in 185 countries. CA Cancer J Clin. 2021;71(3):209–49. doi: 10.3322/caac.21660. [DOI] [PubMed] [Google Scholar]
- Tam AA, Ozdemir D, Aydın C, Bestepe N, Ulusoy S, Sungu N, et al. Association between preoperative thyrotrophin and clinicopathological and aggressive features of papillary thyroid cancer. Endocrine. 2018;59(3):565–72. doi: 10.1007/s12020-018-1523-6. [DOI] [PubMed] [Google Scholar]
- Tan J, Liu L, Zuo Z, Song B, Cai T, Ding D, et al. Overexpression of novel long intergenic non-coding RNA LINC02454 is associated with a poor prognosis in papillary thyroid cancer. Oncol Rep. 2020;44(4):1489–1501. doi: 10.3892/or.2020.7712. [DOI] [PMC free article] [PubMed] [Google Scholar]
- Taniguchi K, Matsumura K, Ii H, Kageyama S, Ashihara E, Chano T, et al. Depletion of gamma-glutamylcyclotransferase in cancer cells induces autophagy followed by cellular senescence. Am J Cancer Res. 2018;8(4):650–61. [PMC free article] [PubMed] [Google Scholar]
- 4 USDOEJGIHT 4 BE 4 PP 4 RP 4 WS 4 ST 4 DN 4 CJF 4 OA 4 LS 4 EC 4 UE 4 FM, 9 RGSCSY 9 FA 9 HM 9 YT 9 TA 9 IT 9 KC 9 WH 9 TY 9 TT, 10 G and CU 8030: WJ 10 HR 10 SW 10 AF 10 BP 10 BT 10 PE 10 RC 10 WP, Department of Genome Analysis I of MBRA 12 PM 12 NG 12 TS 12 RA 12, 11 GTCSCSDR 11 DSL 11 RM 11 WK 11 LHM 11 DJ, 15 BGIGCYH 13 YJ 13 WJ 13 HG 14 GJ (2001) Initial sequencing and analysis of the human genome. nature.;409 (6822):860–921. [DOI] [PubMed]
- Wang C, Yan G, Zhang Y, Jia X, Bu P. Long non-coding RNA MEG3 suppresses migration and invasion of thyroid carcinoma by targeting of Rac1. Neoplasma. 2015;62(4):541–9. doi: 10.4149/neo_2015_065. [DOI] [PubMed] [Google Scholar]
- Wang L, Cho KB, Li Y, Tao G, Xie Z, Guo B. Long non-coding RNA (lncRNA)-mediated competing endogenous RNA networks provide novel potential biomarkers and therapeutic targets for colorectal cancer. Int J Mol Sci. 2019;20(22):5758. doi: 10.3390/ijms20225758. [DOI] [PMC free article] [PubMed] [Google Scholar]
- Warde-Farley D, Donaldson SL, Comes O, Zuberi K, Badrawi R, Chao P, et al. The GeneMANIA prediction server: biological network integration for gene prioritization and predicting gene function. Nucleic Acids Res. 2010;38(2):W214–W220. doi: 10.1093/nar/gkq537. [DOI] [PMC free article] [PubMed] [Google Scholar]
- Xiao H. MiR-7-5p suppresses tumor metastasis of non-small cell lung cancer by targeting NOVA2. Cell Mol Biol Lett. 2019;24(1):60. doi: 10.1186/s11658-019-0188-3. [DOI] [PMC free article] [PubMed] [Google Scholar]
- Xu J, Xu J, Liu X, Jiang J. The role of lncRNA-mediated ceRNA regulatory networks in pancreatic cancer. Cell Death Discov. 2022;8(1):1–11. doi: 10.1038/s41420-022-01061-x. [DOI] [PMC free article] [PubMed] [Google Scholar]
- Yan-Chun L, Hong-Mei Y, Zhi-Hong C, Qing H, Yan-Hong Z, Ji-Fang W. MicroRNA-192-5p promote the proliferation and metastasis of hepatocellular carcinoma cell by targeting SEMA3A. Appl Immunohistochem Mol Morphol. 2017;25(4):251–60. doi: 10.1097/PAI.0000000000000296. [DOI] [PubMed] [Google Scholar]
- Yu G, Wang LG, Han Y, He QY. clusterProfiler: an R package for comparing biological themes among gene clusters. OMICS. 2012;16(5):284–287. doi: 10.1089/omi.2011.0118. [DOI] [PMC free article] [PubMed] [Google Scholar]
- Zargari N, Mokhtari M. Evaluation of diagnostic utility of immunohistochemistry markers of TROP-2 and HBME-1 in the diagnosis of thyroid carcinoma. Eur Thyroid J. 2019;8(1):1–6. doi: 10.1159/000494430. [DOI] [PMC free article] [PubMed] [Google Scholar]
- Zhang Y. Classification and diagnosis of thyroid carcinoma using reinforcement residual network with visual attention mechanisms in ultrasound images. J Med Syst. 2019;43(11):1–9. doi: 10.1007/s10916-019-1448-5. [DOI] [PubMed] [Google Scholar]
- Zhang W, Chen L, Xiang H, Hu C, Shi W, Dong P, et al. Knockdown of GGCT inhibits cell proliferation and induces late apoptosis in human gastric cancer. BMC Biochem. 2016;17(1):19. doi: 10.1186/s12858-016-0075-8. [DOI] [PMC free article] [PubMed] [Google Scholar]
- Zhu J, Zeng Y, Li W, Qin H, Lei Z, Shen D, et al. CD73/NT5E is a target of miR-30a-5p and plays an important role in the pathogenesis of non-small cell lung cancer. Mol Cancer. 2017;16(1):34. doi: 10.1186/s12943-017-0591-1. [DOI] [PMC free article] [PubMed] [Google Scholar]
- Zhu W, Wang Y, Zhang D, Yu X, Leng X. MiR-7-5p functions as a tumor suppressor by targeting SOX18 in pancreatic ductal adenocarcinoma. Biochem Biophys Res Commun. 2018;497(4):963–70. doi: 10.1016/j.bbrc.2018.02.005. [DOI] [PubMed] [Google Scholar]
Associated Data
This section collects any data citations, data availability statements, or supplementary materials included in this article.