Abstract
Purpose:
Human tears contain abundant, diverse sets of proteins that may serve as biomarkers of ocular surface health. There is a need for reproducible methods that consider multiple factors influencing the tear proteome, in addition to the variable of interest. Here we examined a workflow for proteomic analysis of tear proteins without the need to pool tear samples from multiple individuals, thus allowing for analyses based on individual factors, and increasing opportunities for protein biomarker discovery.
Methods:
Tears were collected by Schirmer strip following topical ocular anesthetic application then individually stored at −80°C prior to processing for proteomics. Tear proteins were extracted from Schirmer strips, digested using suspension trapping spin columns (S-Trap), and labeled with high multiplicity tandem mass tags (TMT). Peptide digests were then extensively fractionated by two-dimensional chromatography and analyzed by mass spectrometry to identify and measure changes in protein abundance in each sample. Analysis of select samples was performed to test protocols and to compare the impact of clinically relevant parameters. To facilitate comparison of separate TMT experiments, common pool samples were included in each TMT instrument run and internal reference scaling (IRS) was performed.
Results:
Differences in subsets of tear proteins were noted for: geographic site of tear collection, contact lens use, and differences in tear fluid volume among individuals.
Conclusion:
These findings demonstrate that proteomic analysis of human tear proteins can be performed without the need to pool samples, and that development of analytic workflows must consider factors that may affect outcomes in studies focused on diverse clinical samples.
Keywords: biomarker, contact lens, proteome, tears, Schirmer
1. INTRODUCTION
Human tears are critical in the maintenance of ocular surface homeostasis and exhibit differential composition in states of health and disease. A healthy tear film bathes the cornea and conjunctival tissues to provide constant hydration, supply oxygen and nutrients, and maintain a smooth refractive surface. Tears also impart physical, antimicrobial, and environmental protection; their secretion and content change dynamically in response to local, systemic, and even emotional stimulation. Tear fluid has a relatively high protein content and proteins within the tear fluid arise primarily from the main lacrimal gland, but proteins have also been traced to serum and infiltrating immune cells.[1] With advancements in proteomic analysis techniques, patterns of change within the tear proteome have been identified in association with conditions ranging from dry eye disease and contact lens use to diabetes and Alzheimer’s disease. [2–5]
The non-invasive nature of sample collection and insight into physiologic and pathologic processes make tears an attractive source for biomarker discovery.[6] However, proteomic analyses of tear fluid presents challenges. Individual sample volumes are small, particularly when collected from participants with aqueous-deficient dry eye disease. Consequently, many early tear proteome studies relied on sample pooling from multiple individuals with particular conditions or attributes. Given the wide range of factors influencing the proteome, pooling participant samples based on one factor of interest may confound data analysis. In addition, high abundance proteins predominate in the composition of human tear fluid and can suppress detection of lower abundance proteins, which may also vary in expression levels between individuals and conditions.[7] Recent technical advances have increased the capacity for rapid protein identification and quantification.[8] However, in the absence of standardized protocols to improve reproducibility in proteomic techniques and data analysis, investigators face challenges in interpreting results across studies.
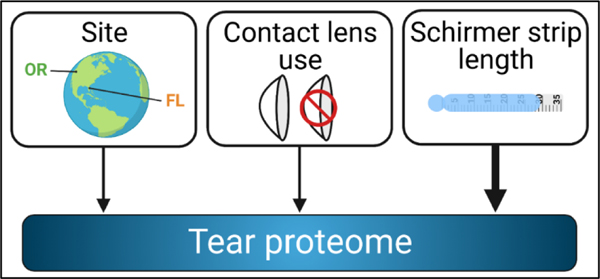
In the present study, we used isobaric labeling of samples with tandem mass tags (TMT) and subsequent fractionation to allow for parallel processing of individual tear samples and deeper sampling of the proteome, producing quantitative tear protein data with minimal missing values. Differential abundances of tear proteins are elucidated using data analytic pipelines for protein identification and quantification, extensive quality control analysis, and robust statistical comparisons. These methods were applied to compare the degree of influence of three different factors on human tear proteomes: Schirmer strip wetted length, geographic site of tear collection, and contact lens (CL) use.
2. METHODS
2.1. Study workflow
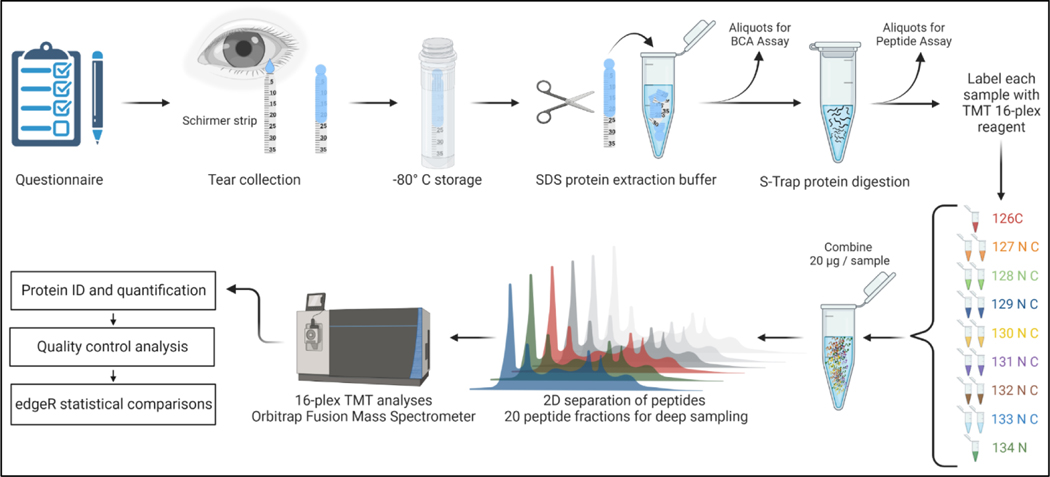
Figure 1 illustrates the workflow for the sample collection and proteomic analysis of human tear proteins. Tear samples were placed in tubes on dry ice for no more than 2 hours prior to transfer to −80°C for storage. Other steps in the workflow are described in detail below.
Figure 1.
Tandem mass tag (TMT) workflow for collection and analysis of human tear fluids. Created with BioRender.com
2.2. Participants
Healthy individuals with no known ocular disease were recruited from two geographic sites to answer questionnaires and donate tear samples. The protocols used in this study have been approved by the Institutional Review Boards at both sites: Casey Eye Institute at the Oregon Health & Science University (OHSU) in Portland, Oregon (OR) and Bascom Palmer Eye Institute at the University of Miami in Miami, Florida (FL). The study was conducted in accordance with the principles of the Declaration of Helsinki and complied with the requirements of the United States Health Insurance Portability and Accountability Act. Written informed consent was obtained from all participants prior to any study activities unless only deidentified data were collected. Samples were collected between November 2020 and January 2021.
2.3. Symptom questionnaires
Individual participants completed validated ocular symptom questionnaires including the 5-Item Dry Eye Questionnaire (DEQ5) and the Ocular Surface Disease Index (OSDI), and provided demographic information including sex, age, and CL use.[9, 10]
2.4. Tear collection
Tears were collected with Schirmer strips (Diagnostic Schirmer Tear Strips, Sports World Vision, Ireland) placed in both eyes simultaneously and left in place for 5 minutes. Standard clinical protocol was followed with Schirmer strips placed in the lateral aspect of the inferior conjunctival cul de sac.[11] The experimenter wore nitrile gloves when handling strips to minimize contamination. Most participants received topical anesthetic (0.5% proparacaine hydrochloride ophthalmic solution, Alcon Laboratories, Fort Worth, TX, NDC 61314–016-01, or Bausch and Lomb, Tampa, FL, NDC 24208–730-06) in both eyes 30 seconds prior to tear collection (see Results for participant details). Schirmer strips were removed from the eyes and the wetted length of the strip was recorded to the nearest millimeter (mm). Strips were then placed in individual sterile 2 ml polypropylene tubes (Thermo Fisher Scientific (TFS), cat # 346911, Waltham, MA, or Sarstedt, Inc., cat # 72.694.006, Newton, NC) and stored at −80°C until further processing.
For a control experiment examining the analytical effect of tear volume on the proteome (see 3.4), tears were collected by polystyrene capillary tube from 10 additional volunteers (5 females, 5 males) distinct from the participants described in 2.1. Capillary tubes were held on the tear meniscus near the lateral canthus for up to 5 minutes, or until additional movement of fluid up the capillary had stopped.
2.5. Sample preparation
2.5.1. Protein extraction, assay, and digestion
The proteomics workflow for this study is illustrated in Figure 1. Schirmer strips were removed from −80°C storage, cut into approximately 3 mm square pieces using dissecting scissors (Fisher Scientific, cat # 08–940) and placed directly into 1.5 ml Eppendorf Lo-Bind tubes (cat # 022431081). Different tear sample collection and processing protocols have been shown to affect the proteins recovered for proteomic analysis.[12] To reduce potential sources of sample variation, both clinic sites used the same study materials, including Schirmer strips and sterile storage tubes from the same lot of a single manufacturer.
Tear proteins were extracted from Schirmer strips using 5% SDS in 100 mM HEPES buffer (pH 8). Aliquots were removed for bicinchoninic (BCA) assay (Pierce BCA assay kit, TFS, cat # 23225) to determine total protein recovered from the Schirmer strips.[13] Tear proteins were then applied to suspension-trapping (S-Trap) micro spin columns (Protifi, cat # C02-micro) for trypsin digestion using the manufacturer’s recommended protocol and sequencing grade modified trypsin (ProMega, cat # V5111). [14, 15] The Pierce Quantitative Colorimetric Peptide Assay (TFS cat # 23275) was used to determine the amount of recovered peptides in each sample.
2.5.2. Common pool samples
To allow quantitative comparisons between TMT runs, a common pool of tears was created and included in each instrument run. The pool was created with Schirmer strips from at least one eye of 22 different individuals, and BCA protein assays were performed on individual extracts as described above. A total of 2.5 mg of combined tear proteins was then digested using S-Trap Midi columns (ProtiFi, C02-mini) with sequencing grade modified trypsin (as above). A Pierce peptide assay determined a yield of 2.3 mg of peptide, which was aliquoted and frozen at −80°C for use as an internal reference standard for the TMT analyses (see 2.6.3 below).[16]
2.5.3. Isobaric labeling and mass spectrometry analysis
For each instrument run, tears from up to 14 different samples (20 μg) were trypsin-digested and labeled using the TMTpro™ 16plex label reagents as per the manufacturer’s protocol (TFS, A44522). Two channels per run were reserved for the common pool tear digest used for internal reference scaling. Samples were analyzed to identify and quantify the relative abundance of tear proteins using LC/MS analysis as described previously.[16] Briefly, following an initial small-scale mixing and analysis to normalize summed TMT reporter ion intensities, adjusted volumes of each labeled sample were mixed and multiplexed peptides separated by automated two-dimensional liquid chromatography. The first-dimension chromatography step separated the peptides into 20 fractions, and each of these was further separated using a 140 min nano reverse-phase chromatographic run interfaced to an Orbitrap Fusion Tribrid Mass Spectrometer (Thermo Scientific). Peptide identification used MS2 spectra, while quantification of TMT reporter ions for each peptide was performed using MS3 scans, which include additional fragmentation events.[17]
2.6. Comparative analysis
2.6.1. Data processing
Peptide sequences associated with specific tear proteins were identified using the Comet search engine (version 2016.03) and proteomic analysis workflow pipeline as previously described using a UniProt protein sequence database (UP000005640, human, taxon ID 9606) containing 20,603 canonical protein sequences plus common contaminants. False discovery for peptide identification was below 1%.[18, 19] Identified peptides were assembled into protein lists.[20] Proteins with 3 or more peptide spectral matches (PSMs) were considered to be confidently measured. Jupyter notebooks with an R kernel were used for data visualization and quality control testing.
2.6.2. Within-run comparisons of replicate samples
To test the reproducibility of the workflow and protocol, we collected Schirmer strips from 7 individuals, then cut each strip lengthwise for a total of 14 samples. The 14 half-strip samples were then processed through the workflow, as shown in Figure 1.
2.6.3. Differential protein comparisons within groups
Statistical analyses were performed on all proteins with at least 3 PSMs using the Bioconductor package edgeR.[21] Additional criteria applied to analysis of candidate proteins for differential abundance included an uncorrected edgeR p value of < 0.05 and a linear fold change of at least ± 1.5.[22, 23] Since these experiments were modestly sized and considered pilot studies, we opted a priori to focus on p-values and magnitude of fold changes, and to not apply overly conservative adjustments for multiple comparisons at this stage of the analysis.
2.6.4. Internal Reference Scaling (IRS) normalization across studies of CL comparisons
Datasets from three smaller experiments were combined to compare the tear proteomes of CL users to those who do not use CLs. The combined dataset included samples from both tear collection sites (Casey Eye Institute, Portland, OR and Bascom Palmer Eye Institute, Miami, FL) and used internal reference scaling (IRS) normalization to achieve quantification across multiple TMT runs.[16] The common pool sample was used as the internal reference standard (see above 2.5.2). In this comparison, we used Benjamini-Hochberg adjustment to define a false discovery rate (FDR) for differential protein abundance. We used an FDR < 0.1 as the criterion to identify differentially abundant proteins between the CL groups (users vs non-users).
2.6.5. Data visualizations
Volcano plots with color-coding were used to visualize proteins measured in each comparison (2.6.2), and proteins differentially expressed between CL and non-CL users. In each plot, x-axis values are the log2 fold changes and y-axis values are the log10 uncorrected edgeR exact test p-values. Red and blue dots represent proteins that met PSM criteria, uncorrected edge R exact p value < 0.05, and demonstrated an absolute fold change of 1.5 or more (> 1.5 red, < −1.5 blue). For ease of comparison across studies, the volcano plot scales were identical. The MA plot (also known as Bland-Altman plot) was used to visualize comparisons between CL users and non-users in the combined study (2.6.3.). In the MA plot, the x-axis values are the log10 average intensity of the proteins and the y-axis values are log2 fold change, with red and blue dots representing proteins that meet the more rigorous statistical criteria detailed above and demonstrate an increase (red) or decrease (blue) in intensity in CL users as compared to nonCL users. Data visualizations were performed in R 3.6.2. Correlation data was visualized using SigmaPlot 14.5 (Inpixon, Palo Alto, CA).
3. RESULTS
3.1. Participant characteristics
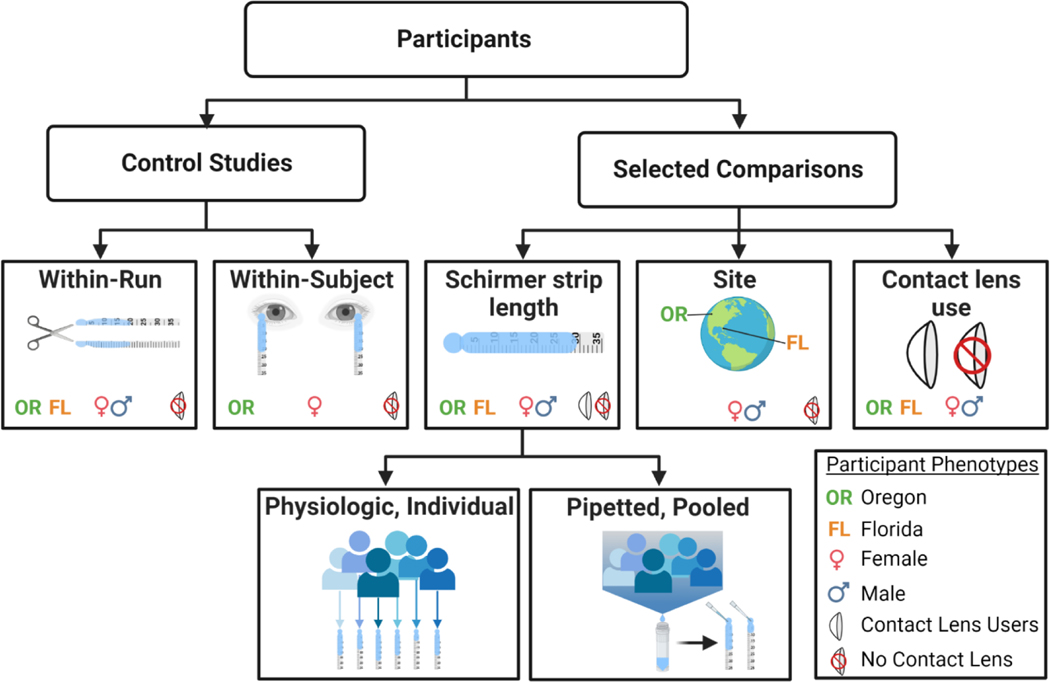
A total of 50 healthy individuals without known pre-existing ocular disease were recruited from two geographic sites (Casey Eye Institute, Portland, OR, and Bascom Palmer Eye Institute, Miami, FL) for this study (Table 1). Individual samples included in proteomic analyses were balanced within individual experiments for demographics and characteristics outside of the condition(s) being compared, when possible (Figure 2).
Table 1.
Participant characteristics
| Casey Eye Institute | Bascom Palmer Eye Institute | |
|---|---|---|
| Portland, OR | Miami, FL | |
| N | 22 | 28 |
| Sex | 12 Females, 10 Males | 19 Females, 9 Males |
| Age (years; Mean ± SEM) | 35.9 ± 2.1 | 34.8 ± 1.9 |
| Race | 5 Asian, 0 Black, 15 White, 2 Other | 2 Asian, 3 Black, 14 White, 9 Other |
| Ethnicity* | 2 Hispanic, 13 Non-Hispanic | 10 Hispanic, 17 Non-Hispanic |
| Soft Contact Lens (CL) use (% of participants) | 43% | 27% |
| OSDI Score (Mean ± SEM) | 4.7 ± 1.1 | 3.4 ± 0.9 |
| DEQ5 (Mean ± SEM) | 6.1 ± 0.7 | 4.3 ± 0.9 |
Not answered by all participants
Figure 2.
Summary of proteomic control and selected comparisons and p articipant phenotypes within each comparison. Created with BioRender.com
3.2. Within-run comparisons of replicate samples for reproducibility
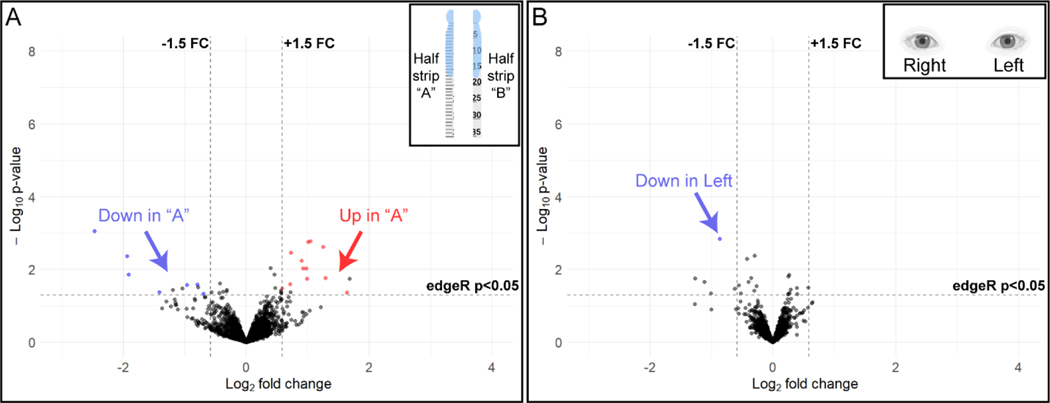
There were 3057 proteins detected in all 14 samples, and only 0.6% (19 proteins) met our criteria (see 2.6.1) for differential relative abundance between the half-strip replicates (Figure 3A). These results demonstrate the high reproducibility of this workflow for tear sample preparation and proteomic analysis.
Figure 3.
Volcano plots of relative protein abundance in (A) replicates of strips cut in half (n = 7 eyes, 2 half-strips/eye, 14 half strips, inset) and (B) left and right eyes of the same individual (n = 4 people, 8 eyes, inset). X-axis values are the log2 fold changes (FC) and y-axis values are the log10 uncorrected edgeR exact test p-values. There were very few proteins that demonstrated an increase (red) or decrease (blue) in relative abundance in (A) half strip “A” as compared to half strip “B”. There was only 1 protein in the left eye (B) that demonstrated decreased (blue) relative abundance when compared to the right eye of the same participant. A complete list of differentially expressed proteins in the above comparisons can be found in Appendix Tables A.1 and A.2. Insets created with BioRender.com
3.3. Within-subject comparisons: Left eye versus right eye
We tested the degree of tear protein variation between the right and left eyes of participants, using protein extracted from 8 strips collected from 4 individuals at a single time point. This analysis identified 1987 proteins that were detected in all 8 samples. There was only 1 differentially abundant protein, representing 0.05% of total proteins that met our criteria of at least 3 PSMs, an uncorrected edgeR p-value of < 0.05, and a fold change of ± 1.5. These results demonstrate a uniform protein expression between the two eyes of each healthy individual and further support the reproducibility of the study methods (Figure 3B).
3.4. Proteomic changes related to tear volume
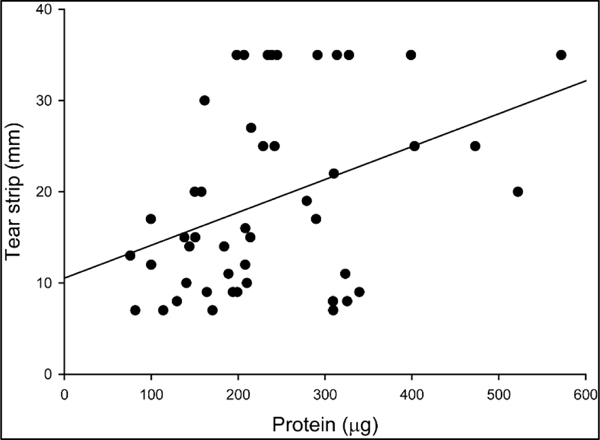
Study participants presented with a wide range of tear volumes as measured by Schirmer strip wetted length over a 5-minute period. There was a moderate, but statistically significant trend to recover more protein from strips with higher wetted length (Linear regression: R = 0.390, P = 0.007) (Figure 4), although there was a large variation in the total amount of tear protein recovered between individuals, suggesting the concentration of protein in tears of individuals varied substantially.
Figure 4.
Tear protein recovery increases with Schirmer strip wetted length across individual eyes, although there is wide variation. The total amount of protein (μg) recovered from each tear strip was plotted versus the Schirmer strip wetted length (mm). Each data point represents one sample from one eye. Some samples were collected from different eyes of the same participant; therefore, some individuals are represented more than once (n = 47 samples from 37 individuals).
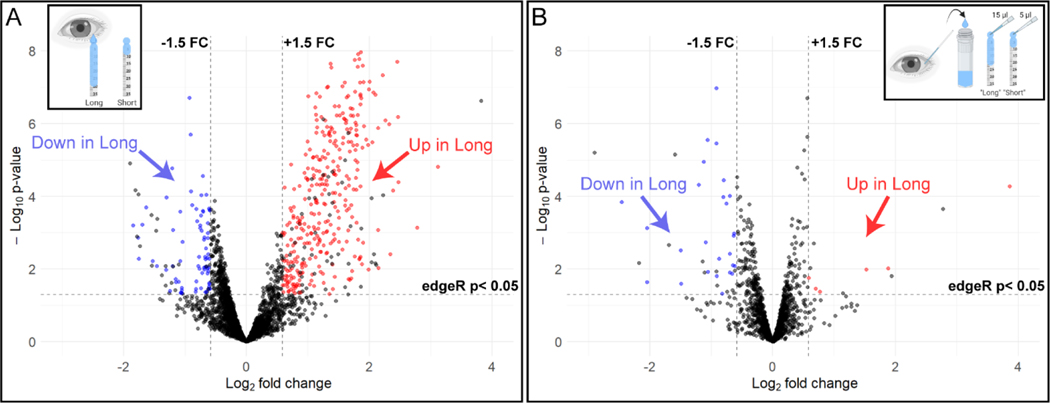
Given this variation in tear strip wetting and protein recovery, we investigated how much tear volume might contribute to differential protein abundance across samples by conducting two comparisons. First, we performed TMT analysis on 14 samples from individuals with large differences in tear volume. Samples designated as “short” had Schirmer tear strip wetted lengths of less than 10 mm (mean ± SEM: 8.1 ± 0.3 mm) and samples designated as “long” had Schirmer tear strip wetted lengths of 20 mm or greater (mean ± SEM: 31.4 ± 2.4 mm). A total of 2901 proteins were detected in all of these samples and 424 (14.6%) were differentially abundant based on our criteria (Methods 2.6.2.). A volcano plot demonstrates the number of proteins that were differentially abundant in the “long” tear strip samples compared to the “short” tear strip samples (Figure 5A). Many proteins were more abundant in the long tear strips (348 proteins, red dots), and some proteins (76, blue dots) were less abundant in long tear strips compared to short tear strips.
Figure 5.
Effect of Schirmer strip wetted length on the tear proteome. A) Individuals that naturally produce long Schirmer strip wetted length (inset) show extensive differential abundance of tear proteins as compared to those that produce short Schirmer strip wetted length. (B) Pipetted application of different fluid amounts from pooled tear samples (inset) causes some differential relative abundance of proteins in the pipetted “Long” Schirmer group as compared to the pipetted “Short” group, although not to the extent seen in individuals that naturally produce long Schirmer strip wetted lengths (A). Many proteins demonstrated an increased relative abundance in Long strips (A, red) when compared to Short strips with fewer proteins demonstrating a decrease in relative abundance in Long strips (blue) versus Short strips. The opposite was true in the pipetted samples with very few proteins demonstrating an increase in relative abundance in pipetted “Long” strips (B, red) compared to pipetted “Short” strips and more proteins demonstrating decreased relative abundance in pipetted “Long” strips (blue) compared to pipetted “Short” strips. Due to volcano plot scale standardization, 20 proteins for panel A and 3 proteins for panel B exceeded the scale and are not shown. A complete list of differentially expressed proteins in the above comparisons can be found in Appendix Tables A.3 and A.4. Insets created with BioRender.com
Although equal amounts of recovered peptides were used for TMT labeling within each TMT analysis, differences in collected tear volumes and overall greater amounts of extracted protein in some tear strips (Figure 4) could have altered the abundance of some proteins in the extracts. To examine the degree of variability in protein abundance based on volume alone, different amounts of tear fluid from a pool of tears were pipetted onto Schirmer strips to create artificially short and long Schirmer strip wetted lengths. Tears from 10 individuals were collected using polystyrene capillary tubes and pooled into a single volume. One of two different fixed amounts of volume (5 or 15 μl) from the pooled sample was pipetted onto 7 Schirmer strips, yielding an average wetted length of 8 mm (“short”) and 20 mm (“long”), respectively. The total amount of protein recovered from “long” strips (mean ± SEM = 112.0 ± 2.0 μg) was significantly more than the amount of protein recovered from “short” strips (mean ± SEM = 30.1 ± 1.6 μg; t-test, P < 0.001). The short (n = 3) and long (n = 4) Schirmer strips were then processed using the TMT workflow (Figure 1). The TMT detected 1536 proteins in all of the samples, 2.2% (n = 33) of which were differentially abundant between the short and long tear strips (Figure 5B). Most differentially detected proteins were more abundant in the pipetted “short” strips, in contrast to the trend seen in tears from physiologically-determined strip lengths, i.e., the wetted length collected from a participant through standard 5-minute clinical Schirmer testing (Figure 5A). Thus, both the number and the direction of differential protein abundance in the pooled study (Figure 5B) were distinct from the differences seen between individual participants with either high or low tear volumes (Figure 5A).
3.5. Proteomic differences between geographic sites
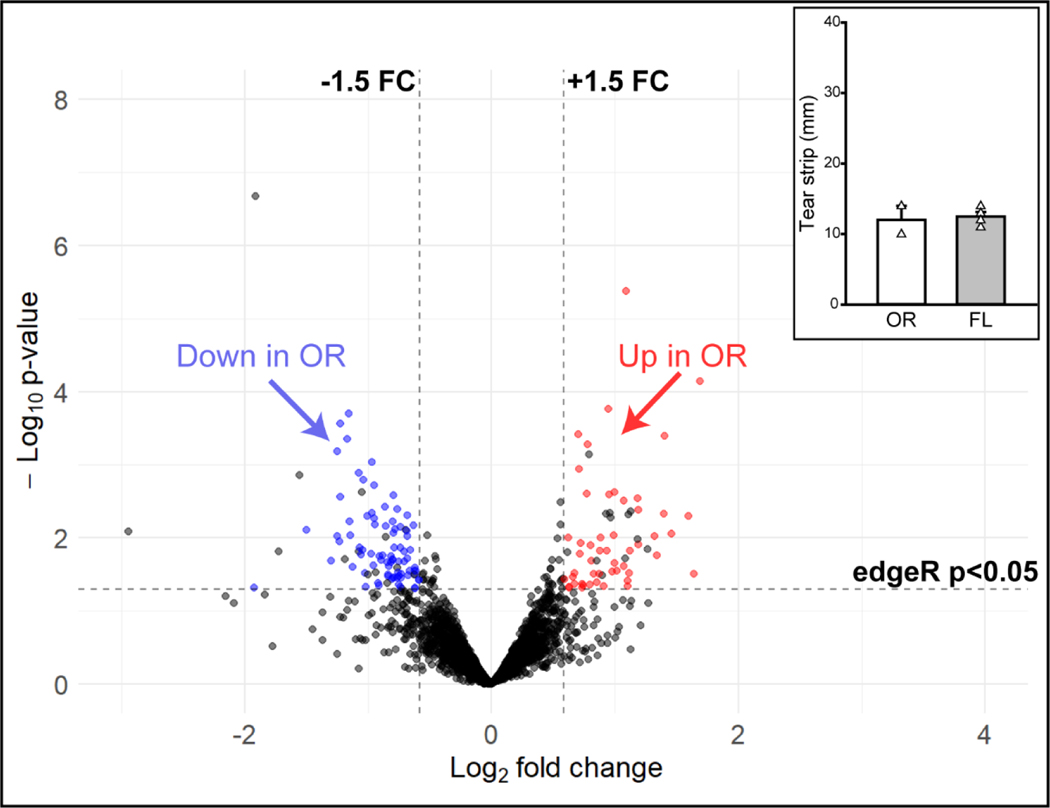
The tear proteome was compared between samples collected at two geographic sites: Casey Eye Institute in Portland, OR, and Bascom Palmer Eye Institute in Miami, FL. Based on the significant impact of Schirmer strip wetted length on the tear proteome (Figure 5A), we restricted between-site comparisons to a subgroup from each site that had similar Schirmer strip wetted lengths (10 – 14 mm). Of the 3498 total proteins detected (Figure 6), 129 proteins (3.7%) were differentially abundant. There were both increased (51) and decreased (78) proteins detected in the Oregon (OR) samples (n = 2) as compared to the Florida (FL) samples (n = 4). While this study was not powered for rigorous statistical comparisons, it suggests that tear collection site should be considered a potential factor that can influence outcomes when designing multi-site tear proteome studies.
Figure 6.
Volcano plot of differentially abundant proteins by tear collection site. Oregon (OR) samples demonstrate differential abundance of proteins as compared to Florida (FL) samples. Inset is a graph of Schirmer strip wetted lengths from OR and FL samples included in this comparison. Even when Schirmer strip wetted length was controlled, there were proteins that were increased (red) or decreased (blue) in relative abundance in OR samples as compared to FL samples. There was one protein that exceeded the standardized scales set for these volcano plots and is not shown. A complete list of differentially expressed proteins in the above comparisons can be found in Appendix Table A.5. Inset: Mean tear strip length ± SEM. White triangles represent individual sample values within each group.
3.6. Tear proteome changes with soft contact lens (CL) use
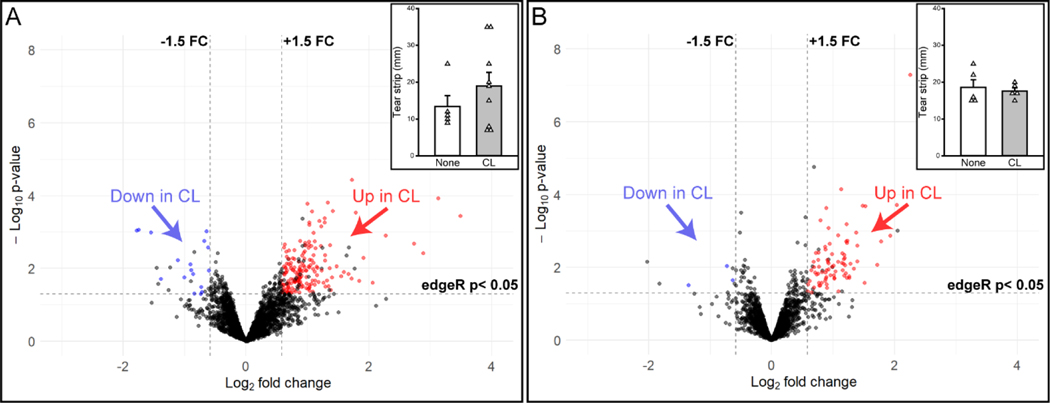
To compare differences in tear proteins with CL use, samples from soft CL users at both geographic sites were compared to participants who did not use CL. In our first analysis (CL Experiment 1), 3156 proteins were detected and 183 (5.8%) met our criteria for differential abundance in CL users (n = 9) compared to individuals who do not use CLs (n = 5; Figure 7A). However, individuals in the CL group had a wide range of Schirmer wetted lengths (range 7 – 35 mm), while most individuals in the non-CL group had a smaller range of Schirmer wetted lengths (9 – 12 mm; with one sample at 25 mm) (Figure 7A, inset). Based on our prior study demonstrating the effect of Schirmer strip wetting on the tear proteome (Figure 5A), we conducted another analysis (CL Experiment 2) on participants that did (n = 5) or did not (n = 5) use CLs, but analyzed only samples within a restricted range of Schirmer length (15 – 22 mm). In this analysis, 2516 proteins were detected and 79 proteins (3.1%) were differentially abundant (Figure 7B). These findings suggest that Schirmer strip wetted length, in addition to CL use, contributed to the larger protein variation in the first analysis that compared participants based only on CL use (Figure 7A).
Figure 7.
Volcano plots of differentially abundant proteins with soft contact lens (CL) use for (A) individuals with a wide range of Schirmer strip wetted length or (B) individuals with more restricted Schirmer length. Both panels depict the number of proteins that increase (red) or decrease (blue) in relative abundance in CL users as compared to those participants who do not use CLs. One protein exceeded the standardized scales and was not shown in the figure (A). Insets are Schirmer strip wetted lengths from CL users (CL, gray bar) and those who do not use CLs (None, white bar) for each experiment. A complete list of differentially expressed proteins in the above comparisons can be found in Appendix Tables A.6 and A.7. Insets: Mean tear strip lengths ± SEM. White triangles represent individual sample values within each group.
The two CL experiments (Figure 7), revealed 23 proteins that were differentially abundant according to our criteria in both experiments. Most of these proteins (n = 22) were upregulated with CL use (Table 2), but one protein (Cystatin-SA) showed changes in direction, i.e., upregulated versus downregulated, and different magnitudes of fold change across the two experiments. Most of the proteins that were altered in abundance in both experiments are involved in immune pathways or keratinization and cell-cell adhesion based on Gene Ontology (GO) term analyses. These studies suggest that there is consistency in the proteins that differ by CL use/non-use.
Table 2.
Differentially abundant proteins across contact lens (CL) experiments
| Protein | Gene name | Fold changes in CL users |
|
|---|---|---|---|
| CL Expt 1 | CL Expt 2 | ||
|
| |||
| Beta-1,3-galactosyl-O-glycosyl- | |||
| glycoprotein beta-1,6-N- | GCNT | + 1.9 | + 1.6 |
| acetylglucosaminyltransferase 3 | |||
|
| |||
| Corneodesmosin | CDSN | +2.1 | + 1.9 |
|
| |||
| Cystatin-SA | CST2 | + 11.3 | -2.6 |
|
| |||
| Desmocollin-1 | DSC1 | +2.1 | + 1.9 |
|
| |||
| Desmoglein-1 | DSG1 | +2.0 | + 1.7 |
|
| |||
| Desmoplakin | DSP | +2.2 | +1.6 |
|
| |||
| Loricrin | LRN | +2.0 | +2.4 |
|
| |||
| Mesothelin, cleaved form | MSLN | +1.9 | + 1.7 |
|
| |||
| Polymeric immunoglobulin receptor | PIGR | +1.8 | +2.3 |
|
| |||
| Immunoglobulins, 14 | See below * | +1.6 to +2.5 | + 1.8 to +2.9 |
Differential abundance was determined using the uncorrected edgeR p values in these CL analyses. CL Experiment 1 included a wide range of Schirmer strip wetted length, while CL Experiment 2 included samples from a restricted range of Schirmer strip wetted length. Bolded gene names represent proteins that were also elevated in a larger CL comparison with restricted Schirmer strip wetted length using IRS normalization (described below).
14 specific Immunoglobulins were more abundant with CL use: IGHA1, IGHV3–11, IGHV3–49, IGHV3–53, IGHV3–7, IGHV3–74, IGHV4–28, IGHV5–51, IGHV6–1, IGKV1–27, IGKV3–11, IGLV1–44, IGLV3–19, IGLL5
3.7. Combination of multiple TMT experiments to increase sample size for CL use comparison
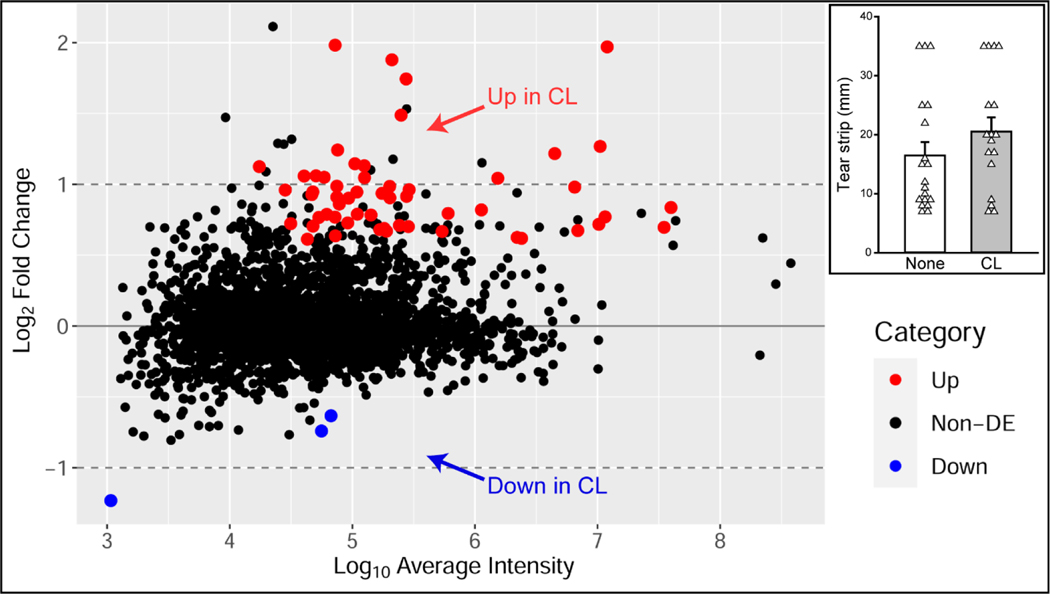
The use of samples from the same common tear pool on each TMT run allowed us to combine 3 smaller experiments and use IRS normalization (Methods 2.6.3.) to increase sample sizes in the CL and no CL groups. Two samples were used on two different TMT runs for CL analyses but were only included once in the IRS analysis. In two cases, samples from left and right eyes of the same individual were included in two separate TMT runs, which could potentially reduce variability between TMT runs. Schirmer tear strip wetted length was balanced between the two groups (Figure 8, inset). Data from 17 samples from 14 CL users and 19 samples from 16 non-users were compared and differentially expressed proteins were determined. This analysis revealed that of 2596 proteins detected, 58 proteins (2.2%) were differentially abundant between the CL users and non-users (Figure 8). Fifty-five proteins had a higher relative abundance (Up, red dots, Figure 8) and 3 proteins had a lower relative abundance (Down, blue dots, Figure 8) in CL users as compared to non-users. Of these total 58 proteins, there were 12 proteins that were in common with the differential proteins found in the small CL studies (Table 2, bolded).
Figure 8.
Visual representation of the 2596 total proteins detected in the combined contact lens (CL) analysis of differentially abundant proteins in CL users as compared to CL non-users. Proteins that met criteria for differential abundance are color-coded by those that had increased (red) and decreased (blue) abundance in CL users. Proteins that were not differentially expressed (Non-DE) between the two groups are shown in black. Inset: Schirmer tear strip wetted lengths are balanced between the CL group (CL, gray bar) and non-user group (None, white bar) with a wide variation in strip lengths. Inset: Bars indicate mean strip lengths ± SEM. White triangles represent individual sample values within each group.
4. DISCUSSION
Obtaining quantitative, reproducible, and clinically relevant data on the human tear proteome demands careful consideration of experimental design, methodology, and data analytical methods. We have demonstrated consistent results using TMT analysis of tear proteins from individual participants, thus increasing opportunities for protein biomarker discovery based on individual tear samples and participant characteristics. We found minimal within-person variability using these methods in healthy individuals when comparing tears from left and right eyes collected on the same day. We also detected changes in tear proteins with soft CL use. Other factors that contributed most extensively to changes in the tear proteome were geographic site and tear volume as assessed by Schirmer tear strip wetted length (Figure 9).
Figure 9.
Various factors may influence an individual’s tear proteome and should be taken into consideration when designing and conducting tear proteomic studies. Geographic site and soft contact lens use contributed modestly to changes in the tear proteome, while tear volume (Schirmer tear strip wetted length) contributed most significantly to changes in the tear proteome in our experiments. Created with BioRender.com
4.1. Numbers of detected proteins and percentage of differential candidates differ across experiments
4.1.1. Greater tear volume correlates with more differential protein expression
Similar to the findings in this study, previous studies have demonstrated correlations between total protein content and increased Schirmer tear strip wetted lengths.[24, 25] The increasing number of abundant proteins with higher tear volume potentially confounds analyses of differential abundance with comparison of other covariates. To test the influence of tear sample volume (as measured by wetted tear strip length) on the analytical method, we generated a pooled tear sample and pipetted it onto tear strips up to predetermined lengths. In this pooled sample study, there were far fewer differential candidates (Table 3, 2.1%) than the number of candidates detected when comparing short versus long wetted strips from individual participants (Table 3,14.6%). Since there were more differential candidates when comparing individual subjects with different Schirmer tear strip wetted lengths, this appears to be a real biological difference that is not due to methodological differences when analyzing short versus long strips. There is controversy surrounding whether Schirmer strip collection under topical anesthesia measures basal tearing, reflex tearing caused by irritative contact with the ocular surface, or a mixture of both.[26] While the significance of specific proteins that are elevated in individuals with long wetted strips is unknown, this knowledge should inform future study design and data interpretation.
Table 3.
Total proteins meeting differential abundance criteria in each experiment
| Experiment description | Total proteins detected | Proteins meeting criteria |
|
|---|---|---|---|
| Number | % of total | ||
|
| |||
| Within-run replicate samples | 3057 | 19 | 0.6 % |
|
| |||
| Within-subject left vs right eye | 1987 | 1 | 0.05 % |
|
| |||
| Natural Long vs Short Schirmer | 2901 | 424 | 14.6 % |
|
| |||
| Pipetted Long vs Short Schirmer | 1536 | 33 | 2.1 % |
|
| |||
| Geographic site comparison | 3498 | 129 | 3.7 % |
|
| |||
| CL experiment 1 | 3156 | 183 | 5.8 % |
|
| |||
| CL experiment 2 | 2516 | 79 | 3.1 % |
Criteria for all studies included 3 peptide spectral matches (PSMs), an uncorrected edgeR p value of < 0.05, and a fold change of at least ± 1.5
4.1.2. The number of detected proteins varies between different TMT experiments
The total number of detected proteins varied in individual experiments between 1536 and 3498 (Table 3), while proteins that were not detected in the experiments yielding lower protein numbers may likely reflect relatively low abundance. While some of this variation in abundance may be due to changes in instrument sensitivity between runs, an additional contribution could be due to the composition of tears analyzed within each TMT experiment. Proteins are detected from the MS2 spectra assigned to individual proteins within each TMT experiment, and each MS2 spectrum is generated from a composite of all multiplexed tear digests within in each experiment. If some multiplexed samples contain a greater proportion of highly abundant tear proteins than others, this could suppress the detection of less abundant tear proteins within that run. Thus, the numbers of proteins detected in some experiments may have had fewer detected proteins overall, emphasizing the value of balancing biological factors within each instrument run.
4.2. Geographic site influences the tear proteome
Our results illustrate differences between the tear proteomes of individuals in Miami, FL and those in Portland, OR. This is consistent with the finding that climate, allergens, and other regional factors can influence symptoms, tearing, and ocular surface proteins.[27] These findings emphasize the importance of documenting all information available regarding sample collection, including environment, to allow analysis of all factors that may influence the outcome of human clinical studies.
4.3. CL use alters the tear proteome
Most proteins differentially expressed in CL users that we identified belong to the immunoglobulin family and proteins related to cell adhesion. Previous studies, though varying in magnitude and directionality of changes, support these findings. For example, CL use alters structural and functional aspects of the ocular surface.[28] Thus, understanding alterations in the tear proteome of CL users may inform the study of CL wear-related complications including microbial keratitis, dry eye disease, and chronic discomfort.[29, 30] Several proteins were consistently altered in CL users across the studies presented here, showing that with rigorous methods, a small number of samples can provide insights into factors that may influence individual tear proteomes.
4.4. Limitations and technical considerations
One limitation of protein studies on tear samples collected from Schirmer strips is the efficiency of extracting and digesting proteins off of the strips. While not shown in this study, we tested different protocols and identified S-Trap digestion as the method that gave the highest peptide yield following digestion. Our methods included the strong protein solubilizing detergent SDS and avoided solid phase extraction steps that can lower peptide yields. While it is still possible that that recovery of different proteins will vary using SDS, this should not impact the results if the proportional loss of proteins is consistent across strips. However, it is possible that the protocol was unable to elute all proteins on the strips.
For quantitative comparisons, one distinct feature of the TMT method is that quantitative results are obtained for each protein across every sample in a multiplexed run. This means there is no ‘missing’ data for identified proteins within each TMT run. Furthermore, due to the extensive data collection afforded by the two-dimensional liquid chromatography separation, the number of missing proteins across TMT runs was minimized.
5. CONCLUSIONS
We present a method for the analysis of human tear proteins using standard clinical protocols and a reproducible workflow for sample collection and proteomic analysis. We found factors that altered the tear proteome between individuals that were expected (geographic site, soft CL use) and unexpected (Schirmer wetted length). Effect sizes (fold changes) observed in these studies were relatively modest which may be due to small sample sizes and/or the fact that tears from healthy individuals were examined. These studies support the need to consider a range of factors in addition to the biological or clinical feature of interest when performing tear protein studies. In addition, biostatical methods will be required to differentiate these factors from other patient characteristics in clinical biomarker discovery studies.
Supplementary Material
Table A.1 Differentially expressed proteins between the half-strip replicates (first half and second half) – see Figure 3A
Table A.2 Differentially expressed proteins between left eye and right eye (reference) – see Figure 3B
Table A.3 Differentially expressed proteins between long schirmer strip and short schirmer strip (reference) – see Figure 5A
Table A.4 Differentially expressed proteins between pipetted long schirmer strip and short schirmer strip (reference) – see Figure 5B
Table A.5 Differentially expressed proteins between Portland site and Miami site (reference) – see Figure 6
Table A.6 Differentially expressed proteins between contact lens user and non-user (reference) with a wide range of Schirmer strip wetted length – see Figure 7A
Table A.7 Differentially expressed proteins between contact lens user and non-user (reference) with restricted Schirmer strip length – see Figure 7B
Acknowledgements
The authors would like to thank Ashok P. Reddy, Keith Zientek, John E. Klimek and Joanne O’Day for their support of this project. We are also grateful for the ongoing support from the National Eye Institute program staff.
Funding/Support:
Supported by the National Eye Institute R61EY032468 (Drs. Aicher and Galor) and P30EY010572 and S10OD012246.
Footnotes
Conflict of Interest Disclosures
The authors report no conflicts of interest.
APPENDIX
A total of 7 separate lists of differentially expressed proteins that met our criteria of at least 3 PSMs, an uncorrected edgeR p-value of < 0.05, and a fold change of + 1.5, are attached below for each volcano plot figure. Summary statistics are also provided for each protein.
Click on the bullet triangle points to expand each table.
Publisher's Disclaimer: This is a PDF file of an unedited manuscript that has been accepted for publication. As a service to our customers we are providing this early version of the manuscript. The manuscript will undergo copyediting, typesetting, and review of the resulting proof before it is published in its final form. Please note that during the production process errors may be discovered which could affect the content, and all legal disclaimers that apply to the journal pertain.
REFERENCES
- 1.Dartt DA and Willcox MD, Complexity of the tear film: importance in homeostasis and dysfunction during disease. Exp Eye Res, 2013. 117: p. 1–3. [DOI] [PMC free article] [PubMed] [Google Scholar]
- 2.Dor M, et al. , Investigation of the global protein content from healthy human tears. Exp Eye Res, 2019. 179: p. 64–74. [DOI] [PubMed] [Google Scholar]
- 3.Kenny A, et al. , Proteins and microRNAs are differentially expressed in tear fluid from patients with Alzheimer’s disease. Sci Rep, 2019. 9(1): p. 15437. [DOI] [PMC free article] [PubMed] [Google Scholar]
- 4.Willcox MD, Tear film, contact lenses and tear biomarkers. Clin Exp Optom, 2019. 102(4): p. 350–363. [DOI] [PubMed] [Google Scholar]
- 5.Benitez-Del-Castillo JM, et al. , Quantification of a panel for dry-eye protein biomarkers in tears: A comparative pilot study using standard ELISA and customized microarrays. Mol Vis, 2021. 27: p. 243–261. [PMC free article] [PubMed] [Google Scholar]
- 6.Di Zazzo A, et al. , Tears and ocular surface disorders: Usefulness of biomarkers. J Cell Physiol, 2019. 234(7): p. 9982–9993. [DOI] [PubMed] [Google Scholar]
- 7.Perumal N, et al. , Proteomics analysis of human tears from aqueous-deficient and evaporative dry eye patients. Sci Rep, 2016. 6: p. 29629. [DOI] [PMC free article] [PubMed] [Google Scholar]
- 8.Jones G, et al. , Comparison of Different Mass Spectrometry Workflows for the Proteomic Analysis of Tear Fluid. Int J Mol Sci, 2022. 23(4). [DOI] [PMC free article] [PubMed] [Google Scholar]
- 9.Chalmers RL., Begley CG, and Caffery B, Validation of the 5-Item Dry Eye Questionnaire (DEQ-5): Discrimination across self-assessed severity and aqueous tear deficient dry eye diagnoses. Cont Lens Anterior Eye, 2010. 33(2): p. 55–60. [DOI] [PubMed] [Google Scholar]
- 10.Schiffman RM, et al. , Reliability and validity of the Ocular Surface Disease Index. Arch Ophthalmol, 2000. 118(5): p. 615–21. [DOI] [PubMed] [Google Scholar]
- 11.Saleh TA, et al. , Phenol red thread test vs Schirmer’s test: a comparative study. Eye (Lond), 2006. 20(8): p. 913–5. [DOI] [PubMed] [Google Scholar]
- 12.Bachhuber F, et al. , Diagnostic biomarkers in tear fluid: from sampling to preanalytical processing. Sci Rep, 2021. 11(1): p. 10064. [DOI] [PMC free article] [PubMed] [Google Scholar]
- 13.Cao Z, et al. , Proteomic profiling of concurrently isolated primary microvascular endothelial cells, pericytes, and vascular smooth muscle cells from adult mouse heart. Sci Rep, 2022. 12(1): p. 8835. [DOI] [PMC free article] [PubMed] [Google Scholar]
- 14.Zougman A, Selby PJ, and Banks RE, Suspension trapping (STrap) sample preparation method for bottom-up proteomics analysis. Proteomics, 2014. 14(9): p. 1006–0. [DOI] [PubMed] [Google Scholar]
- 15.Tassi Yunga S, et al. , Effects of ex vivo blood anticoagulation and preanalytical processing time on the proteome content of platelets. J Thromb Haemost, 2022. 20(6): p. 1437–1450. [DOI] [PMC free article] [PubMed] [Google Scholar]
- 16.Plubell DL, et al. , Extended Multiplexing of Tandem Mass Tags (TMT) Labeling Reveals Age and High Fat Diet Specific Proteome Changes in Mouse Epididymal Adipose Tissue. Mol Cell Proteomics, 2017. 16(5): p. 873–890. [DOI] [PMC free article] [PubMed] [Google Scholar]
- 17.Ting L, et al. , MS3 eliminates ratio distortion in isobaric multiplexed quantitative proteomics. Nat Methods, 2011. 8(11): p. 937–40. [DOI] [PMC free article] [PubMed] [Google Scholar]
- 18.Eng JK, Jahan TA, and Hoopmann MR, Comet: an open-source MS/MS sequence database search tool. Proteomics, 2013. 13(1): p. 22–4. [DOI] [PubMed] [Google Scholar]
- 19.Wilmarth PA, Riviere MA, and David LL, Techniques for accurate protein identification in shotgun proteomic studies of human, mouse, bovine, and chicken lenses. J Ocul Biol Dis Infor, 2009. 2(4): p. 223–234. [DOI] [PMC free article] [PubMed] [Google Scholar]
- 20.Robinson MD and Oshlack A, A scaling normalization method for differential expression analysis of RNA-seq data. Genome Biol, 2010. 11(3): p. R25. [DOI] [PMC free article] [PubMed] [Google Scholar]
- 21.Robinson MD, McCarthy DJ, and Smyth GK, edgeR: a Bioconductor package for differential expression analysis of digital gene expression data. Bioinformatics, 2010. 26(1): p. 139–40. [DOI] [PMC free article] [PubMed] [Google Scholar]
- 22.Bilic P, et al. , Serum and urine profiling by high-throughput TMT-based proteomics for the investigation of renal dysfunction in canine babesiosis. J Proteomics, 2023. 270: p. 104735. [DOI] [PubMed] [Google Scholar]
- 23.Zhou G, et al. , TMT-based quantitative proteomics analysis and potential serum protein biomarkers for systemic lupus erythematosus. Clin Chim Acta, 2022. 534: p. 43–49. [DOI] [PubMed] [Google Scholar]
- 24.Yu V, et al. , Clusterin from human clinical tear samples: Positive correlation between tear concentration and Schirmer strip test results. Ocul Surf, 2018. 16(4): p. 478–486. [DOI] [PMC free article] [PubMed] [Google Scholar]
- 25.Bertram M, et al. , Influence of Schirmer strip wetness on volume absorbed, volume recovered, and total protein content in canine tears. Vet Ophthalmol, 2021. 24(4): p. 425–428. [DOI] [PubMed] [Google Scholar]
- 26.Senchyna M and Wax MB, Quantitative assessment of tear production: A review of methods and utility in dry eye drug discovery. J Ocul Biol Dis Infor, 2008. 1(1): p. 1–6. [DOI] [PMC free article] [PubMed] [Google Scholar]
- 27.Tomazic PV, et al. , Comparison of tear proteome in allergic rhinoconjunctivitis patients and controls with respect to pollen season. Allergy, 2018. 73(7): p. 1541–1543. [DOI] [PMC free article] [PubMed] [Google Scholar]
- 28.Boost M, Cho P, and Wang Z, Disturbing the balance: effect of contact lens use on the ocular proteome and microbiome. Clin Exp Optom, 2017. 100(5): p. 459–472. [DOI] [PubMed] [Google Scholar]
- 29.Kramann C, et al. , Effect of contact lenses on the protein composition in tear film: a ProteinChip study. Graefes Arch Clin Exp Ophthalmol, 2011. 249(2): p. 233–43. [DOI] [PubMed] [Google Scholar]
- 30.Manicam C., et al., Proteomics Unravels the Regulatory Mechanisms in Human Tears Following Acute Renouncement of Contact Lens Use: A Comparison between Hard and Soft Lenses. Sci Rep, 2018. 8(1): p. 11526. [DOI] [PMC free article] [PubMed] [Google Scholar]
Associated Data
This section collects any data citations, data availability statements, or supplementary materials included in this article.
Supplementary Materials
Table A.1 Differentially expressed proteins between the half-strip replicates (first half and second half) – see Figure 3A
Table A.2 Differentially expressed proteins between left eye and right eye (reference) – see Figure 3B
Table A.3 Differentially expressed proteins between long schirmer strip and short schirmer strip (reference) – see Figure 5A
Table A.4 Differentially expressed proteins between pipetted long schirmer strip and short schirmer strip (reference) – see Figure 5B
Table A.5 Differentially expressed proteins between Portland site and Miami site (reference) – see Figure 6
Table A.6 Differentially expressed proteins between contact lens user and non-user (reference) with a wide range of Schirmer strip wetted length – see Figure 7A
Table A.7 Differentially expressed proteins between contact lens user and non-user (reference) with restricted Schirmer strip length – see Figure 7B


