

Abstract
Lipin-1 is a protein that plays a critical role in many cellular functions. At molecular level, it acts as a phosphatidic acid phosphohydrolase and a transcriptional coactivator. The functions of lipin-1 are largely dependent upon its subcellular localization, post-translational modifications like phosphorylation and acetylation, and also on its interaction with other proteins such as 14-3-3. However, the kinases and phosphatases that are responsible for these post translational modifications are not entirely known. Using bioinformatics and other biochemical approaches, we demonstrate lipin-1 as a novel target for AKT1 and LKB1. While AKT1 stabilizes lipin-1, LKB1 causes its degradation. Interestingly, our findings further show that lipin-1 enhances AKT1 activity as can be seen by increased phosphorylation of the substrates of AKT1. Taken together, our results suggest that lipin-1 plays an important role in the regulation of PI3K-AKT-mTOR pathway, which is dysregulated in majority of cancers. Therefore, understating the role of lipin-1 may provide new and important insights into the regulation and functions of the PI3K-mTOR pathway, which is one of the major targets for anti-cancer drug development strategies.
Supplementary Information
The online version contains supplementary material available at 10.1007/s12079-022-00708-9.
Keywords: Lipin1, AKT, LKB1, PI3 kinase pathway, Adipocyte differentiation
Introduction
A mutation responsible for fatty liver dystrophy (fld) in mice was discovered by Langner et al. in 1989 and the gene carrying the mutation was identified later in 2001 by Péterfy et al., and was named LPIN1 (Langner et al. 1989). Lipins are a family of proteins that consist of three members in mammals: Lipin-1, Lipin-2 and Lipin-3. Lipin-2 and lipin-3 have amino acid sequence similarity of 48% and 44% with lipin-1 respectively (Péterfy et al. 2001). The lpin1 gene undergoes alternative mRNA splicing to give rise to three isoforms: lipin-1α, lipin-1β and lipin-1γ (Han and Carman 2010; Phan and Reue 2005). In humans, the length of lipin-1α isoform is 890 amino acids and an additional in frame exon of 33 amino acids gives rise to β isoform. The γ isoform is formed by a different in-frame exon of 26 amino acids (Han and Carman 2010).
Lipin-1 is a multifunctional protein that has been shown to play diverse role in many cellular processes like lipid metabolism, metabolic homeostasis, peripheral nerve function, nuclear envelope cytology, autophagy and inflammation. Lipin-1 also plays an important role in lipid synthesis as it acts as a Mg2+ dependent phosphatidic acid phosphatase (PAP) enzyme that removes a phosphate from phosphatidic acid (PA) to produce diacylglycerol (DAG) (Han et al. 2006). DAG is a precursor for other lipid moieties that are major membrane phospholipids (e.g. phosphatidyl choline and phosphatidyl ethanolamine) and also triacylglycerol, a major storage lipid (Reue and Brindley 2008). Lipin-1 also causes fatty acid oxidation by acting as transcriptional co-activator and associating with factors like peroxisome proliferator-activated receptor α (PPARα) and PPARγ coactivator-1α (PGC-1α). These factors are responsible for the induction of genes that cause fatty acid oxidation (Finck et al. 2006).
Regulation of lipin-1 occurs at multiple levels within the cell, which includes regulation by gene transcription, alternative mRNA splicing, subcellular localization and post-translational modifications like phosphorylation, sumoylation, acetylation, and ubiquitination (Huffman et al. 2002; Ishimoto et al. 2017; Li et al. 2018; Liu and Gerace 2009; Shimizu et al. 2017). These modifications regulate the subcellular localization of lipin, which in turn controls its activity. Tip60 (HIV-1 Tat-interacting protein) acetylates lipin-1 and facilitates its translocation to endoplasmic reticulum membranes for DAG generation and TAG synthesis. It is deacetylated by a class III histone deacetylase, Sirt1 (sirtuin 1) (Li et al. 2018). The polyubiquitination and subsequent degradation of lipin-1 is mediated by interaction with E3 ubiquitin ligases, β-TRCP or FBXW11 (Shimizu et al. 2017). Similarly, sumoylation of lipin-1 promotes its nuclear localization and is required for its transcriptional coactivator activity toward PGC-1 and MEF2 in neuronal cells (Liu and Gerace 2009).
Phosphorylation is one of the most important modifications that occur on lipin-1. Dephosphorylated form of lipin-1 localizes to membranes and nucleus. It is catalytically active when localized to the membranes (Bahmanyar et al. 2014; Han et al. 2006, 2012; Kim et al. 2007). The phosphorylated form is primarily present in cytosol as phosphorylation of lipin releases the enzyme from intracellular membranes (Harris et al. 2007). While it is reported to be phosphorylated by kinases like CDKI, mTORC1, CKIε and CKII (Grimsey et al. 2008; Peterson et al. 2011; Shimizu et al. 2017, Hennessy et al. 2019), it is known to be dephosphorylated by the phosphatases CTDNEP1 and PGAM5 (Han et al. 2012; Kim et al. 2007, Okuno et al. 2019). Even though many phosphorylation sites on lipin-1 have been recognized, most of the proteins that regulate lipin-1 are yet to be identified. In the present study, we identified some of the novel regulators of lipin-1. Our study demonstrates that lipin-1 is phosphorylated and stabilized by AKT1. Interestingly, we show that lipin-1 also reciprocally regulates AKT1 by increasing its activity. We further report that LKB1 regulates lipin-1 by degrading it. Both the stabilization as well as degradation of lipin-1 by theses kinases affects its downstream functions such as adipocyte differentiation. In summary, we report the regulation of lipin-1 in contrasting ways by AKT1 and LKB1, with an impact on lipid metabolism within the cell.
Materials and methods
Reagents and antibodies
The primary antibodies like anti-lipin-1 (#14,906; 1:1000 dilution), anti-GAPDH (#2118; 1:10,000 dilution), anti-β-Actin (#3700; 1:10,000 dilution), anti-AKT1 (#2920; 1:1000 dilution), anti-phospho-Akt (ser473) (#4060; 1:1000 dilution), anti-phospho-Akt (thr308) (#13,038; 1:1000 dilution), anti-phospho-Akt substrate (#9614; 1:1000 dilution), p-FoxO1/FOXO3a/FOXO4 (#2599S; 1:1000 dilution) and anti-phospho-AMPK (#2535; CST; 1:1000 dilution) were purchased from Cell Signaling Technology, USA. Anti-FLAG (#F3165; 1:5000 dilution) and anti-HA antibodies (#26,183; 1:5000 dilution) were purchased from Sigma-Aldrich. Anti-lipin-1 (# PA5-28,704; 1;1000 dilution) and anti-alpha tubulin (#A21371; 1;5000 dilution) antibodies were purchased from Thermo Fisher Scientific. Secondary antibodies like horseradish peroxidase [HRP]-conjugated and DyLight 680 Conjugate (#5470S; 1:10,000 dilution) and DyLight 800 4X PEG Conjugate (#5151S; 1:10,000 dilution), for imaging on ChemiDoc MP Imaging System, BioRad and Li-Cor Odyssey-CLx imaging system respectively, were purchased from Cell Signaling Technology, USA. The reagents like polyethyleneimine (PEI), cycloheximide, doxycycline, polybrene and protease and phosphatase inhibitors (Complete, Roche) were obtained from Sigma-Aldrich. Inhibitors like okadaic acid, LY294002 and bortezomib were purchased from Calbiochem/EMD Biosciences. The reagents for cell culture like Dulbecco’s modified Eagle’s medium (DMEM), Roswell Park Memorial Institute Medium 1640 (RPMI), fetal bovine serum (FBS), penicillin–streptomycin, G418, puromycin, blasticidin and trypsin were obtained from Invitrogen/Life Technologies. The reagents for cloning like Q5 high-fidelity DNA polymerase, deoxynucleoside triphosphates (dNTPs), T4 DNA ligase and all restriction enzymes were purchased from New England Biolabs, USA.
Plasmids
The plasmid construct pLKO-puro-FLAG-lipin1 (#32,010) (Peterson et al. 2011), with FLAG tagged Lipin-1a gene was obtained from Addgene, USA. FLAG-Lipin-1a was sub-cloned in the transient vector pcDNA3.1(-) and stable vector pWZL-Blast. The other plasmids used in the study are pCDNA3.1 HA-AKT1, the AKT1 kinase-dead construct pCDNA3-T7-HA-AKT1-K179M-T308A-S473A, pBABE-puro-HA-PIK3CA (H1047R), pBABE-neo-HA-AKT1, pcDNA-FLAG-LKB1, pBABE-puro-FLAG-LKB1. These plasmids were also obtained from Addgene, USA.
Cell culture
HEK 293T, HeLa and U2OS cells were kindly provided as gift items by Thomas M. Roberts, DFCI, USA. PC-3, LnCAP and 3T3-L1 cells were purchased from National Centre for Cell Science (NCCS), India. PC-3 and LnCAP cells were grown in RPMI while HEK 293T, HeLa, U2OS and 3T3L1 cells were grown in DMEM. 10% fetal bovine serum (FBS) and 1% antibiotics (penicillin and streptomycin) were added to the media before use. The cells were grown and maintained at 37 °C and 5% CO2.
Transient transfections
Cells were split one day prior to transfection and grown to about 50% confluence. PEI (1 mg/ml stock) was used to transfect HEK 293T cells. Plasmid DNA was mixed with 400 ll of DMEM and then PEI (3 μl/μg DNA) was added dropwise to this mixture and incubated at room temperature for approximately 15 mins. This mixture was added to culture plates. After 48 h, the cells were harvested by incubating the cell pellets in lysis buffer (0.1% NP-40, 50 mM Tris–Cl, 150 mM NaCl, 1 mM EDTA and 25 mM NaF, containing protease and phosphatase inhibitors) on ice for 30 mins. Samples were boiled in 5 × sample buffer (0.5 M Tris–Cl [pH 6.8], 1.25 g SDS, 10% glycerol, 0.0025 g bromophenol blue) at 100°C for 5 mins.
Viral transductions
For making stable cell lines using retroviral/lentiviral transductions, the following procedure was used. Phoenix and FT packaging cells for retro- and lentiviral infections, respectively were grown to 80% confluence in 6 cm culture dishes. For retroviral transductions, 3 μg of retroviral expression plasmid was mixed 1 μg each of viral packaging plasmids, Gag-Pol and VSVG in DMEM. For lentiviral transductions, 2.5 μg lentiviral expression plasmid was mixed with lentiviral packaging plasmids ΔR (2.25 μg) and VSVG (0.25 μg) in DMEM. The medium was changed on the second day of transfections and viral titres were collected at 48 h and 72 h. This viral titres were incubated with the target host cells in presence of 8 μg/ml polybrene for 4–6 h on consecutive days. Cells were grown for a day after infections and were later selected in the presence of appropriate selection drugs like puromycin (5 μg/ml) and blasticidin (5 μg/ml) for 5 to 7 days.
Western blotting
Total proteins amounts were quantified by Bradford assay and equal amounts were loaded and run on the SDS-PAGE gel, followed by transferring them onto the nitrocellulose membrane. The membrane was then blocked for one hour using 5% non-fat dry milk. The blots were then incubated with the required primary antibodies overnight at 4°C. Next day, the blots were washed thrice with TBS-T (13.7 mM NaCl, 20 mM Tris (pH 7.4), and 0.05% Tween 20), 10 mins each and then incubated with the secondary antibodies for one hour. The blots were again washed thrice with 1X TBS-T. The blots were finally imaged by either infrared detection system using a Li-Cor Odyssey-CLx machine or by chemiluminescence using ChemiDoc MP imaging system (Biorad).
Immunoprecipitation
Primary antibody was mixed with sepharose A + G beads and incubated at room temperature for one hour on a rotator. The beads were then washed three times with phosphate buffered saline (PBS; composition: 137 mM NaCl, 2.7 mM KCl, 10 mM Na2HPO4, 1.8 mM KH2PO4). Equal amounts of protein as quantified by Bradford assay were mixed with the beads and incubated at 4°C overnight on rotator. Next day, the beads were washed three times with PBS. Finally, 2X sample buffer was added to the beads, and the mixtures were boiled at 100°C for 3 to 5 mins. The samples were then subjected to Western blotting.
Cycloheximide chase assay
HEK 293T cells were transfected with the required plasmids and after about 40 h of transfection, cycloheximide was added at a concentration of 25 μg/ml for different time periods: 2, 4, 6, and 8 h. The cells were then harvested and lysed. The lysates were then subjected to Western blotting as described above.
Adipocyte differentiation and Oil red O staining
3T3-L1 preadipocytes were grown in Dulbecco’s modified Eagle’s medium (DMEM) supplemented with 10% fetal bovine serum. For the induction of differentiation, the cells were grown to confluence for two days. Cells were then treated with induction medium i.e. DMEM containing 10% fetal bovine serum, 167 nM insulin, 0.5 mM 3-isobutyl-1-methylzanthine and 1 mM dexamethasone, for two days. Fresh medium containing 167 nM insulin was then added for the next two days. The medium was then changed after every alternate day until 8 days. For Oil red O staining, the cells were fixed with 10% formaldehyde for 10 mins at room temperature. The formaldehyde was decanted and fresh 10% formaldehyde was added for 1 h. The plates were then washed with 60% isopropanol and dried. The plates were next stained overnight with Oil red O stain (3.5% Oil red O in 60% isopropanol). The plates were finally washed with water the next day, dried and then observed under microscope (10x).
Results
Lipin-1 is stabilized in presence of AKT1
As discussed above, lipin-1 is a large protein and is highly phosphorylated. Almost 44 phosphorylation sites have been detected on lipin-1 (Grimsrud et al. 2012; Harris et al. 2007; Humphrey et al. 2013; Peterson et al. 2011; Yang et al. 2015; Zanivan et al. 2008). To predict more putative phosphorylation sites, we performed bioinformatic analysis of lipin-1 using Scansite (https://scansite4.mit.edu/4.0/home). The analysis showed a list of potential candidates for lipin-1 phosphorylation (Supplemental Fig. 1A). Among them, AKT1 was one of the interesting kinases and lipin-1 has a perfect consensus sequence for AKT1 phosphorylation (RXRXXS/T). We selected AKT1/PKB for further studies as AKT1 is a well characterized kinase with diverse roles in cell signaling, including cell survival, protein translation as well as in cancer. This was also relevant since lipin-1 is a known downstream target of PI3K-AKT-mTOR pathway (Huffman et al. 2002). T564 is the potential AKT1 phosphorylation site with a very high score and strong AKT1 motif site, and is highly conserved among several mammalian species like Canis lupus (dog), Sus scrofa (pig), Homo sapiens (humans), Macaca mulatta (rhesus monkey), Mus musculus (mouse) and Rattus norvegicus (rat) (Supplemental Fig. 1B).
We next wanted to confirm whether lipin-1 is truly a bona fide substrate for AKT1. To test that, FLAG-Lipin-1a was co-transfected with a gradient of HA-AKT1 amounts. Western blotting results showed that AKT1 causes significant stabilization of lipin-1, which further increased at higher concentrations (Fig. 1 a-b). To check the effect of AKT1 on endogenous lipin-1 also, we made the stable cell line of AKT1 in U2OS background using retroviral infections. Western blotting results confirmed that endogenous lipin-1 was also stabilized in presence of AKT1 (Fig. 1c, d). To get further support for these results, the kinase dead mutant of AKT1 (AKT-KD; K179M-T308A-S473A) was also transfected with FLAG-lipin-1a. Results showed that it was unable to stabilize lipin-1a (Fig. 1e, f). Since AKT1 is known to be activated by phosphatidylinositol-3-kinase (PI3K) (Manning and Toker 2017), we next co-transfected the constitutively active mutant of PI3K, pBABE-puro-HA-PIK3CA (H1047R) (Zhao et al. 2005), with FLAG-lipin-1a in HEK 293T cells. Western blotting results showed that lipin-1a is also stabilized in presence of activated PI3K (Fig. 1g, h). In summary, all these results confirmed that lipin-1 is stabilized in presence of an activated AKT1.
Fig. 1.


Lipin-1 is stabilized presence of AKT1: a pcDNA3.1-FLAG-Lipin-1 (3 μg) was co-transfected with increasing amounts of pcDNA3.1-HA-AKT1 (0.1–1 μg) in HEK 293T cells. Lipin-1 and AKT1 were detected using anti-lipin-1 and anti-HA antibodies respectively. c Stable cell line for AKT1 was obtained using pWZL-Neo-FLAG-AKT1 in U2OS background. The cell line was confirmed using anti-AKT1 antibody. e 1 μg of kinase dead mutant of AKT1 (HA-AKT-KD) was co-transfected with 3 μg pcDNA3.1-FLAG-lipin-1a. g pcDNA3.1-FLAG-Lipin-1a (3 μg) was co-expressed with a hyperactive mutant of PI3K construct, pBABE-puro-HA-PIK3CA H1047R (2 μg). b, d, f and h Graphical representation of the fold expression of lipin-1 as depicted in panels a, c, e and g respectively. Lipin-1 levels in controls were arbitrarily taken as 1. Values indicate means ± SEMs; n = 3, where n represents the number of biological replicates
Lipin-1 is a substrate for AKT1
Next, we wanted to find out whether lipin-1 and AKT1 interact with each other directly. We chose prostate cancer PC3 cell line, as being PTEN null (−/−), they have constitutively activated PI3 kinase pathway and hence high lipin-1 expression (data not shown). We pulled down lipin-1 and the immunoprecipitates (IP) were subjected to Western blotting using anti p-AKT substrate antibody (Fig. 2a). The results indicated that lipin-1 is phosphorylated by AKT1, as depicted by the band that is detected by anti-phospho substrate AKT1 antibody. To confirm that endogenous lipin-1 is also stabilized by AKT1, HeLa, LNCaP and PC3 cells were treated with LY294002, a known PI3 kinase pathway inhibitor, for 6 hours. All these cell lines are known to have activated PI3 kinase-AKT pathway. Western blotting results showed that endogenous lipin-1 amounts were decreased by the inhibition of PI3K-AKT1 pathway. Inhibition of AKT1 was confirmed by an overall decreased AKT substrate phosphorylation levels (Fig. 2b, c). The inhibition of AKT activity was shown by the decrease in phospho-FOXO3 signal. FOXO (forkhead proteins) are well-known downstream targets of AKT1 (Supplemental Fig. 2). These results were further confirmed by overnight serum starvation of PC3 and HeLa cells, followed by a brief pulse of serum stimulation. This treatment also resulted in increased stabilization of lipin-1. Activation of AKT1 by this treatment was indicated by increased phosphorylations on AKT1 (308 and 473) and its substrates (Fig. 2d, e).
Fig. 2.

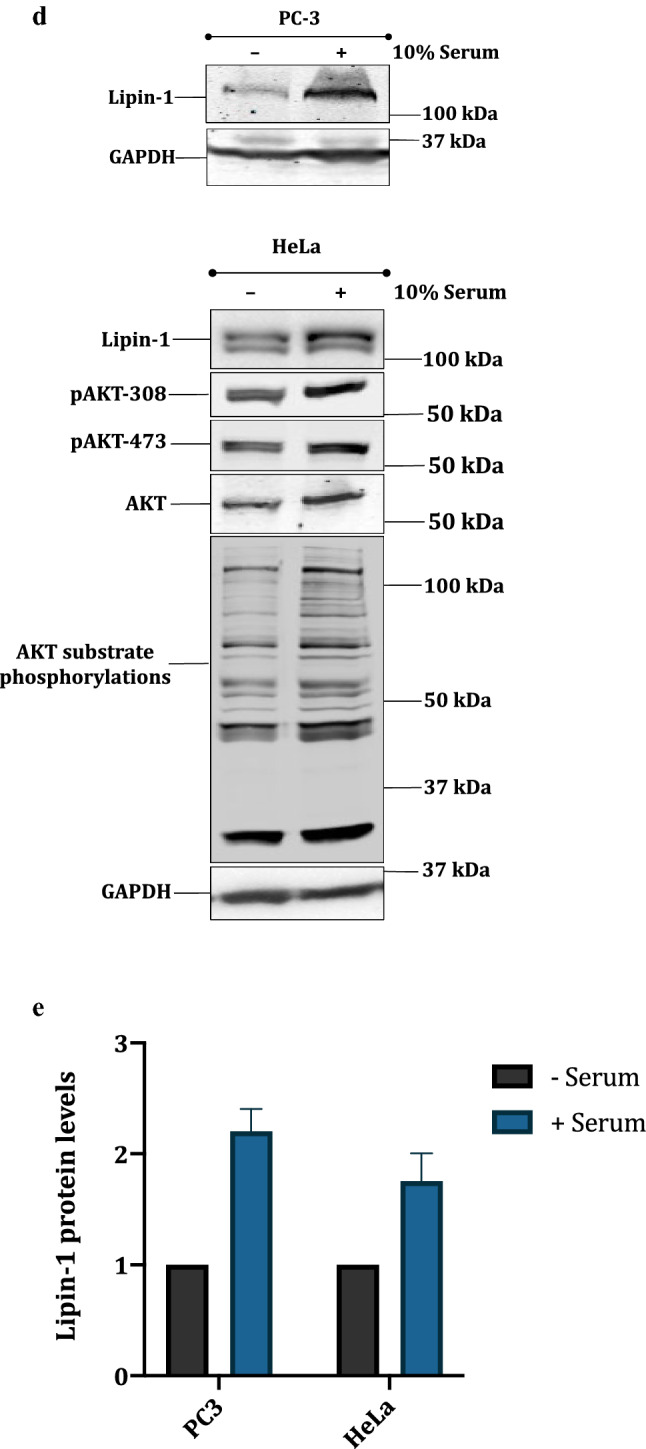

Lipin-1 is a substrate for AKT1: a Endogenous lipin-1 was pulled down using anti lipin-1 antibody in PC3 cells. The membrane was incubated with pAKT-substrate antibody. The blot was then stripped and detected with anti-lipin-1 antibody. b HeLa, PC-3 and LNCaP cells were treated with 20 μM LY294002 (PI3K pathway inhibitor) to check the effect on endogenous amounts of lipin-1. Anti phospho-AKT substrate antibody was used to detect the inhibition of AKT. d PC-3 and HeLa cells were serum starved overnight and then stimulated with 10% serum for 15 min. The effect on endogenous levels of lipin-1 was observed by using anti-lipin-1 antibody. Activation of AKT1 was confirmed by its increased phosphorylation at T308 and S473 and also by the increased phosphorylation of its substrates. c, e Graphical representation of the fold expression of lipin-1 as depicted in panels b and d respectively. Lipin-1 levels in controls were arbitrarily taken as 1. Values indicate means ± SEMs; n = 3, where n represents the number of biological replicates. f pcDNA3.1-FLAG-Lipin-1a was transfected alone or along with pcDNA3.1-HA-AKT1 constructs in HEK 293T cells. Cells were treated with 25 μg/ml cycloheximide for indicated time points. Cells were harvested, lysed and immunoblotted for lipin-1, AKT and GAPDH detection. g Quantification of lipin-1 levels in cycloheximide chase assay as shown graphically. Lipin-1 levels were normalized with GAPDH levels. The experiment was done two times
To test whether the stabilization of lipin1 by AKT1 is post-translational in nature, we performed cycloheximide chase assay. FLAG-lipin-1a was transfected alone or with HA-AKT1 in HEK 293T cells, and treated with 25 μg/ml of cycloheximide to inhibit de novo protein translation. Cells were harvested at different time points and the cell lysates were subjected to Western blotting. Results showed that AKT1 indeed increases the half- life of lipin-1 (Fig. 2f, g).
AKT1 mediated stabilization of lipin-1 promotes adipocyte differentiation
Next, we wanted to study the functional implications of AKT1 mediated lipin-1 stabilization on mammalian cells. The most well understood functions of lipin-1 is its role in in the process of adipocyte differentiation. Lipin-1 is one of the critical proteins required for induction of adipogenic transcriptional program and loss of lipin-1 results in the failure of adipocyte maturation in vitro and causes lipodystrophy in vivo. To test whether AKT mediated stabilization of lipin-1 has any effect of its adipogenic activity, we made stable cell lines of AKT1 in 3T3-L1 background (Fig. 3a). As expected, the expression of lipin-1 was higher in this cell line as compared to control. This cell line was then stimulated to differentiate into adipocytes. After 8 days of differentiation, the cells were fixed and oil red O staining was performed. Results showed that the accumulation of lipid droplets was higher in 3T3-L1-AKT1 cell line as compared to the wild type control cells (Fig. 3b, c), thus confirming the role of AKT1 in enhancing the adipocyte differentiation through lipin-1.
Fig. 3.

Lipin-1 stabilization by AKT1 promotes adipocyte differentiation. a 3T3-L1-AKT1 stable cell line was confirmed by Western blotting using anti-AKT1 antibody. b 3T3-L1 preadipocytes were induced to differentiate into adipocytes for 8 days and stained with Oil red O stain. c The degree of differentiation was measured by de-staining the plates with isopropanol and the measuring the absorbance of this eluate at 510 nm
Lipin-1 reversibly regulates AKT1
Lipin-1 is a known substrate of mTOR and is directly phosphorylated by this kinase at numerous sites, in response to insulin stimulation (Huffman et al. 2002). Our results showed that lipin-1 is also a substrate of AKT1. Since mTOR as well as lipin-1 are downstream targets of AKT1, while mTOR can also reversibly phosphorylate AKT at S473, leading to its (AKT1) activation, we wanted to check whether lipin-1 could also have any impact on AKT1 protein levels or its activation. Further, in signaling pathways, it is not unusual that substrates can affect their upstream proteins/kinases through feedback activation or inhibition. Therefore, to study the impact of activated PI3K-AKT pathway on lipin-1 functions, we made stable cell line of lipin-1 in PC3 cell line (Fig. 4a). Western blotting results showed that phosphorylations of cellular AKT1 substrates was also increased in lipin-1 overexpressing cell line. These results thus suggested that the impact of lipin-1 on AKT1 activity is reciprocal, thus leading to the activation of AKT1. To further confirm these findings, we performed lipin-1 knockdown using lipin-1 shRNA by making stable cell line in PC3 background. Consistent with the above findings, results showed that AKT substrate phosphorylations were decreased in lipin-1 knock down cells (Fig. 4a). Similar results were obtained when PC3 and HeLa cells were treated with propanolol, an inhibitor of lipins proteins (Fig. 4b, c). Western blotting results showed that AKT1 activity was reduced upon inhibition of lipin-1, as indicated by the decreased pAKT-308 and pAKT-473 phosphorylation levels. Moreover, the AKT substrate phosphorylations also decreased concomitantly upon the inhibition of lipin-1. We also performed the knockdown of lipin-1 in HeLa and U2OS cells using shRNA. Western blot analysis of protein lysates from these cell lines showed that in addition to pAKT-473 phosphorylation and AKT substrate phosphorylations, the phosphorylation of FOXO3 was also reduced. FOXO1/3a proteins are well characterized and important downstream targets of AKT1. When AKT1 is active, it phosphorylates FOXO1/3a at multiple S/T residues (Rena et al. 1999). Thus, knockdown of lipin-1 led to the decreased pFOXO3 levels. These results thus show that lipin-1 also regulates AKT1 activity. Taken together, these results suggest that AKT1 stabilizes lipin-1, which in turn leads to the activation of AKT1.
Fig. 4.


Lipin-1 is a regulator of AKT1 activity. a Lipin-1 overexpression and knockdown cell lines were made in PC3 background using retro- and lentiviral transfections, respectively. The overexpression and knockdown were confirmed by Western blotting using anti-lipin-1 antibody. The status of phosphorylations of the AKT1 substrates was determined in these cell lines using anti-phospo AKT substrate antibody. b PC3 cells were treated with the indicated concentrations of lipin inhibitor, propranolol (50 μM, 16 h). The effect of lipin inhibitor on AKT1 was determined using anti-pAKT-473 antibody and anti-phospo AKT substrate antibody. c HeLa cells were treated with the lipin inhibitor, propanolol (50 . The effect of lipin inhibitor on AKT1 was determined using anti-pAKT-473 and pAKT-308 antibodies. The activity of AKT1 was determined using anti-phospo AKT substrate antibody. d & e Lipin-1 knockdown cell lines were made in HeLa and U2OS background using lentiviral transfections. The knockdown was confirmed by Western blotting using anti-lipin-1 antibody. The status of phosphorylations of the AKT1 substrates was determined in these cell lines using anti-phospo AKT substrate antibody. The phosphorylation status of FOXO3a was determined using anti pFOXO1/3a antibody. Experiments were repeated three times
Lipin-1 degradation is mediated by LKB1
Based on the above results, we argued that the negative regulators of the PI3-AKT-mTOR pathway must have the opposite effect as that for AKT, on lipin-1 protein levels. The LKB1-AMP kinase axis negatively regulates this pathway through the phosphorylation and activation of TSC1/2 complex (Inoki et al. 2003). In addition, we have also found out that AKT1 and LKB1 regulate protein levels of some proteins (e.g DBC1/CCAR2 and PCTAIRE1/CDK16) in contrasting ways (Gillani et al. 2022; Sarwar et al. 2022). We therefore tested the effect of LKB1 on lipin-1 protein levels. We also included AMPK in this experiment as it is the most well studied downstream target of LKB1. LKB1 often exerts its effect on its downstream targets through the phosphorylation AMP kinase at T172, which leads to its activation (Hawley et al. 2003). Therefore, we transfected FLAG-Lipin-1a with HA-AMPK or FLAG-LKB1 (Liver kinase B1) in HEK 293T cells. Interestingly, Western blotting results showed that while LKB1 caused substantial degradation of lipin-1, AMP kinase had no effect (Fig. 5a, b). We then tested the impact of several AMPK agonists like AICAR, 2-deoxyglucose (2-DG) and metformin on lipin-1 protein levels in HeLa cells. These agonists activate AMPK but not LKB1. Consistent with the earlier data, our results showed that AMPK activation had hardly any impact on lipin-1 protein levels (Fig. 5c).
Fig. 5.

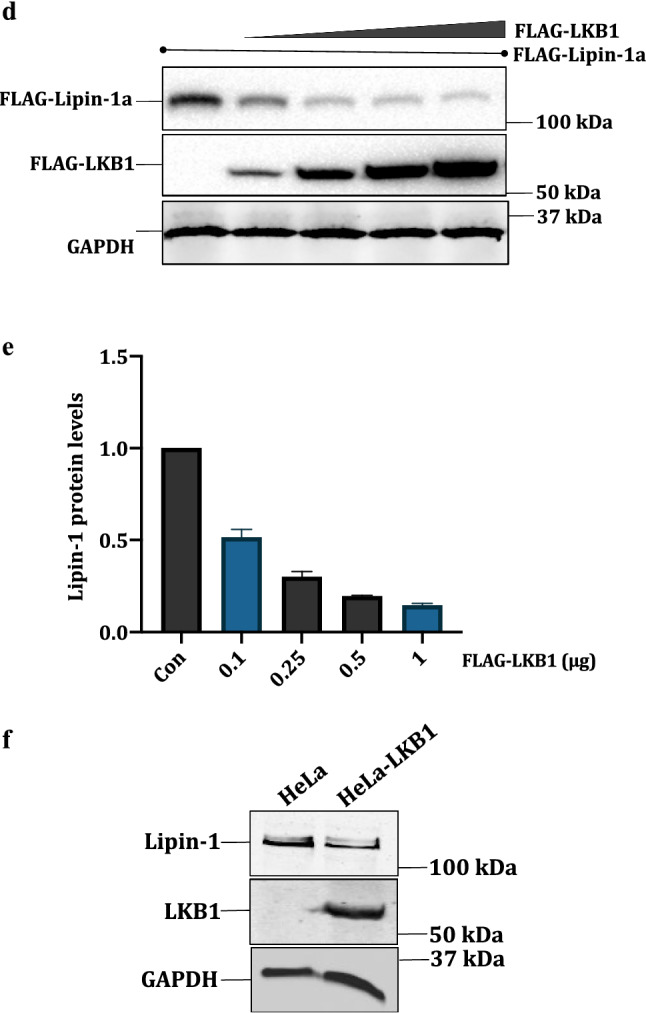
LKB1 is a regulator of lipin-1: a pcDNA3.1-FLAG-Lipin-1 (3 μg) was transfected alone or with pcDNA3.1-FLAG-LKB1 and pcDNA3.1-HA-AMPK in HEK 293T cells (1 μg each). The effect of LKB1 and AMPK on lipin-1 was checked by Western blotting and the proteins were detected using anti-FLAG and anti-HA antibodies. b Graphical representation of the fold expression of lipin-1 as depicted in panel a. Lipin-1 levels in controls were arbitrarily taken as 1. Values indicate means ± SEMs; n = 3, where n represents the number of biological replicates c HeLa cell lines were treated with AMPK activators like AICAR (3 mM), Metformin (25 mM) and 2DG (25 mM). Cell lysates were immunoblotted and lipin-1 was detected using anti-lipin-1 antibody. The activation of AMPK was confirmed by anti pAMPK (pT172) antibody. d pcDNA3.1-FLAG-Lipin-1a (3 μg) was co-transfected with increasing amounts of pcDNA3.1-FLAG-LKB1 (0.1–1 μg). f Stable cell line of LKB1 was made in HeLa background using pBABE-puro-Flag-LKB1. Cells were selected using 5 μg/ml puromycin and expression of LKB1 was confirmed using anti-LKB1 antibody. h HEK 293T cells were transfected with pcDNA3.1-FLAG-lipin-1a (3 μg) alone or along with pcDNA3.1-FLAG-LKB1 (1 μg). Cells were treated with 1 μM Bortezomib, 50 μM leupeptin and 50 μM pepstatin for 16 h, lysed and immunoblotted for lipin-1 and LKB1. b, e, g and i are graphical representation of the fold expression of lipin-1 as depicted in panels a, c and e respectively. Lipin-1 levels in controls were arbitrarily taken as 1. Values indicate means ± SEMs; n = 3, where n represents the number of biological replicates
To further investigate the role of LKB1 on lipin-1 protein, we co-transfected FLAG-lipin-1 with variable amounts of FLAG-LKB1 in HEK 293 T cells. Results showed that with the increasing amounts of LKB1, there was a correspondingly enhanced degradation of lipin-1 (Fig. 5d, e).
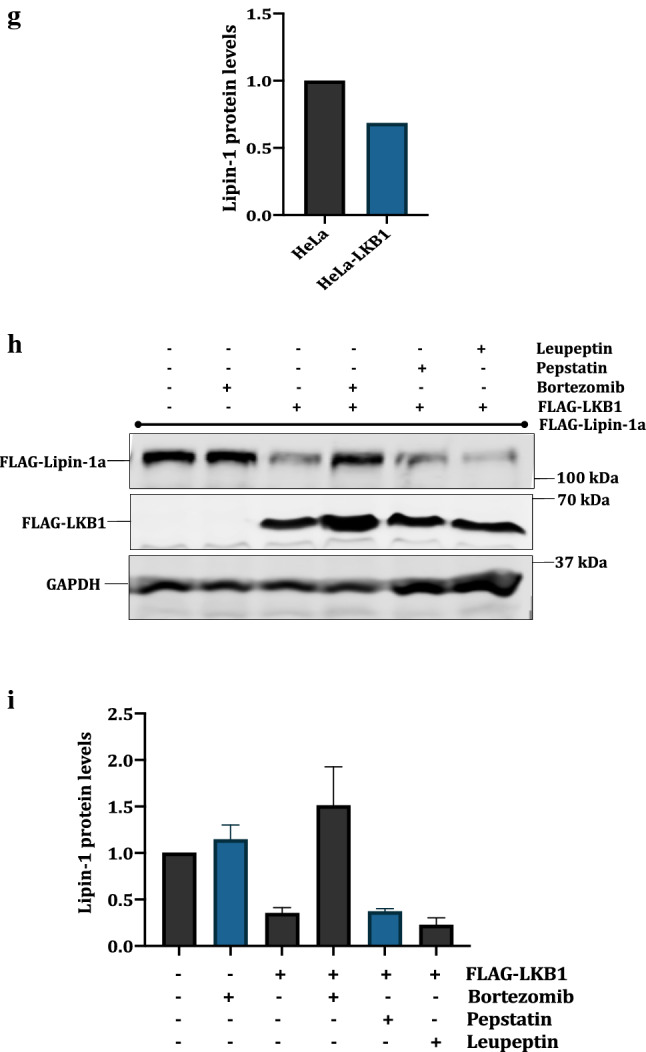
Comparison of lipin-1 expression among different cell lines showed that HeLa cells have a higher expression level of lipin-1 (data not shown). A strong reason behind this higher expression could be that HeLa cells are LKB null (−/−) (Tiainen et al. 1999). We also wanted to gain additional evidence whether LKB1 expression leads to the degradation of endogenous lipin-1. Therefore, we made stable cell line of LKB1 in HeLa cells. Results showed that lipin-1 amounts were decreased in HeLa-LKB1 cells as compared to the control HeLa cells (Fig. 5f, g). To check whether the degradation caused by LKB1 is mediated by proteasomes, we used bortezomib, a known proteasomal inhibitor (Chen et al. 2011). HEK 293 T cells were co-transfected with FLAG-lipin-1a and FLAG-LKB1 and treated with bortezomib, or lysosomal inhibitors leupeptin and pepstatin for 16 h. Results showed that bortezomib, but not the other inhibitors, overcomes the effect of LKB1 on lipin-1, thus confirming that LKB1 mediated degradation of lipin-1 is proteasome dependent (Fig. 5h, i).
LKB1 interacts with lipin-1 and decreases its half-life
To check if lipin-1 and LKB1 interact with each other directly, HEK 293 T cells were transfected with FLAG-lipin-1a and FLAG-LKB1 for 48 h. Cell lysates were subjected to immunoprecipitation using anti-lipin-1 antibody. The immunoprecipitates were blotted using anti-lipin-1 and anti-FLAG antibodies. Results showed that LKB1 was pulled down along with lipin-1, thus confirming that lipin-1 and LKB1 interact with each other (Fig. 6a). To determine if LKB1 degrades lipin-1 post translationally, we treated the lipin-1 and LKB1 transfected HEK 293 T cells with cycloheximide for different time points. Results showed that lipin-1 is degraded faster in presence of LKB1, which indicates that the half-life of lipin-1 decreases in presence of LKB1 (Fig. 6b, c).
Fig. 6.


LKB1 is an interacting partner of lipin-1. a HEK 293 T cells were transfected with empty vector backbone pcDNA3.1 (4 μg), pcDNA3.1-FLAG-lipin-1a (3 μg), pcDNA3.1-FLAG-LKB1 (1 μg) or with pcDNA3.1-FLAG-lipin-1 (3 μg) + pcDNA3.1-FLAG-LKB1 (1 μg). Cells were harvested and lysed 48 h post transfection. Lipin-1 was immunoprecipitated (IP) from the cell lysates using anti-lipin-1 antibody and run on SDS-PAGE gel. Lipin-1 and LKB1 were detected using anti-FLAG antibody (IB). b HEK 293 T cells were transfected with pcDNA3.1-FLAG-lipin-1a (3 μg) or pcDNA3.1-FLAG-lipin-1a (3 μg) + pcDNA3.1-FLAG-LKB1 (1 μg) and treated with 25 μg/ml cycloheximide for indicated time points. Cells were lysed and immunoblotted for the detection of lipin-1, LKB1 and GAPDH. c Quantification of lipin-1 levels in the above experiments. Lipin-1 levels were normalized with GAPDH levels. The experiments were done two times. d 3T3L1-LKB1 cell line was confirmed by Western blotting using anti-LKB1 antibody. e 3T3-L1 preadipocytes were induced to differentiate into adipocytes for 8 days and stained with Oil red O stain on day 9. f The degree of differentiation was measured by de-staining the plates with isopropanol and measuring the absorbance of this eluate at 510 nm
As for AKT1, to understand the downstream effects of lipin-1 degradation by LKB1, we stably expressed LKB1 in 3T3-L1 preadipocytes (Fig. 6d). Since the expression of LKB1 was higher in this cell line, the lipin-1 amounts were correspondingly lesser. The cells were induced to differentiate and finally they were fixed to perform Oil red O staining. The results showed that, in case of LKB-1 overexpression, there was less accumulation of lipid droplets as indicated by the Oil red stain (Fig. 6e, f). These results thus clearly suggested that the degradation of lipin-1 by LKB1 of lipin-1 abate its downstream effects like adipocyte differentiation.
Discussion
Lipin-1 is a critical protein with a multitude of functions within the cell. The most well understood aspect of lipin-1 is its functions in lipid metabolism. Lipin-1 plays an important role in adipogenesis, lipogenesis, lipid storage, fatty acid oxidation, synthesis of membrane lipids and regulation of lipid molecules associated with various cellular signaling pathways (Coleman and Mashek 2011; Csaki et al. 2013; Koh et al. 2008; Wang et al. 2017; Finck et al. 2006).
Here we report that lipin-1 is a bona fide substrate for AKT1, leading to its stabilization (Fig. 2a). Interestingly, our results further show that lipin-1 in turn activates AKT1. These findings are consistent with an earlier report which also showed that knocking down of lipin-1 resulted in decreased AKT1 phosphorylation at S473, a measure of its activation (Brohée et al. 2015). These results are particularly important because they indicate potential reversible regulation of the PI3K-AKT1 pathway by a downstream target like lipin-1, which in fact does not have any intrinsic kinase activity, but rather is a lipid phosphatase. In the classical pathway, lipin-1 is a downstream target of mTOR kinase, while mTOR is itself regulated by AKT1 and vice versa (18, 36). Our results therefore suggest that lipin-1 acts a positive regulator of PI3K-AKT1-mTOR pathway, by stimulating AKT1 activity (Fig. 7). The detailed understanding of the mechanism by which lipin-1 may upregulate AKT1 activity is quite interesting and therefore needs further investigation.
Fig. 7.

Model showing the proposed role of lipin-1 in PI3K-AKT1-mTOR pathway: Growth factors trigger the autophosphorylation of receptor tyrosine kinases (RTK) which results in the activation of PI3K and its downstream proteins, finally resulting in activation of mTOR kinase. mTOR phosphorylates lipin-1 as well as other proteins like S6K and 4EBP. Lipin-1 is also a direct substrate for AKT1, which, also causes its stabilization. Lipin-1 in turn activates AKT1. On the other hand, LKB1, the negative regulator of PI3K pathway, also suppresses lipin-1 by promoting its proteasomal degradation
Moreover, our results also revealed that LKB1 negatively regulates lipin-1 by degrading it. It is noteworthy to mention that LKB1 is a known negative regulator of PI3K-AKT-mTOR pathway (Shaw et al. 2004). LKB1 phosphorylates AMPK, which acts on TSC2 to enhance its activity and finally mTOR is inhibited (Inoki et al. 2002). From our results, we conclude that LKB1 can also regulate PI3K-AKT1-mTOR pathway negatively by suppressing lipin-1, which as per our results enhances the activity of AKT1, a positive regulator of this pathway (Fig. 7). We therefore, conclude that lipin-1 is a critical regulatory protein in the mTOR axis which adds additional layer of regulation to this pathway.
PI3K-AKT1-mTOR pathway has long been linked with cancer development and progression, malignant transformation as well as cancer resistance and therefore has been a popular target for anticancer therapeutics. The anti-cancer drugs developed against this pathway are often used in combinations with other drugs for better efficacy and outcome. Almost all types of cancers are predominantly dependent upon lipid metabolism in the advanced stages due to hypoxia (Warburg effect), and lipin-1 is an important nodal point that has a role in lipid metabolism. It functions both through its PAP enzymatic activity as well as its transcriptional role, therefore a thorough understanding of the mechanism of its regulation may play a critical role in designing effective and targeted drugs against cancer.
Supplementary Information
Below is the link to the electronic supplementary material.
Acknowledgements
The research work in this study was supported by grants to Shaida Andrabi through the Ramalingaswami Fellowship, Department of Biotechnology, and through the FIST grant to the Department of Science and Technology, India. Misbah Un Nisa, Nusrat Nabi and Irfana Reshi were provided fellowships by the CSIR. Syed Qaaifah Gillani, Zarka Sarwar and Sameer A Bhat were provided INSPIRE fellowships by the Department of Science and Technology (DST), India.
Footnotes
Publisher's Note
Springer Nature remains neutral with regard to jurisdictional claims in published maps and institutional affiliations.
References
- Bahmanyar S, Biggs R, Schuh AL, Desai A, Müller-Reichert T, Audhya A, Dixon JE, Oegema K. Spatial control of phospholipid flux restricts endoplasmic reticulum sheet formation to allow nuclear envelope breakdown. Genes Dev. 2014;28(2):121–126. doi: 10.1101/gad.230599.113. [DOI] [PMC free article] [PubMed] [Google Scholar]
- Brohée L, Demine S, Willems J, Arnould T, Alain C, Deroanne CF. Lipin-1 regulates cancer cell phenotype and is a potential target to potentiate rapamycin treatment. Oncotarget. 2015;6(13):11264. doi: 10.18632/oncotarget.3595. [DOI] [PMC free article] [PubMed] [Google Scholar]
- Chen D, Frezza M, Schmitt S, Kanwar J, Dou QP. Bortezomib as the first proteasome inhibitor anticancer drug: current status and future perspectives. Curr Cancer Drug Targets. 2011;11(3):239–253. doi: 10.2174/156800911794519752. [DOI] [PMC free article] [PubMed] [Google Scholar]
- Coleman RA, Mashek DG. Mammalian triacylglycerol metabolism: synthesis, lipolysis, and signaling. Chem Rev. 2011;111(10):6359–6386. doi: 10.1021/cr100404w. [DOI] [PMC free article] [PubMed] [Google Scholar]
- Csaki LS, Dwyer JR, Fong LG, Tontonoz P, Young SG, Reue K. Lipins, lipinopathies, and the modulation of cellular lipid storage and signaling. Prog Lipid Res. 2013;52(3):305–316. doi: 10.1016/j.plipres.2013.04.001. [DOI] [PMC free article] [PubMed] [Google Scholar]
- Finck BN, Gropler MC, Chen Z, Leone TC, Croce MA, Harris TE, Jr, Lawrence JC, Kelly DP. Lipin 1 is an inducible amplifier of the hepatic PGC-1 a/PPAR a regulatory pathway. Cell Metab. 2006 doi: 10.1016/j.cmet.2006.08.005. [DOI] [PubMed] [Google Scholar]
- Gillani SQ, Reshi I, Nabi N, Un Nisa M, Sarwar Z, Bhat S, Roberts TM, Higgins JMG, Andrabi S. PCTAIRE1 promotes mitotic progression and resistance against antimitotic and apoptotic signals. J Cell Sci. 2022 doi: 10.1242/jcs.258831. [DOI] [PMC free article] [PubMed] [Google Scholar]
- Grimsey N, Han GS, O'Hara L, Rochford JJ, Carman GM, Siniossoglou S (2008) Temporal and spatial regulation of the phosphatidate phosphatases lipin 1 and 2. J Biol Chem 283(43):29166–29174. 10.1074/jbc.M804278200 [DOI] [PMC free article] [PubMed]
- Grimsrud PA, Carson JJ, Hebert AS, Hubler SL, Niemi NM, Bailey DJ, Jochem A, Stapleton DS, Keller MP, Westphall MS, Yandell BS, Attie AD, Coon JJ, Pagliarini DJ. A quantitative map of the liver mitochondrial phosphoproteome reveals posttranslational control of ketogenesis. Cell Metab. 2012;16(5):672–683. doi: 10.1016/j.cmet.2012.10.004. [DOI] [PMC free article] [PubMed] [Google Scholar]
- Han GS, Carman GM. Characterization of the human LPIN1-encoded phosphatidate phosphatase isoforms. J Biol Chem. 2010;285(19):14628–14638. doi: 10.1074/jbc.M110.117747. [DOI] [PMC free article] [PubMed] [Google Scholar]
- Han GS, Wu WI, Carman GM. The Saccharomyces cerevisiae lipin homolog is a Mg2+-dependent phosphatidate phosphatase enzyme. J Biol Chem. 2006;281(14):9210–9218. doi: 10.1074/jbc.M600425200. [DOI] [PMC free article] [PubMed] [Google Scholar]
- Han S, Bahmanyar S, Zhang P, Grishin N, Oegema K, Crooke R, Graham M, Reue K, Dixon JE, Goodman JM. Nuclear envelope phosphatase 1-regulatory subunit 1 (Formerly TMEM188) is the metazoan Spo7p ortholog and functions in the lipin activation pathway. J Biol Chem. 2012;287(5):3123–3137. doi: 10.1074/jbc.M111.324350. [DOI] [PMC free article] [PubMed] [Google Scholar]
- Harris TE, Huffman TA, Chi A, Shabanowitz J, Hunt DF, Kumar A. Insulin controls subcellular localization and multisite phosphorylation of the phosphatidic acid phosphatase, lipin 1. J Biol Chem. 2007;282(1):277–286. doi: 10.1074/jbc.M609537200. [DOI] [PubMed] [Google Scholar]
- Hawley SA, Boudeau J, Reid JL, Mustard KJ, Udd L, Mäkelä TP, Alessi DR, Hardie DG. Complexes between the LKB1 tumor suppressor, STRAD alpha/beta and MO25 alpha/beta are upstream kinases in the AMP-activated protein kinase cascade. J Biol. 2003;2(4):28. doi: 10.1186/1475-4924-2-28. [DOI] [PMC free article] [PubMed] [Google Scholar]
- Hennessy M, Granade ME, Hassaninasab A, Wang D, Kwiatek JM, Han GS, Harris TE, Carman GM (2019) Casein kinase II-mediated phosphorylation of lipin 1β phosphatidate phosphatase at Ser-285 and Ser-287 regulates its interaction with 14-3-3β protein. J Biol Chem 294(7):2365–2374. 10.1074/jbc.RA118.007246 [DOI] [PMC free article] [PubMed]
- Huffman TA, Mothe-satney I, Lawrence JC. Insulin-stimulated phosphorylation of lipin mediated by the mammalian target of rapamycin. Proc Natl Acad Sci. 2002;99(2):1047–1052. doi: 10.1073/pnas.022634399. [DOI] [PMC free article] [PubMed] [Google Scholar]
- Humphrey SJ, Yang G, Yang P, Fazakerley DJ, Stöckli J, Yang JY, James DE. Dynamic adipocyte phosphoproteome reveals that Akt directly regulates mTORC2. Cell Metab. 2013;17(6):1009–1020. doi: 10.1016/j.cmet.2013.04.010. [DOI] [PMC free article] [PubMed] [Google Scholar]
- Inoki K, Zhu T, Guan K-L. TSC2 mediates cellular energy response to control cell growth and survival. Cell. 2003;115(5):577–590. doi: 10.1016/s0092-8674(03)00929-2. [DOI] [PubMed] [Google Scholar]
- Inoki K, Li Y, Zhu T, Wu J, Guan K-L. TSC2 is phosphorylated and inhibited by Akt and suppresses mTOR signalling. Nat Cell Biol. 2002;4(9):648–657. doi: 10.1038/ncb839. [DOI] [PubMed] [Google Scholar]
- Ishimoto K, Hayase A, Kumagai F, Kawai M, Okuno H, Hino N, Okada Y, Kawamura T, Tanaka T, Hamakubo T, Sakai J, Kodama T, Tachibana K, Doi T. Degradation of human Lipin-1 by BTRC E3 ubiquitin ligase. Biochem Biophys Res Commun. 2017;488(1):159–164. doi: 10.1016/j.bbrc.2017.04.159. [DOI] [PubMed] [Google Scholar]
- Kim Y, Gentry MS, Harris TE, Wiley SE, Lawrence JC Jr, Dixon JE. A conserved phosphatase cascade that regulates nuclear membrane biogenesis. Proc Natl Acad Sci U S A 104(16):6596–6601. 10.1073/pnas.0702099104 [DOI] [PMC free article] [PubMed]
- Koh Y, Lee M, Kim J, Kim M, Moon J, Lee Y, Ahn Y, Kim K. Lipin1 is a key factor for the maturation and maintenance of adipocytes in the regulatory network with CCAAT/enhancer-binding protein α and peroxisome proliferator-activated receptor γ2. J Biol Chem. 2008;283(50):34896–34906. doi: 10.1074/jbc.M804007200. [DOI] [PMC free article] [PubMed] [Google Scholar]
- Langner CA, Birkenmeier EH, Ben-Zeev O, Schotz MC, Sweet HO, Davisson MT, Gordon JI. The fatty liver dystrophy (fld) mutation. A new mutant mouse with a developmental abnormality in triglyceride metabolism and associated tissue-specific defects in lipoprotein lipase and hepatic lipase activities. J Biol Chem. 1989;264(14):7994–8003. doi: 10.1016/S0021-9258(18)83141-6. [DOI] [PubMed] [Google Scholar]
- Li TY, Song L, Sun Y, Li J, Yi C, Lam SM, Xu D, Zhou L, Li X, Yang Y, Zhang C-S, Xie C, Huang X, Shui G, Lin S-Y, Reue K, Lin S-C. Tip60-mediated lipin 1 acetylation and ER translocation determine triacylglycerol synthesis rate. Nat Commun. 2018;9(1):1916. doi: 10.1038/s41467-018-04363-w. [DOI] [PMC free article] [PubMed] [Google Scholar]
- Liu G, Gerace L. Sumoylation regulates nuclear localization of lipin-1 a in neuronal cells. PLoS ONE. 2009;4(9):1–10. doi: 10.1371/journal.pone.0007031. [DOI] [PMC free article] [PubMed] [Google Scholar]
- Manning BD, Toker A. Review AKT/PKB signaling: navigating the network. Cell. 2017;169(3):381–405. doi: 10.1016/j.cell.2017.04.001. [DOI] [PMC free article] [PubMed] [Google Scholar]
- Okuno H, Okuzono H, Hayase A, Kumagai F, Tanii S, Hino N, Okada Y, Tachibana K, Doi T, Ishimoto K (2019) Lipin-1 is a novel substrate of protein phosphatase PGAM5. Biochem Biophys Res Commun 509(4):886–891. 10.1016/j.bbrc.2019.01.031 [DOI] [PubMed]
- Péterfy M, Phan J, Xu P, Reue K. Lipodystrophy in the fld mouse results from mutation of a new gene encoding a nuclear protein, lipin. Nat Genet. 2001;27(1):121–124. doi: 10.1038/83685. [DOI] [PubMed] [Google Scholar]
- Peterson TR, Sengupta SS, Harris TE, Carmack AE, Kang SA, Balderas E, Guertin DA, Madden KL, Carpenter AE, Finck BN, Sabatini DM. mTOR complex 1 regulates lipin 1 localization to control the SREBP pathway. Cell. 2011;146(3):408–420. doi: 10.1016/j.cell.2011.06.034. [DOI] [PMC free article] [PubMed] [Google Scholar]
- Phan J, Reue K. Alternatively spliced lipin isoforms exhibit distinct expression pattern, subcellular localization, and role in adipogenesis. J Biol Chem. 2005;280(38):32883–32889. doi: 10.1074/jbc.M503885200. [DOI] [PubMed] [Google Scholar]
- Rena G, Guo S, Cichy SC, Unterman TG, Cohen P (1999) Phosphorylation of the transcription factor forkhead family member FKHR by protein kinase B. J Biol Chem 274(24):17179–17183. 10.1074/jbc.274.24.17179 [DOI] [PubMed]
- Reue K, Brindley DN. Multiple roles for lipins/phosphatidate phosphatase enzymes in lipid metabolism. J Lipid Res. 2008;49(12):2493–2503. doi: 10.1194/jlr.R800019-JLR200. [DOI] [PMC free article] [PubMed] [Google Scholar]
- Sarwar Z, Nabi N, Bhat SA, Gillani SQ, Reshi I, Nisa MU, Adelmant G, Marto JA, Andrabi S. Interaction of DBC1 with polyoma small T antigen promotes its degradation and negatively regulates tumorigenesis. J Biol Chem. 2022;298(2):101496. doi: 10.1016/j.jbc.2021.101496. [DOI] [PMC free article] [PubMed] [Google Scholar]
- Shaw RJ, Bardeesy N, Manning BD, Lopez L, Kosmatka M, DePinho RA, Cantley LC. The LKB1 tumor suppressor negatively regulates mTOR signaling. Cancer Cell. 2004;6(1):91–99. doi: 10.1016/j.ccr.2004.06.007. [DOI] [PubMed] [Google Scholar]
- Shimizu K, Fukushima H, Ogura K, Lien EC, Nihira NT, Zhang J, North BJ, Guo A, Nagashima K, Nakagawa T, Hoshikawa S, Watahiki A, Okabe K, Yamada A, Toker A, Asara JM, Fukumoto S, Nakayama KI, Nakayama K, Inuzuka H, Wei W. The SCFβ-TRCP E3 ubiquitin ligase complex targets Lipin1 for ubiquitination and degradation to promote hepatic lipogenesis. Sci Signal 10(460):eaah4117. 10.1126/scisignal.aah4117 [DOI] [PMC free article] [PubMed]
- Tiainen M, Ylikorkala A, Mäkelä TP. Growth suppression by Lkb1 is mediated by a G1 cell cycle arrest. Proc Natl Acad Sci. 1999;96(16):9248–9251. doi: 10.1073/pnas.96.16.9248. [DOI] [PMC free article] [PubMed] [Google Scholar]
- Wang H, Airola MV, Reue K. How lipid droplets “TAG” along: Glycerolipid synthetic enzymes and lipid storage. Biochim Biophysica Acta Mol Cell Biol Lipids. 2017;1862(10):1131–1145. doi: 10.1016/j.bbalip.2017.06.010. [DOI] [PMC free article] [PubMed] [Google Scholar]
- Yang G, Murashige DS, Humphrey J, James DE. A positive feedback loop between Akt and mTORC2 via SIN1 Phosphorylation. Cell Rep. 2015;12(6):937–943. doi: 10.1016/j.celrep.2015.07.016. [DOI] [PubMed] [Google Scholar]
- Zanivan S, Gnad F, Wickström SA, Geiger T, Macek B, Cox J, Fässler R, Mann M. Solid tumor proteome and phosphoproteome analysis by high resolution mass spectrometry. J Proteome Res. 2008;7(12):5314–5326. doi: 10.1021/pr800599n. [DOI] [PubMed] [Google Scholar]
- Zhao JJ, Liu Z, Wang L, Shin E, Loda MF, Roberts TM. The oncogenic properties of mutant p110α and p110β phosphatidylinositol 3-kinases in human mammary epithelial cells. Proc Natl Acad Sci. 2005;102(51):18443–18448. doi: 10.1073/pnas.0508988102. [DOI] [PMC free article] [PubMed] [Google Scholar]
Associated Data
This section collects any data citations, data availability statements, or supplementary materials included in this article.