

Abstract
Extracellular vesicles (EVs) can be produced from red blood cells (RBCs) on a large scale and used to deliver therapeutic payloads efficiently. However, not much is known about the native biological properties of RBCEVs. Here, we demonstrate that RBCEVs are primarily taken up by macrophages and monocytes. This uptake is an active process, mediated mainly by endocytosis. Incubation of CD14+ monocytes with RBCEVs induces their differentiation into macrophages with an Mheme‐like phenotype, characterized by upregulation of heme oxygenase‐1 (HO‐1) and the ATP‐binding cassette transporter ABCG1. Moreover, macrophages that take up RBCEVs exhibit a reduction in surface CD86 and decreased secretion of TNF‐α under inflammatory stimulation. The upregulation of HO‐1 is attributed to heme derived from haemoglobin in RBCEVs. Heme is released from internalized RBCEVs in late endosomes and lysosomes via the heme transporter, HRG1. Consequently, RBCEVs exhibit the ability to attenuate foam cell formation from oxidized low‐density lipoproteins (oxLDL)‐treated macrophages in vitro and reduce atherosclerotic lesions in ApoE knockout mice on a high‐fat diet. In summary, our study reveals the uptake mechanism of RBCEVs and their delivery of heme to macrophages, suggesting the potential application of RBCEVs in the treatment of atherosclerosis.
Keywords: atherosclerosis, endocytosis, extracellular vesicles, foam cells, haemoglobin, mheme, red blood cells
1. INTRODUCTION
Extracellular vesicles (EVs) have intricate roles in normal physiological processes and under many pathological conditions. They carry signals to distant cells and alter cellular behaviours. These signals comprise bioactive compounds, including macromolecules and small molecules, which are protected by the lipid bilayer that delineates each vesicle (Van Niel et al., 2018). Such protection prolongs the travel distance and course of action of the signalling molecules. This excellent signal‐carrier function of EVs is well established, and it has recently inspired a wave of engineering efforts that aim to harness their properties for therapeutic delivery (Herrmann et al., 2021; Richter et al., 2021; X. Zhang et al., 2021).
The EVs that originate from red blood cells (RBCEVs) have favourable characteristics for serving as an effective drug delivery platform. They are devoid of DNA and inherit their allogenic transfusion compatibility traits from RBCs, hence potentially providing safe, 'off‐the‐shelf' medication. In addition, RBCs can be readily collected from volunteers and stimulated with calcium ionophore to release large amounts of RBCEVs (Pham et al., 2021; Usman et al., 2018). Therefore, RBCEV production is easily scalable and cost‐effective when compared with EVs from stem cells or cancer cells. RBCEVs have also been demonstrated to efficiently deliver antisense oligonucleotides (ASOs) (Jayasinghe et al., 2022; Peng et al., 2022; Usman et al., 2018), peptides (Jayasinghe et al., 2022), and drugs such as paclitaxel (Pham et al., 2021) in mouse models for cancer treatment. They are also used as effective vectors to deliver ASOs for treating acute liver failure (G. Zhang et al., 2020). Moreover, conjugation of targeting molecules onto the surface of RBCEVs enhances their accumulation at their target sites, thus increasing the efficacy of drug delivery (Jayasinghe et al., 2022; Pham et al., 2021).
Since EVs are complex entities which act as carriers of biological agents that can modulate their target cells, applying them for therapeutic purposes requires an in‐depth understanding of their interactions with these cells and the potential effects of their various components. In the case of RBCEVs, haemoglobin is the most abundant protein present. In human adults, haemoglobin is mainly present in the form of haemoglobin A, which is composed of two α and two β globin chains. Each globin chain is complexed with one heme group to facilitate the transportation of oxygen molecules throughout the body. Haemoglobin is safe when carried by RBCs but it is toxic when released from RBCs into the bloodstream and interstitial space due to hemolysis (Jeney et al., 2002). However, this toxicity of free haemoglobin can be neutralized by haptoglobin, a protein secreted from liver cells. This is because haemoglobin and haptoglobin form a complex that is rapidly processed by macrophages through the CD163 receptor (Fabriek et al., 2005). Upon internalization, the haemoglobin component of the complex is broken down, and the heme groups are processed by an enzyme called heme oxygenase 1 (HO‐1).
HO‐1 plays a protective role against atherosclerosis (Araujo et al., 2012; Kishimoto et al., 2019). This protective effect is speculated to stem from the catalytically enzymatic degradation of heme by HO‐1. During the process, heme is broken down into ferrous ions, CO (which inhibits inflammation), and biliverdin (which has antioxidant properties) (Otterbein et al., 2000; Stocker et al., 1987). It has been shown that HO‐1‐knockout mice develop an atherosclerosis phenotype with severe aortitis, coronary injuries, and fatty streaks (Ishikawa et al., 2012). In contrast, the induced expression of HO‐1 in these animals suppresses atherosclerosis formation (Ishikawa et al., 2001; Juan et al., 2001). HO‐1 is upregulated in a population of intraplaque non‐foamy macrophages, which are distinct from foam cells (Finn et al., 2012). These macrophages have been identified as Mheme cells. They are derived from monocytes induced by haptoglobin‐haemoglobin (Hp‐Hb) complexes within hemorrhaging plaques and are reported to be resistant to foam cell formation (Boyle et al., 2009; Orozco et al., 2007). Thus, we hypothesize that in RBCEVs, haemoglobin is protected in enclosed vesicles, preventing cytotoxicity. In addition, we speculate that the haemoglobin carried by RBCEVs exerts both anti‐inflammatory and anti‐atherosclerosis effects mediated via the HO‐1 pathway when the EVs are taken up by macrophages.
In this study, we investigated the uptake of RBCEVs by macrophages. We also monitored the intracellular trafficking of RBCEVs and the fate of haemoglobin, their most abundant protein cargo. We found that RBCEVs were preferentially taken up by macrophages in the liver and spleen. The EVs then released heme into the cytoplasm via the heme transporter HRG1, which promoted the differentiation of the macrophages to a phenotype characterized by upregulated HO‐1 expression, and prevented the accumulation of oxidized low‐density lipoproteins (oxLDL) in these cells. This natural therapeutic characteristic of RBCEVs suggests their potential benefits in atherosclerosis treatment, especially when combined with other drug cargoes that can be loaded into and carried by these EVs. In addition, the anti‐inflammatory properties of RBCEVs might be effective for the treatment of other inflammatory conditions.
2. RESULTS
2.1. RBCEV uptake is cell type‐dependent both in vitro and in vivo
We first characterized the purified human RBCEVs used throughout the study. The RBCEVs appeared as intact, spherical particles, with a mean diameter of ∼137 nm (Figure S1a‐c). We confirmed the presence of haemoglobin, along with an enrichment of the RBCEV markers ALIX, TSG101, and glycophorin A (GPA) and depletion of Beta Actin relative to the amounts present in RBCs (Figure S1d). The mean RBCEV yield was ∼0.5 mg per mL of RBC packed volume (Figure S1e), and ∼96.8% of the RBCEVs could be recovered from samples stored at −80°C in PBS containing 4% trehalose and subsequently thawed (Figure S1f).
In a previous study, we found that RBCEVs predominantly accumulate in the liver, spleen, lung, and bone marrow after intraperitoneal or intravenous injections in immunodeficient mice (Pham et al., 2021; Usman et al., 2018). In the current study, we performed a detailed analysis of the distribution of RBCEVs at the cellular level in immunocompetent mice. To track the in vivo distribution of RBCEVs, we used the Acoerela dye Aco‐490, which is a water soluble and fluorogenic lipophilic dye. Aco‐490 is one of a new class of dyes that are conjugated oligoelectrolytes, which preferentially stain lipid bilayers with minimal background (Zhou et al., 2019, 2022). We collected the liver, spleen, lungs and femur bones from each animal 8 h after intravenous injection of Aco‐490‐labelled RBCEVs and stained these tissues for F4/80 and CD169, which are surface markers of resident macrophages (Figure 1a). In line with previous studies (Pham et al., 2021; G. Zhang et al., 2020), we found that RBCEVs primarily accumulated in the liver and spleen (Figure 1b), whereas no visible Aco‐490 signals could be detected in the lung and bone tissues (Figure S2). In the liver sections, a significant portion of the Aco‐490 fluorescence signals colocalized with F4/80+ cells. This suggests that the RBCEVs were extensively taken up by Kupffer cells, with relatively little uptake by other cell types in the liver (Figure 1c). In the spleen, RBCEVs were predominantly localized at the marginal zone, resulting in a ring pattern within these tissue sections. Notably, Aco‐490 fluorescence prominently co‐localized with CD169+ cells in the marginal zone, and there was relatively little co‐localization with F4/80+ cells.
FIGURE 1.

RBCEVs are taken up preferentially by macrophages and monocytes. (a) Schematic of the experimental setup used to track the biodistribution of RBCEVs. 500 μg of Aco‐490‐labelled RBCEVs were injected intravenously into C57BL/6 mice. The organs were collected 8 h later for analysis. (b) Flow cytometry analysis of Aco‐490 signals in dissociated liver, spleen, lung, and bone marrow as outlined in (a). Data are presented as the percentage of Aco‐490‐positive cells. (c) Confocal images of the liver and spleen sections as outlined in (a). Macrophages were identified by immunolabelling with F4/80 or CD169 antibodies (Red). Nuclei were stained with NucSpot® Live 488 (Cyan). Scale bars, 100 μm. (d) Flow cytometry analysis of Aco‐490 signals in PBMCs incubated with Aco‐490‐labelled RBCEVs for 2 h or 24 h and stained with antibodies for the surface markers to identify T‐cells, NK cells, monocytes, and B cells. (e) Quantification of CFSE‐labelled RBCEVs taken up by different cell types after incubation with 40 μg of RBCEVs for 2 h. (f) Flow cytometry analysis quantifying RBCEV uptake by macrophages differentiated from human CD14+ PBMCs in M‐CSF for 6 d. Macrophages were either unstimulated (M0), stimulated with LPS and IFN‐γ for 1 d, or stimulated with IL4 and IL10 for 1 d before incubation with CFSE‐labelled RBCEVs for 2 h. All the bar graphs represent the mean ± SD. a.u.: arbitrary unit. Student's two‐tailed t‐test (f), **p < 0.01, *p < 0.05, ns: not significant (p > 0.05).
Furthermore, we examined if RBCEVs might be taken up by different cell types in the circulation. Thus, human peripheral blood mononuclear cells (PBMCs) were incubated with RBCEVs for 2 h or 24 h and then stained with different cell surface markers and analysed using flow cytometry. We found that CD14+ monocytes exhibited the highest uptake of RBCEVs among the cell types examined. In contrast, B cells (CD19+) and natural killer (NK) cells (CD3‐CD56+) displayed lower levels of RBCEV uptake. T cells (CD3+), on the other hand, showed the lowest uptake of RBCEVs, with minimal uptake detected after 2 h of incubation (Figure 1d).
Additionally, we showed that the extent of RBCEV uptake varied greatly among different cell types, this time by comparing the uptake capacity of several cancer cell lines (Figure 1e). To measure the level of RBCEVs uptake, we developed an absolute quantification method. Macrophages were incubated with carboxyfluorescein succinimidyl ester (CFSE)‐labelled RBCEVs (CFSE‐EVs), after which they were collected and lysed in 2% Triton‐X100, and the CFSE fluorescence intensity was measured. Using a standard curve of known EV concentrations, the amount of RBCEVs taken up by each cell line was calculated based on the CFSE signals and normalized to the cell number. Our data showed that after 2 h of incubation with 40 μg RBCEVs at 37°C, the uptake level among cancer cells markedly differed. For example, on average, each CA1a cell took up ∼200 EVs, whereas each HeLa cell took up ∼500 vesicles. The uptake by macrophages was surprisingly higher, with over 2,000 EVs per cell. Hence, using this method, we can obtain quantitative data, which will facilitate future pharmacological studies involving RBCEVs.
Given that macrophages are well‐known for their heterogenous phenotypes, we further investigated if different macrophage subtypes might exhibit differences in their capacity for EV uptake. Indeed, upon polarization of monocyte‐derived macrophages, we found that unstimulated macrophages and macrophages stimulated with IL4 and IL10 took up higher amounts of RBCEVs, whereas macrophages stimulated with LPS and IFN‐γ showed slightly lower capacity for RBCEV uptake (Figure 1f).
2.2. RBCEVs are taken up robustly by macrophages through a process mediated by phosphatidylserine
Macrophages often phagocytose apoptotic cells by recognizing phosphatidylserine (PS) on their cell membranes (Fadok et al., 1992; Tanaka & Schroit, 1983). Since RBCEVs have abundant PS exposed on their membrane (Tripisciano et al., 2020), we sought to test if PS mediates the uptake of RBCEVs by macrophages. Here, we saturated PS receptors on CD14+ PBMC‐derived macrophages using PS liposomes (Figure 2a). As a control, we replaced the PS liposomes with an equivalent concentration of phosphatidylcholine (PC) liposomes. After incubation for 30 min with PS or PC liposomes, the macrophages were incubated with CFSE‐labelled RBCEVs for 2 h at 37°C and analyzed by flow cytometry to measure the CFSE signals (Figure 2a). Our data showed that PS liposomes, but not PC liposomes, blocked the uptake of RBCEVs by macrophages in a dose‐dependent manner. For example, PS liposomes at a concentration of 440 μM reduced the uptake of RBCEVs by more than half compared to the absence of blocking or the PC (control) liposomes. However, the uptake level did not reach a plateau for any of the concentrations tested, which suggests that further reductions in the uptake of RBCEVs might be achieved by more extensive blocking (Figure 2a).
FIGURE 2.

Uptake of RBCEVs by macrophages is mediated by phosphatidylserine. (a) Schematic of the experimental strategy and flow cytometry analysis data showing RBCEV uptake by PBMC‐derived macrophages after pre‐incubation with phosphatidylserine liposomes (PS‐lipo) or phosphatidylcholine liposomes (PC‐lipo) at different concentrations for 30 min. The cells were then incubated with CFSE‐labelled RBCEVs for 2 h. (b) Schematic of the experimental strategy and data from nanoparticle flow cytometry analysis showing Annexin V staining of phosphatidylserine (PS) on the surface of RBCEVs. CFSE‐labelled RBCEVs were treated with methyl‐α‐cyclodextrin and 1,2‐distearoyl‐sn‐glycero‐3‐phosphocholine (DSPC) to reduce the expression of PS on their outer leaflet membrane (PS‐reduced). L‐α‐phosphatidylserine was added to the PS‐reduced EVs to restore PS expression (PS‐restored). Untreated RBCEVs and modified RBCEVs were stained with Annexin V for PS detection. The upper row of contour plots shows the controls and gating strategy for the CFSE‐positive population. Subsequently, Annexin V signals were gated based on the CFSE‐positive particles (n = 4). (c) Flow cytometry analysis of CFSE signals indicating the uptake of RBCEVs treated as described in (b) by macrophages. After PS removal or PS restoration, RBCEVs were incubated with macrophages for 2 h (n = 8). All the bar graphs represent the mean ± SD. Student's two‐tailed t‐test (b,c), **p < 0.01, *p < 0.05, ns: not significant (p > 0.05). a.u.: arbitrary unit.
To further ascertain the importance of PS in the EV uptake process, we investigated the effect of removing native PS from RBCEVs on the extent of RBCEV uptake by macrophages. Following labelling with CFSE, RBCEVs were treated with methyl‐α‐cyclodextrin and 1,2‐distearoyl‐sn‐glycero‐3‐phosphocholine (DSPC) to reduce the amount of PS on their outer leaflet membrane ('PS‐reduced'), and then L‐α‐PS was added to the PS‐reduced RBCEVs to restore PS expression ('PS‐restored'). The RBCEVs were then stained with Annexin V and analyzed by flow cytometry (Figure 2b). When compared with untreated RBCEVs, Annexin V staining was lower in the 'PS‐reduced' group and higher in the 'PS‐restored' group, demonstrating the efficacy of these two PS manipulation procedures (Figure 2b). The CFSE‐labelled untreated, PS‐reduced, and PS‐restored RBCEVs were then added to macrophages and incubated for 2 h. As expected, the differences in CFSE signals among the groups indicated that the PS‐reduced RBCEVs and PS‐restored RBCEVs were taken up by a lesser and greater degree, respectively, than normal (untreated) RBCEVs (Figure 2c). Together, our data show that RBCEV uptake by macrophages is mediated by the interactions between the PS component of the RBCEV membrane and PS receptors on macrophages.
2.3. RBCEVs are internalized mainly through endocytosis (including phagocytosis)
The routes of EV uptake often determine the fate of EV cargos in recipient cells and therefore affect the use of EVs in therapeutic delivery. Thus, we investigated how RBCEVs enter macrophages, first by assessing if the uptake is an active, energy‐dependent process or if it occurs passively. Our data showed that incubating macrophages with RBCEVs at 4°C significantly inhibited the uptake of RBCEVs when compared with incubation at 37°C. This indicates that RBCEV uptake is an active process (Figure 3a). We also showed that at 37°C, RBCEV uptake by macrophages is time‐ and concentration‐dependent (Figure 3b).
FIGURE 3.
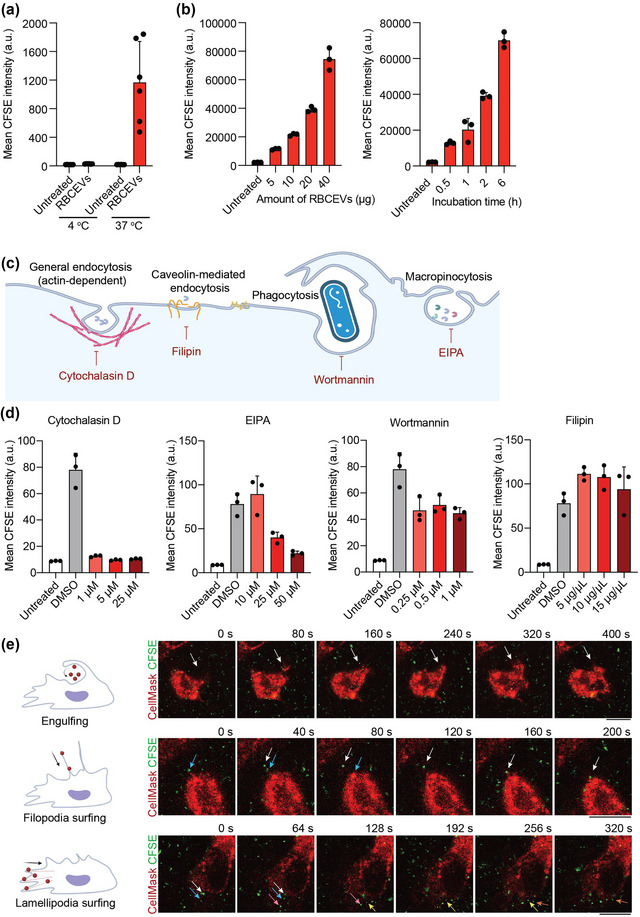
Uptake of RBCEVs by macrophages is an active process, mainly mediated by endocytosis. (a) Flow cytometry analysis of CFSE indicating the uptake of CFSE‐labelled RBCEVs by macrophages after 2 h of incubation at 4°C or 37°C. (b) Flow cytometry analysis of CFSE indicating the uptake of RBCEVs by macrophages in a time‐ and concentration‐dependent manner. Macrophages were incubated for 2 h with different amounts of EVs (left) or incubated with 20 μg CFSE‐labelled RBCEVs for different durations of time (right). (c) Schematic showing the different routes of endocytosis and the corresponding inhibitors. Cytochalasin D disrupts actin filaments and thus affects all routes of endocytosis including phagocytosis. Filipin blocks lipid raft and caveolin‐mediated endocytosis; EIPA inhibits macropinocytosis, and wortmannin blocks phagocytosis. (d) Flow cytometry analysis indicating the uptake of CFSE‐labelled RBCEVs by macrophages after treatment with cytochalasin D, EIPA, wortmannin, or filipin. The cells were untreated (control) or treated with DMSO (solvent control) or with different concentrations of each inhibitor for 1 h, followed by incubation with 20 μg of CFSE‐labelled EVs for 1 h, after which they were subjected to flow cytometry analysis. (e) Representative images from live‐cell imaging of CellMask Deep Red‐stained macrophages incubated with CFSE‐labelled RBCEVs. The frames presented were taken between 30 and 60 min following RBCEV addition. Different colored arrows indicate the positions of different RBCEVs over time. Scale bars, 10 μm. a.u.: arbitrary unit.
We next used several pharmacological inhibitors to test which active endocytosis processes are important for RBCEV uptake. Disruption of actin microfilaments using cytochalasin D substantially reduced the uptake of RBCEVs, nearly reaching the background level (Figure 3c,d). We also found that EIPA (an inhibitor of macropinocytosis) prevented the uptake of RBCEVs in a dose‐dependent manner, while wortmannin (a phagocytosis inhibitor) also reduced the uptake of RBCEVs significantly. However, there was no reduction in RBCEV uptake when cells were treated with filipin, which blocks caveolin‐mediated endocytosis (Figure 3c,d). Live‐cell imaging allowed us to directly visualize this RBCEV internalization process. Upon addition of RBCEVs to macrophages, we observed several types of cell membrane protrusions, including phagocytic cups for particle engulfment, filopodia, and lamellipodia, which grabbed the RBCEVs and facilitated their cellular entry (Figure 3e and Video S1). Intriguingly, we also found supporting evidence for the direct fusion of RBCEVs with the plasma membrane of macrophages. Indeed, after incubation with RBCEVs for 2 h at 37°C, the macrophage plasma membrane stained positive for GPA, a protein marker of RBCEVs (Figure S3). In contrast, there was no detectable GPA staining after the incubation at 4°C, suggesting that the GPA signal was not due to RBCEVs binding to the cells but perhaps the fusion of the RBCEVs and cell membranes. Hence, our data overall indicate that RBCEVs are taken up mainly through endocytosis, particularly macropinocytosis and phagocytosis, although direct fusion with the plasma membrane remains a possibility.
2.4. RBCEVs accumulate in late endosomes and lysosomes
To track the fate of RBCEVs after being endocytosed, we incubated macrophages with CFSE‐labelled RBCEVs and then observed the localization of the CFSE signals over time. We set up three separate experimental groups corresponding to three time points, 0.5 h, 2 h, and 4 h from the time of RBCEV addition. For the 0.5‐h and 2‐h groups, the RBCEVs were present for the entire duration (0.5 h and 2 h, respectively). For the 4‐h group, the RBCEVs were incubated with macrophages for 2 h, after which the RBCEVs were removed and replaced with fresh medium to study the degradation rate of their cargos (Figure 4a). Afterwards, the cells were fixed, permeabilized and stained with antibodies for markers of early endosomes (EEA), late endosomes (LBPA), or lysosomes (LAMP1). The percentage of CFSE signals that overlapped with EEA was low, although it increased slightly between 0.5 h and 4 h, suggesting minimal presence of RBCEVs in the early endosomes (Figure 4b,c). In contrast, within just 0.5 h, a significant proportion of the CFSE signals overlapped with LBPA (∼15%) and LAMP1 (∼20%). In addition, between 0.5 h and 4 h, the level of co‐localization decreased for LBPA but remained high and showed a slight overall increase for LAMP1 (Figure 4b,c). These results indicate that RBCEVs rapidly accumulated in late endosomes and lysosomes and progressively moved to the latter within 2–4 h. Furthermore, live‐cell imaging of macrophages stained with LysoTracker Deep Red revealed high accumulation of RBCEV signals in the acidic compartments 6 h after RBCEV addition, which again shows RBCEV trafficking to the late endosomes and lysosomes over time (Figure 4d and Video S2).
FIGURE 4.

RBCEVs accummulate in late endosomes and lysosomes. (a) Schematic illustrating the experimental protocol used to observe the intracellular trafficking of RBCEVs in macrophages. (b) Confocal images of macrophages after a 2‐h exposure to CFSE‐labelled RBCEVs (Green). The cells were co‐labelled with antibodies against early endosomes (EEA), late endosomes (LBPA), or late endosome‐lysosomes (LAMP1) (Red), and the nuclei were counterstained with Hoechst 33342 (Cyan). Scale bar, 20 μm. (c) Percentage of CFSE signals overlapping with the various endosomal markers over time. Images were analyzed using ImageJ. (d) Representative images from live‐cell imaging of macrophages stained with Lysotracker Deep Red (indicates acidic compartments) and incubated with CFSE‐labelled RBCEVs. The frames presented were taken ∼6 h after RBCEV addition. The white arrows indicate the position of a RBCEV‐containing endosomal vesicle over time. (e) Confocal images and quantification of the localization of haemoglobin in macrophages at different time points after a 0.5‐h or 2‐h exposure to CFSE‐labelled RBCEVs. The cells were immunolabelled with an antibody against α‐haemoglobin (HBA) (Red) and the nuclei were counterstained with Hoechst 33342 (Cyan). Scale bar, 10 μm. (f) Western blot and quantification of HBA protein levels in macrophages at different time points after a 2‐h exposure to RBCEVs. All the graphs represent the mean ± SD. a.u: arbitrary unit.
The localization of RBCEV staining in late endosomes and lysosomes suggests that RBCEV‐related proteins might be degraded by lysosomal proteases. We therefore tracked the degradation rate of haemoglobin (the most abundant protein in RBCEVs), in RBCEV‐treated macrophages at different time points using immunofluorescence staining. Again, macrophages were incubated with RBCEVs at four different time points: 0.5, 2, 4, and 24 h. Specifically, for the 4 and 24‐h time points, all RBCEVs were removed from the medium after 2 h of incubation. This was done to monitor the degradation of haemoglobin. Our data showed that as early as 2 h after removing the RBCEVs (corresponding to the 4‐h time point), most of the haemoglobin had been degraded, and no haemoglobin immunofluorescence could be observed (Figure 4e). In agreement with this finding, we found that the haemoglobin α subunit was not detectable by Western blotting from the 4‐h time point onwards (Figure 4f). Together, these results suggest that after endocytosis by macrophages, RBCEVs and their haemoglobin contents are rapidly broken down within 2 h.
2.5. RBCEVs induce PBMC‐derived macrophages into an Mheme‐like phenotype and reduce their CD86 expression
To investigate whether RBCEVs might impact heme metabolism in macrophages, we added RBCEVs to CD14+ cells isolated from human PBMCs during their differentiation into macrophages (via treatment with macrophage colony stimulating factor (M‐CSF)) and quantified the expression of the heme metabolizing enzyme HO‐1. We found that treatment with 80 ng/μL or 160 ng/μL RBCEVs significantly upregulated the expression of HO‐1 mRNA in differentiating macrophages when compared with the negative control (M‐CSF treatment only). Among other genes associated with heme metabolism, the expression of the cholesterol efflux transporter ABCG1 also increased in the RBCEV‐treated group (Figure 5a). This increase in the expression of HO‐1 and ABCG1 resembles the Mheme phenotype of macrophages found in atherosclerosis lesions, which exhibit atheroprotective properties (Boyle et al., 2009). It is worth noting that the expression of another cholesterol efflux transporter gene, ABCA1, showed a slight but statistically insignificant increase in the RBCEV‐treated groups. Interestingly, RBCEV treatment did not provoke changes in the expression of genes encoding inflammatory cytokines (Figure 5a). Primary murine macrophages derived from the bone marrow likewise showed a significant upregulation of Ho‐1 mRNA following treatment with RBCEVs in vitro (Figure S4a).
FIGURE 5.
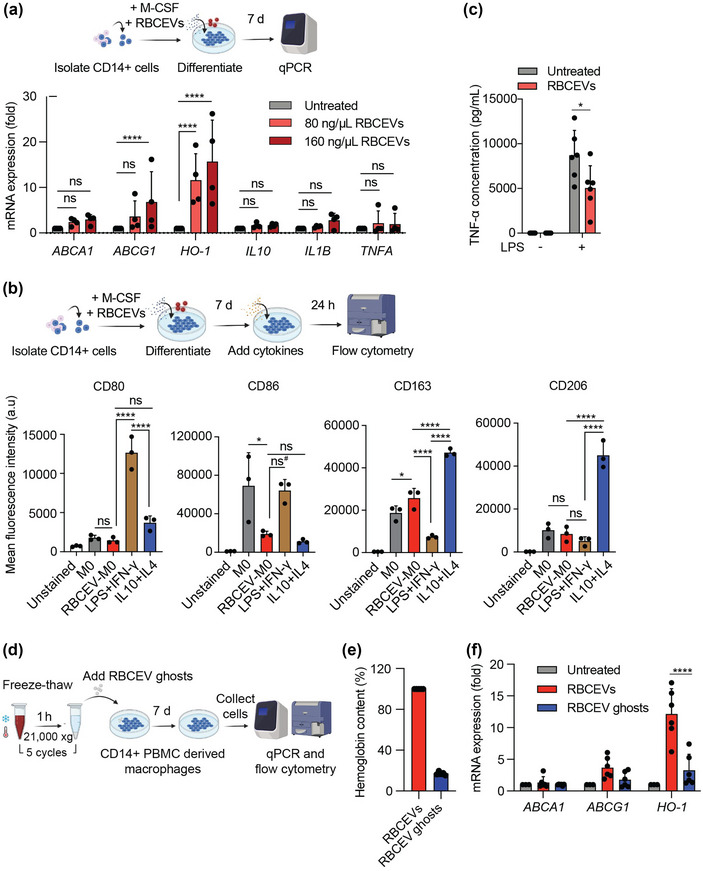
RBCEVs induce an Mheme‐like phenotype in macrophages. (a) Schematic of the experimental strategy used and data acquired from a qPCR analysis of the relative mRNA expression levels (normalized to GAPDH) of HO‐1, ABCA1, ABCG1, IL10, IL1B, and TNFA in macrophages differentiated from CD14+ PBMCs. Three groups of cells were analyzed: an untreated control group and two groups treated with different RBCEV concentrations (80 and 160 ng/μL) for 7 d (n = 4). (b) Flow cytometry analysis of macrophage markers associated with LPS and IFN‐γ stimulation (CD80 and CD68) and macrophage markers associated with IL4 and IL10 stimulation (CD163 and CD206). All markers were gated from CD11b+ cells. Macrophages were differentiated in M‐CSF (M0) and incubated with 160 ng/μL RBCEVs for 7 d (RBCEV‐M0). RBCEV‐treated macrophages were compared with macrophages activated by LPS and IFN‐γ for 1 d or by IL4 and IL10 for 2 d (n = 3). (c) ELISA quantification of the pro‐inflammatory cytokine TNF‐α in the supernatant of macrophages treated with RBCEVs and challenged with LPS or medium only for 24 h (n = 6). Student's two‐tailed t‐test, *p < 0.05, ns: not significant (p > 0.05). (d) Schematic of the experimental strategy used for qPCR and flow cytometry analysis of RBCEV‐ and RBCEV ghost‐induced macrophages. Macrophages were differentiated in M‐CSF (M0) and incubated with RBCEV ghosts or RBCEVs (in similar concentrations, equivalent to 160 ng/μL RBCEVs) for 7 d. (e) Quantification of haemoglobin content in RBCEV ghosts relative to RBCEVs using Nanodrop. (f) qPCR analysis of the relative mRNA levels (normalized to GAPDH) of ABCA1, and ABCG1, and HO‐1 in different groups of macrophages as outlined in (d) (n = 6). Two‐way ANOVA test followed by Dunnett test (a) or Tukey test (f), One‐way ANOVA test followed by Tukey test (b), ****p < 0.0001, **p < 0.01, *p < 0.05, ns#: p = 0.057, ns: not significant (p > 0.05). All bar graphs represent mean ± SD. a.u.: arbitrary unit.
Based on surface marker expression, we found that macrophages treated with RBCEVs (and M‐CSF) more closely resembled macrophages stimulated with IL4 and IL10 than macrophages stimulated with LPS and IFN‐γ (Figure 5b). Indeed, the expression of CD80, a marker associated with classically activated macrophages, was low in RBCEV‐induced macrophages. We also found a significantly lower level of CD86 expression in both RBCEV‐induced macrophages and in macrophages stimulated with IL4 and IL10 when compared with that in unstimulated macrophages. The CD86 level in RBCEV‐induced macrophages was also lower than that in macrophages stimulated with LPS and IFN‐γ, although this difference was not statistically significant (p = 0.057) (Figure 5b). The levels of CD163 and CD206 are of interest as their elevation has previously been observed in macrophages displaying the atheroprotective Mheme phenotype following exposure to haemoglobin within hemorrhaging plaques (Boyle et al., 2009; Finn et al., 2012). We found that CD163 was the highest in macrophages stimulated with IL4 and IL10 and significantly increased in RBCEV‐treated macrophages compared to macrophages with either LPS and IFN‐γ stimulation or no stimulation. CD206, in contrast, was only increased in macrophages stimulated with IL4 and IL10 and was not significantly different among the other groups (Figure 5b).
We further investigated whether RBCEVs could attenuate inflammation by challenging RBCEV‐treated macrophages with LPS. Remarkably, monocyte‐derived macrophages primed with RBCEVs prior to LPS stimulation showed reduced TNF‐α in their supernatant, suggesting RBCEVs are capable of attenuating excessive inflammatory signals in macrophages in response to LPS stimuli (Figure 5c).
In primary murine macrophages derived from the bone marrow, a reduction in Tnfa mRNA expression was similarly observed in the RBCEV‐treated group following LPS stimulation, along with an increase in anti‐inflammatory cytokine Il10, thus further demonstrating the anti‐inflammatory effect of RBCEVs (Figure S4b). We administered RBCEVs (50 mg per kg body weight) into C57BL/6 mice via tail vein injection and sorted out F4/80+ cells from their livers for analysis of macrophage surface markers by flow cytometry. Interestingly, we found an upregulation of not only CD163 and CD206 but also CD80 in cells from the RBCEV‐treated group, possibly due to the recognition of the human‐origin RBCEVs by the mouse immune system (Figure S4c,d).
It is likely that the haemoglobin delivered by RBCEVs is responsible for inducing the HO‐1 pathway that we observed. To test this hypothesis, we depleted haemoglobin from RBCEVs and examined the effects of these RBCEVs on CD14+ PBMC derived macrophages. The haemoglobin depletion process involved freezing and thawing RBCEVs in water for five rounds, resulting in RBCEV membranes with reduced haemoglobin (RBCEV ghosts) (Figure 5d). The RBCEV ghosts appeared as ruptured, cup‐shaped particles and membrane fragments under transmission electron microscopy, in contrast with the intact, spherical morphology of the RBCEVs (Figure S1a). The RBCEV ghosts however showed a similar size distribution to that of normal RBCEVs (Figure S1b). The membrane protein BAND 3 was also preserved in RBCEV ghosts, but the intraluminal proteins GAPDH and haemoglobin α‐chains were not detectable using Western blotting (Figure S1g). Quantification of the haemoglobin content using Nanodrop further showed an 80% reduction in haemoglobin from normal RBCEVs to the RBCEV ghosts (Figure 5e).
The same numbers of intact RBCEVs or RBCEV ghosts (equivalent to 160 ng/μL) were incubated with human CD14+ PBMCs during their differentiation into macrophages. After 7 days, the expression of Mheme‐associated genes and macrophage polarization surface markers was analyzed. Our qPCR data showed that when macrophages were treated with RBCEV ghosts, there was a significant reduction in the level of HO‐1 mRNA, when compared with cells treated with intact RBCEVs (Figure 5f). Similarly, the level of ABCG1 mRNA was also lower in RBCEV ghost‐treated macrophages, although the extent of the reduction was not statistically significant. Regarding macrophage surface markers, CD86 expression was similarly downregulated on macrophages from both RBCEV‐treated and RBCEV ghost‐treated groups (Figure S5). Overall, haemoglobin appears to be a critical component that induces some of the phenotypic changes in the macrophages via the HO‐1 pathway, while other changes such as the decrease in CD86 expression might have been caused by other RBCEV components.
2.6. Upregulation of HO‐1 by RBCEVs is mediated by the heme transporter HRG1
From previous studies conducted on RBCs, it is known that once haemoglobin is degraded in late endosomes and lysosomes, the heme component is released and transported across the endosomal membrane to the cytosol by the heme transporter HRG1 (White et al., 2013). Heme in the cytosol binds to its targets and induces changes associated with the Mheme phenotype, including the upregulation of HO‐1 (Boyle et al., 2009). To test whether this is the case with our RBCEV‐induced macrophages, we performed a knockdown of HRG1 using ASOs. We designed and validated an HRG1‐targeting ASO, which reduced the expression of the mRNA after 48 h and the protein after 72 h (Figure 6a,b). Interestingly, following transfection with either the HRG1 ASO or a negative control ASO (NC ASO), incubation with RBCEVs for 24 h increased the expression of HRG1 mRNA when compared with the same experiment without RBCEVs, suggesting that RBCEVs upregulated endogenous HRG1 expression (Figure 6a). Nonetheless, even with the addition of RBCEVs, the HRG1 ASO still exhibited high mRNA knockdown efficiency (Figure 6a). More importantly, the expression of HO‐1 in RBCEV‐treated cells was markedly reduced following transfection with the HRG1 ASO when compared with the NC ASO (Figure 6c). These data support our hypothesis that the release of heme from endolysosomes via HRG1 mediates the differentiation of macrophages into a distinct phenotype, with an upregulation in HO‐1 expression similar to Mheme macrophages.
FIGURE 6.

HRG1 mediates the upregulation of HO‐1 by RBCEV treatment. (a) qPCR analysis of the relative HRG1 mRNA levels (normalized to GAPDH) in macrophages transfected with HRG1 ASO for 48 h and either untreated or else treated with RBCEVs for the last 24 h (n = 4). (b) Western blot analysis of HRG1 protein in macrophages transfected with HRG1 ASO for 72 h (n = 3). (c) qPCR analysis of the relative HO‐1 mRNA levels (normalized to GAPDH) in macrophages transfected with HRG1 ASO for 48 h and either untreated or else treated with RBCEVs for the last 24 h (n = 4). (d) Confocal images of macrophages after a 2‐h exposure to RBCEVs. The cells were immunolabelled with antibodies against the RBCEV marker BAND 3 (Green) and HRG1 (Magenta). The nuclei were then counterstained with Hoechst 33342 (Cyan). The white arrows indicate HRG1 clusters. Scale bar, 10 μm. (e,f) Quantification of the of HRG1 clusters (e) and HRG1 signals (f) per cell from images as shown in (d) (n = 12 for ‘Untreated, n = 24 for ‘RBCEVs’). (g) Confocal images of macrophages after a 2‐h exposure to CFSE‐labelled RBCEVs and analysis of co‐localization between CFSE (Green), HRG1 (Magenta), and LAMP1 (Red) signals. The cells were double immunolabelled with antibodies against LAMP1 and HRG1 and the nuclei were counterstained with Hoechst 33342 (Cyan). Scale bar, 10 μm. (h) Mander's overlap coefficient analysis of HRG1 signals and LAMP1 signals from images as shown in (g) (n = 17 for ‘Untreated’, n = 31 for ‘RBCEVs’). Each data point corresponds to one cell in (e,f,h). (i) Representative signal intensity profiles of CFSE, LAMP1 and HRG1 (middle panels) obtained along the solid white line in the merged images (left panels), and Mander's overlap coefficient analysis of CFSE‐LAMP1 double positive signals and HRG1 signals (right panel). Images were analyzed with ImageJ. Student's two‐tailed t‐test (a,b,c,e,f,h), ***p < 0.001, **p < 0.01, *p < 0.05. a.u.: arbitrary unit.
To better understand the involvement of HRG1 in mediating the effects of RBCEVs, we analyzed changes in the cellular distribution of HRG1 after macrophages were incubated with RBCEVs for 2 h. Notably, RBCEV treatment resulted in an increased number of HRG1 clusters per cell (Figure 6d,e). The HRG1 signal intensity per cell was also higher, possibly because the physical clustering of HRG1 produced more concentrated signals that were more distinguishable from the background noise (Figure 6d‐f). Furthermore, a higher percentage of HRG1 signals appeared to overlap with LAMP1 signals in RBCEV‐treated cells when compared with untreated controls. Intensity profiles revealed areas where CFSE signals (indicating RBCEVs) and LAMP1 signals (indicating lysosomes) co‐localized with the HRG1 signals (Figure 6g‐i). Together, these results support the idea that incubation with RBCEVs prompts HRG1 to cluster in macrophages and become distributed more to the lysosomes. This mechanism likely contributes to the functional export of RBCEV‐derived heme via the HRG1 transporter from endo‐lysosomes to the cytosol.
2.7. RBCEVs reduce foam cell formation in macrophages
We next investigated if macrophages treated with RBCEVs might be prevented from forming foam cells, similar to macrophages treated with Hp‐Hb. This was achieved by comparing the level of Oil Red O (ORO) staining as an indicator of intracellular lipid droplets, which are more abundant in foam cells observed in atherosclerosis. As expected, substantial levels of ORO staining were observed in macrophages challenged with oxLDL, whereas Hp‐Hb treatment markedly reduced the amount of ORO staining (Figure 7a,b). RBCEV‐primed macrophages also showed significantly lower levels of ORO staining, suggesting that RBCEVs protect macrophages against foam cell formation and thus potentially atherosclerosis (Figure 7b).
FIGURE 7.

RBCEVs prevent macrophage foam cell formation. (a) Representative images of unstimulated macrophages (M0) stained with Oil Red O (ORO) indicating foam cell formation. Monocyte‐derived macrophages were either untreated or else treated with RBCEVs or haptoglobin‐haemoglobin (Hp‐Hb) complexes for 7 d, followed by incubation with human oxidized low‐density lipoprotein (oxLDL) or medium alone for 24 h. (b) Quantification of ORO staining in the treatment groups described in (a), presented as the relative fold change in ORO intensity in derived macrophages from 3 to 4 donors, normalized to the control group (n = 15–20). (c) Representative images of ORO staining of macrophages activated with LPS and IFN‐γ. Monocyte‐derived macrophages were incubated with RBCEVs for 7 d, followed by incubation with 0.5 mM EDTA for 24 h. The cells were then washed and incubated with LPS and human oxLDL for 24 h. (d) Quantification of ORO staining in the treatment groups described in (c), presented as the relative fold change in the ORO intensity of macrophages from 4 donors, normalized to the control group (n = 20). (e) Flow cytometry analysis of DiI‐labelled oxLDL (DiI‐oxLDL) uptake by macrophages following different treatments. Monocyte‐derived macrophages were incubated in culture medium only, with RBCEVs, or with RBCEV ghosts for 7 d, followed by incubation with 10 μg/mL DiI‐oxLDL for 24 h. (f) Schematic illustrating the design of the arterial wall‐on‐a‐chip model. The device consisted of an endothelial cell (EC) layer with medium; a subendothelial extracellular matrix (ECM) layer in collagen; a macrophage layer in collagen, and a layer of medium to sustain the macrophages. (g) Immunofluorescence images of the co‐culture of ECs and macrophages in the arterial wall chip. Images were taken with 4× (whole chip‐four layers) and 20× objective lens (macrophage layers), respectively. The cells were stimulated with DiI‐oxLDL (Red) for 24 h. The nuclei were stained with Hoechst 33342 (Cyan). (h) Quantification of DiI‐oxLDL uptake by macrophages as shown in (f). The area containing cells exhibiting DiI‐oxLDL fluorescence was determined for macrophages from 3 donors on 4–5 chips represented by 4–5 data points. The data are presented as the relative fold change compared with the untreated group. All the images were analyzed with ImageJ. Each data point in (b,d) represents an image field (20×) from 3–4 biological replicates. All the bar graphs represent the mean ± SD. One‐way ANOVA test followed by Tukey test (b,d), ****p < 0.0001, ***p < 0.001, **p < 0.01. Student's two‐tailed t‐test (e,h), ****p < 0.0001, **p < 0.01, ns: not significant (p > 0.05).
Classically activated macrophages play a crucial role in atherosclerosis progression (Yang et al., 2020), which prompted us to investigate whether RBCEVs might mitigate foam cell formation in such cells. Therefore, the ORO staining experiment was again performed, this time on macrophages activated with LPS and IFN‐γ. We found that there was a significant reduction in foam cell formation in the RBCEV‐treated group (Figure 7c,d). As RBCEVs also deliver iron into the cells, we analyzed pathways associated with intracellular iron processing. In RBCEV‐treated macrophages, we indeed observed an increase in the protein‐level expression of the ferritin heavy chain and in the mRNA‐level expression of FTL1 and FTH1, which encode the ferritin light and heavy chains, respectively, although the increase in FTH1 mRNA was not statistically significant (p = 0.056) (Figure S6a,b). We observed as well slight, non‐significant increase in iron concentration in the culture medium (Figure S6c). Given that an accumulation of iron might prevent the protective effects of RBCEVs against atherosclerosis (Guo et al., 2018, 2017), we co‐treated LPS and IFN‐γ‐activated macrophages with RBCEVs and the metal ion chelator EDTA. Our data showed that this co‐treatment produced the lowest level of ORO‐positive cells among all the treatment groups (Figure 7c,d).
To understand how the RBCEV treatment prevented foam cell formation, we also compared the uptake of oxLDL between untreated cells and cells treated with RBCEVs. We found that treatment with RBCEVs strongly reduced DiI‐oxLDL uptake by macrophages (Figure 7e). Interestingly, RBCEV ghosts could also reduce this uptake but to a significantly smaller extent compared to intact RBCEVs (Figure 7e), indicating that haemoglobin played an important role in this process. However, since the process of generating RBCEV ghosts caused the depletion of not only haemoglobin but also other intraluminal components (Figure S4b) and possibly induced other changes, we do not exclude the possibility that such changes could have contributed to the observation made here.
Moreover, for a better evaluation of the atheroprotective effect of RBCEVs on macrophages, we utilized a microfluidic 'arterial wall‐on‐a‐chip' model to mimic the intima‐media structure of the arterial wall (Su et al., 2021). In brief, a co‐culture comprising an endothelial cell (EC) layer, a subendothelial extracellular matrix (ECM) layer, and a macrophage layer was assembled on organ chips (Figure 7f). The macrophages in one group were derived from monocytes differentiated in the presence of RBCEVs for 7 days, whereas the other group did not undergo any RBCEV treatment. As expected, following stimulation with DiI‐conjugated oxLDL, macrophages in the RBCEV‐treated group exhibited reduced foam cell formation, as demonstrated by a significant decrease in the uptake of the fluorescent oxLDL, when compared with the control (Figure 7g‐h). We were thus able to confirm the protective effect of RBCEVs in atherosclerosis using the micro‐engineered chip mimicking the arterial wall as a model.
We also tested the involvement of HO‐1 in the modulation of lipid uptake by knocking down HO‐1 using an ASO. We confirmed that the protein expression of HO‐1 was reduced 48 h after the ASO transfection (Figure S7a). We observed that in the group transfected with the HO‐1 ASO, RBCEV treatment produced a smaller reduction in DiI‐oxLDL uptake compared to the group transfected with an NC ASO (Figure S7b). These results suggest a mechanism for reducing lipid uptake which involves the modulation of the HO‐1 pathway by RBCEVs, and likely by the haemoglobin in the RBCEVs in particular. On the other hand, we did not find significant differences in the level of cholesterol efflux between the untreated and RBCEV‐treated groups (Figure S7c). Together, our data indicate that the reduction in foam cell formation resulted primarily from a decrease in uptake of lipids by macrophages rather than alteration in cholesterol efflux.
2.8. RBCEVs reduce atherosclerotic lesions in ApoE knockout mice on a high‐fat diet
Having observed the reduction of foam cell formation in vitro, we went on to apply the RBCEV treatment to atherosclerosis mouse models. ApoE knockout (ApoE ‐/‐) mice on a high‐fat diet received RBCEVs administered via tail vein injection at the dose of 50 mg/kg twice a week. After 8 weeks, the entire aorta was collected and stained with ORO to assess the total lesion formation (Figure 8a). Mice treated with RBCEVs showed a reduction in total aortic lesions (Figure 8b,c). In detail, the amount of atherosclerotic plaques, represented by the white spots, in the aortic arch decreased in RBCEV‐treated mice (Figure 8b). Quantification of the lesions by staining the entire aorta with ORO revealed a decrease in the total percentage of plaque area (Figure 8c). Encouragingly, the body weight of the mice remained similar between the control and treated groups, suggesting that the RBCEV treatment was not toxic (Figure S8a). Hence, our data from the macrophage monoculture, organ‐on‐a‐chip model, and animal model collectively demonstrate the preventive effect of RBCEVs on foam cell formation and atherosclerosis.
FIGURE 8.

RBCEVs prevent atherosclerosis in a high‐fat diet ApoE knockout mouse model. (a) Schematic illustrating the experimental setup to test the effect of RBCEVs on atherosclerosis using a high‐fat diet ApoE knockout (ApoE ‐/‐) mouse model. The treated group was injected with 50 mg/kg RBCEVs in 100 μL of PBS, while the control group was injected with the same volume of PBS only. i.v.: intravenous injection. (b) Aortic arches of mice after the course of the 8‐week treatment described in (a). White spots and streaks on the inner wall of the aorta are atherosclerotic plaques where cholesterol and various substances build up, forming atheromas. Normal healthy areas possess a transparent and smooth pink texture. (c) Representative image of the aortas from the RBCEV‐treated group and control group stained with Oil Red O (ORO) and quantification data of the total lesion, measured as the ORO‐positive area per total area of the aortic wall (n = 4 mice per group). (d) Experimental scheme for the study of RBCEV biodistribution in ApoE‐/‐ mice after 8 weeks on a high‐fat diet using RBCEVs labelled with DiR dye (DiR‐RBCEVs). (e) Representative images of the aorta from mice injected with either DiR‐RBCEVs or the DiR dye control and quantification of the DiR signal in the aorta of the two groups. Both the DiR dye solution and DiR‐RBCEVs were washed with PBS using several rounds of centrifugation before being injected into the mice. Images were acquired using IVIS (n = 3–4 mice). (f) Immunofluorescence images of aortic roots from mice treated as described in (a). Aortic root sections were stained with antibodies against mouse HO‐1 (Green) and the mouse macrophage marker CD68 (Magenta). Nuclei were stained with Hoechst 33342 (Blue). (g) Quantification of HO‐1 signals in the plaque area of aortic root sections from (f). Pools of 30–36 aortic root sections from 3 different mice in each treatment group were analysed. Student's two‐tailed t‐test (c, g), *p < 0.05.
To determine if RBCEVs are distributed to the plaque area, RBCEVs were stained with the DiR dye. Similar concentrations of free DiR were used as a control group, and staining and washing procedures were performed on both the DiR‐labelled EV samples and the control samples. RBCEVs and control dyes were administered via tail vein injection at 50 mg/kg. After 12 h, the aortas were collected and analyzed using the IVIS® Spectrum In Vivo Imaging System (Figure 8d). The analysis revealed that although the vast majority of RBCEVs ended up in the liver as expected (Figure S8b), there was a clear signal corresponding to DiR‐labelled EVs in the plaque area (Figure 8e).
We further investigated the expression of HO‐1 in the aortic roots by co‐staining with antibodies against HO‐1 as well as the mouse macrophage marker CD68. At least ten sections from different areas of the aortic roots of mice in each treatment group were stained and quantified (see 'Materials and methods' section). We observed tissue areas double‐positive for HO‐1 and CD68, indicating the expression of HO‐1 in macrophages within the aortic roots (Figure 8f). Importantly, we found that the overall HO‐1 expression levels increased in mice treated with RBCEVs compared with the control group (Figure 8g). Overall, our data in the ApoE ‐/‐ mouse model revealed the ability of RBCEVs to reduce atherosclerotic lesions and confirmed a concomitant increase in HO‐1 expression in macrophages residing in the aortic root.
3. DISCUSSION
It is well‐documented that following intravenous injections in mice, various types of EVs, including RBCEVs, accumulate in the liver and spleen—organs with large populations of macrophages.1,5,20 Understanding this phenomenon in detail, including the molecules and pathways involved, is key to developing EV platforms for therapeutic delivery of both endogenous and exogenous cargos. Here, we demonstrated that macrophages differentiated in vitro from human monocytes could take up RBCEVs very efficiently. We also provide the first estimation of the number of RBCEVs (i.e., mean ± SD = ∼2,221 ± 212.3) taken up by a single macrophage after a 2‐h incubation with 80 ng/μL RBCEVs. Such estimations are useful for comparing the extent of RBCEV uptake among different cell types and determining the quantity of any given cargo that is taken up by macrophages via RBCEVs, both of which are highly informative in pharmacological studies of RBCEV‐mediated therapeutic delivery.
We also found that RBCEVs entered macrophages mainly via active endocytosis, a process that could be blocked by low temperatures or by disrupting actin polymerization with cytochalasin D. The extent of uptake was also dependent on the EV concentration and duration of exposure. Our observations are consistent with those from previous studies, which reported the critical role of endocytosis and actin remodeling in the cellular internalization of various types of EVs (Costa Heusermann et al., 2016; Verdera et al., 2017). We also showed, via the use of specific inhibitors, that among the various different endocytosis pathways, macropinocytosis and phagocytosis were likely to be major routes of RBCEV entry; meanwhile, blocking lipid rafts with filipin failed to inhibit RBCEV uptake.
The potential role of EV entry via direct fusion with the plasma membrane is a particularly contested question. Several studies have reported the ability of EV membranes to fuse with cellular lipid bilayers, resulting in a hybrid membrane and mixing of contents, but this typically requires a low pH, such as that in lysosomes (Joshi et al., 2020; Parolini et al., 2009). Here, we provide supportive evidence indicating that direct fusion of RBCEVs with macrophages might be possible, because the amount of GPA staining on the surface of macrophages increased after incubation with RBCEVs at 37°C (but not at 4°C). However, macrophage‐RBCEV fusion events are likely rare, and active endocytic processes remain the major mode of EV uptake.
We also probed the molecular interactions occurring at the cell‐EV interface that are responsible for initiating EV engulfment. Several studies indicate the recognition of exposed PS on EVs from various sources by scavenger receptors on mouse and human macrophages, via a process similar to the recognition and phagocytic clearance of apoptotic cells (Buzás et al., 2018; Mulcahy et al., 2014). With regards to RBCEVs specifically, Zhang et al. demonstrated that the accumulation of EVs in the mouse liver is macrophage‐dependent and appears to be mediated by the complement protein C1q (G. Zhang et al., 2020). Here, we found that by blocking PS receptors on macrophages with PS liposomes, the uptake of RBCEVs was considerably reduced. Similarly, RBCEV uptake was significantly inhibited when their endogenous PS levels were reduced, whereas uptake increased when the RBCEVs’ PS levels were restored. It would be of interest for future works to pinpoint precisely which of the PS receptors on macrophages are responsible for RBCEV recognition and subsequent internalization.
Although the functional effects of EV‐based cargo delivery have been reproducibly observed in many studies (Bebelman et al., 2018; Tkach & Théry, 2016; X. Zhang et al., 2021), the processes that take place between EV administration and their downstream effects are not well‐understood. Our data showed that, as early as 30 min after RBCEV entry into the cell, and up to at least the 4‐h time point, RBCEV signals predominantly colocalized with the markers of late endosomes (LBPA) and lysosomes (LAMP1), with minimal colocalization with the early endosome marker EEA. This suggests that RBCEVs undergo a trafficking pathway involving late endosomes and lysosomes within macrophages. It is plausible that once haemoglobin is degraded in macrophages (within 2 h after RBCEVs are removed from the medium, according to our data), heme is released from the endolysosomal system into the cytosol via the HRG1 receptor, as is the case when senescent RBCs are processed by macrophages (White et al., 2013). Importantly, we showed that ASO‐mediated knockdown of HRG1 mRNA suppressed the typical RBCEV‐mediated upregulation of HO‐1. This, therefore, reveals the mechanism by which RBCEVs induce CD14+ monocytes to differentiate into macrophages with the phenotype we observed.
EVs are complex biological entities carrying numerous endogenous molecules, which can have a profound impact on the effectiveness and safety of their applications. For EVs from RBCs, the most abundant natural protein cargo is haemoglobin. Our data indicated that in vitro incubation of macrophages with RBCEVs stimulated them to adopt a phenotype that was somewhat similar to that of Mheme macrophages and macrophages stimulated with IL4 and IL10, but differed from macrophages stimulated with LPS and IFN‐γ. With regards to the haemoglobin metabolic pathways, we observed increased expression of HO‐1 (which encodes the protein that degrades heme) and ABCG1 (which encodes a cholesterol export channel protein). However, in the low‐dose (80 ng/μL) RBCEV treatment group, the increase in ABCG1 was not statistically significant. Importantly, RBCEV treatment significantly reduced oxLDL uptake by macrophages and thus allow the macrophages to become resistant to foam cell formation, similar to Mheme macrophages. For LPS‐activated macrophages in particular, co‐treatment of RBCEVs and the metal chelator EDTA further reduced the accumulation of oxLDL compared to when RBCEVs were applied alone. Together, our results indicate the highly promising potential of RBCEVs as natural therapeutic carriers of haemoglobin for atherosclerosis treatment and suggest their plausible co‐administration with iron chelators for improved efficacy. This potential is further supported by our in vivo data, which showed that intravenously injected RBCEVs could reduce the presence of plaques along the aorta of ApoE ‐/‐ mice on a high‐fat diet.
We furthermore examined the mechanism behind the decreased oxLDL uptake observed and found that the effect is at least partially mediated by the HO‐1 pathway. This is consistent with existing literature which reports that macrophages from mice with HO‐1 deficiency are more prone to accumulating lipids and forming foam cells when challenged with oxLDL than those from wildtype mice (Orozco et al., 2007). Of note, although here we used the pre‐oxidized form of LDL to test foam cell formation, HO‐1 could prevent foam cell formation and plaque development in the context of the actual disease by inhibiting LDL peroxidation. This is due to the antioxidant properties of bilirubin, a product of the HO‐1 pathway (Ishikawa et al., 2001; Stocker et al., 1987).
Even though Mheme macrophages are resistant to foam cell transformation and are in this way atheroprotective, evidence has emerged suggesting that this macrophage phenotype may also contribute to plaque instability by promoting angiogenesis and vascular permeability. Data from clinical studies identified a significant correlation between Mheme presence and plaque progression, as well as increased micro vascularity (Guo et al., 2018). This is attributed to the decreased retention of iron in Mheme macrophages, which activates the HIF1α master switch and subsequently upregulates VEGF, leading to elevated angiogenesis and impaired endothelial integrity. Consequently, the plaques become unstable, inflamed, and prone to rupture (Guo et al., 2018). The similarity between the RBCEV‐induced and Mheme phenotypes suggests that RBCEVs might result in a similar phenomenon, and so this might warrant additional efforts to manage the undesirable effects. We have previously shown that RBCEVs can serve as robust delivery vehicles for RNA‐based therapeutics, including siRNAs and ASOs, for efficient gene knockdown (Chen et al., 2022; Peng et al., 2022; Usman et al., 2018). It might therefore be possible to load RBCEVs with siRNAs against VEGF or its relevant downstream targets prior to administration to treat atherosclerosis. The successful implementation of this strategy would allow RBCEVs to exert their protective effects on macrophages via haemoglobin‐mediated signalling without incidentally disrupting the plaques.
Emerging studies are investigating how the natural anti‐inflammatory effects of certain types of EVs might be exploited. For example, EVs derived from human umbilical cord mesenchymal stem cells encapsulated in functional peptide hydrogels have protective effects that can be used to treat cardiac injuries (Han et al., 2019). In addition, EVs derived from human adipose mesenchymal stem cells are successful in inhibiting LPS‐activated monocytes via the delivery of miR‐132 and miR‐146a (Heo & Kim, 2022). Despite these anti‐inflammatory benefits, the high cost associated with culturing mesenchymal stem cells as a source of EVs greatly limits their use for any related therapy. Indeed, the expenses required for the long‐term use of EVs, for example, when managing chronic inflammation, are likely to be prohibitive. In contrast, RBCEVs are distinguished by their inexpensive and efficient production from blood samples readily available in blood banks. Our data here suggests that RBCEVs have an inherent capability to induce anti‐inflammatory effects in macrophages. This is evidenced by the significant reduction in TNF‐α secreted by LPS‐activated macrophages upon RBCEV treatment. Furthermore, RBCEVs did not induce the mRNA expression of the pro‐inflammatory cytokines such as IL1B and TNFA in non‐activated macrophages. This, therefore, indicates the suitability and safety of RBCEVs for managing inflammation.
The anti‐inflammatory effects of RBCEVs might be due to the presence of PS on the RBCEV plasma membrane, along with one of the byproducts of heme degradation. PS is known to have anti‐inflammatory properties, as demonstrated by the PS‐dependent anti‐inflammatory responses induced by apoptotic cells (Huynh et al., 2002). Incubation of macrophages with PS liposomes has been shown to reduce the expression of TNF‐α and the surface marker CD86, while stimulating the secretion of TGFβ and IL10 (Harel‐Adar et al., 2011). These responses of macrophages to PS liposomes resemble what we observed when macrophages were treated with RBCEVs. In addition, macrophages that were treated with RBCEVs showed a significant upregulation of HO‐1, which is well‐known for activating anti‐inflammatory pathways. The mechanistic basis of the anti‐inflammatory activity of RBCEVs is in part due to its catalytic product, carbon monoxide (CO), which is generated when heme is degraded. Indeed, it is known that stimulating macrophages with CO or overexpressing HO‐1 in these cells results in a significant reduction in TNF‐α and IL‐1β secretion in an LPS‐induced inflammatory model (Otterbein et al., 2000). Taken together, these lines of evidence suggest that the therapeutic use of RBCEVs would benefit from the combined anti‐inflammatory effects of PS and endogenous haemoglobin, which induces the expression of HO‐1 in macrophages. The prevention of inflammation mediated by macrophages might prove to be a useful treatment for a variety of diseases, including atherosclerosis. For instance, it has been shown that the treatment of macrophages with PS liposomes improves cardiac repair (Harel‐Adar et al., 2011). In fact, shifting macrophages from a pro‐inflammatory to an anti‐inflammatory phenotype has been reported previously as a strategy for treating diseases related to tissue repair and regeneration (Mills, 2012). Research on therapeutic strategies which use EVs as natural anti‐inflammatory agents is hence paving the way for the development of promising methods for treating immune‐related diseases, especially chronic inflammation, which typically involves long‐term treatment and carries the risk of side effects and complications associated with conventional drugs.
Although our in vitro data on the effects of RBCEVs on macrophages is encouraging, translating these findings to in vivo settings poses challenges, particularly in targeting RBCEVs to atherosclerotic sites. As shown by us and others, a significant proportion of injected RBCEVs accumulate in the liver and spleen, resulting in rapid clearance from the circulation (Usman et al., 2018; G. Zhang et al., 2020). In the present study, we could observe some signal from intravenously injected DiR‐labelled RBCEVs in the aorta. This aortic distribution of RBCEVs could be attributed to the physical properties of the plaque, such as its location at the aortic bifurcation and the presence of shear stress (Salzar et al., 1995; Zarins et al., 1983). Other possible reasons are the high uptake of RBCEVs by macrophages, which tend to accumulate in the plaque area, and the increased neo‐vascular permeability within the plaque structure (Y. Zhang et al., 1993). Nonetheless, the great majority of injected RBCEVs still accumulated in the liver. It is therefore likely that RBCEVs require further engineering to increase their circulation time and/or improve their targeting capabilities. We have previously demonstrated the successful covalent conjugation of functional nanobodies and peptides onto RBCEVs, enabling specific targeting of RBCEVs to EGFR‐positive cancer cells (Pham et al., 2021). Using some variation of the same method, it is possible to attach nanobodies or peptides that recognize markers of injured tissues or oxidized lipids to the RBCEV surface, so that these vesicles preferentially target and accumulate at therapeutic concentrations in the atherosclerotic lesions.
Overall, our study demonstrates robust endocytosis of RBCEVs by human monocyte‐derived macrophages. Haemoglobin from the RBCEVs is degraded within the late endosomes/lysosomes, releasing heme to the cytosol via the HRG1 transporter. This results in the upregulation of HO‐1, which was previously found to mediate atheroprotective effects. Indeed, we observed reduced oxLDL uptake and foam cell formation both in vitro and in vivo following the RBCEV treatment. Additionally, this RBCEV treatment induced anti‐inflammatory properties in the macrophages, including reduced CD86 expression and lower TNF‐α production upon LPS stimulation. These findings are summarized in Figure 9. Coupled with the scalability of RBCEV production and the capacity of the RBCEV platform for further engineering and drug loading, the results are indicative of a novel strategy to suppress the progression of atherosclerosis. Further investigations into the effects of RBCEVs in animal models of atherosclerosis will provide valuable insights to advance the development of this therapeutic platform.
FIGURE 9.

Schematic summarizing the effects of RBCEVs on macrophages upon endocytosis and the mechanism behind preventing oxLDL uptake mediated by the haemoglobin—heme—HO‐1 axis.
4. MATERIALS AND METHODS
4.1. RBCEVs purification
Whole blood samples were obtained from healthy donors by Innovative Research Inc. The samples were shipped to Singapore by iDNA (Singapore) and processed by Esco Aster (Singapore), following a protocol we described previously (Pham et al., 2021). Briefly, the plasma was removed using centrifugation, and the RBCs were washed twice with PBS by centrifuging at 1000×g for 8 min to remove plasma proteins. Then, the leukocytes were removed using leukodepletion filters (Nigale, China). Washed RBCs were diluted in PBS containing 0.1 mg/mL calcium chloride and 10 μM calcium ionophore (ab120287, Abcam,) and incubated in a cell culture incubator, at 37°C, with 5% CO2, under humidified conditions overnight, after which the cells were diluted with PBS. The RBCs and cell debris were removed using sequential centrifugation at increasing speeds (Usman et al., 2018). The supernatant containing RBCEVs was collected and filtered through a 0.45 μm filter membrane and then spun down at 50,000×g for 1 h. RBCEVs pellets were further purified by ultracentrifugation with a 60% sucrose cushion at 50,000×g overnight. For long‐term storage, the RBCEVs were resuspended in PBS containing 4% trehalose, aliquoted, and stored at −80°C.
4.2. RBCEV ghost preparation
RBCEVs were resuspended in deionized water at a concentration of 1 mg/mL. They were then frozen at −20°C and subsequently thawed at room temperature. A total of 5 freeze‐thaw cycles were conducted to achieve adequate depletion of the haemoglobin. The expelled haemoglobin was separated from the RBCEV membranes by washing using centrifugation at 21,000×g for 1 h in PBS. The pellet containing these RBCEV ghosts was then resuspended in PBS and washed once by centrifuging at 21,000×g for 1 h.
4.3. RBCEVs labelling
For CFSE labelling, RBCEVs (at 1 μg/μL) were incubated with PBS containing 20 μM CFSE (Thermofisher Scientific) for 3 h at 37°C. Free CFSE was then removed by centrifugation at 21,000×g for 30 min. The RBCEV pellets were resuspended in PBS (at 0.5 μg RBCEVs/μL) and centrifuged at 21,000×g for 30 min. The pellets were then diluted in PBS (at 1 mg of RBCEVs/20 mL) and left at 4°C overnight to further elute any unbound dye. CFSE‐labelled RBCEVs were concentrated again by centrifugation at 21,000×g for 30 min.
For Acoerela labelling, RBCEVs (at 0.5 μg/μL) were incubated with 2 μM Aco‐490, a kind gift from Prof. Bazan Guillermo Carlos's group (National University of Singapore, Singapore), for 1 h at room temperature. After labelling, any free dye was washed away by centrifugation at 21,000×g for 30 min. The labelled RBCEVs were washed three times with PBS (at 1 μg RBCEVs/μL), followed by centrifugation. The supernatant of the final wash served as a flowthrough control.
For DiR labelling, RBCEVs (at 2 μg/μL) were incubated with 0.4 μM DiR (Thermofisher Scientific) at room temperature for 15 min. Free dye was washed by centrifugation at 21,000×g for 30 min, 18°C. The RBCEV pellets were resuspended in prewarmed PBS (in a 37°C water bath, at 0.5 μg RBCEVs/μL) and centrifuged at 21,000×g for 30 min at 18°C. The washing step was repeated four times. A similar amount of DiR was used as the control and underwent the same steps of staining and washing as DiR‐labelled RBCEVs.
4.4. Biodistribution study
Aco‐490 labelled RBCEVs (25 mg/kg) were injected intravenously in 8‐10‐week old C57BL/6 mice (Invivos, Singapore). After 8 h, the mice were euthanized, and the liver, lungs, bones, and spleen were collected from each mouse and fixed in 10% formalin overnight at 4°C. The organs were then washed with PBS alone before being transferred first to PBS containing 15% sucrose and subsequently into PBS containing 30% sucrose. The organs were transferred once they had sunk to the bottom of the container. The tissues were then transferred to a small container, covered with optimal cutting temperature (OCT) compound and put on dry ice. The frozen tissues were cut into 7 μm‐thick sections and mounted on Superfrost slides. The slides were blocked with blocking buffer (PBS containing 2% FBS) for 40 min and then incubated with blocking buffer containing mouse TruStain (BioLegend, Cat #: 101319) at a dilution of 1:1000 for 5 min. Antibodies against mouse F4/80 (BioLegend, Cat #: 123105) or CD169 (BioLegend, Cat #: 142417) (1:500 dilution) were applied and the slides were incubated for 1 h at room temperature and then washed with wash buffer (PBS containing 2% FBS). As the anti‐mouse F4/80 antibody is biotinylated, after incubation with this antibody, the slides were incubated with Streptavidin AlexaFluor 647 (ThermoFisher Scientific, Cat #: S32357) for 1 h at room temperature and then washed with wash buffer. The nuclei were labelled with NucSpot488 diluted in PBS (Biotium, Cat #: 40081) at 1:2000 dilution. The sections were then washed with PBS followed by water and then they were mounted under coverslips using Vectashield antifade medium (Vector laboratories, Cat #: H‐1000‐10) and imaged using an Olympus FV3000 confocal microscope.
To study the biodistribution of RBCEVs in an atherosclerosis mouse model, ApoE ‐/‐ mice were put on a high‐fat diet for 8 weeks. DiR‐labelled RBCEVs were injected into the tail vein at the dose of 50 mg/kg. After 12 h, the aorta and organs were collected and imaged using the IVIS® Spectrum In Vivo Imaging System (PerkinElmer).
4.5. Isolation and differentiation of PBMCs
Apheresis cones containing blood from healthy donors were provided by the Health Sciences Authority in Singapore and processed according to our protocol, which was approved by the Institutional Review Board at the National University of Singapore. PBMCs were separated from the other blood components by centrifugation though a Ficoll‐Paque PLUS density gradient (Cytiva) at 700×g for 20 min with the centrifuge brakes off, followed by three rounds of washing with PBS followed by centrifugation, each at 300×g for 8 min.
CD14+ monocytes were isolated from the PBMCs using a magnetic isolation kit (CD14 MicroBeads, Miltenyibiotec). These cells were then cultured at a concentration of 105 cells per well in 24‐well plates in RPMI supplemented with fetal bovine serum (FBS; 10%), penicillin (100 IU/mL), streptomycin (100 μg/mL) and human M‐CSF (20 ng/mL; BioLegend) to stimulate their differentiation into macrophages. The cells were maintained with/without RBCEVs for 8 days. Various control phenotypes were also induced, as follows. The formation of polarized macrophages was induced by incubation for 1 day with either 20 ng/mL IFN‐γ (BioLegend) and 100 ng/mL LPS (Sigma‐Aldrich) to induce classically activated macrophages, or 20 ng/mL IL4 (BioLegend) and 20 ng/mL IL10 (BioLegend) to induce alternatively activated macrophages. When analysing CD163 and CD206 expression, the duration of the phenotype induction with IL4 and IL10 was extended to 2 days for optimal marker expression.
4.6. PS blocking assay
Macrophages were differentiated from CD14+ PBMCs in 20 ng/mL M‐CSF for 7 days and incubated with Clipos™ natural PS lipid liposomes (CD Bioparticles) (PS liposomes) or Clipos™ natural PC (CD Bioparticles) lipid liposomes (PC liposomes) at different concentrations (i.e., 110 μM, 220 μM or 440 μM) for 30 min, after which 10 μg CFSE‐labelled RBCEVs were added to each well. The cells were incubated for 1 h and then they were washed, collected, and the CFSE signals were analyzed using flow cytometry to measure the amount of RBCEV uptake.
4.7. PS reduction and restoration
The PS removal and restoration protocol was based on a phospholipid exchange method mediated by methyl‐α‐cyclodextrin (Li et al., 2016; Vahedi et al., 2020). For PS removal, RBCEVs (250 ng/μL) were incubated with 0.3 mM 1,2‐distearoyl‐sn‐glycero‐3‐phosphocholine (DSPC) and Methyl‐α‐cyclodextrin (40 mM) (AraChem, Netherlands) for 45 min at 37°C. The mixture was then loaded on the op of 2 mL 20% sucrose and centrifuged at 21,000×g for 30 min to remove excessive lipids. The methyl‐α‐cyclodextrin was washed from the RBCEVs with PBS by centrifugation for 30 min at 21,000×g.
PS restoration was conducted on PS‐depleted EVs using the same procedure but instead of DSPC, 0.3 mM L‐α‐PS was used.
4.8. Flow cytometry
Flow cytometry was applied to investigate surface markers of activated macrophages. Cells were washed with FACS buffer (PBS with 2% FBS and 2 mM EDTA) and then blocked with human TruStain FcX™ (BioLegend, San Diego). They were then incubated on ice with a fluorescent antibody against CD11b (FITC), CD80 (PE‐Dazzel‐594), CD86 (APC), CD206 (PE), or CD163 (APC) before being washed with FACS buffer. Fluorescence was analyzed via flow cytometry with a Cytoflex LX (Beckman Coulter).
Flow cytometry was also applied to evaluate the uptake of RBCEVs by macrophages. In brief, RBCEVs were stained with CFSE prior to incubation with the cells. After incubation with the cells, the cells were harvested and washed with FACS buffer. The fluorescence was then analysed using a BD LSR Fortessa cytometer (BD Biosciences).
4.9. Nano flow cytometry
After PS depletion and restoration, CFSE‐labelled RBCEVs (40 ng/μL) were stained with Annexin V‐APC (BioLegend, Cat #: 640920, 1:250 dilution) in 100 μL of Annexin V binding buffer for 20 min at room temperature. The samples were washed using centrifugation and resuspended in 200 μL of Annexin V binding buffer. Annexin V signals were analyzed by nanoparticle flow cytometry with the Cytoflex LX. Particles were detected using violet side scatter and RBCEVs were gated on the CFSE‐positive population. Annexin V signals were then analyzed from this CFSE‐positive population.
4.10. Cell culture
THP1, HEK‐293T (293T), HeLa, and NCI‐H358 (H358) cells were purchased from the American Type Culture Collection (ATCC). MCF10CA1a (CA1a) cells were purchased from the Karmanos Cancer Institute (Wayne State University).
All the cells were kept at 37°C and 5% CO2 in a humidified incubator. The CA1a, 293T, HeLa, and H358 cells were maintained in DMEM High Glucose w/ L‐Glutamine w/ Sodium Pyruvate (ThermoFisher Scientific). THP1 cells were maintained in RPMI 1640. Both DMEM and RPMI were supplemented with 10% FBS, 1% Penicillin‐Streptomycin, and 5 μg/mL Plasmocin™ prophylactic.
4.11. Antisense oligonucleotide transfection
The HRG1 ASO, HO‐1 ASO, and NC ASO were purchased from Integrated DNA Technologies (USA). The ASOs were modified with a phosphorothioate backbone, and the first 4 and last 4 internal nucleotides were modified with 2′‐OMe to enhance the ASOs’ stability and knockdown efficiency.
After 4–5 days of differentiation, macrophages were transfected with the ASOs. For the HRG1 knockdown, a mixture of 0.7 μL of ASO (100 μM):1 μL of Lipofectamine 3000 (Life Technologies) prepared in OptiMEM was added to the cells according to the manufacturer's protocol for a 24‐well plate. RNAs were extracted 48 h after transfection to measure mRNA levels using qPCR. RBCEVs were added 24 h prior to RNA extraction. Protein levels were quantified using Western blot 72 h after transfection. For the HO‐1 knockdown, a mixture of 1 μg of ASO:2 μL of PEI MAX (Polysciences) prepared in OptiMEM was added to the cells. Protein levels were quantified using Western blot 48 h after transfection.
4.12. RBCEV uptake assay
Macrophages were incubated with 20 μg of RBCEVs in 400 μL of culture medium for 2 h at 37°C (or 4°C, as a control for RBCEV binding). The medium was aspirated, after which the cells were rinsed once with cold PBS and detached by incubation with 0.25% Trypsin‐EDTA (ThermoFisher Scientific) for 10 min at 37°C. The cells were then washed twice with FACS buffer by centrifugation at 300×g for 5 min at 4°C before being analyzed by flow cytometry.
4.13. Absolute quantification of RBCEV uptake
THP1, 293T, HeLa, H358 or CA1a cells were incubated with 500 μL of culture medium containing 40 μg of CFSE‐EVs for 2 h at 37°C (or 4°C, for the binding control). For the adherent cells (i.e., 293T, HeLa, H358 and CA1a), the culture medium was aspirated, the wells were rinsed once with PBS and the cells were detached by incubation with 0.25% Trypsin‐EDTA (ThermoFisher Scientific) for 10 min at 37°C. As THP1 are cultured in suspension, these were collected and washed once with PBS containing 2% FBS by centrifugation for 5 min at 300×g at 4°C before being similarly treated with 0.25% Trypsin‐EDTA. All the cells were then washed twice with PBS containing 2% FBS and counted using C‐slides (NanoEntek, South Korea) and the Countess® II FL automated cell counter (ThermoFisher Scientific). They were then aliquoted into a 96‐well plate and topped up to a volume of 200 μL per well with PBS containing 2% FBS and 2% Triton X‐100 (Sigma‐Aldrich). The CFSE fluorescence intensity was measured at 482 nm excitation and 527 nm emission using a Tecan Spark 10 M microplate reader (Tecan). The EV mass was calculated from the CFSE fluorescence intensity using a standard curve constructed from a series of dilutions of known CFSE‐EV concentrations. The EV mass was then converted to EV number by multiplying by 1.32 × 10⁹ (i.e., the mean number of RBCEVs in 1 μg). The final data presented was derived by subtracting the values of the binding control group incubated at 4°C from those of the treatment group incubated at 37°C.
4.14. Immunofluorescence staining
Macrophages differentiated from PBMCs on cover slips were treated with RBCEVs and fixed at different timepoints with 10% formalin. The cells were then washed with PBS containing 2% FBS prior to permeabilization with 0.1% Triton X‐100. The cells were then incubated with the appropriate primary antibody against markers for EEA, late endosomes, or lysosomes‐late endosomes (i.e., EEA, LBPA and LAMP1, respectively), followed by incubation with the appropriate secondary antibody (AlexaFluor 488/594/647‐conjugated mouse I) prior to imaging with the Olympus FV3000 confocal microscope (Olympus Corporation). Primary antibodies used for immunofluorescent staining were anti‐LAMP1 antibody (Abcam, Cat #: ab25630 or Cell Signaling Technology, Cat #: 9091S), anti‐EEA antibody (Cell Signalling Technology, Cat #: 2411S), anti‐LBPA (Sigma‐Aldrich, Cat #: MABT837), anti‐SLC48A1 (HRG1) (Thermofisher Scientific, Cat #: PA5‐42191), and anti‐human BAND 3 (Santa Cruz Biotechnology, Cat #: sc‐133190)
4.15. Live‐cell imaging
Macrophages were cultured in tissues culture‐treated μ‐plate 24 Well (ibidi GmbH, Germany). On day 7, the cells were incubated with CFSE‐labelled RBCEVs and stained with CellMask Deep Red (ThermoFisher Scientific). Then, the plate was loaded on an Olympus FV3000 confocal microscope (Olympus Corporation, Japan). 40 μg of CFSE‐labelled RBCEVs were added into the wells, after which the cells were imaged every 8 seconds. In another set of experiments, the cells were then incubated with 40 μg of CFSE‐labelled RBCEVs for 6 h, after which the RBCEVs were removed, and the macrophages were stained with LysoTracker Deep Red (ThermoFisher Scientific) for 10 min following the manufacturer's protocol and imaged using the Olympus FV3000 confocal microscope (Olympus Corporation).
4.16. Western blotting
RBCEV pellets or cell samples were lysed in RIPA buffer and incubated on ice for 10 min. 4× Laemmli buffer was added to the lysate and the mixture was incubated at 95°C for 5 min. The proteins in the RBCEV samples were separated via sodium dodecyl sulphate–polyacrylamide gel electrophoresis (SDS‐PAGE) and transferred to a polyvinylidene fluoride (PDVF) membrane. The membrane was then blocked with Tris‐buffered saline containing 5% skimmed milk and 0.1% Tween 20 (TBS‐T) before adding primary antibodies: anti‐human GAPDH antibody (Santa Cruz, Cat #: sc‐47724, dilution 1:1000) anti‐human BAND 3 (Santa Cruz, Cat #: sc‐133190, dilution 1:1000), anti‐human α‐haemoglobin (Santa Cruz, Cat #: sc‐21005, dilution 1:1000), anti‐SLC48A1/HRG1 (St John's Laboratory, Cat #: STJ196085), anti‐HMOX1 (Proteintech, Cat # 10701‐1‐AP, dilution 1:1000), anti‐ALIX (Santa Cruz, Cat #: sc‐53538, dilution 1:1000), anti‐TSG101 (Santa Cruz, Cat #: sc‐7964, dilution 1:1000), anti‐Beta Actin (Sigma‐Aldrich, Cat #: MABT523, dilution 1:1000), and anti‐human GPA (Biolegend, Cat #: 306602, dilution 1:1000). After overnight incubation at 4°C, the membrane was washed with TBS‐T and probed with the appropriate horseradish peroxidase (HRP)‐conjugated anti‐mouse and anti‐rabbit secondary antibodies (Abcam, Cat #s: ab98698 and ab99702, dilution 1:10,000) Then, enhanced chemiluminescence (ECL) was added to the membrane before imaging using a ChemiDoc™ XRS+ system (Bio‐Rad).
4.17. qPCR
Total RNA was extracted from macrophages using TRIzol™ Reagent (ThermoFisher Scientific) according to the manufacturer's instructions. The RNA was converted to cDNA using a high‐capacity cDNA reverse transcription kit (ThermoFisher Scientific) and quantified with the Ssofast® Green qPCR kit (Bio‐Rad), normalized to the expression of GAPDH, according to the manufacturers’ instructions. All the qPCR reactions were performed using a QuantStudio 6 Flex Real‐Time PCR system (Life Technologies).
4.18. OxLDL treatment, ORO staining, imaging, and quantification
PBMCs were differentiated and stimulated as described above on coverslips in 24‐well plates. For the condition with haptoglobin‐haemoglobin stimulation, the macrophages were incubated with 50 nM haptoglobin‐haemoglobin complexes along with M‐CSF for 8 days during their differentiation. Haptoglobin phenotype 1‐1 was purchased from Sigma, Singapore (H0138, Sigma). Haemoglobin was prepared from the cytosol fraction of human RBCs with one free‐thaw cycle, after which it was further enriched using Amicon centrifugation with upper and lower cutoffs of 100 and 10 kDa, respectively.
The cells were then treated with oxidized low‐density lipoprotein (Athens Research & Technology) at 20 μg/mL for 24 h. In some experiments, the cells were then collected at the appropriate time points. In other experiments, the medium was gently replaced with new medium supplemented with RBCEVs or human plasma and the cells were incubated for a further 24 h before being fixed with 10% formalin.
Cells were incubated with ORO at a concentration of 0.3% at room temperature for 10 min. They were then washed with deionized water before they were imaged using the Leica fully motorized upright imager (Leica Microsystems, Germany). The numbers of ORO‐stained cells in at least five random areas for each sample were quantified using ImageJ.
4.19. OxLDL uptake in macrophage monoculture
To study the effect of RBCEV treatment on lipid uptake by macrophages, PBMCs were differentiated into macrophages as described above in culture medium only or with RBCEVs, followed by incubation with 10 ug/mL DiI‐conjugated oxLDL (DiI‐oxLDL, Invitrogen) for 24 h. The level of DiI‐oxLDL uptake was then analyzed by flow cytometry. In a related experiment to investigate the contribution of HO‐1 to the extent of lipid uptake, the PBMCs were instead differentiated for 4–5 days in RBCEV‐free medium, followed by transfection with HO‐1 or NC ASO as described. The macrophages then underwent another 4 days of incubation with or without RBCEVs before being subjected to the same DiI‐oxLDL treatment and flow cytometry analysis.
4.20. Cholesterol efflux assay
Macrophages differentiated from PBMCs were analyzed using the Cholesterol Efflux Assay Kit (Abcam) according to the manufacturer's protocol. Briefly, the macrophages were treated with the fluorescent labelling reagent provided for 1 h and then incubated with the equilibrating reagent overnight. Human plasma treated with the serum treatment reagent provided was added to the cells as the cholesterol acceptor. The fluorescence signal present in the supernatant after 4 h was measured at Ex/Em = 493/530 nm using the Tecan Spark 10 M microplate reader (Tecan) and presented as a percentage of the total signal (cells + supernatant).
4.21. On‐chip culture of ECs and macrophages
The engineered microfluidic arterial wall‐on‐chip device was constructed according to a previous study (Su et al., 2021). Primary human aortic ECs and macrophages were co‐cultured with the subendothelial ECM in the organ chip to mimic the intima‐media interface of the arterial wall. In brief, the subendothelial ECM component of the organ chip consisting of a mixture of 3 mg/mL collagen type I (rat tail, Corning) was incubated at 37°C for 30 min for polymerization. Macrophages differentiated from monocytes for 7 days with/without RBCEVs were detached from plates with Accutase® cell detachment solution (BioLegend) and resuspended in collagen type I. These macrophages were loaded into the macrophage culture channel (2.5 million cells/mL) and incubated at 37°C for 20 min to allow the mixture to polymerize. RPMI supplemented with 10% FBS, 1% penicillin‐streptomycin, and 5 μg/mL Plasmocin™ prophylactic was then loaded into the macrophage medium channel. The EC culture channel was coated with 1 mg/mL polydopamine for 30 min at 37°C to promote EC adhesion. The coating solution was prepared by dissolving dopamine hydrochloride (Sigma) in pH 8.5 Tris‐HCI buffer. The EC channel was then washed with 1× PBS twice before the ECs were harvested and resuspended in EC growth medium‐2 (EGM‐2) BulletKit (Lonza) supplemented with 1% Penicillin‐Streptomycin. The established co‐culture‐on‐chip was incubated overnight prior to the addition of DiI‐conjugated oxLDL (20 μg/mL, Invitrogen) to the EC culture channel for 24 h. The EC and macrophage channels were then fixed with 4% paraformaldehyde (Sigma) and washed with 1× PBS twice, after which the nuclei were stained with Hoechst 33342 (1 μg/mL, Life Technologies). The cells were imaged using a fluorescence microscope (Nikon Eclipse Ti). To quantify the DiI‐oxLDL uptake density, ImageJ was employed to measure the area of cells in the fluorescence images at 20× magnification by thresholding.
4.22. Atherosclerotic mouse model study
ApoE −/− mice were obtained from Jackson Laboratory (Maine). Male mice were on a chow diet for 4 weeks. From week 5, mice were fed with a high‐fat diet (TD.88137, Teklad) for 8 weeks. Concurrently, RBCEVs were administered intravenously at the dose of 50 mg/kg twice per week. Control mice were injected with the same volume of PBS as RBCEV injection volume (100 μL). After 8 weeks of the high‐fat diet, the aortas were harvested under the microscope to remove adipose and connective tissues. The aortas were fixed in formalin overnight at 4°C and subsequently stained with ORO and imaged for quantification. Aortic roots were fixed in formalin, embedded on OCT, and stored at −80°C.
4.23. ORO staining and imaging of aorta
After fixation, the aortas were washed with PBS once and subsequently washed twice with 60% isopropanol for 5 min each on a rotating shaker. The aortas were transferred to a 60% isopropanol solution containing 0.3% ORO and incubated for 1 h at room temperature on a rotating shaker. After staining, the samples were washed with PBS. All excessive adipose and connective tissues were removed under the microscope and the aortas were cut open on a black mat. Aortas’ images were taken using a stereo microscope (Nikon Instrument Inc., Tokyo, Japan) connected to a digital camera (Olympus DP22, Olympus Corporation, Tokyo, Japan). Total plaque area was analysed from the images using ImageJ, with the color threshold analysis method.
4.24. Staining of aortic root
Aortic roots from the ApoE −/− mice fed and treated as described above were collected and fixed in 10% formalin overnight at 4°C. The aortic roots were washed with PBS and transferred into a PBS solution containing 15% sucrose and subsequently to a PBS solution containing 30% sucrose. The organs were transferred to the next solution once they had sunk to the bottom of the container. The tissues were then transferred to a small cryomold, covered with the OCT compound and put on dry ice. The heart tissues containing aortic roots were sectioned horizontally toward the aortic cusp. Once the aortic cusp appeared, sections were collected and counted from 1 to 55. Sections 1, 13, and 25 served as controls for staining. Sections 4, 7, 10, 16, 19, 22, 28, 31, 34, 39, 45, and 51 were used for staining of HO‐1 and CD68. The sections were mounted on Superfrost slides. The slides were blocked with the blocking buffer (PBS containing 2% FBS) for 40 min and then incubated with the blocking buffer containing mouse TruStain (BioLegend, Cat #: 101319) at a dilution of 1:1000 for 5 min. Antibodies against mouse HO‐1 (Proteintech, Cat #: 10701‐1‐AP) (1:400 dilution in PBS 2% FBS, 0.1% Triton‐X100) and against mouse CD68 (Bio‐Rad, Cat #: MCA1957) (1:600 dilution in PBS 2% FBS, 0.1% Triton‐X100) were applied and the slides were incubated for 1 h at room temperature and then washed with the wash buffer (PBS containing 2% FBS). AlexaFluor 488‐Anti mouse IgG secondary antibody (Jackson ImmunoResearch, Cat #: 711‐545‐152) and AlexaFluor 594‐Anti rat IgG secondary antibody (1:500 dilution in in PBS 2% FBS, 0.1% Triton‐X100) were applied for 1 h at room temperature and then washed with the wash buffer. The nuclei were stained with Hoechst 33342 (1 μg/mL, Life Technologies) in PBS for 10 min at room temperature. The sections were then treated with Vector® TrueVIEW® Autofluorescence Quenching Kit (SP‐8400‐15), followed by washing with PBS and water. The slides were then mounted under coverslips using the Vectashield antifade medium (Vector laboratories, Cat #: H‐1000‐10) and imaged using the Leica Thunder Imager (10x objective lenses).
4.25. Image analysis
All images were analyzed using ImageJ software version 1.53 (https://imagej.nih.gov/ij/download.html). Images were converted into 16‐bit depth images and the threshold was set based on the unstained samples. The signal intensity per cell for an immunolabelled protein was calculated by multiplying the total fluorescent intensity with the area containing pixels above the threshold. Colocalization was analyzed using Mander's overlap coefficient for signals above the set thresholds. The number of HRG1 clusters was counted using the particle analysis function with the cluster size range set to 1–50 μm2.
4.26. Statistical analysis
Statistical tests were performed using built‐in features in Prism 9 (GraphPad Software). Two‐tailed Student's t‐test was carried out for comparison of two groups. For comparison of more than two groups, one‐way or two‐way analysis of variance (ANOVA) was conducted with additional post hoc testing between the groups. Data are presented as the mean ± SD. Detailed test methods, group sizes, and testing parameters are described in the figure legends.
CONFLICT OF INTEREST STATEMENT
Minh TN Le is a scientific co‐founder, and advisor of Carmine Therapeutics, a company for gene therapies. Other authors do not declare any conflict of interest.
Supporting information
Supporting Information
Video S1
Video S2
ACKNOWLEDGEMENTS
We would like to thank the Health Sciences Authority in Singapore for providing blood samples. We wish to thank Leony Darmawan, Priscilla Wong, Claudine Lim, Choon Keong Lee, Desy Silviana and Xiangliang Lin at ESCO Aster (Singapore) for obtaining and processing blood samples. We also thank our colleagues, Prof. Bazan Guillermo Carlos, A/Prof. Veronique Angeli, Dr. Jiahai Shi, Dr. Lingzhi Wang, A/Prof. Edward Chow, Prof. Fred Wong (National University of Singapore), Prof. Judy Lieberman (Harvard Medical School), A/Prof. Anh Tuan Nguyen and Dr. Sarah Ho (Hong Kong University of Science and Technology) for providing various reagents and advice. We further acknowledge Carmine Therapeutics for providing reagents and equipment. We also appreciate help from Chen Huan, Dai Phung, Hui Jun Ting, Lim Sheau Yng, Sarah Joelle Cox, Xuan Dang, Phuong Nguyen, Trinh Tran, Wen Xiu Loh, Zhiyuan Wu, Eric Yeo, Yudi Wisantoso, Annie Hsu, and Poonam Rai (National University of Singapore). Schematic drawings were created using BioRender.com. Dr. Vinh Do is supported by the Resilient & Growth fellowship (NRF‐MP‐2020‐0004), funded by the National Science Foundation of Singapore. Boya Peng is supported by the NUSMed postdoctoral fellowship (NUSMED/2021/PDF/05), funded by the Singapore Ministry of Education.
Pham, T. T. , Le, A. H. , Dang, C. P. , Chong, S. Y. , Do, D. V. , Peng, B. , Jayasinghe, M. K. , Hoang, D. V. , Louise, R. A. , Ong, H. B. , Loh, Y.‐H , Hou, H. W. , Wang, J.‐W. , & Le, M. TN. (2023). Endocytosis of red blood cell extracellular vesicles by macrophages leads to cytoplasmic heme release and prevents foam cell formation in atherosclerosis. Journal of Extracellular Vesicles, 12, e12353. 10.1002/jev2.12354
Thach Tuan Pham and Anh Hong Le contributed equally to this work.
REFERENCES
- Araujo, J. A. , Zhang, M. , & Yin, F. (2012). Heme oxygenase‐1, oxidation, inflammation, and atherosclerosis. Frontiers in Pharmacology, 3, 119. [DOI] [PMC free article] [PubMed] [Google Scholar]
- Bebelman, M. P. , Smit, M. J. , Pegtel, D. M. , & Baglio, S. R. (2018). Biogenesis and function of extracellular vesicles in cancer. Pharmacology & Therapeutics, 188, 1–11. 10.1016/j.pharmthera.2018.02.013 [DOI] [PubMed] [Google Scholar]
- Boyle, J. J. , Harrington, H. A. , Piper, E. , Elderfield, K. , Stark, J. , Landis, R. C. , & Haskard, D. O. (2009). Coronary intraplaque hemorrhage evokes a novel atheroprotective macrophage phenotype. The American Journal of Pathology, 174(3), 1097–1108. [DOI] [PMC free article] [PubMed] [Google Scholar]
- Buzás, E. I. , Tóth, E. Á. , Sódar, B. W. , & Szabó‐Taylor, K. É. (2018). Molecular interactions at the surface of extracellular vesicles, Seminars in Immunopathology, 40(5), 453–464. [DOI] [PMC free article] [PubMed] [Google Scholar]
- Chen, H. , Jayasinghe, M. K. , Yeo, E. Y. M. , Wu, Z. , Pirisinu, M. , Usman, W. M. , Pham, T. T. , Lim, K. W. , Tran, N. V. , Leung, A. Y. H. , Du, X. , Zhang, Q. , Phan, A. T. , & Le, M. T. N. (2022). cd33 ‐targeting extracellular vesicles deliver antisense oligonucleotides against flt3‐itd and mir ‐125b for specific treatment of acute myeloid leukaemia. Cell Proliferation, 55(9), e13255. 10.1111/cpr.13255 [DOI] [PMC free article] [PubMed] [Google Scholar]
- Fabriek, B. O. , Dijkstra, C. D. , & van den Berg, T. K. (2005). The macrophage scavenger receptor CD163. Immunobiology, 210(2–4), 153–160. [DOI] [PubMed] [Google Scholar]
- Fadok, V. A. , Voelker, D. R. , Campbell, P. A. , Cohen, J. J. , Bratton, D. L. , & Henson, P. M. (1992). Exposure of phosphatidylserine on the surface of apoptotic lymphocytes triggers specific recognition and removal by macrophages. The Journal of Immunology, 148(7), 2207. [PubMed] [Google Scholar]
- Finn, A. V. , Nakano, M. , Polavarapu, R. , Karmali, V. , Saeed, O. , Zhao, X. , Yazdani, S. , Otsuka, F. , Davis, T. , & Habib, A. (2012). Haemoglobin directs macrophage differentiation and prevents foam cell formation in human atherosclerotic plaques. Journal of the American College of Cardiology, 59(2), 166–177. [DOI] [PMC free article] [PubMed] [Google Scholar]
- Guo, L. , Akahori, H. , Harari, E. , Smith, S. L. , Polavarapu, R. , Karmali, V. , Otsuka, F. , Gannon, R. L. , Braumann, R. E. , Dickinson, M. H. , Gupta, A. , Jenkins, A. L. , Lipinski, M. J. , Kim, J. , Chhour, P. , de Vries, P. S. , Jinnouchi, H. , Kutys, R. , Mori, H. , … & Finn, A. V. (2018). CD163+ macrophages promote angiogenesis and vascular permeability accompanied by inflammation in atherosclerosis. Journal of Clinical Investigation, 128(3), 1106–1124. 10.1172/JCI93025 [DOI] [PMC free article] [PubMed] [Google Scholar]
- Guo, L. , Harari, E. , Virmani, R. , & Finn, A. V. (2017). Linking hemorrhage, angiogenesis, macrophages, and iron metabolism in atherosclerotic vascular diseases. Arteriosclerosis, Thrombosis, and Vascular Biology, 37(4), e33–e39. 10.1161/ATVBAHA.117.309045 [DOI] [PubMed] [Google Scholar]
- Han, C. , Zhou, J. , Liang, C. , Liu, B. , Pan, X. , Zhang, Y. , Wang, Y. , Yan, B. , Xie, W. , Liu, F. , Yu, X.‐Y. , & Li, Y. (2019). Human umbilical cord mesenchymal stem cell derived exosomes encapsulated in functional peptide hydrogels promote cardiac repair. Biomaterials Science, 7(7), 2920–2933. 10.1039/C9BM00101H [DOI] [PubMed] [Google Scholar]
- Harel‐Adar, T. , Mordechai, T. B. , Amsalem, Y. , Feinberg, M. S. , Leor, J. , & Cohen, S. (2011). Modulation of cardiac macrophages by phosphatidylserine‐presenting liposomes improves infarct repair. Proceedings of the National Academy of Sciences, 108(5), 1827–1832. [DOI] [PMC free article] [PubMed] [Google Scholar]
- Heo, J. S. , & Kim, S. (2022). Human adipose mesenchymal stem cells modulate inflammation and angiogenesis through exosomes. Scientific Reports, 12(1), 2776. 10.1038/s41598-022-06824-1 [DOI] [PMC free article] [PubMed] [Google Scholar]
- Herrmann, I. K. , Wood, M. J. A. , & Fuhrmann, G. (2021). Extracellular vesicles as a next‐generation drug delivery platform. Nature Nanotechnology, 16(7), 748–759. [DOI] [PubMed] [Google Scholar]
- Heusermann, W. , Hean, J. , Trojer, D. , Steib, E. , von Bueren, S. , Graff‐Meyer, A. , Genoud, C. , Martin, K. , Pizzato, N. , Voshol, J. , Morrissey, D. V. , Andaloussi, S. E. L. , Wood, M. J. , & Meisner‐Kober, N. C. (2016). Exosomes surf on filopodia to enter cells at endocytic hot spots, traffic within endosomes, and are targeted to the ER. Journal of Cell Biology, 213(2), 173–184. 10.1083/jcb.201506084 [DOI] [PMC free article] [PubMed] [Google Scholar]
- Huynh, M.‐L. N. , Fadok, V. A. , & Henson, P. M. (2002). Phosphatidylserine‐dependent ingestion of apoptotic cells promotes TGF‐β1 secretion and the resolution of inflammation. The Journal of Clinical Investigation, 109(1), 41–50. [DOI] [PMC free article] [PubMed] [Google Scholar]
- Ishikawa, K. , Navab, M. , & Lusis, A. J. (2012). Vasculitis, atherosclerosis, and altered HDL composition in heme‐oxygenase‐1‐knockout mice. International Journal of Hypertension, 2012, 948203. [DOI] [PMC free article] [PubMed] [Google Scholar]
- Ishikawa, K. , Sugawara, D. , Wang, X. , Suzuki, K. , Itabe, H. , Maruyama, Y. , & Lusis, A. J. (2001). Heme oxygenase‐1 inhibits atherosclerotic lesion formation in LDL‐receptor knockout mice. Circulation Research, 88(5), 506–512. [DOI] [PubMed] [Google Scholar]
- Jayasinghe, M. K. , Pirisinu, M. , Yang, Y. , Peng, B. , Pham, T. T. , Lee, C. Y. , Tan, M. , Vu, L. T. , Dang, X. T. , Pham, T. C. , Chen, H. , Leung, A. Y. H. , Cho, W. C. , Shi, J. , & Le, M. T. (2022). Surface‐engineered extracellular vesicles for targeted delivery of therapeutic RNAs and peptides for cancer therapy. Theranostics, 12(7), 3288–3315. 10.7150/thno.68667 [DOI] [PMC free article] [PubMed] [Google Scholar]
- Jeney, V. , Balla, J. , Yachie, A. , Varga, Z. , Vercellotti, G. M. , Eaton, J. W. , & Balla, G. (2002). Pro‐oxidant and cytotoxic effects of circulating heme. Blood, The Journal of the American Society of Hematology, 100(3), 879–887. [DOI] [PubMed] [Google Scholar]
- Joshi, B. S. , de Beer, M. A. , Giepmans, B. N. G. , & Zuhorn, I. S. (2020). Endocytosis of extracellular vesicles and release of their cargo from endosomes. ACS Nano, 14(4), 4444–4455. 10.1021/acsnano.9b10033 [DOI] [PMC free article] [PubMed] [Google Scholar]
- Juan, S.‐H. , Lee, T.‐S. , Tseng, K.‐W. , Liou, J.‐Y. , Shyue, S.‐K. , Wu, K. K. , & Chau, L.‐Y. (2001). Adenovirus‐mediated heme oxygenase‐1 gene transfer inhibits the development of atherosclerosis in apolipoprotein E–deficient mice. Circulation, 104(13), 1519–1525. [DOI] [PubMed] [Google Scholar]
- Kishimoto, Y. , Kondo, K. , & Momiyama, Y. (2019). The protective role of heme oxygenase‐1 in atherosclerotic diseases. International Journal of Molecular Sciences, 20(15), 3628. [DOI] [PMC free article] [PubMed] [Google Scholar]
- Li, G. , Kim, J. , Huang, Z. , St Clair, J. R. , Brown, D. A. , & London, E. (2016). Efficient replacement of plasma membrane outer leaflet phospholipids and sphingolipids in cells with exogenous lipids. Proceedings of the National Academy of Sciences, 113(49), 14025–14030. 10.1073/pnas.1610705113 [DOI] [PMC free article] [PubMed] [Google Scholar]
- Mills, C. (2012). M1 and M2 macrophages: Oracles of health and disease. Critical ReviewsTM in Immunology, 32(6), 463–88. [DOI] [PubMed] [Google Scholar]
- Mulcahy, L. A. , Pink, R. C. , & Carter, D. R. F. (2014). Routes and mechanisms of extracellular vesicle uptake. Journal of Extracellular Vesicles, 3(1), 24641. [DOI] [PMC free article] [PubMed] [Google Scholar]
- Orozco, L. D. , Kapturczak, M. H. , Barajas, B. , Wang, X. , Weinstein, M. M. , Wong, J. , Deshane, J. , Bolisetty, S. , Shaposhnik, Z. , & Shih, D. M. (2007). Heme oxygenase‐1 expression in macrophages plays a beneficial role in atherosclerosis. Circulation Research, 100(12), 1703–1711. [DOI] [PubMed] [Google Scholar]
- Otterbein, L. E. , Bach, F. H. , Alam, J. , Soares, M. , Lu, H. T. , Wysk, M. , Davis, R. J. , Flavell, R. A. , & Choi, A. M. (2000). Carbon monoxide has anti‐inflammatory effects involving the mitogen‐activated protein kinase pathway. Nature Medicine, 6(4), 422–428. [DOI] [PubMed] [Google Scholar]
- Parolini, I. , Federici, C. , Raggi, C. , Lugini, L. , Palleschi, S. , De Milito, A. , Coscia, C. , Iessi, E. , Logozzi, M. , Molinari, A. , Colone, M. , Tatti, M. , Sargiacomo, M. , & Fais, S. (2009). Microenvironmental pH is a key factor for exosome traffic in tumor cells. Journal of Biological Chemistry, 284(49), 34211–34222. 10.1074/jbc.M109.041152 [DOI] [PMC free article] [PubMed] [Google Scholar]
- Peng, B. , Nguyen, T. M. , Jayasinghe, M. K. , Gao, C. , Pham, T. T. , Vu, L. T. , Yeo, E. Y. M. , Yap, G. , Wang, L. , Goh, B. C. , Tam, W. L. , Luo, D. , & Le, M. T. (2022). Robust delivery of RIG‐I agonists using extracellular vesicles for anti‐cancer immunotherapy. Journal of Extracellular Vesicles, 11(4), e12187. 10.1002/jev2.12187 [DOI] [PMC free article] [PubMed] [Google Scholar]
- Pham, T. C. , Jayasinghe, M. K. , Pham, T. T. , Yang, Y. , Wei, L. , Usman, W. M. , Chen, H. , Pirisinu, M. , Gong, J. , Kim, S. , Peng, B. , Wang, W. , Chan, C. , Ma, V. , Nguyen, N. T. H. , Kappei, D. , Nguyen, X. , Cho, W. C. , Shi, J. , & Le, M. T. N. (2021). Covalent conjugation of extracellular vesicles with peptides and nanobodies for targeted therapeutic delivery. Journal of Extracellular Vesicles, 10(4), e12057. 10.1002/jev2.12057 [DOI] [PMC free article] [PubMed] [Google Scholar]
- Richter, M. , Vader, P. , & Fuhrmann, G. (2021). Approaches to surface engineering of extracellular vesicles. Advanced Drug Delivery Reviews, 173, 416–426. 10.1016/j.addr.2021.03.020 [DOI] [PubMed] [Google Scholar]
- Salzar, R. S. , Thubrikar, M. J. , & Eppink, R. T. (1995). Pressure‐induced mechanical stress in the carotid artery bifurcation: A possible correlation to atherosclerosis. Journal of Biomechanics, 28(11), 1333–1340. 10.1016/0021-9290(95)00005-3 [DOI] [PubMed] [Google Scholar]
- Stocker, R. , Yamamoto, Y. , McDonagh, A. F. , Glazer, A. N. , & Ames, B. N. (1987). Bilirubin is an antioxidant of possible physiological importance. Science, 235(4792), 1043–1046. [DOI] [PubMed] [Google Scholar]
- Su, C. , Menon, N. V. , Xu, X. , Teo, Y. R. , Cao, H. , Dalan, R. , Tay, C. Y. , & Hou, H. W. (2021). A novel human arterial wall‐on‐a‐chip to study endothelial inflammation and vascular smooth muscle cell migration in early atherosclerosis. Lab on a Chip, 21(12), 2359–2371. 10.1039/D1LC00131K [DOI] [PubMed] [Google Scholar]
- Tanaka, Y. , & Schroit, A. J. (1983). Insertion of fluorescent phosphatidylserine into the plasma membrane of red blood cells. Recognition by autologous macrophages. Journal of Biological Chemistry, 258(18), 11335–11343. 10.1016/S0021-9258(17)44422-X [DOI] [PubMed] [Google Scholar]
- Tkach, M. , & Théry, C. (2016). Communication by extracellular vesicles: Where we are and where we need to go. Cell, 164(6), 1226–1232. 10.1016/j.cell.2016.01.043 [DOI] [PubMed] [Google Scholar]
- Tripisciano, C. , Weiss, R. , Karuthedom George, S. , Fischer, M. B. , & Weber, V. (2020). Extracellular vesicles derived from platelets, red blood cells, and monocyte‐like cells differ regarding their ability to induce factor XII‐dependent thrombin generation. Frontiers in Cell and Developmental Biology, 8, 298. https://www.frontiersin.org/articles/10.3389/fcell.2020.00298 [DOI] [PMC free article] [PubMed] [Google Scholar]
- Usman, W. M. , Pham, T. C. , Kwok, Y. Y. , Vu, L. T. , Ma, V. , Peng, B. , Chan, Y. S. , Wei, L. , Chin, S. M. , Azad, A. , He, A. B.‐L. , Leung, A. Y. H. , Yang, M. , Shyh‐Chang, N. , Cho, W. C. , Shi, J. , & Le, M. T. N. (2018). Efficient RNA drug delivery using red blood cell extracellular vesicles. Nature Communications, 9(1), 2359. 10.1038/s41467-018-04791-8 [DOI] [PMC free article] [PubMed] [Google Scholar]
- Vahedi, A. , Bigdelou, P. , & Farnoud, A. M. (2020). Quantitative analysis of red blood cell membrane phospholipids and modulation of cell‐macrophage interactions using cyclodextrins. Scientific Reports, 10(1), 15111. 10.1038/s41598-020-72176-3 [DOI] [PMC free article] [PubMed] [Google Scholar]
- Van Niel, G. , d'Angelo, G. , & Raposo, G. (2018). Shedding light on the cell biology of extracellular vesicles. Nature Reviews Molecular Cell Biology, 19(4), 213–228. [DOI] [PubMed] [Google Scholar]
- Verdera, H. C. , Gitz‐Francois, J. J. , Schiffelers, R. M. , & Vader, P. (2017). Cellular uptake of extracellular vesicles is mediated by clathrin‐independent endocytosis and macropinocytosis. Journal of Controlled Release, 266, 100–108. 10.1016/j.jconrel.2017.09.019 [DOI] [PubMed] [Google Scholar]
- White, C. , Yuan, X. , Schmidt, P. J. , Bresciani, E. , Samuel, T. K. , Campagna, D. , Hall, C. , Bishop, K. , Calicchio, M. L. , Lapierre, A. , Ward, D. M. , Liu, P. , Fleming, M. D. , & Hamza, I. (2013). HRG1 is essential for heme transport from the phagolysosome of macrophages during erythrophagocytosis. Cell Metabolism, 17(2), 261–270. 10.1016/j.cmet.2013.01.005 [DOI] [PMC free article] [PubMed] [Google Scholar]
- Yang, S. , Yuan, H.‐Q. , Hao, Y.‐M. , Ren, Z. , Qu, S.‐L. , Liu, L.‐S. , Wei, D.‐H. , Tang, Z.‐H. , Zhang, J.‐F. , & Jiang, Z.‐S. (2020). Macrophage polarization in atherosclerosis. Clinica Chimica Acta, 501, 142–146. 10.1016/j.cca.2019.10.034 [DOI] [PubMed] [Google Scholar]
- Zarins, C. K. , Giddens, D. P. , Bharadvaj, B. K. , Sottiurai, V. S. , Mabon, R. F. , & Glagov, S. (1983). Carotid bifurcation atherosclerosis. Quantitative correlation of plaque localization with flow velocity profiles and wall shear stress. Circulation Research, 53(4), 502–514. 10.1161/01.RES.53.4.502 [DOI] [PubMed] [Google Scholar]
- Zhang, G. , Huang, X. , Xiu, H. , Sun, Y. , Chen, J. , Cheng, G. , Song, Z. , Peng, Y. , Shen, Y. , Wang, J. , & Cai, Z. (2020). Extracellular vesicles: Natural liver‐accumulating drug delivery vehicles for the treatment of liver diseases. Journal of Extracellular Vesicles, 10(2), e12030. 10.1002/jev2.12030 [DOI] [PMC free article] [PubMed] [Google Scholar]
- Zhang, X. , Zhang, H. , Gu, J. , Zhang, J. , Shi, H. , Qian, H. , Wang, D. , Xu, W. , Pan, J. , & Santos, H. A. (2021). Engineered extracellular vesicles for cancer therapy. Advanced Materials, 33(14), 2005709. 10.1002/adma.202005709 [DOI] [PubMed] [Google Scholar]
- Zhang, Y. , Cliff, W. J. , & Higginst, G. (1993). Immunohistochemical study of intimal microvessels in coronary atherosclerosis, The American Journal of Pathology, 143(1), 164–72. [PMC free article] [PubMed] [Google Scholar]
- Zhou, C. , Chia, G. W. , Ho, J. C. , Moreland, A. S. , Seviour, T. , Liedberg, B. , Parikh, A. N. , Kjelleberg, S. , Hinks, J. , & Bazan, G. C. (2019). A chain‐elongated oligophenylenevinylene electrolyte increases microbial membrane stability. Advanced Materials, 31(18), 1808021. [DOI] [PubMed] [Google Scholar]
- Zhou, C. , Li, Z. , Zhu, Z. , Chia, G. W. , Mikhailovsky, A. , Vázquez, R. J. , Chan, S. J. , Li, K. , Liu, B. , & Bazan, G. C. (2022). Conjugated oligoelectrolytes for long‐term tumor tracking with incremental NIR‐II emission. Advanced Materials, 34, 2201989. [DOI] [PubMed] [Google Scholar]
Associated Data
This section collects any data citations, data availability statements, or supplementary materials included in this article.
Supplementary Materials
Supporting Information
Video S1
Video S2