

Abstract
Large area sampling approaches have been developed and implemented by the US Environ-mental Protection Agency (EPA) to increase sample sizes, and potentially representativeness, in outdoor urban environments (e.g., concrete, asphalt, grass/ landscaping). These sampling approaches could be implemented in response to an outdoor biological contamination incident or bioterrorism attack to determine the extent of contamination and for clearance following remediation. However, sample collection over large areas often contains an extensive amount of co-collected debris and native background microorganisms that interfere with the detection of biological threat agents. Sample processing methods that utilize basic laboratory equipment amenable to field deployment were selected and applied to turbid aqueous samples (TAS) to reduce particulates and native environmental organisms prior to culture and rapid viability-polymerase chain reaction (RV-PCR) analytical methods. Bacillus anthracis Sterne (BaS) spores were spiked into TAS collected by soil grab, wet vacuum collection from an outdoor concrete surface, or storm water runoff from an urban parking lot. The implementation of a sample processing method improved the sensitivity of culture and RV-PCR analytical methods for BaS spore detection in soil and wet vacuum TAS samples compared to baseline (minimal to no field processing methods applied). For soil, when the processing method was applied, samples with 15 colony forming units (CFU)/ml (60 CFU/g) and 1.5 CFU/mL (6 CFU/g) BaS spore load were detected using culture and RV-PCR, respectively. Most notably, the processing methods greatly improved the sensitivity of the RV-PCR analytical method for the wet vacuum TAS from no detection at the 1500 CFU/mL BaS spore load level to as low as 1.5 CFU/mL BaS spore load.
Keywords: Bacillus anthracis, Surface sampling, Soil samples, Wet vacuum samples, Storm water runoff samples, Rapid viability-polymerase chain reaction
Introduction
Following a bioterrorism attack, materials contaminated with biological agent pose significant health threats. Numerous methods have been developed for collection, detection, and characterization of biological agents in the environment following a bioterrorism incident. The sampling methods employed generally cover a small area (i.e., 645 to 929 cm2) for sponge-sticks and 37-mm vacuum filter cassettes and are time-consuming, particularly for vacuum filter cassettes, which can take ~5 min to collect (Calfee et al., 2013; Rose et al., 2011). Recently, sampling approaches such as the use of robotic vacuums, wet vacuums, or matrix-specific grab sampling of storm water runoff, soil, or vegetation have been developed and implemented by the US Environmental Protection Agency (EPA) to increase sample sizes, and potential representativeness, in outdoor urban environments (e.g., concrete, asphalt, grass/landscaping) (EPA, 2021; Lee, 2018; Mikelonis et al., 2020; Silvestri et al., 2016). However, sample collection over larger areas often results in samples containing substantial amounts of co-collected debris (particulates, organic materials, incidental biota, and non-target constituents) and native background microorganisms that complicate analytical methods used to quantify and/or detect target analytes such as Bacillus anthracis (Ba) endospores (spores).
Large area sampling approaches, especially the use of wet vacuums and the collection of storm water, generate turbid aqueous sample (TAS), which are also generated following the addition of extraction buffer to soil or vegetation samples to partition Ba analytes to the liquid phase for analysis. In either case, TAS pose challenges to separate and detect Ba spores due to the complexity of the matrix. Sample processing methods used to separate and recover Ba spores from the non-target compounds and particulates found in TAS are therefore needed to increase the robustness and sensitivity of analytical methods that may be applicable to TAS.
The primary objective of TAS processing methods is the separation and recovery of target biothreat agents, with other benefits of reducing interferents and sample processing challenges (e.g., filter clogging, high background microorganisms), as well as delivering sufficient concentrations of target bio-threat agent in the final eluate to improve the limit of detection. Furthermore, analytical laboratories often require receipt of samples that require minimal/no processing. Therefore, it is advantageous for sample processing methods to be applied in the field or mobile laboratory with available resources and technician skills typical of a large-scale biological contamination incident response operation (i.e., basic laboratory equipment capable of mobilization).
Processing methods have previously been divided into two types, direct and indirect, for the recovery of Ba spores from difficult samples such as soil (Silvestri et al., 2015). Direct sample processing methods include the culturing of Ba on selective agar or bulk DNA extraction techniques that would be implemented in analytical laboratories, which was not the focus here. Indirect sample processing methods involve separating the Ba spores from the matrix within an aqueous carrier (e.g., buffers, chelating agents, surfactants, salts, emulsifiers) either during sampling (e.g., wet vacuum) or as an initial processing step to promote detachment of spores from TAS particles. These steps may be followed by physical separation of Ba from the TAS matrix through filtration, low- and high-speed centrifugation, or other means such as immunomagnetic separation utilizing anti-Ba spore antibodies associated with magnetic beads to capture and concentrate Ba spores (Silvestri et al., 2015). The addition of heat treatment/ shock and chemical treatment with ethanol has been described previously to reduce background vegetative cells without reducing the viability of Ba spores at 63 °C for 20 min and 50% ethanol for 60 min (Dragon & Rennie, 2001) with temperatures best kept ≤ 70 °C (Turnbull et al., 2007). Specifically, this study used heat at 70 C for 1 h or ethanol at ≤ 30% to reduce vegetative cells. Owing to the complexity of soil matrices, sample processing methods under consideration initially included acid digestion, accelerated solvent extraction, and the use of protein targets rather than DNA, but these methods required a higher level of analytical instrumentation and increased sample sizes and therefore were excluded for evaluation.
To evaluate potential processing methods for use during an on-site response to a biological contamination incident, three TAS types were generated from real-world samples: (1) soil extraction, (2) collection of storm water runoff from an urban parking lot, and (3) collection of a wet vacuum sample from a concrete sidewalk in an urban environment. A subset of the aforementioned sample processing steps was included in an experimental evaluation of their effectiveness in decreasing the background microbial levels and/or inert material of the TAS, with the objective of improving the analytical laboratory workflow and the detectability of Ba using culture and rapid viability-polymerase chain reaction (RV-PCR) analytical methods.
Materials and methods
Bacillus anthracis endospores and turbid aqueous samples
Bacillus anthracis Sterne 34F2 (BaS) from BEI Resources (NR-1400) endospores (spores) were prepared by inoculating 500 mL of sporulation medium with 50 mL of an overnight culture of BaS grown in Brain Heart Infusion Broth (BHIB; BD BBL™ 237,500) in baffled 3-L Fernbach flasks at 36 ± 2 °C and 200 rpm for a minimum of 72 h until > 90% of spores appeared phase bright under phase contrast microscopy. The sporulation medium was modified G medium (Kim & Goepfert, 1974). The sporulated culture was pelleted, suspended in sterile deionized (DI) water, heat shocked for 1 h at 60 °C, and then washed twice using sterile DI water before being suspended in sterile DI water. All centrifugation steps were performed at 10,000 × g for 12 min. Spores were spread plated and streaked on Trypticase Soy Agar with sheep blood (SBA) pre- and post-heat shock to assess spore maturity (resistance to heat) and purity (single morphology). Spore stocks were stored in single-use aliquots at 2 to 8 °C.
Spore stocks were diluted in phosphate-buffered saline with 0.05% Tween™ 20, pH 7.4 (PBST) and used to directly inoculate TAS on the same day as the processing methods were applied. For soil samples, spores were spiked onto 10 g of soil to obtain four final concentrations differing by tenfold BaS spore load ranging from 1.5 to 1500 colony-forming units (CFU)/mL following the addition of 40 mL of PBST. For wet vacuum and storm water runoff samples, spores were spiked into the TAS to obtain four final concentrations differing by tenfold BaS spore load ranging from 1.5 to 1500 CFU/mL for wet vacuum and 0.07 to 67 CFU/mL for storm water runoff, respectively. Spore spiking stocks were enumerated on SBA each day of spiking samples to check the concentration for accuracy and purity. Zero-spike TAS were processed, and PBS was inoculated as a positive control for all processing methods. All samples were processed in triplicate unless otherwise noted.
Soil used in this study was a model soil purchased from Agvise Laboratories, Inc. (Benson, MN) collected from Site ID HCB-SL-PF in eastern North Dakota and is characterized as a loam soil (41% sand, 39% silt, 20% clay) with 5.2% organic matter, pH 8.1, and 24.6% moisture.
Storm water was collected at the edge of an asphalt parking lot in Columbus, OH. Plastic 18.9-L (5-gallon) buckets (5-gallon Plastic General Bucket, Lowes, Charlotte, NC) were cleaned with detergent and water, wiped with a dilute bleach solution, wiped with isopropyl alcohol, and rinsed with DI water. During a rain event, the grate from a storm drain was removed and the 18.9-L bucket was lowered into the flow of storm water and filled. Storm water flow at the time of sampling was ~75 L per min. Samples were refrigerated at 2 to 8 °C until laboratory analysis.
Wet vacuum samples were collected from a concrete surface in an urban environment in Columbus, OH, following a method used previously by EPA for similar wet vacuum sample collections (Lee, 2018; Mikelonis et al., 2020). Carboys containing 0.05% Tween 20 (Tween 20, Ultrapure, Thermo Scientific, Waltham, MA) solution were prepared and used as the clean wet vacuum surface wetting solution. A concrete sidewalk in an urban area of Columbus, OH, was chosen as the sampling location. The sidewalk was marked into 2.3-m2 (25-ft2) segments. A wet vacuum (Red Power Scrub Deluxe Carpet Cleaner Machine, Hoover, Solon, OH) was used to collect samples from 15 different segments. The wet vacuum was operated as recommended by the manufacturer with the clean solution being sprayed when the unit is moved backward, and as the unit was moved forward in the same path, only the vacuum was operated (with no additional spray). Half of the width of the vacuum was overlapped for each subsequent pass. To ensure sampling coverage, each 2.3-m2 segment was sampled first in one direction and when completed, sampled again in the same manner, but shifted by 90°. On average, a total of 1.9 L of the clean 0.05% Tween 20 solution was dispensed onto each segment and 1.4 L was vacuum collected over a sampling time of ~6 to 7 min per segment. Overall, 21.4 L of wet vacuum sample was collected. The solution was observably extremely turbid and 0.2 L of insoluble particles were collected that settled to the bottom of the sample container.
Processing methods
Processing methods for each TAS were downselected with an emphasis on the following: (1) spore recovery (e.g., reducing particulates, reducing environmental microorganisms, and disassociating BaS spores from particulates) and (2) operational logistics (i.e., using simple equipment and procedures that could be performed by field personnel with a range of skill levels). Following an actual Ba contamination incident, these samples would potentially be processed in the field and shipped to an analytical laboratory for culture and RV-PCR analyses. Field-deployable equipment included an analytical balance, vortex mixer, bath sonicator, swinging bucket centrifuge, water bath, and pipette-aid.
For soil and wet vacuum collections, a baseline method, with minimal to no field processing methods applied, was included for comparison to the processing method so that method improvement could be determined. The storm water runoff collected for this study did not contain levels of particulates that led to filtration clogging or native background microorganisms that interfered with the laboratory analytical methods, and therefore, a processing method was not applied. The modified baseline method for storm water runoff and wet vacuum samples followed the analytical methods as described in the EPA Protocol for Detection of Bacillus anthracis in Environmental Samples During the Remediation Phase of an Anthrax Incident, 2nd edition (Shah, 2017) (also referred to here as the EPA Protocol) for culture and RV-PCR analytical methods starting with the secondary water concentration step with the following modifications.For secondary concentration, (1) a single volume (≤ 900 mL) was concentrated for up to 30 min on a mixed cellulose ester (MCE) membrane (MicroFunnel™ Filter Funnel, Pall Corporation, Washington, NY, Cat. 4800), (2) the spores were recovered from the MCE membrane following the RV-PCR spore recovery method (MCE placed in a 50-mL centrifuge tube) followed by two sequential 10-mL vortex steps using PBST with 30% ethanol (PBSTE), and (3) the samples were split in half (10 mL each) for culture and RV-PCR analytical methods. For the culture analytical method, modifications included pipetting 25 mL BHIB onto an MCE membrane for culture enrichment without additional neat and serial dilution volume added and various ≥ 1-mL volumes and 0.1 mL of neat and/or 1:10 serial dilutions were spread plated onto SBA for culture depending on spike level and background microbial load. These methods are referred to as the storm water–modified baseline (SWMB) and wet vacuum–modified baseline (WVMB). For storm water runoff, this SWMB was compared to the EPA protocol without modification (later referred to as the storm water reference baseline (SWRB) method), meaning 450 mL was concentrated onto two separate MCE membranes, and then each membrane was recovered and processed according to the culture and RV-PCR analytical methods as described (Shah, 2017).
For soil, the baseline method consisted of weighing 10 g of soil in a 50-mL centrifuge tube, hydrating with 40 mL of PBST, vortex-mixing for 30 s, manually shaking for 2 min followed by a 30-min room temperature settling period, and pouring supernatant into 50-mL centrifuge tubes (later referred to as the soil baseline method (SBM)). The soil processing method (SPM) consisted of the baseline method with an additional bath sonication for 10 min to disaggregate particles, a 5-min swinging bucket, 1000 × g centrifugation step instead of the 30-min settle, and a heat shock for 1 h at 70 °C to reduce background microbial load, and a pipette-aid was used for transferring supernatant (Fig. 1a).
Fig. 1.
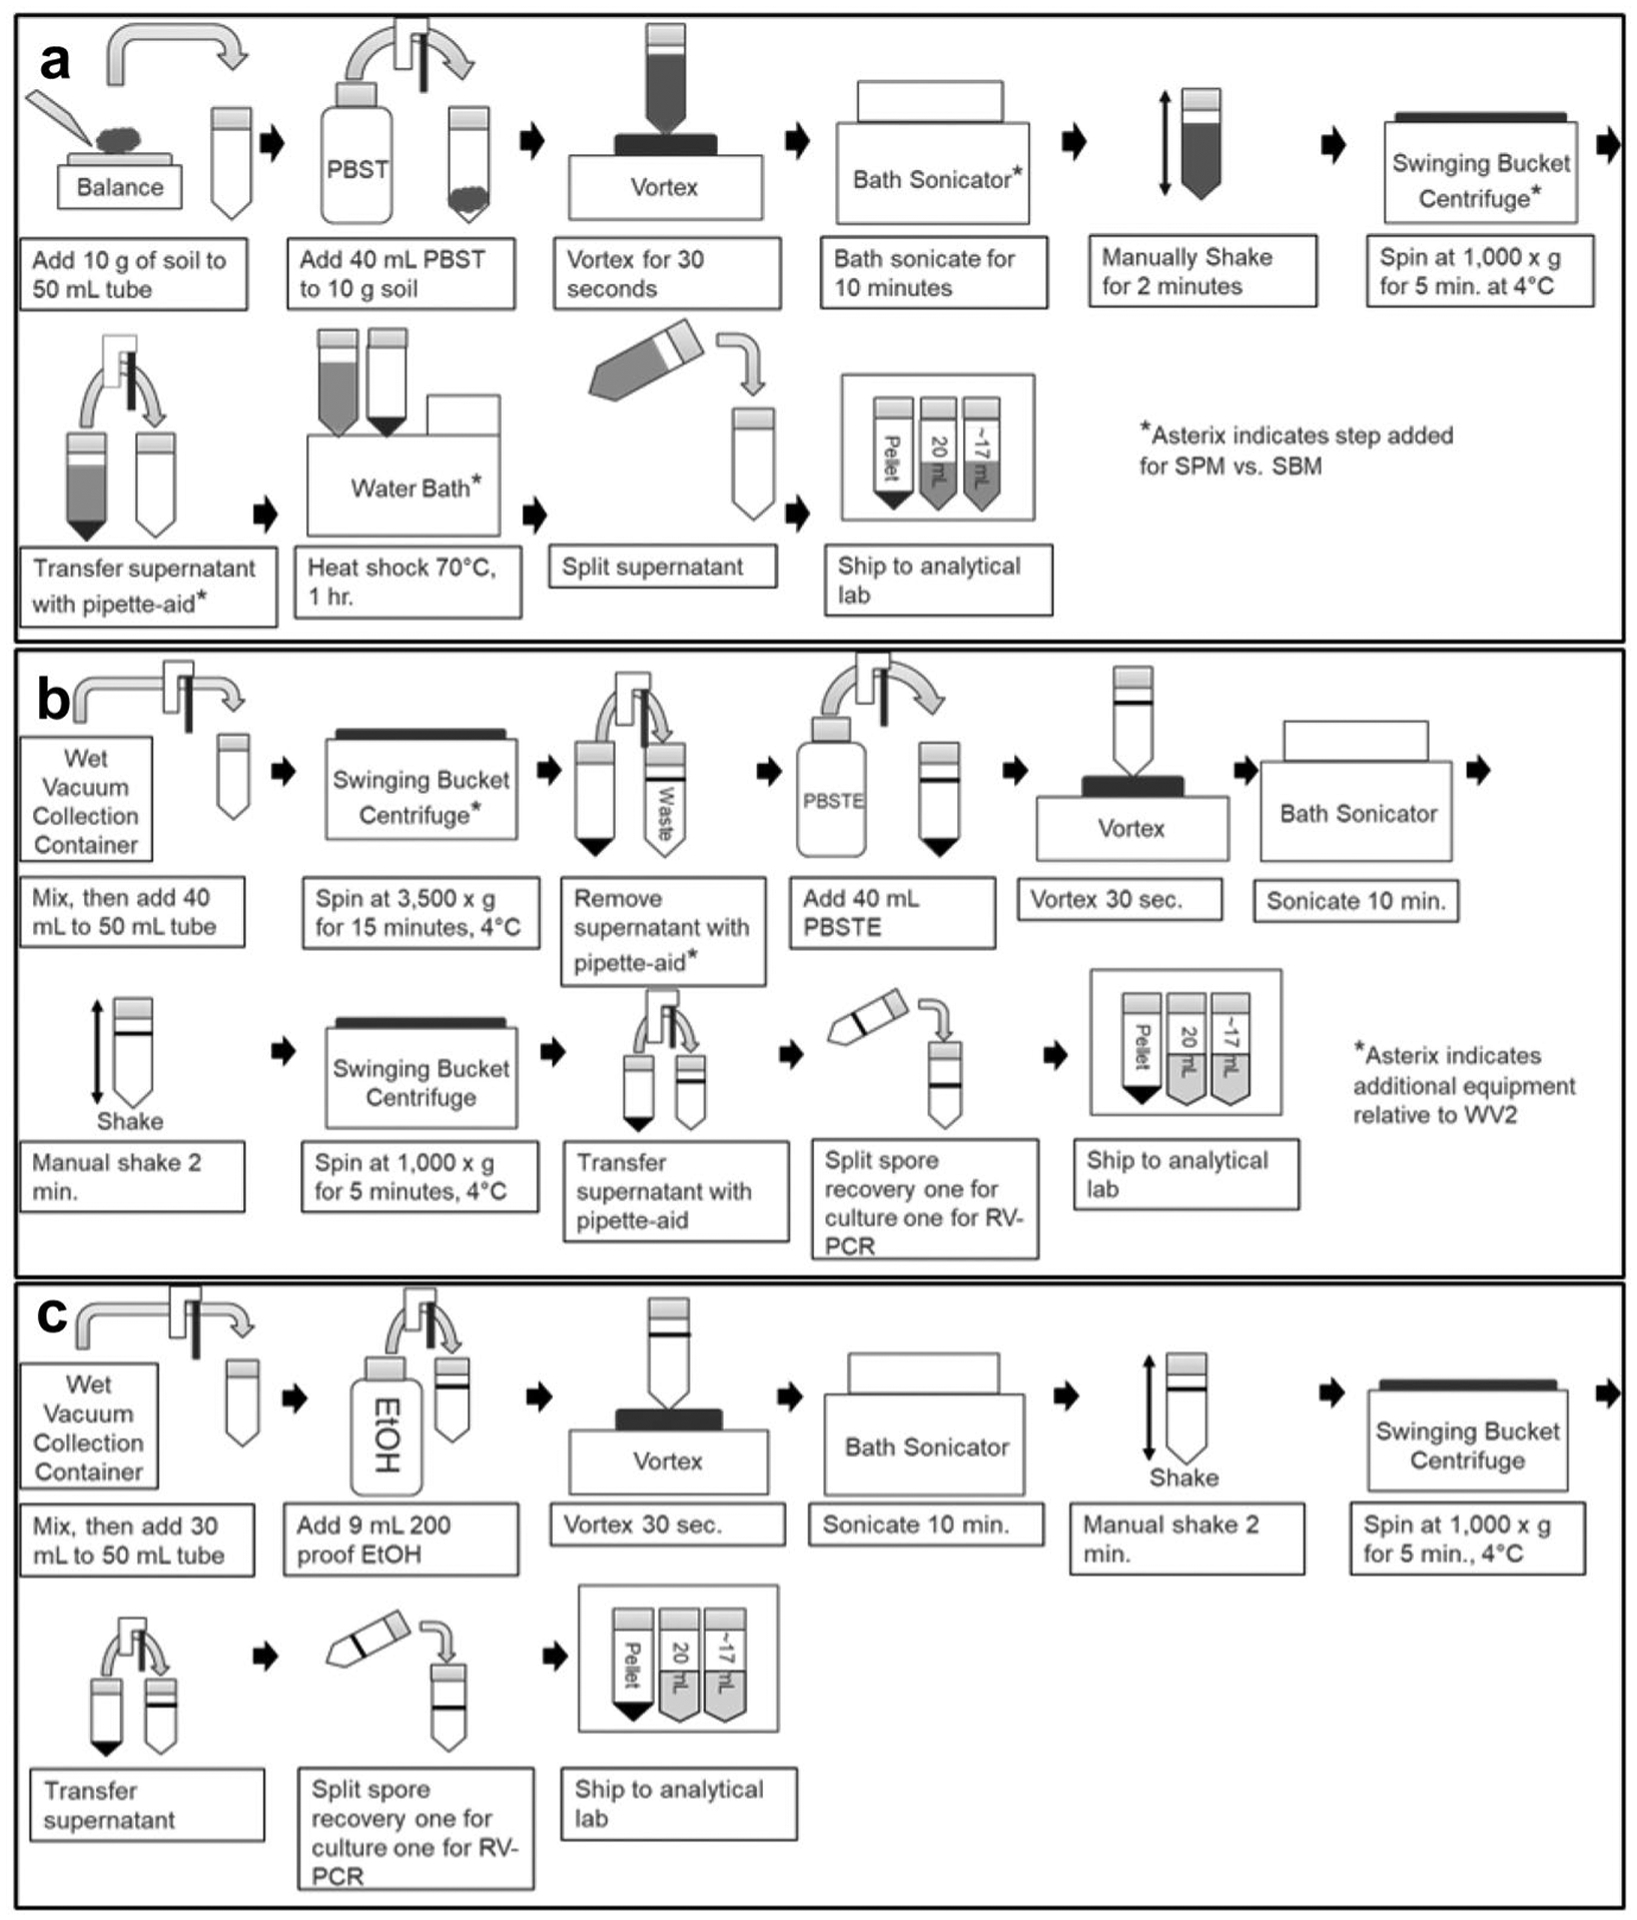
Processing methods for soil and wet vacuum TAS. Soil baseline method (SBM) and soil processing method (SPM) (a); wet vacuum processing method 1 (WV1) (b); and wet vacuum processing method 2 (WV2) (c)
For wet vacuum processing, two methods were applied. The first wet vacuum processing method (WV1) consisted of a buffer exchange by centrifuging 40 mL of wet vacuum TAS in a 50-mL centrifuge tube at 3500 × g at 4 °C for 15 min, and then the supernatant was removed and replaced with PBST amended with 30% ethanol. This step was followed by vortex-mixing for 30 s, bath sonication for 10 min, manual shaking for 2 min, 1000 × g centrifugation for 5 min at 4 °C, and the transfer of the supernatant into 50-mL centrifuge tubes (Fig. 1b). The second wet vacuum processing method (WV2) eliminated the buffer exchange centrifugation utilized in WV1 to add ethanol as an antimicrobial agent by adding 9 mL of 100% (200 proof) ethanol to 30 mL of wet vacuum TAS in a 50-mL centrifuge tube to obtain 23% ethanol concentration; all other steps remained the same as the WV1 (Fig. 1c).
Analytical methods
Following baseline or processing methods, the resulting spore recovery suspension and pellet (concentrated debris and microorganisms post-centrifugation) or MCE membrane were analyzed using culture and RV-PCR analytical methods for the detection of viable BaS spores. For SBM, SPM, WV1, and WV2, ~20 mL of spore recovery was available for each analytical method in addition to a pellet. For WVMB, SWRB, and SWMB, ~10 mL of spore recovery was available for each analytical method in addition to an MCE membrane.
Culture method
The spore recovery suspension was vortex-mixed on high for 30 s and then spread plated or concentrated onto MicroFunnel filter membranes and incubated overnight at 36 ± 2 °C. For spread plating, a 0.1-mL volume of neat and/or 1:10 serial dilutions in PBST were spread plated onto SBA. For MicroFunnel filter plating, ≥ 1 mL volumes were concentrated onto 0.45-μm (pore size) Metricel® black membranes (Pall Corporation, Washington, NY, Cat. 4805) by prewetting the membrane with 5 mL of PBST, then adding ≥ 1 mL of spore recovery suspension to 10 mL of PBST within the MicroFunnel filter, followed by a 10-mL PBST rinse. Metricel membranes were removed using sterile forceps and applied to SBA. Colonies of BaS appear flat or slightly convex, are 2 to 5 mm in diameter with edges that are slightly irregular, have an appearance described as ground-glass, and are not β-hemolytic (Shah, 2017). Culture counts are reported as presumptive BaS colonies if they had the described morphology, with recovery values calculated using spread plates containing 25 to 250 CFU per plate and 20 to 80 CFU per filter membrane plate when possible. The total CFU recovered, to include all colony morphologies, were counted to calculate total microbial load.
Isolated presumptive BaS colonies were screened using real-time PCR (hereafter referred to as PCR) by using an inoculating loop or needle to transfer a portion of the presumptive colony into 100 μL of PCR-grade water in a 1.5-mL tube. The colony suspension was heated for 5 min at 95 ± 2 °C to lyse the cells and centrifuged at 18,407 × g for 2 min, and the supernatant was processed using PCR. If presumptive BaS colonies were not confirmed PCR positive from spread or membrane plates, then PCR analysis of the enriched MCE membrane or pellet was performed, as described below.
The MCE membrane or pellet was enriched by adding 25 mL of BHIB and incubating at 36 ± 2 °C for 24 to 48 h. If media appeared turbid and colonies were not confirmed PCR positive from the spore recovery suspension, 10 μL of BHIB enrichment culture was streaked for isolation of colonies in triplicate and incubated overnight at 36 ± 2 °C. If presumptive BaS colonies were isolated, PCR was performed. If no presumptive BaS colonies were isolated, 50 μL of BHIB was centrifuged at 12,000 × g for 2 min, the supernatant was discarded, the pellet was resuspended in 100 μL of PCR-grade water followed by heating for 5 min at 95 ± 2 °C to lyse cells and centrifuged at 18,407 × g for 2 min, and the supernatant was processed using PCR.
RV-PCR method
The spore recovery suspension was vortex-mixed on high for 30 s and then allowed 30 s of settle time before transferring volume (up to 12 mL at a time) to a filter vial (Fisher Scientific Cat. AV125NP-UAQU) until full volume was concentrated by filtration or a maximum time of 1 h. Two (2) buffer washes were then performed according to the EPA Protocol (Shah, 2017). The first wash was 12.5 mL of cold (4 °C) high salt buffer (10 × PBS) followed by 12.5 mL of cold (4 °C) low salt wash buffer (1 × PBS). If filtration of full volume of spore recovery suspension took longer than 15 min, reduced volume of 10 × PBS and 1 × PBS (5 mL) was applied. If the spore recovery suspension took ≥ 1 h for filtration, the remaining volume was removed and the 10 × PBS and 1 × PBS washes were omitted. All filtration steps were performed using a vacuum manifold (Pacon Manufacturing, Cat. 1,701,232–1 and 1,701,232–2) operating at 5 to 10 psi. The top portion of the manifold was then removed and placed into a capping tray (Pacon Manufacturing Cat. 1,701,233) with Luer lock caps to seal the filter vials. Five (5) mL of cold BHIB was then added to each filter vial, and the vials were capped and then vortex-mixed for 10 min on a setting of 7 on a platform vortex (VWR, Cat. 58,816–115). Following the vortex step, the broth culture was mixed by pipetting up and down ~ 10 times and a 1-mL aliquot was removed and stored at −20 °C as the time zero (T0) aliquot. The capped filter vials were then incubated overnight for ~ 16 h (time final, Tf) in an incubator shaker set to 36 ± 2 °C and 230 rpm. Z Following overnight incubation, a Tf aliquot was removed following the same procedure described for the T0 aliquot. DNA was extracted from T 0 and Tf aliquots as described in the EPA Protocol using a manual Magnesil Blood Genomic, Max Yield System Kit (Promega, Madison, WI, Cat. MD1360) prior to PCR analysis (Shah, 2017).
Real-time PCR assay
Real-time PCR was performed on an Applied Biosys-tems 7500 Fast Real-Time PCR Instrument (Waltham, MA). Each PCR reaction targeted BaS chromosome and pXO1 plasmid utilizing primer and probe sequences previously published (Létant et al., 2011) in a multiplex reaction (Table 1). Multiplex reactions each consisted of 12.5 μL of TaqMan® Fast Advanced 2 × PCR Mix, 5 μL of DNA extract, 0.1 μL of Invitrogen Platinum Taq Polymerase, 1 μL each of 25 μM forward and reverse primers for chromosome and pXO1, 1 μL each of 2 μM probe for chromosome and pXO1, and 1.4 μL of PCR-grade water. Thermal cycling conditions were as follows: 2 min at 50 °C, 2 min at 95 °C, and 45 cycles of 3 s at 95 °C and 30 s at 60 °C. All analyses used a magnitude of reporter dye signal threshold (ΔRn) to generate cycle threshold (Ct) values. Each 96-well plate analyzed samples in triplicate reactions and contained PCR controls, four positive control reactions containing 50 pg of DNA extracted from BaS, and four no template control (NTC) reactions. Acceptance criteria for PCR were that all positive controls needed to cross the threshold to generate a Ct value and no NTCs could cross the threshold.
Table 1.
Sequences of real-time PCR primers and probes (Létant et al., 2011)
| Real-time PCR assay | Forward primer | Reverse primer | Probe |
|---|---|---|---|
| Chromosome | TTT CGA TGA TTT GCA ATG CC | TCC AAG TTA CAG TGT CGG CAT ATT | FAM-ACA TCA AGT CAT GGC GTG ACT ACC CAG ACT T-MGBNFQ |
| pXO1 | GCG GAT AGC GGC GGTTA | TCG GTT CGT TAA ATC CAA ATGC | VIC-ACG ACT AAA CCG GAT ATG ACA TTA AAA GAA GCC CTT AAMGBNFQ |
Data interpretation
For culture PCR analysis, a sample was considered positive if a presumptive BaS colony or BHIB enrichment-PCR reaction generated an average Ct of ≤ 40 for both PCR targets (chromosome and pXO1). For RV-PCR, a ΔCt value was calculated by subtracting the average Ct value generated by the Tf aliquot from the average Ct value generated by the T 0 aliquot. A ΔCt of ≥ 9 for both PCR targets (chromosome and pXO1) indicated that viable BaS spores were detected in the sample and was considered a positive result.
Each TAS spiked with BaS spores resulted as a true positive or false negative. A true positive was defined as a sample spiked with BaS spores that had a PCR positive analytical method result, and a false negative was defined as a sample that was spiked with BaS spores, but the PCR analytical method was negative. Results of TAS analyzed that were not spiked with BaS spores were reported as a true negative or false positive. A true negative was defined as a zero-spike sample that had a PCR negative analytical method result, and a false positive was defined as a zero-spiked sample that had a PCR positive analytical method result.
Final concentration factors for each sample type were calculated from the initial sample volume and post-processing sample volume using Eq. 1. For example, for storm water runoff using the modified baseline method, an initial volume of 847 ± 92 mL was concentrated onto an MCE membrane and particulates were suspended in 20 mL of PBST with 30% ethanol, resulting in a final concentration factor of 42. Adjusted final CFU/mL values were calculated using Eq. 2. The percent decrease in microbial load relative to baseline was calculated using Eq. 3, where α represents adjusted final CFU per mL values. The relative total microbial load was calculated using Eq. 4.
| (1) |
| (2) |
| (3) |
| (4) |
Results and discussion
Background microbial load
The background total microbial load for the zero-spike TAS for each baseline and processing method is shown in Table 2. The average final recovered total microbial loads for SBM and WVMB samples were 8400 ± 1800 CFU/mL and 8800 ± 1800 CFU/mL, respectively. The processing methods applied reduced the final microbial load to 2500 ± 2000 CFU/mL for SPM, 750 ± 90 CFU/mL for WV1, and 400 ± 180 CFU/mL for WV2. The average final microbial load for SWRB method was 8400 ± 7600 CFU/mL and the SWMB method reduced the total microbial load to 2600 ± 1500 CFU/mL. Those background microbial concentrations represent a relatively high concentration compared to the potentially low target concentration that could ideally be detected to characterize a biological contamination spread. Consequently, those relatively high microbial background concentrations pose potential competition, interference, or masking of the target organism, and there would be potential benefit in reducing that background.
Table 2.
Total microbial load in zero-spike samples post-processing
| TAS — method | Final CFU/mL average ± standard deviation | Final conc. factor | Adjusted final CFU/mL | % change microbial load relative to baseline | Antimicrobial treatment | Other steps that reduce microbial background |
|---|---|---|---|---|---|---|
| Soil — SBM | 8400 ± 1800 | 1 | 8400 | N/A | None | 30-min settle |
| Soil — SPM | 2500 ± 2000 | 1 | 2500 | −70% | 70 °C for 1 h | Centrifugation 1000 × g for 5 min |
| Storm water — SWRB | 8400 ± 7600 | 90 | 93 | N/A | None for culture 30% ethanol for RV-PCR | Incomplete resuspension from MCE membrane |
| Storm water — SWMB | 2600 ± 1500 | 42 | 62 | −34% | 30% ethanol | Incomplete resuspension from MCE membrane |
| Wet vacuum — WVMB | 8800 ± 1800 | 2.8 | 3200 | N/A | 30% ethanol | Incomplete resuspension from MCE membrane |
| Wet vacuum — WV1 | 750 ± 90 | 1 | 750 | −76% | 30% ethanol | Centrifugation 3500 × g for 15 min and 1000 × g for 5 min |
| Wet vacuum — WV2 | 400 ± 180 | 0.8 | 500 | −84% | 23% ethanol | Centrifugation 1000 × g for 5 min |
For soil samples, both baseline and processing methods had an initial mass of 10 g of soil suspended in 40 mL of PBST and neither method concentrated the initial volume; therefore, the processing concentration factor was 1. The background total microbial load reduction of 70% for the processing method is mainly attributed to the 1-h heat treatment at 70 °C, although additional loses in microbial load may have occurred from steps involved with separating soil from the supernatant (30-min settle for baseline and 1000 × g centrifugation for Processing Method 1).
For storm water samples, the SWRB method resulted in a concentration of 450 mL of storm water onto an MCE membrane, with particles resuspended in 5 mL of PBST for the culture method or 20 mL PBST for the RV-PCR method for a concentration factor of 90 and 22.5 for culture and RV-PCR analytical methods, respectively. The SWMB method resulted in a concentration of 847 ± 92 mL of storm water onto an MCE membrane, with particulates resuspended in 20 mL of PBST with 30% ethanol for a concentration factor of 42. To account for the difference in concentration factors between SWRB and SWMB methods, the adjusted final background microbial load values of 93 CFU/mL and 62 CFU/mL are compared, indicating that 30% ethanol treatment utilized in SWMB method led to a 34% reduction in the overall background microbial load.
For wet vacuum samples, the WVMB method concentrated 55 ± 10 mL onto an MCE membrane, with particulates resuspended in 20 mL of PBST with 30% ethanol for a concentration factor of 2.8. Method WV1 had an initial volume of 40 mL, followed by a buffer exchange by centrifugation and then resuspension in 40 mL of PBST with 30% ethanol for a concentration factor of 1. Method WV2 had an initial volume of 30 mL, and 9 mL of 200 proof ethanol was added for a final concentration of 23% ethanol, resulting in a concentration factor of 0.8. To account for the difference in concentration factors between the WVMB, WV1, and WV2, the adjusted final background microbial load values of 3200 CFU/mL, 750 CFU/mL, and 500 CFU/mL were compared, indicating that the processing methods reduce background microbial load 76% and 84%, respectively, to WV1 and WV2. Since all three methods utilized ethanol as an antimicrobial agent (presumably not impacting viability of the spore-forming target, BaS), the decrease in microbial load for the processing methods may be due to the concentration method used for the baseline method. The WVMB method utilized a vacuum filtration step for concentrating the wet vacuum samples by adding 100 mL of wet vacuum sample to a MicroFunnel and applying a vacuum. During the 30-min filtration time, 55 ± 10 mL passed through the filter, and additional particulates and microorganisms from the total 100 mL volume could have settled and collected onto the MCE membrane during this time, inflating the total particulate and microorganism load within the volume concentrated.
The relative total microbial load for each TAS sample was calculated by dividing the final total microbial load (presumptive BaS and background microorganisms) recovered from the baseline method by the final total microbial load recovered from the processing method. The relative microbial load as a function of the initial BaS spore load in the TAS being processed is depicted in Fig. 2 for soil and wet vacuum. As shown in Fig. 2, SBM had an average of 4 ± 3 times more microbial load than SPM. For wet vacuum, WVMB had an average of 13 ± 4 and 22 ± 9 times more microbial load than WV1 and WV2, respectively. Processing methods are reducing the total microbial load compared to the baseline method and therefore lead to an improvement in the sensitivity of the analytical methods for the detection of BaS spores, as shown in the “Analytical method results” section.
Fig. 2.
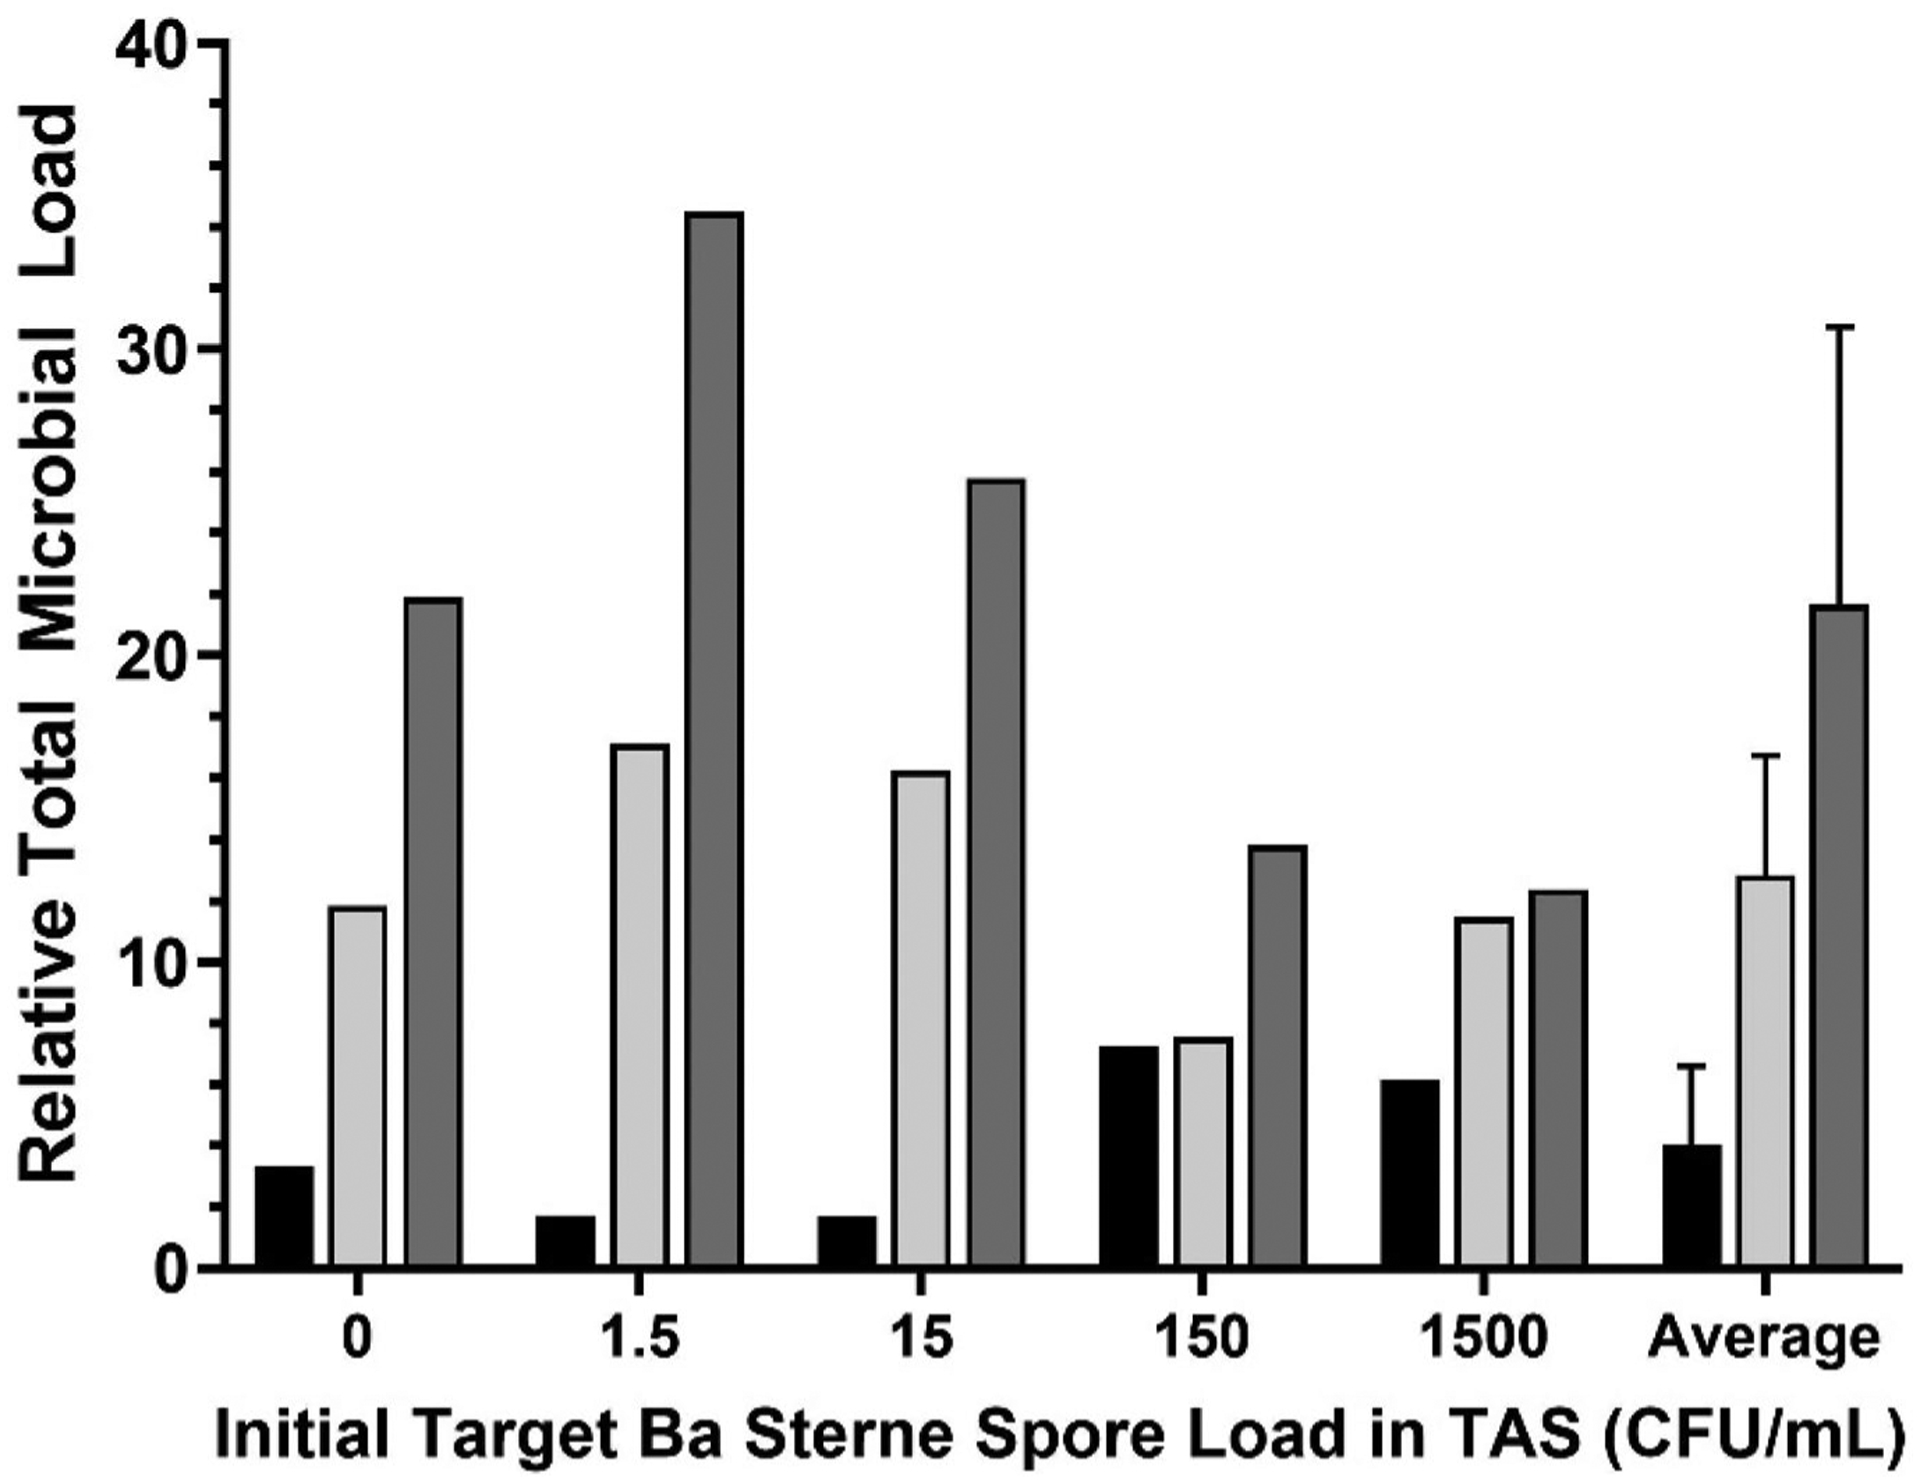
Relative total microbial load for soil and wet vacuum TAS. Ratio of baseline to processing method total microbial load at each Ba Sterne spore load level, with the average across all spore load levels for each processing method applied. Baseline method was compared to SPM (black bars), WV1 (light gray) and WV2 (dark gray) for each initial targeted Ba Sterne spore loads tested. The error bars represent standard deviation of the microbial load across all spore loads
Particulate filtration
The total particulates in TAS can slow analytical laboratory analysis and reduce the sensitivity of the analytical methods by reducing the total volume of TAS able to be processed, particularly when membrane filtration is a concentration method. For SWRB, SWMB, and WVMB, the first step for processing water samples < 10 L and ≥ 50 mL according to the EPA protocol is the concentration of the sample onto a 0.45-μm (pore size) MCE membrane (Shah, 2017). For this study, if the target 900-mL volume of TAS could not be completely filtered within 30 min, only the volume of TAS that could be filtered within 30 min was processed. This time constraint was imposed to avoid developing processing methods that would be overly time-consuming to large-scale incident response operations, whereby time is critical for decision-making. Within the 30-min concentration time, 55 ± 10 mL of WVMB TAS passed through the 0.45-μm MCE membrane. By comparison, 847 ± 92 mL of SWMB was concentrated onto the membrane within the same amount of time, highlighting the variability in particulate loads that can be found in environmental TAS.
The RV-PCR method requires collection of spores from suspensions onto 0.45-μm filters using vacuum filtration, therefore, TAS with high particulate loads slow process times and interfere with the detection of BaS spores. As described previously, 55 ± 10 mL of the WVMB samples was concentrated onto an MCE membrane by vacuum filtration, and additional particulates from the 100-mL total volume settled onto the membrane during the 30-min filtration time. These particulates were then suspended into a final volume of 20 mL, thereby concentrating the particulates further before adding to the 0.45-μm filter vial for RV-PCR analysis, leading to slow filtration times and interferents that contributed to no detection of up to 1500 CFU/mL of BaS spores for WVMB TAS (refer to the “Analytical method results” section).
For the WVMB, 93% (14/15) took > 1 h to filter an average volume of 8.7 ± 0.8 mL through the RV-PCR filter vial. For WV1, filter vial clogging frequency was reduced, with 47% (7/15) of the samples taking > 1 h to filter, with an average volume of 19.0 ± 1.3 mL concentrated. For WV2, 80% (12/15) of the samples took > 1 h to filter an average volume of 17.3 ± 2.3 mL concentrated. The initial 3500 × g centrifugation step for buffer exchange (WV1) likely reduced the overall particulate load by removing smaller particulates that were not pelleted (i.e., were discarded with the supernatant), leading to a reduction in overall particulates.The lower starting volume (30 mL) of WV2 reduced particulate load relative to the WVMB. The workflow for WV2 eliminated a centrifugation step that is used for buffer exchange in WV1 and therefore takes less time with comparable sensitivity (refer to the “Analytical method results” section). Comparatively, only two samples each from SWRB and SPM TAS took more than 15 min to filter through the RV-PCR filter vial; all other samples took < 15 min.
Analytical method results
Figure 3 shows the positive replicates for culture and RV-PCR analysis across soil and wet vacuum samples. As described previously (“Data interpretation” section), a sample was considered positive for culture if a presumptive BaS colony PCR or BHIB enrichment-PCR of the MCE or pellet resulted in a Ct of ≤ 40 for both PCR targets (chromosome and pXO1), and a sample was considered positive for RV-PCR when the ΔCt was ≥ 9 for both PCR targets. The Ct for culture analysis and ΔCt values for RV-PCR analysis are shown in Supplemental Tables S1 and S2. The ΔCt values are plotted by TAS in Supplemental Figs. S1, S2, and S3.
Fig. 3.
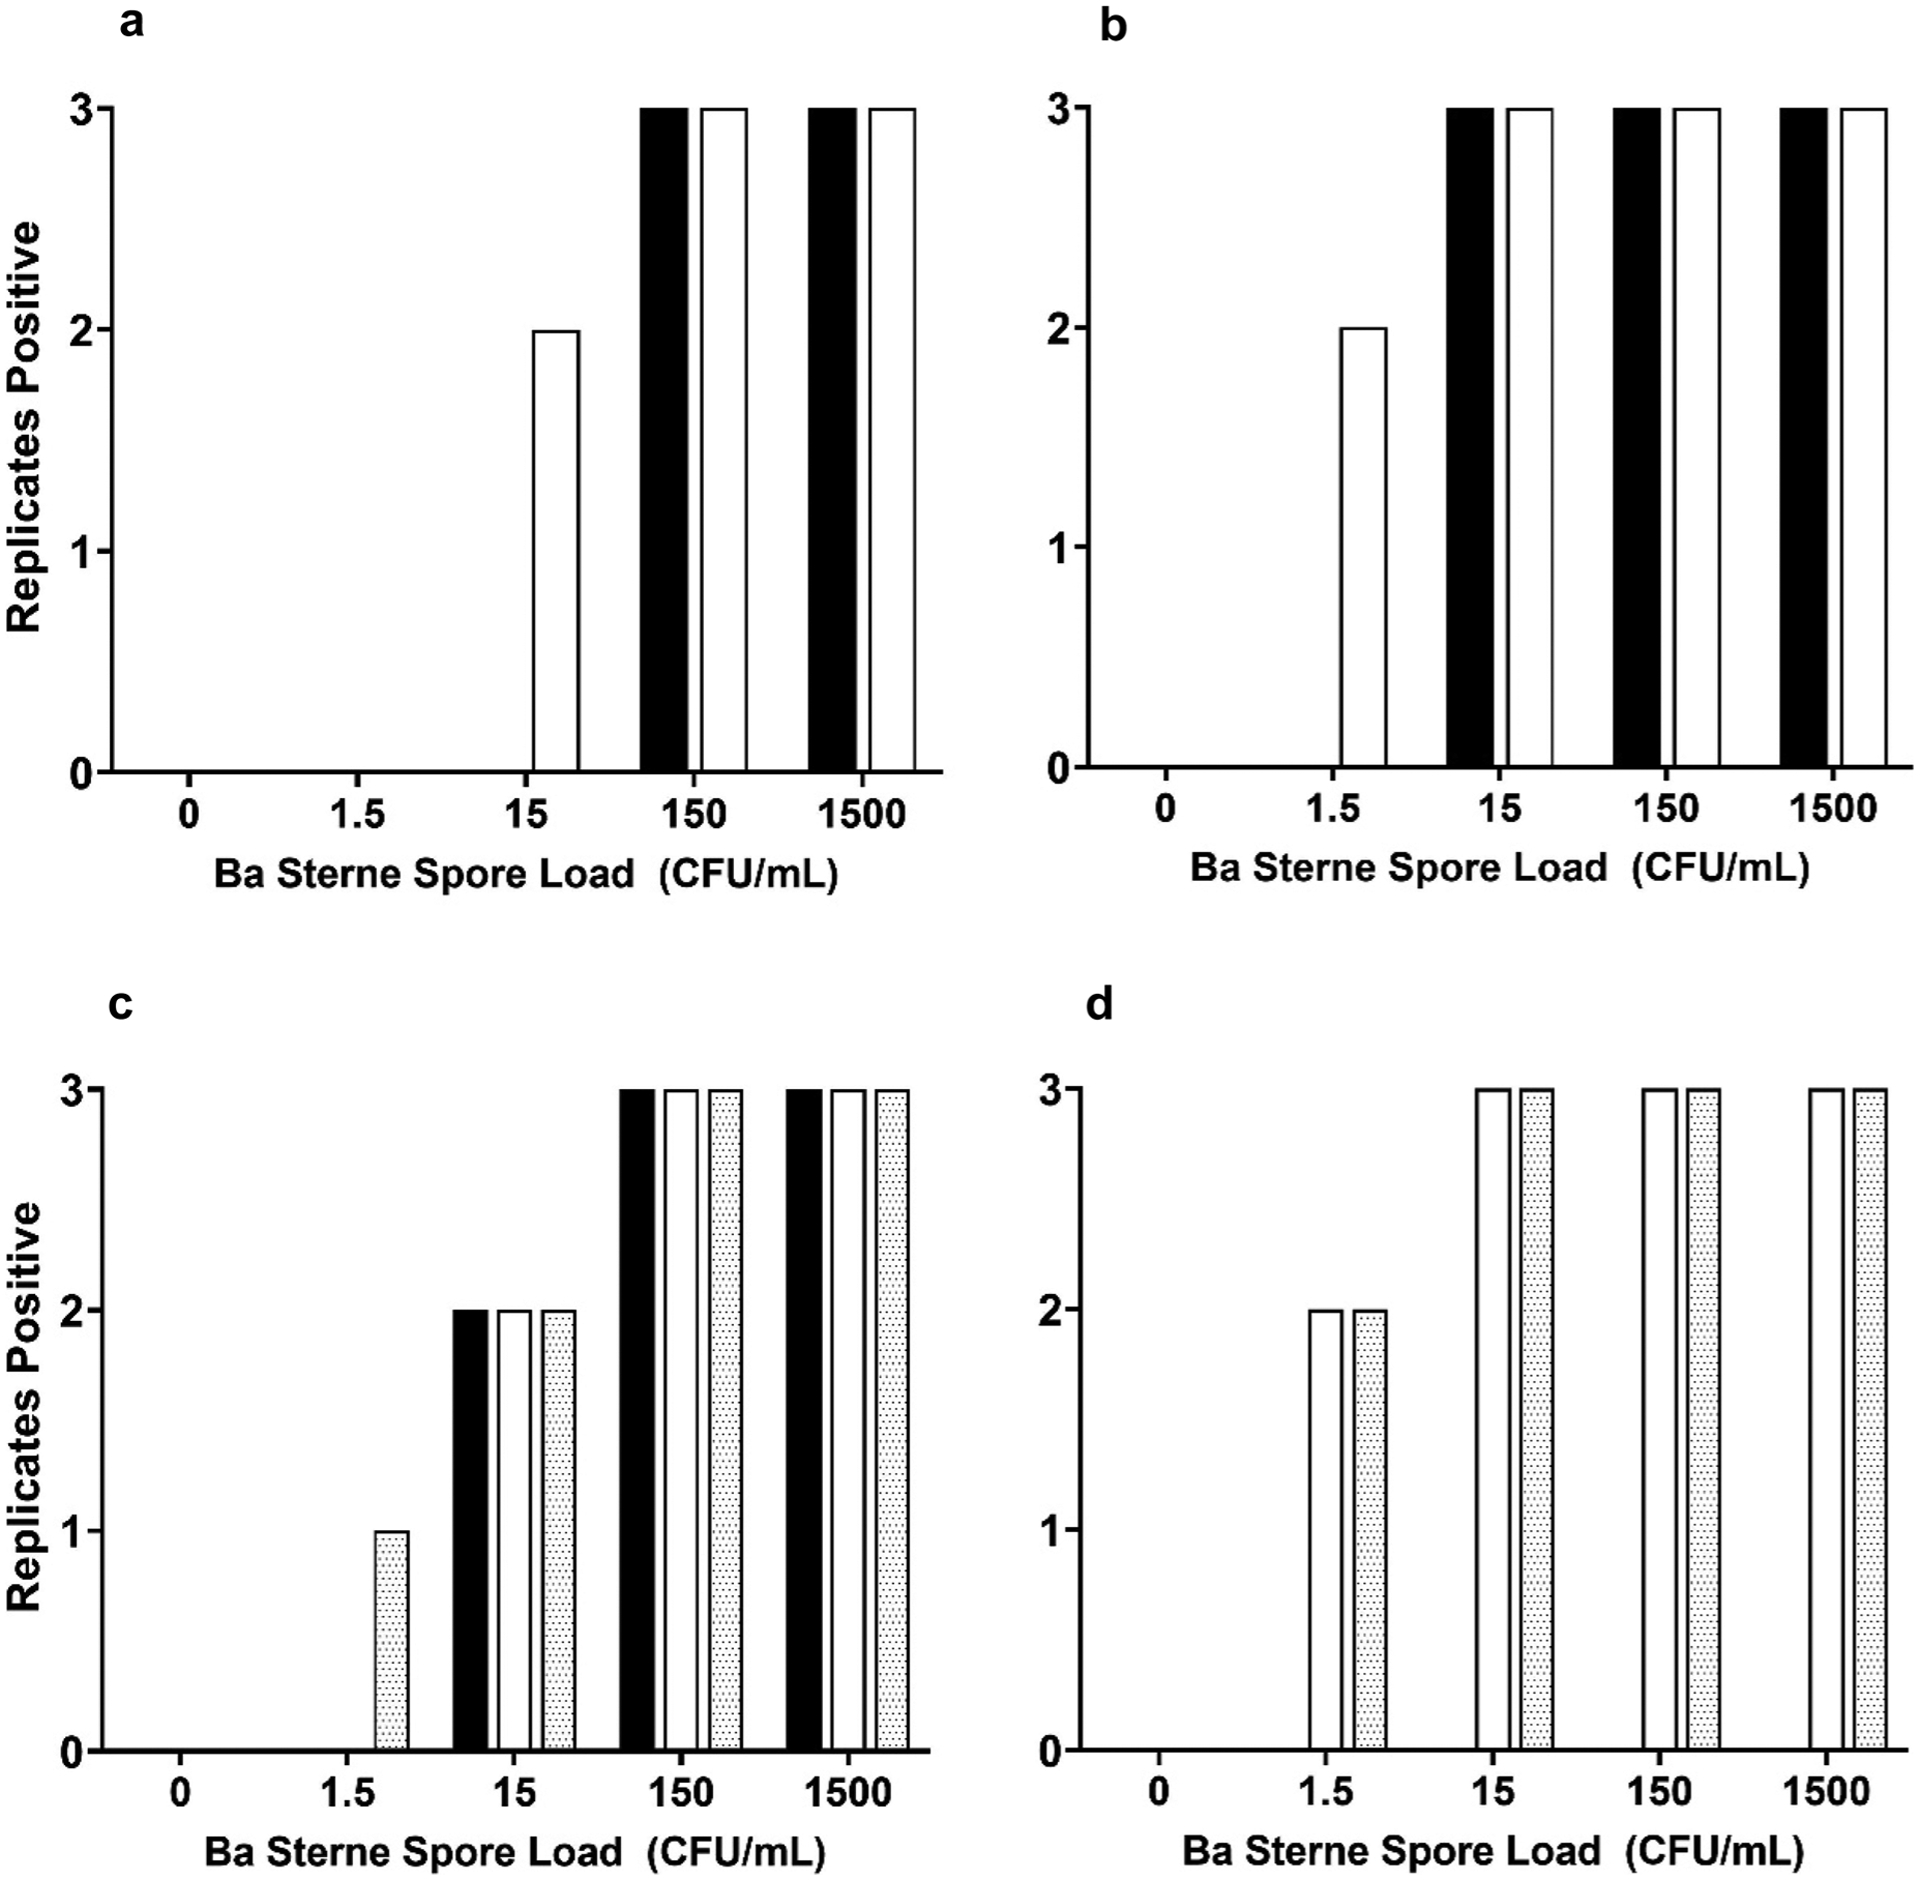
Positive replicates for soil and wet vacuum TAS. Soil methods are shown in panels a (culture) and b (RV-PCR) and wet vacuum methods are in panels c (culture) and d (RV-PCR). Data represent the number of positive replicates (maximum possible, 3) for culture (a, c) and RV-PCR (b, d) with baseline (black bars), processing method 1 (white bars), and processing method 2 (patterned bars) for all Ba Sterne loads tested
For soil samples, BaS spores were confirmed to be present using the culture analytical method in all sample replicates with an initial spore load ≥ 150 CFU/mL (600 CFU/g), and when the SPM was applied, two of three replicates were confirmed positive at the 15 CFU/mL (60 CFU/g) spore load (Fig. 3a). The RV-PCR analytical method confirmed the presence of BaS spores in all samples with an initial spore load of ≥ 15 CFU/mL (60 CFU/g), and when the SPM was applied, two replicates were positive at the 1.5 CFU/mL (6 CFU/g) spore load (Fig. 3b), indicating that the SPM improved the sensitivity of culture and RV-PCR analytical methods. The detection of BaS spores at 60 CFU/g (600 CFU/sample) for culture and 6 CFU/g (60 CFU/sample) for RV-PCR when the SPM is applied was within or below the sample limit of detection for Bacillus atrophaeus spores (208 to 604 CFU/sample) reported in soil samples with the same soil/buffer ratio (0.25 g/mL) that were collected from the environment (Mikelonis et al., 2020).
Although the focus of this study was the detection of BaS spores in unsterilized soil, the loam soil used in this study (Agvise, HCB-SL-PF) was sterilized by autoclaving twice (before inoculation) for a small subset of samples to compare the method to previously published methods that utilized sterile soil. In this study, BaS spores were detected for both the culture and RV-PCR analytical methods at 1.5 CFU/mL load (6 CFU/g, single replicate analyzed, data not shown), which compares favorably to reported 14 CFU/g limit of detection of BaS spores in sterile loamy and sandy soils (Silvestri et al., 2016). In another study, culture spread plate (CFU-S) and liquid culture enrichment-PCR (E-PCR) reported reliable detection of 25 CFU/g of B. atrophaeus spores for culture and 0.5 CFU/g for sterile sand, loam, and clay soil samples (Griffin et al., 2019). It would be beneficial to assess the CFU-S and E-PCR methods using unsterilized soil and BaS spores to directly compare with the methods used for this study.
For wet vacuum TAS, BaS spores were confirmed present using the culture analytical method in all samples with an initial spore load of ≥ 150 CFU/mL (~15,000 CFU/sample), and two of three replicates at 15 CFU/mL (~1500 CFU/sample) for WVMB. Method WV1 had the same sensitivity as the WVMB, with all samples with ≥ 150 CFU/mL (~6000 CFU/sample) and two of three replicates at 15 CFU/mL (~600 CFU/sample). An additional replicate was positive at 1.5 CFU/mL (~45 CFU/sample) when WV2 was applied (Fig. 3c). When WV1 or WV2 was applied, the RV-PCR analytical method confirmed the presence of BaS spores in all samples with an initial spore load of ≥ 15 CFU/mL (~450 to 600 CFU/sample) and two replicates each at 1.5 CFU/mL (~45 to 60 CFU/sample). When the RV-PCR analytical method was applied to the WVMB TAS, BaS was not detected (Fig. 3d). A previous study utilized wet vacuums for sampling outdoor concrete samples and reported sample limits of detection of 34 to 35 CFU/sample of B. atrophaeus spores (Mikelonis et al., 2020), which is comparable to the results from this study (~45 to 60 CFU/sample). Overall, the data indicated that WV1 and WV2 dramatically improved the sensitivity of the overall method when RV-PCR analytical methods were used, while the results were mostly similar when culture detection was used.
Positive controls with PBS and BaS were detected at the same or lower initial spore load than the TAS for all baseline and processing methods for both culture and RV-PCR analytical methods.
For storm water runoff TAS as shown in Fig. 4, a processing method was not applied due to low particulate load and relatively low initial background microbial loads. Spores (BaS) were confirmed present in storm water runoff using the culture analytical method in all samples with an initial spore load of ≥ 0.7 CFU/mL for both the SWRB and SWMB methods (Fig. 4a). Zero positive replicates were confirmed present at spore load of 0.07 CFU/mL for both culture and RV-PCR analytical methods. The SWRB method followed the EPA Protocol, and the SWMB method is described in the “Processing methods” section (Shah, 2017). The RV-PCR method was less sensitive than culture when analyzing storm water runoff, with one sample replicate at 0.7 CFU/mL positive for both SWRB and SWMB methods (Fig. 4b). There was no difference in detection sensitivity when comparing SWRB and SWMB methods.
Fig. 4.
Positive replicates for storm water TAS. Data represent the number of positive replicates (maximum possible, 3) for culture (a) and RV-PCR (b) methods. SWMB (black bars), and SWRB (white bars) are shown for each Ba Sterne spore load tested
A total of 105 TAS replicate samples were processed, and each sample spiked with BaS spores resulted in a true positive (correctly detected) or false negative (not detected when present), and zero-spiked samples resulted as true negative results (correctly not detected) or false positive (detected when absent). Overall, the percentage of TAS that were true positive or true negative was 74% (78/105) for the culture analytical method and 73% (77/105) for RV-PCR (Fig. 5). No samples were false positive for either analytical method.
Fig. 5.
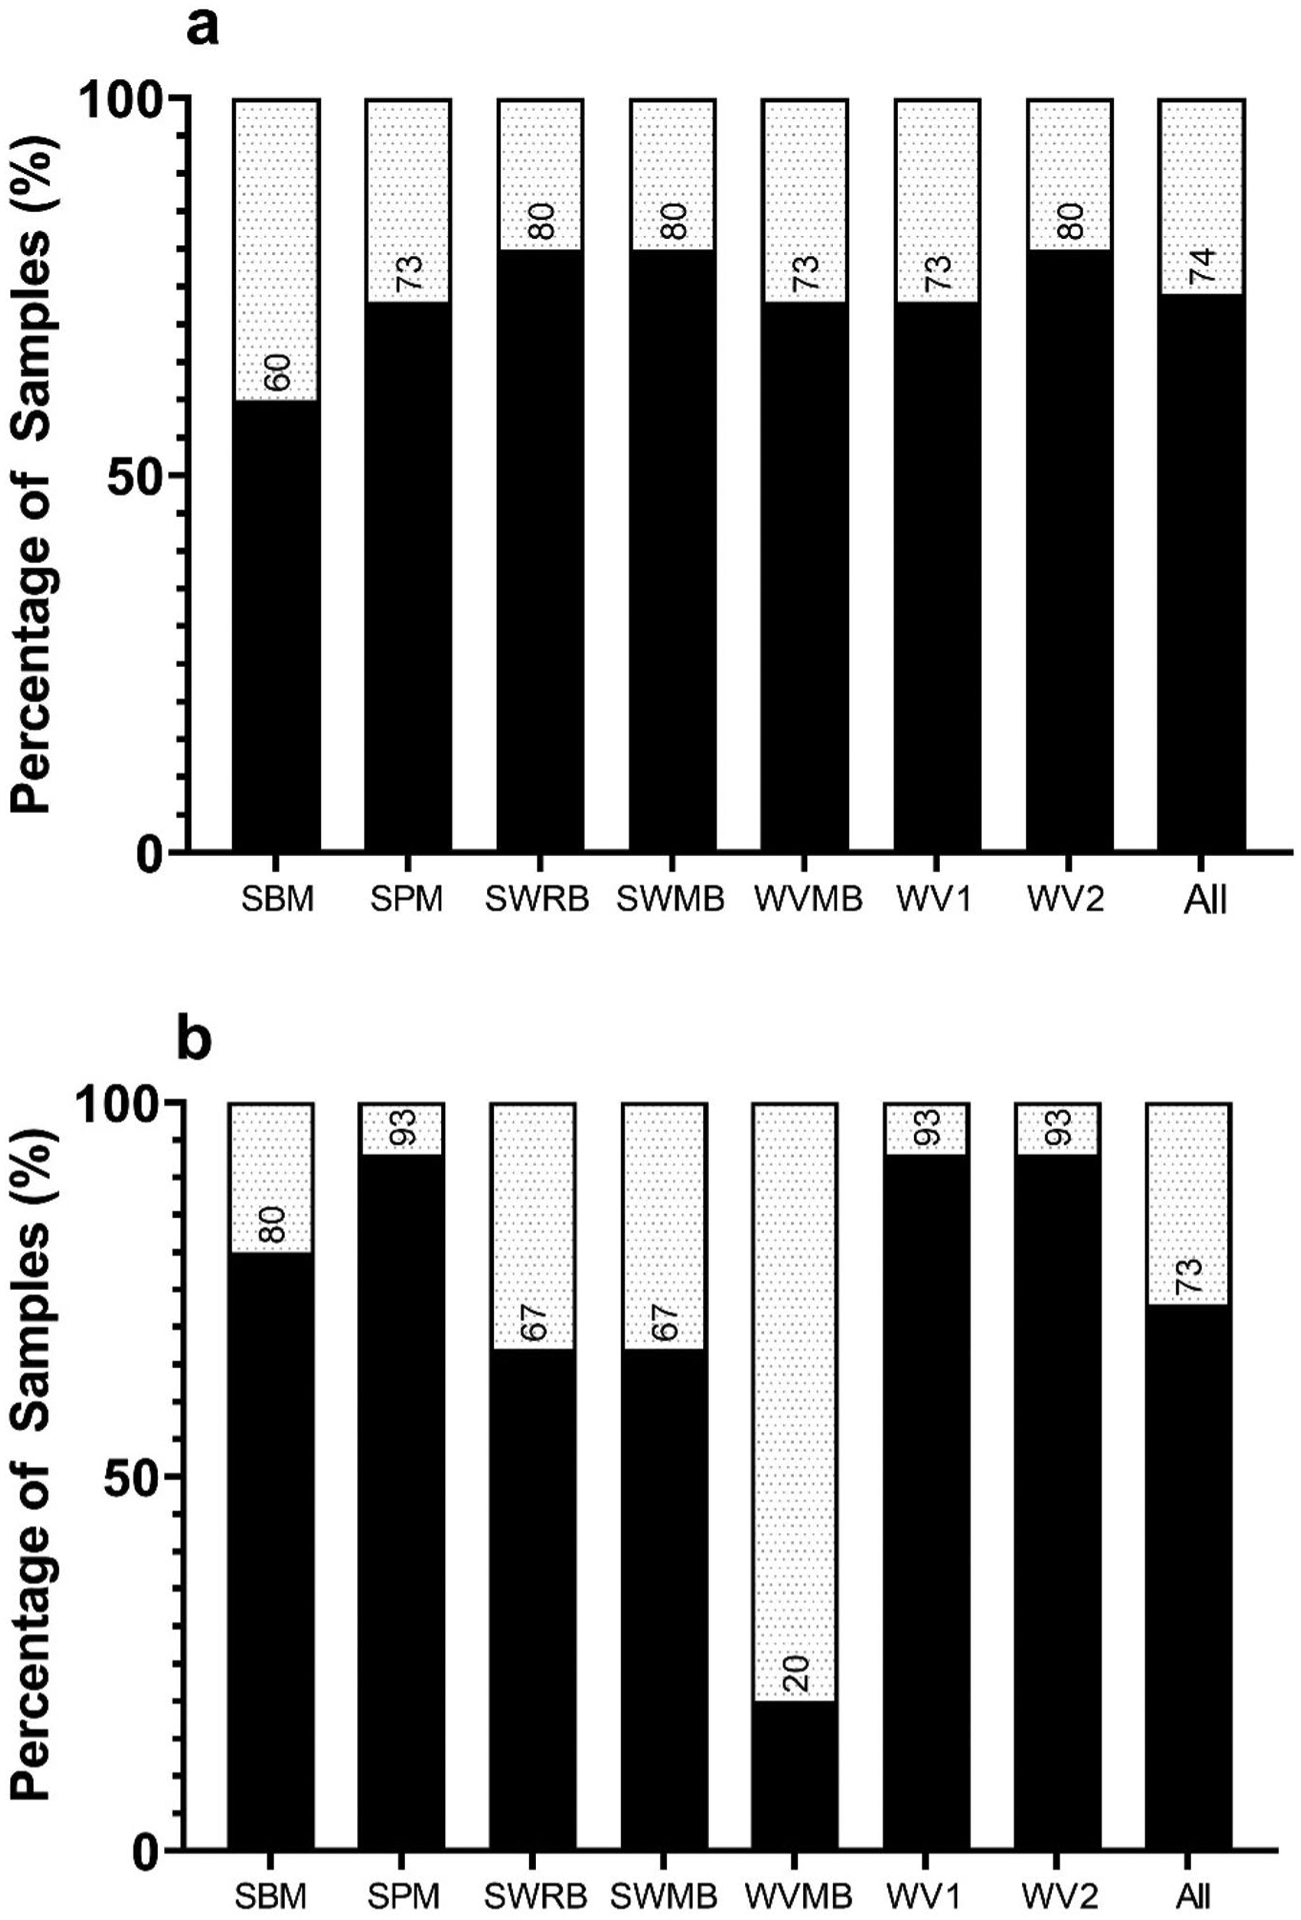
Percentage of samples that were true positive or negative and percentage of samples that were false negative for TAS. True positive or negative results (black bars) or false negative results (patterned bars) for each TAS (n = 15) and a compilation of all TAS (n = 105) for culture (a) and RV-PCR (b). Values on the graph represent the percentage of true positive or negative results for each method tested. SBM, soil baseline method; SPM, soil processing method; SWRB, storm water reference baseline method; SWMB, storm water modified baseline method; WVMB, wet vacuum modified baseline method; WV1, wet vacuum processing method 1; WV2, wet vacuum processing method 2. All represents all TAS tested
Figure 5 shows the true positive/false negative results for both analytical methods. For the culture method, the 27 false negative results were distributed equally across all TAS types and methods (baseline and processing methods), with a range of 3 to 6 (20 to 40%) false negative samples per method tested (Fig. 5). The largest change in false negatives for the culture method was a two-replicate reduction in occurrence when the processing method was applied to soil and improving lowest sensitivity from 150 to 15 CFU/mL. For the storm water samples, there was no change in the sensitivity of the culture analytical method for SWRB and SWMB methods applied, with both methods detecting three replicates at 0.7 CFU/mL. For the wet vacuum samples, the sensitivity of the culture analytical method was improved from 15 to 1.5 CFU/mL when WV2 was applied; otherwise, the sensitivity for all three methods was similar.
For RV-PCR, 25 of the 28 false negative results were following baseline processing methods, resulting in a range of 7 to 80% false negative samples across all TAS types and methods (baseline and processing methods) (Fig. 5), the majority of which were 12 false negative results from the WVMB method (no sample replicates detected with BaS spores present). There were also five false negative results for each of the baseline methods for storm water (SWRB and SWMB) and three false negative results for the SBM (Fig. 5). For the three processing methods (SPM, WV1, and WV2), there were only three false negative results, each from a single replicate at 1.5 CFU/mL BaS spore load.
The sensitivity of detection for culture and RV-PCR analytical methods for all TAS and each processing method is shown in Table 3. Methods WV1 and WV2 applied to TAS led to the largest sensitivity change for the RV-PCR analytical method. When the processing methods were applied, BaS spores were detected consistently at 15 CFU/mL and as low as 1.5 CFU/mL, compared to no detection of up to 1500 CFU/mL for WVMB.
Table 3.
Sensitivity of detection of BaS spores for TAS for each method
| TAS — method | Culture lowest sensitivity (CFU/mL) | RV-PCR lowest sensitivity (CFU/mL) | ||
|---|---|---|---|---|
| One or more replicates | All Replicates | One or more replicates | All Replicates | |
| Soil — SBM | 150 | 150 | 15 | 15 |
| Soil — SPM | 15 | 150 | 1.5 | 15 |
| Storm water — SWRB | 0.67 | 0.67 | 0.67 | 6.7 |
| Storm water — SWMB | 0.67 | 0.67 | 0.67 | 6.7 |
| Wet vacuum — WVMB | 15 | 150 | Not detected | Not detected |
| Wet vacuum — WV1 | 15 | 150 | 1.5 | 15 |
| Wet vacuum — WV2 | 1.5 | 150 | 1.5 | 15 |
The improvement in analytical method detection sensitivity for samples that underwent a processing method was two-fold: there was a reduction in total background microbial load and total particulates were reduced.
Conclusions
Prior to sending samples to an analytical laboratory to identify and/or quantify target Ba from environmental samples, implementation of a processing method within the field can improve the sensitivity of culture and RV-PCR analytical methods for BaS spore detection. The sensitivity of the culture and RV-PCR analytical methods for soil and wet vacuum TAS was improved when a field processing method was applied. Most notably, the processing methods substantially improved the sensitivity of the RV-PCR analytical method for the wet vacuum TAS from no detection at the 1500 CFU/mL BaS spore load level to consistent detection of 15 CFU/mL and as low as 1.5 CFU/mL BaS spore load.
For soil samples, the processing methods in com-bination with the culture and RV-PCR analytical methods led to detection of BaS endospores at levels comparable or lower than previously reported for the detection of B. atrophaeus spores from environmental samples with the same soil/buffer ratio (0.25 g/mL) (Mikelonis et al., 2020). The culture method consistently detected BaS spores with an initial load of ≥ 150 CFU/mL (600 CFU/g), and when a processing method was applied, two replicates were confirmed positive at 15 CFU/mL spore load (60 CFU/g). The RV-PCR analytical method consistently detected BaS spores with an initial load of ≥ 15 CFU/mL (60 CFU/g), and when a processing method was applied, two replicates were positive at the 1.5 CFU/mL spore load (6 CFU/g).
For storm water runoff samples with relatively low background microbial load and particulates, the culture analytical method detected the presence of BaS spores in all replicates with ≥ 0.7 CFU/mL load, whereas only one replicate at the same spore load was detected for the RV-PCR method. The performance of analytical methods (culture and RV-PCR) was the same for the reference and modified baseline methods.
When a processing method was applied, sensitivity for RV-PCR analytical method was lower than the culture method. A BaS spore load of 15 CFU/mL for RV-PCR was consistently detected from the soil and wet vacuum TAS when a processing method was applied, compared to 150 CFU/mL for culture. The processing methods described in this study improve the sensitivity of the analytical methods, culture, and RV-PCR when applied to TAS generated from soil and a wet vacuum collection from concrete sidewalks in an urban environment by decreasing the background microbial levels and inert material of the TAS. Also, the processing method may be simultaneously disaggregating the spores from the inert material. Following a bioterrorism attack involving Ba spores, improved detection of Ba from the challenging TAS enables decision-makers to better understand the extent of contamination, effectiveness of decontamination approaches, and residual risk of contaminants in impacted areas.
Supplementary Material
Acknowledgements
We would like to thank Ken Connelly, Nate Poland, Anthony Smith, Hiba Shamma, Dave Albertson, and Lindsay Catlin at Battelle Memorial Institute for their execution of sample processing over the course of the study.
Funding
The US Environmental Protection Agency, through its Office of Research and Development, funded and directed the research described herein under EP-C-16–014 with Battelle Memorial Institute.
Footnotes
Conflict of interest The author declare no competing interests.
Disclaimer This manuscript has been subject to an administrative review, but does not necessarily reflect the views of the Agency. No official endorsement should be inferred. EPA does not endorse the purchase or sale of any commercial products or services.
Supplementary Information The online version contains supplementary material available at https://doi.org/10.1007/s10661-022-10467-0.
Contributor Information
Scott Nelson, Battelle Memorial Institute, King Avenue, Columbus, OH, USA.
Kent Hofacre, Battelle Memorial Institute, King Avenue, Columbus, OH, USA.
Sanjiv Shah, U.S. Environmental Protection Agency, Pennsylvania Avenue, Washington, DC, USA.
Erin Silvestri, U.S. Environmental Protection Agency, Martin Luther King Drive, Cincinnati, OH, USA.
Vicente Gallardo, U.S. Environmental Protection Agency, Martin Luther King Drive, Cincinnati, OH, USA.
Anne Mikelonis, U.S. Environmental Protection Agency, 109 TW Alexander Drive, Durham, NC 27711, USA.
Ryan James, Battelle Memorial Institute, King Avenue, Columbus, OH, USA.
M. Worth Calfee, U.S. Environmental Protection Agency, 109 TW Alexander Drive, Durham, NC 27711, USA.
Data availability
All data are publicly available at data.gov, https://doi.org/10.23719/1526539.
References
- Calfee MW, Rose LJ, Morse S, Mattorano D, Clayton M, Touati A, Griffin-Gatchalian N, Slone C, & McSweeney N (2013). Comparative evaluation of vacuum-based surface sampling methods for collection of Bacillus spores. Journal of Microbiological Methods, 95(3), 389–396. 10.1016/j.mimet.2013.10.015 [DOI] [PMC free article] [PubMed] [Google Scholar]
- Dragon DC, & Rennie RP (2001). Evaluation of spore extraction and purification methods for selective recovery of viable Bacillus anthracis spores. Letters in Applied Microbiology, 33(2), 100–105. 10.1046/j.1472-765x.2001.00966.x [DOI] [PubMed] [Google Scholar]
- Griffin DW, Lisle JT, Feldhake D, & Silvestri EE (2019). Colony-forming unit spreadplate assay versus liquid culture enrichment-polymerase chain reaction assay for the detection of Bacillus endospores in soils. Geosciences, 10(1), 5. Retrieved June 5, 2022, from https://www.ncbi.nlm.nih.gov/pmc/articles/PMC7784721/pdf/nihms-1651953.pdf [DOI] [PMC free article] [PubMed] [Google Scholar]
- Kim H, & Goepfert J (1974). A sporulation medium for Bacillus anthracis. Journal of Applied Bacteriology, 37(2), 265–267. 10.1111/j.1365-2672.1974.tb00438.x [DOI] [PubMed] [Google Scholar]
- Lee SD (2018). Evaluation of commercial wet vacuums for anthrax sampling. U.S. Environmental Protection Agency, Washington, DC, EPA/600/R-18/158. Retrieved June 5, 2022, from https://cfpub.epa.gov/si/si_public_record_report.cfm?dirEntryId=341891&Lab=NHSRC&fed_org_id=1253&subject=Homeland%20Security%20Research&view=desc&sortby=pubDateYear&showcriteria=1&count=25 [Google Scholar]
- Létant SE, Murphy GA, Alfaro TM, Avila JR, Kane SR, Raber E, Bunt TM, & Shah SR (2011). Rapidviability PCR method for detection of live, virulent Bacillus anthracis in environmental samples. Applied and Environmental Microbiology, 77(18), 6570–6578. 10.1128/AEM.00623-11 [DOI] [PMC free article] [PubMed] [Google Scholar]
- Mikelonis AM, Abdel-Hady A, Aslett D, Ratliff K, Touati A, Archer J, Serre S, Mickelsen L, Taft S, & Calfee MW (2020). Comparison of surface sampling methods for an extended duration outdoor biological contamination study. Environmental Monitoring and Assessment, 192(7), 455. 10.1007/s10661-020-08434-8 [DOI] [PMC free article] [PubMed] [Google Scholar]
- Rose LJ, Hodges L, O’Connell H, & Noble-Wang J (2011). National validation study of a cellulose sponge wipe-processing method for use after sampling Bacillus anthracis spores from surfaces. Applied and Environmental Microbiology, 77(23), 8355–8359. 10.1128/AEM.05377-11 [DOI] [PMC free article] [PubMed] [Google Scholar]
- Shah S (2017). Protocol for detection of Bacillus anthracis in environmental samples during the remediation phase of an anthrax incident, 2nd edition. U.S. Environmental Protection Agency, Washington, DC. Retrieved June 5, 2022, from https://cfpub.epa.gov/si/si_public_record_report.cfm?Lab=NHSRC&dirEntryId=338673 [Google Scholar]
- Silvestri EE, Feldhake D, Griffin D, Lisle J, Nichols TL, Shah SR, Pemberton A, & Schaefer FW (2016). Optimization of a sample processing protocol for recovery of Bacillus anthracis spores from soil. Journal of Microbiological Methods, 130, 6–13. 10.1016/j.mimet.2016.08.013 [DOI] [PMC free article] [PubMed] [Google Scholar]
- Silvestri EE, Perkins SD, Feldhake D, Nichols T, & Schaefer FW (2015). Recent literature review of soil processing methods for recovery of Bacillus anthracis spores. Annals of Microbiology, 65(3), 1215–1226. 10.1007/s13213-014-0932-x [DOI] [Google Scholar]
- Turnbull PC, Frawley DA, & Bull RL (2007). Heat activation/shock temperatures for Bacillus anthracis spores and the issue of spore plate counts versus true numbers of spores. Journal of Microbiological Methods, 68(2), 353–357. 10.1016/j.mimet.2006.09.014 [DOI] [PubMed] [Google Scholar]
- U.S. Environmental Protection Agency (EPA). (2021). Industrial stormwater monitoring and sampling guide EPA 832-B-09–003. Retrieved June 5, 2022, from https://www.epa.gov/sites/default/files/2015-11/documents/msgp_monitoring_guide.pdf
Associated Data
This section collects any data citations, data availability statements, or supplementary materials included in this article.
Supplementary Materials
Data Availability Statement
All data are publicly available at data.gov, https://doi.org/10.23719/1526539.