Abstract
Keloids are formed due to abnormal hyperplasia of the skin connective tissue. We explored the relationship between N6‐methyladenosine (m6A)‐related genes and keloids. The transcriptomic datasets (GSE44270 and GSE185309) of keloid and normal skin tissues samples were obtained from the Gene Expression Omnibus database. We constructed the m6A landscape and verified the corresponding genes using immunohistochemistry. We extracted hub genes for unsupervised clustering analysis using protein–protein interaction (PPI) network; gene ontology enrichment analysis was performed to determine the biological processes or functions affected by the differentially expressed genes (DEGs). We performed immune infiltration analysis to determine the relationship between keloids and the immune microenvironment using single‐sample gene set enrichment analysis and CIBERSORT. Differential expression of several m6A genes was observed between the two groups; insulin‐like growth factor 2 mRNA‐binding protein 3 (IGF2BP3) was significantly upregulated in keloid patients. PPI analysis elucidated six genes with significant differences between the two keloid sample groups. Enrichment analysis revealed that the DEGs were mainly enriched in cell division, proliferation, and metabolism. Moreover, significant differences in immunity‐related pathways were observed. Therefore, the results of this study will provide a reference for the elucidation of the pathogenesis and therapeutic targets of keloids.
Keywords: enrichment analysis, GEO, immune infiltration, keloid, m6A
1. INTRODUCTION
Keloids are pathological scars caused by fibroproliferative diseases. They often occur secondary to trauma, infections, burns, or postoperative wounds. Their growth usually exceeds the original injury limit and presents as invasive growth. Most patients experience clinical symptoms such as itching and pain, which cause discomfort to the patients, both physiologically and psychologically. 1 In China, high incidence body parts of keloid disease are the earlobes, chest, shoulders, and the back. 2 The common clinical treatment methods for keloids include surgical resection, physical therapy (such as radiotherapy, laser therapy, stress therapy), and drug therapy (such as glucocorticoid, botulinum toxin A), but these treatment methods are ineffective, with a high recurrence rate. 3 , 4 , 5 Moreover, because the specific pathogenesis of keloids is not clear, their curative treatment is difficult. Therefore, pathogenesis of keloids at the molecular level should be investigated. 6
Recent studies have shown that gene silencing at the epigenetic level (such as DNA methylation and histone modification) is a potential mechanism for keloid formation. However, due to the lack of sufficient in vivo animal research and multicellular culture data, this theory has not been validated. 7 , 8 Epigenetic modifications are the focus of research on the occurrence and development of different diseases. N6‐methyladenosine (m6A) methylation is one of the most extensively used epigenetic methods for mRNA modification. It participates in all RNA‐related processes and regulates a series of cellular biological processes, such as growth and development, inflammation, and cancer, by regulating the metabolism and translation of mRNA. 9 , 10 Moreover, m6A can regulate gene expression, thus regulating cellular processes, such as self‐renewal, differentiation, invasion, and apoptosis. 11 Few studies have also associated m6A‐related genes with keloids. Therefore, in this study, we performed bioinformatic analysis to explore the relationship between m6A and keloids to provide insights into the pathogenesis and therapeutic targets of keloids.
Currently, bioinformatics analysis is an important tool for analysing expression data and screening target genes in many diseases. Therefore, a holistic approach in using gene detection technology and bioinformatics will enable effective exploration of the mechanisms underlying the pathogenesis of various diseases, including keloids.
In this study, two keloid mRNA microarray datasets from the Gene Expression Omnibus (GEO) database were integrated, m6A genes were divided into three categories (writer, reader, and eraser), and the landscape of m6A genes was constructed. The differentially expressed genes (DEGs) in these three groups of m6A genes, especially insulin‐like growth factor 2 mRNA‐binding protein 3 (IGF2BP3) in the reader category, were significantly upregulated in patients with keloids. Next, we performed immunohistochemical analysis of this gene and reached the same conclusion, indicating that this gene could be a potential diagnostic marker for keloids with high diagnostic efficiency. We constructed a protein–protein interaction (PPI) network and performed gene enrichment analysis. Finally, we explored immune cell infiltration into the keloid microenvironment. This study lays the foundation for exploring the molecular mechanisms underlying the pathogenesis of keloids and will help identify potential diagnostic biomarkers of keloids.
2. MATERIALS AND METHODS
2.1. Data acquisition
We downloaded GSE44270 12 and GSE185309 gene expression datasets containing data for keloid patients and control groups from the GEO database. The samples for the data were obtained from Homo sapiens, and the sequencing platforms used were GPL16699 and GPL24676. Dataset GSE44270 contained 12 samples, including 3 control samples and 9 keloid patient samples, and dataset GSE185309 contained 17 samples, including 8 control samples and 9 keloid patient samples. We integrated these two groups of data for downstream analysis, using the SVA package 13 to correct the batch effect between different datasets and standardised the log2 values. The expression distribution after standardisation and batch correction was visualised using a box plot.
2.2. Construction of a landscape based on m6A genes
To analyse the expression of m6A genes in all samples, data regarding m6A‐related genes were obtained from the literature, 14 , 15 , 16 , 17 including 11 writer genes, 26 reader genes, and 3 eraser genes, that is, a total of 40 genes, which were overlapped with the existing expression profile, leaving a total of 36 genes.
First, we used the “pheatmap” package to construct the expression heatmap of these genes for all samples. Next, we used the “ggpubr” package to construct the grouping box diagram based on the normal and patient samples. The Wilcoxon rank‐sum test was used to determine statistical significance between groups; P > .05 was considered statistically significant. The “RCircos” package was used to map the locations of the 36 genes on the chromosomes. Chromosomal data were provided by the R package, and the information regarding the location of the genes on the chromosomes was downloaded from the Ensembl 18 database.
2.3. Correlation analysis between writer and eraser genes
To further analyse the correlation between the expression of the writer and eraser genes in all patients, the Pearson correlation coefficient between the two groups of genes was calculated. The absolute value of the correlation coefficient was >0.7, and P‐value was >.01, indicating a correlation. We used the “ggplot2” package to construct a correlation scatter diagram between the gene pairs that met the requirements and fit the correlation curve; the “ggExtra” package was used to construct a histogram and a density curve of the graph edge.
2.4. Construction of a diagnostic model based on m6A genes
Because of the influence of the m6A modification process, normal and patient samples may have different m6A‐modification states; therefore, we built a diagnostic model for keloids based on m6A‐related genes.
We used the ridge regression method and the “glmnet” package to screen all m6A genes and to implement this method, respectively. Next, we selected the best lambda value and retained genes with coefficients other than zero after the regression. Further gene screening was performed using logistic regression, and the genes used to build the model and their corresponding coefficients were displayed in the form of a forest map constructed using the “forestplot” package.
To check the multifactor influence of high‐weight genes in the diagnostic model, a new logistic multivariate regression model was constructed using the “rms” package for the first 15 genes with the largest absolute weight in the previous model, and a nomogram was used for visualisation. To verify the predictive efficiency of the diagnostic model, the receiver operating characteristic (ROC) curve of the model was constructed using the “pROC” package, and the area under the curve (AUC) was calculated. To illustrate the effectiveness of the nomogram, internal datasets and decision curve analysis (DCA) curves were used for verification. The DCA curve was drawn using the “ggDCA” package.
2.5. Construction of PPI network
Gene expression is generally interrelated, especially of those genes that regulate the same biological processes. Therefore, to reveal the relationship between m6A‐related genes, a PPI network was constructed based on the expression of m6A‐related genes.
We used data from the STRING 19 database to construct the PPI network, and the confidence threshold was set at a default value of 0.4. Next, the PPI network was exported and further analysed using the Cytoscape 20 software to calculate the network attributes of each node. The plug‐in cytoHubba 21 was used to mine hub nodes based on the degree of the node, and the top 10 nodes with the degree of TOP10 were defined as hub nodes. These nodes have a high level of connection with other nodes; therefore, they may play an important role in the regulation of the entire biological process.
Based on the MIRNet 22 database, we predicted the miRNAs and transcription factors of the 10 hub nodes. After the predicted results were exported, Cytoscape was used for processing and plotting.
2.6. Unsupervised clustering of samples
We performed unsupervised clustering of samples based on hub genes resolve heterogeneity among patients and reclassify the samples. First, we used the “factoextra” package to determine the best number of clusters. Next, we used the k‐means clustering method to cluster all patients according to the best number of clusters and finally clustered the samples into two categories. Simultaneously, the “factoextra” package was used to check the final clustering effect. The expression of the 10 hub genes in the two groups of samples is presented as a heatmap. The “ggpubr” package was used to construct a grouping violin diagram based on the sample clustering labels. The Wilcoxon rank sum test was used to test the statistical significance between groups, and P > .05 was considered statistically significant.
2.7. Gene set enrichment analysis (GSEA)
To further reveal the biological differences between the two sample groups, they were analysed for differential gene expression. The results are displayed using a volcano map and a heatmap. Genes with corrected P < .05 and log2|FC| >1 were considered significant DEGs, and these genes were used for GSEA.
Gene ontology (GO) enrichment analysis is a common method for large‐scale functional enrichment of genes in different dimensions and at different levels and is performed at three levels: biological process (BP), molecular function (MF), and cellular component (CC). 23 We used the “clusterProfiler” package 24 , 25 to annotate the GO functions of all significant DEGs to identify the significantly enriched BPs. The enrichment results were visualised in the form of bar and bubble charts. The significance threshold of the enrichment analysis was set to a corrected P‐value <.05.
GSEA is a calculation method used to determine whether a group of predefined genes shows statistical differences between two biological states. It is used to estimate changes in pathways and biological process activity in expression dataset samples. 26
To investigate the differences in biological process between the two groups of samples, based on the gene expression profile dataset, the reference gene sets “c5.go.v7.4. entrez.gmt” and “c2.cp.kegg.v7.4. entrez.gmt” were downloaded from the MSigDB database, 27 and the dataset was enriched, analysed, and visualised using the GSEA method of the “clusterProfiler” package. Differences were considered statistically significant at a corrected P‐value <.05.
2.8. Immune infiltration analysis
The immune microenvironment is mainly composed of immune cells, inflammatory cells, fibroblasts, interstitial tissue, and various cytokines and chemokines. It is a loaded, integrated system. Analysis of immune cell infiltration in tissues plays an important role in disease research and prognosis prediction.
To explore the similarities and differences in immune cell infiltration levels between the two groups of samples, the “GSVA” package 28 was used to perform single sample GSEA (ssGSEA). The marker genes of 28 immune cells were obtained from the literature 29 and used as the background gene set to analyse each sample using ssGSEA. The infiltration level of all immune cells is displayed using a heatmap and box diagram. Simultaneously, the “corrplot” package was used to construct a correlation map between immune cells for the two groups of samples to reveal the similarities and differences in the correlation degree of immune cells in different disease states.
To maximise the accuracy of the results, we used CIBERSORT 30 to evaluate the infiltration level of immune cells and calculated the proportion of 22 types of immune cells in each sample based on the LM22 background gene set provided by CIBERSORT. The results are presented as box diagrams. Moreover, to directly check the correlation between hub genes and immune cell infiltration levels, a correlation scatter diagram was constructed for gene‐immune cell pairs with significant correlation, and the correlation curve was fitted. The histograms and density curves of the graph edges were plotted using the “ggExtra” package (Figure 1).
FIGURE 1.
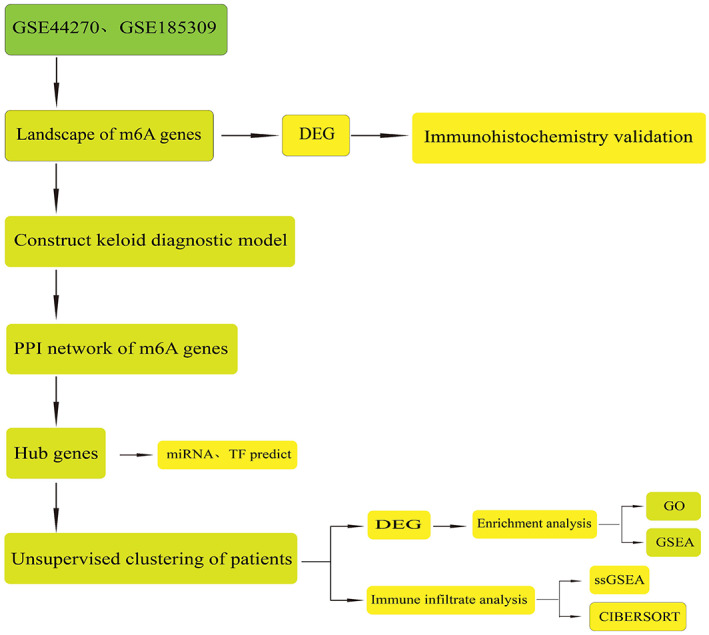
Design and workflow of this study.
3. RESULTS
3.1. Landscape of m6A genes
We built a landscape of the m6A‐related genes in all samples by integrating the expression profiles from the GSE44270 and GSE185309 datasets. Because datasets from different sources exhibit batch effects, we corrected the batch effects and standardised the log value of the original data (Figure 2A). After batch correction and log standardisation, the expression distribution of all samples was consistent, which is conducive for improving the accuracy and robustness of downstream analysis.
FIGURE 2.
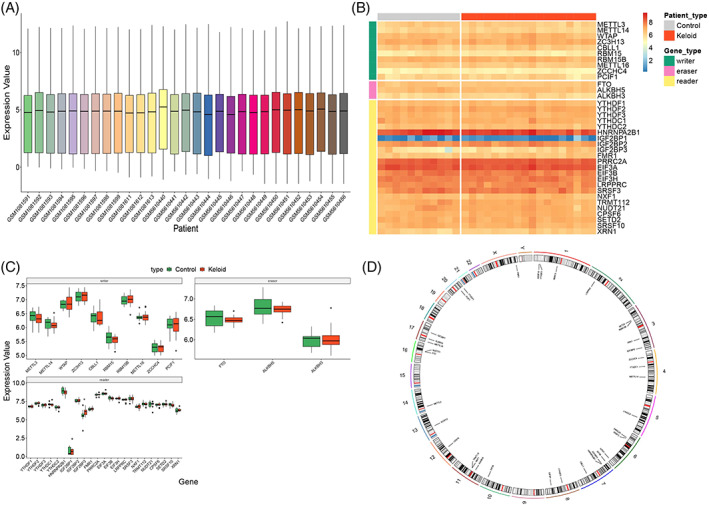
Data preprocessing and the landscape of m6A genes. (A) Expression of m6A genes after batch effect correction and log standardisation. X‐axis is the sample, and y‐axis is the gene expression value. The center, upper‐frame, and lower‐frame lines of the box chart are the median, upper‐quartile, and lower‐quartile values, respectively. Heatmap (B) represents the expression pattern of the differentially expressed genes in the keloid patients versus that in the normal population group, and samples and different types of genes are depicted by different coloured block markers. Red and blue represent high and low expression values, respectively. (C) Box diagram of m6A genes. X‐axis is the gene, and y‐axis is the gene expression value. The sample groups are distinguished by different colours and drawn according to the gene type. The middle, upper‐frame, and lower‐frame lines of the box chart are median, upper‐quartile, and lower‐quartile values, respectively. (D) Ring diagram for chromosome location. The outer circle is the chromosome, and the inner circle is the location mark of these genes on the chromosome.
Next, the differential expression of all m6A genes in the normal and keloid samples was visualised via a heatmap and a group box plot (Figure 2B,C). The results revealed genes with different expression trends among the three types of m6A genes. For example, methyltransferase‐like protein 3 (METTL3) and methyltransferase‐like protein 14 (METTL14) genes were downregulated in keloid patients, whereas IGF2BP3 from the reader group exhibited upregulation in keloid patients. We performed preliminary immunohistochemical verification of IGF2BP3, which revealed that it was highly expressed in keloids and weakly expressed in normal tissues (Figure 3A,B). Moreover, we constructed a landscape of the locations of these genes on the chromosomes (Figure 2D). The results revealed that the location of some genes was very similar on the chromosomes; therefore, these genes were closely related at the genomic level and may have similar expression characteristics at the transcriptome level.
FIGURE 3.
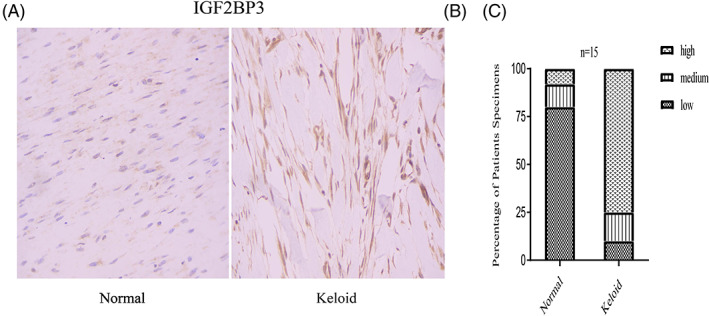
Immunohistochemistry staining and histologic scoring. (A) Expression of IGF2BP3 in normal tissue. (B) Expression of IGF2BP3 in normal tissue. (C) Results of histologic scoring and analysis.
3.2. Correlation between writer and eraser genes
To further analyse the relationship between the writer and eraser m6A genes, we calculated the correlation coefficient between these genes, constructed a correlation scatter plot, and fitted the correlation curve. Six pairs of gene met the statistical significance threshold, namely METTL3‐ALKBH5, WT1 associated protein (WTAP)‐CBLL1, WTAP‐ALKBH3, ZC3H13‐CBLL1, ZC3H13‐ methyltransferase‐like protein 16 (METTL16), and RBM15B‐ALKBH3 (Figure 4). They were all strongly positively correlated because their absolute correlation coefficient was >0.7. Overall, most of these gene pairs were pairs of writer and eraser genes. Writer and eraser genes have similar functions, suggesting a synergy in expression. Moreover, the positive correlation between writer and eraser genes indicates a negative feedback regulation mechanism or an unknown key pathogenesis mechanism between them.
FIGURE 4.
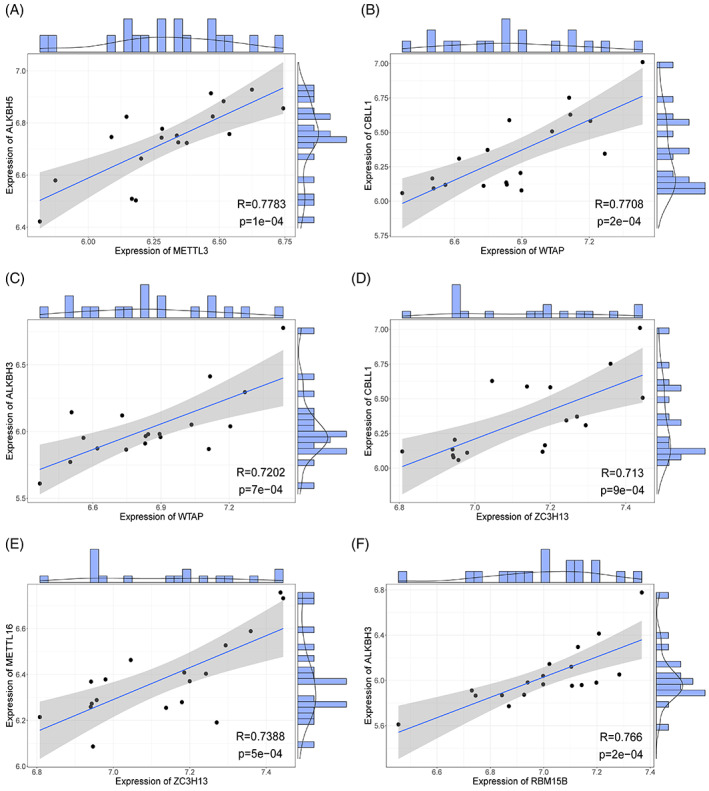
Correlation analysis between writer and eraser m6A genes. Each point in the figure represents a patient sample; the straight line is the correlation fitting curve; the shaded part is the confidence interval; and the area outside the figure are the histogram and density curve. (A) Correlation between METTL3‐ALKBH5. (B) Correlation between WTAP‐CBLL1. (C) Correlation between WTAP‐ALKBH3. (D) Correlation between ZC3H13‐CBLL1. (E) Correlation between ZC3H13‐METTL16. (F) Correlation between RBM15B‐ALKBH3.
3.3. Diagnostic model of m6A genes
Because the expression of m6A‐regulated genes has important biological significance, we constructed a diagnostic model for keloids based on all m6A genes. First, the ridge regression method was used to screen all m6A genes, the best lambda value was determined, and 36 genes were retained (Figure 5A,B). To further tighten the screening process, secondary screening was performed using logistic regression, and 27 genes were retained. A forest map was constructed to visualise the diagnostic model composed of the 27 m6A genes (Figure 5C). The results revealed that the top five genes with the largest absolute influence coefficients in this model were Methyltransferase‐like protein 16 (METTL16), YTH N6‐methyladenosine RNA‐binding protein 3 (YTHDF3), YTH domain containing 2 (YTHDC2), WT1 Associated Protein (WTAP), and zinc finger CCHC‐type containing 4 (ZCCHC4), and their influence coefficients were 168.75, −146.02, 140.65, 93.02, and −91.24 respectively. To verify the accuracy of the model, we selected the first 15 genes with the largest absolute coefficient values to construct a logistic multivariate model and visualised it using a nomogram (Figure 6A). These 15 genes had a high degree of common influence on the prediction model, highlighting the accuracy of the model. The prediction efficiency of the model was further verified using the recall, ROC, and DCA curves (Figure 6B–D). The model had superior prediction efficiency and robustness for all three verification methods. The recall and ROC curves revealed that the overall AUC of the model was 0.93, indicating excellent diagnostic and predictive abilities.
FIGURE 5.
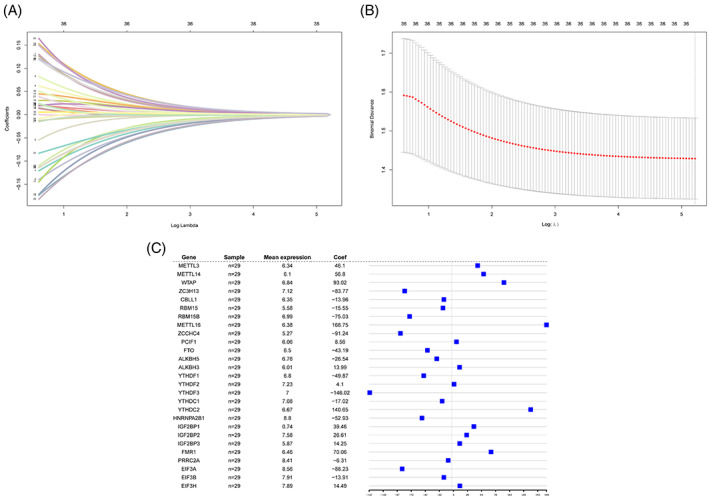
Construction of m6A gene‐based diagnosis model for keloids. (A) Ridge regression curve. This figure shows the convergence screening process of ridge regression for 36 genes. X‐axis is the log lambda value, y‐axis is the regression coefficient, and different coloured lines represent different features. (B) This figure is used to select the best lambda value of the regression model. Usually, the lowest point is selected, that is, the dotted line in the figure is the best lambda value. (C) Forest map of diagnostic model. The first, second, third, and fourth columns and corresponding graphs of the fourth column present the 27 genes that make up the model, number of samples, and average expression value of these genes, and influence coefficients of these genes in the model, respectively.
FIGURE 6.
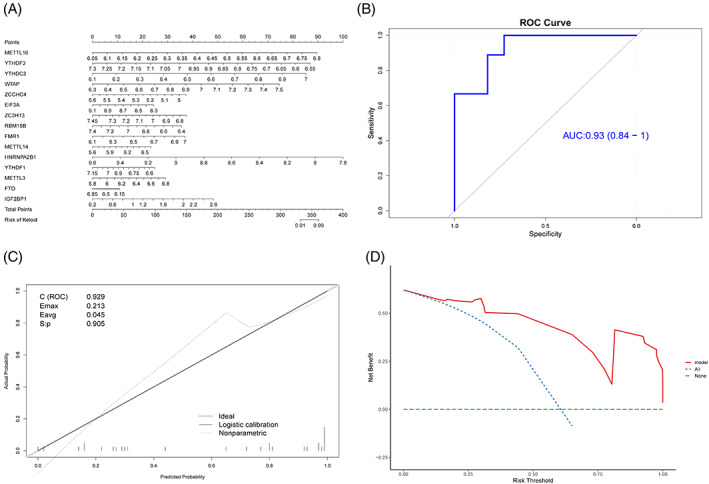
Verification of diagnosis model based on m6A genes. (A) Nomogram chart; the left and the right sides are the prediction index and the ruler, respectively. (B) ROC curve of the model; x‐axis is specificity, y‐axis is sensitivity, and AUC is the area under the curve. C (ROC) is the area under the ROC curve. (D) DCA curve; x‐axis is the risk threshold, y‐axis is the net benefit rate, green dotted line represents 0 net benefit rate, blue dotted lines represent that all samples have been intervened, and model (red solid line) represents the model curve.
3.4. Interaction network of m6A genes
The genes that regulate the same biological processes have closer relationships because of the universal connections between genes; therefore, to analyse the interaction between m6A‐regulatory genes, a PPI network was constructed using the STRING database and visualised using the Cytoscape software (Figure 7A).
FIGURE 7.
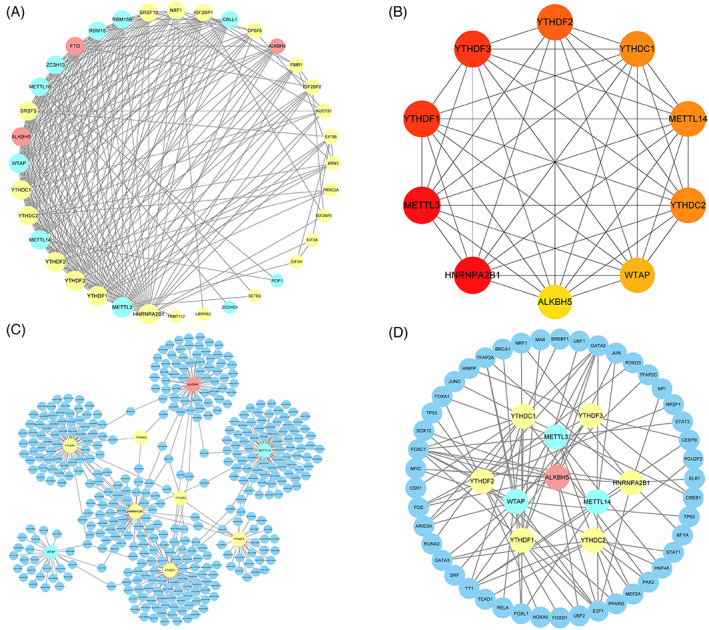
PPI network. (A) PPI network of 36 m6A genes. Yellow, blue, and represent the reader, writer, and eraser genes, respectively. The higher the degree of the node, the larger the graph. (B) Ten hub genes. For the sub networks of the 10 hub genes extracted from PPI network, the redder the node colour, the larger the node in the original network. (C) miRNA prediction network of hub genes. Dark blue represents miRNA, and other colours are the same as those for panel A. (D) TF prediction network of hub genes. Dark blue represents transcription factors, and other colours are the same as those for panel A.
In the PPI network, a few nodes have higher degrees; that is, they are more closely connected to other nodes. Genes in this part of the network are more significant in the entire network. Therefore, we extracted 10 genes with top10 in the network as hub genes for further analysis (Figure 7B). The MIRNet database was used to predict the miRNAs and transcription factors of these hub genes to comprehensively analyse their genetic backgrounds and regulatory networks (Figure 7C,D). The results revealed that these genes shared exclusive miRNAs or transcription factors; therefore, they might regulate the same process to reflect similar biological functions.
3.5. Unsupervised clustering based on hub genes
Hub genes can be used to distinguish samples with different disease states; therefore, we used the expression profiles of the 10 hub genes to perform unsupervised clustering of all patient samples using the k‐means clustering method. First, the optimal number of clusters was determined by calculating the contour values (Figure 8A). The results showed that when the number of clusters was two, the contour value was the highest and the clustering effect was the best. Therefore, we chose 2 (k‐value) as the best clustering number for the unsupervised clustering, and all samples were grouped into two categories. Next, we reduced the dimensions to visualise the clustering effect (Figure 8B), and the results revealed that the two groups of samples were clearly divided and the clustering effect was excellent.
FIGURE 8.
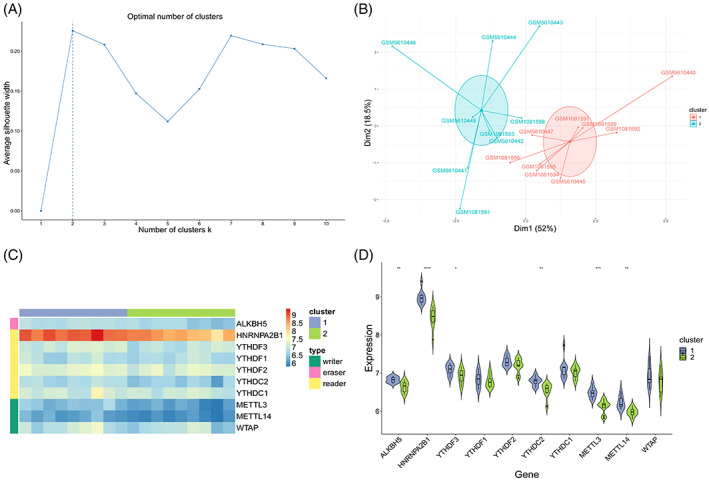
Unsupervised clustering of samples. (A) Selection of the best number of clusters. X‐axis is the number of clusters, and y‐axis is the average contour value. Best number of clusters was selected by calculating the average contour value, and the best number is present at the maximum contour value (dotted line). (B) Dimension reduction graph of K‐means clustering results. X‐axis and y‐axis represent two dimensions, and each point in the figure represents a patient sample. These patients are grouped into two groups, and each colour represents a patient subgroup. (C) Heatmap. Grouping and gene type of the samples are marked with different coloured blocks. In the figure, blue represents low expression value and red represents high expression value. (D) Combination of box diagram and violin diagram. X‐axis is the gene, y‐axis is the gene expression value, and sample groups are distinguished by different colours. Middle, upper‐frame, and lower‐frame lines of the box chart represent median, upper‐quartile, and lower‐quartile values, respectively. Wilcoxon rank sum test was used for statistical analysis. Upper symbol represents the significance level of the difference, * represents P < .05, ** represents P < .01, *** represents P < .001, **** represents P < .0001, and ns represents not significant.
The expression levels of all hub genes in the two types of samples were visualised using the heat map, box plot, and violin map (Figure 8C,D). Six of the 10 hub genes exhibited significant differences in expression between the two groups of samples (P < .05), indicating that these six genes might be important distinguishing factors and reflecting the effectiveness and accuracy of the clustering results. Heterogeneous nuclear ribonucleoprotein A2/B1 (HNRNPA2B1) and METTL3 exhibited a high level of difference in expression (P < .001). This shows that the genes of this family are significantly different in patients with keloids, which warrants further investigation (Table 1).
TABLE 1.
Summary of GEO datasets information.
3.6. Biological differences between sample groups
To reveal the biological differences between the two groups of samples, we performed differential gene expression analysis between the groups with sample grouping as the label. After statistical significance threshold screening, 196 genes were used; a volcano map and a heat map were used to visualise the DEGs (Figure 9A,B).
FIGURE 9.
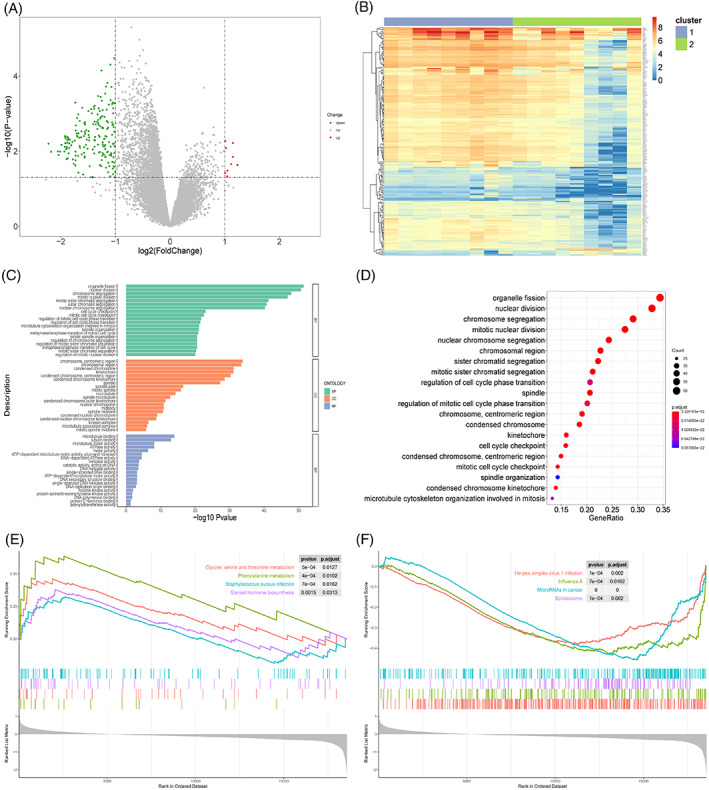
Biological differences between sample groups. (A) Volcano map of differentially expressed genes. X‐axis is log2 (foldchange), and y‐axis is ‐log10 (P‐value). Each point represents a gene. Green, red, and grey represent downregulated genes, upregulated genes, and genes without significant change in expression, respectively. (B) Heatmap of differentially expressed genes. Upper colour bar represents two groups of samples; each colour represents a subgroup; blue represents low expression, and red represents high expression. (C) Bar graph of GO enrichment results. X‐axis represents ‐log10 (P‐value), and y‐axis represents enriched GO terms. Only top 20 GO terms from BP, CC, and MF categories are shown here. (D) Bubble chart of GO enrichment results. X‐axis is the gene proportion, that is, the total number of genes/differentially expressed genes enriched for a term; y‐axis is the name of the GO term, and the size of the point represents the number of genes enriched for this term; and the colour represents the corrected P‐value. The smaller the P‐value, the closer it is to red, that is, the difference is more significant. Only the top 20 GO terms are shown here. (E) GSEA analysis results (upregulated part). X‐axis is the rank of genes in the list of differentially expressed genes, with upregulation >0 and downregulation <0. Upper y‐axis is the enrichment fraction, and the lower y‐axis is the log2|FC| value. Each colour represents a pathway. Only the first four pathways with the most significant upregulation are shown here. (F) GSEA analysis results (downregulation part). Only the first four pathways with the most significant downregulation are shown here.
To check the biological processes or functions affected by these DEGs, GO enrichment analysis and GSEA were performed for all genes (Figure 9C–F, Tables 2 and 3). A total of 365 GO terms were enriched by the GO enrichment analysis, of which the first seven were the most significant at the BP level, including organelle fission, nuclear division, chromosomal aggregation, mitotic nuclear division, mitotic sister chromosomal aggregation, sister chromosomal aggregation, and nuclear chromosomal aggregation; all processes were related to cell division and proliferation. Therefore, differences in the cell division activity are possible between the two groups of patients during scar repair.
TABLE 2.
Go enrichment analysis results.
| Description | ONTOLOGY | Padj |
|---|---|---|
| Organelle fission | BP | 3.33 E‐52 |
| Nuclear division | BP | 1.80 E‐51 |
| Chromosome segregation | BP | 1.34 E‐48 |
| Mitotic nuclear division | BP | 1.47 E‐47 |
| Mitotic sister chromatid segregation | BP | 5.31 E‐42 |
| Sister chromatid segregation | BP | 1.93 E‐41 |
| Nuclear chromosome segregation | BP | 5.67 E‐41 |
| Chromosome, centromeric region | CC | 1.56 E‐34 |
| Chromosomal region | CC | 4.22 E‐34 |
| Condensed chromosome | CC | 6.86 E‐32 |
| Kinetochore | CC | 7.86 E‐32 |
| Condensed chromosome, centromeric region | CC | 4.62 E‐31 |
| Condensed chromosome kinetochore | CC | 2.75 E‐29 |
| Spindle | CC | 5.69 E‐28 |
| Cell cycle checkpoint | BP | 9.17 E‐24 |
| Mitotic cell cycle checkpoint | BP | 2.69 E‐23 |
| Regulation of mitotic cell cycle phase transition | BP | 1.62 E‐22 |
| Regulation of cell cycle phase transition | BP | 2.92 E‐22 |
| Microtubule cytoskeleton organisation involved in mitosis | BP | 6.54 E‐22 |
TABLE 3.
GSEA enrichment analysis results.
| Description | NES | Padj |
|---|---|---|
| DNA replication | −2.3750851 | 1.09 E‐08 |
| Cell cycle | −2.1726079 | 1.09 E‐08 |
| Olfactory transduction | −2.2790885 | 1.09 E‐08 |
| MicroRNAs in cancer | −1.6518353 | 1.25 E‐05 |
| Fanconi anaemia pathway | −2.090306 | 1.72 E‐05 |
| Homologous recombination | −2.0734393 | 0.00010828 |
| Oocyte meiosis | −1.7769339 | 0.00018851 |
| Mismatch repair | −1.9540856 | 0.00200251 |
| Herpes simplex virus 1 infection | −1.402872 | 0.00200251 |
| Spliceosome | −1.6360944 | 0.00200554 |
| Progesterone‐mediated oocyte maturation | −1.7256371 | 0.00248844 |
| Phenylalanine metabolism | 2.16784468 | 0.01019695 |
| Glycine, serine and threonine metabolism | 1.9370048 | 0.01270892 |
| Staphylococcus aureus infection | 1.69202206 | 0.01616912 |
| Influenza A | −1.4999934 | 0.01616912 |
| Steroid hormone biosynthesis | 1.69603814 | 0.03131591 |
Next, we used 16 KEGG pathways for GSEA, of which the first five most significant pathways were phenylalanine metabolism, glycine, serine, and threonine metabolism, steroid hormone biosynthesis, Staphylococcus aureus infection, and grape simple virus 1 infection, which mainly involved biological processes such as cell amino acid metabolism and synthesis, which were consistent with the GO enrichment analysis, as they are related to cell proliferation and metabolism.
3.7. Immune infiltration analysis
The enrichment analysis results revealed significant differences in the immune process between the two groups of samples. Therefore, to analyse the immune infiltration level between the two groups of samples, the ssGSEA method was used to calculate the scores of 28 immune cells in all samples, and a heatmap and a box diagram were constructed for visual analysis (Figure 10A,B). The results revealed that among the 28 types of immune cells, four exhibited significant differences in infiltration between the two groups, namely activated CD4+ T cells, type 2 helper T cells, activated dendritic cells, and eosinophils.
FIGURE 10.
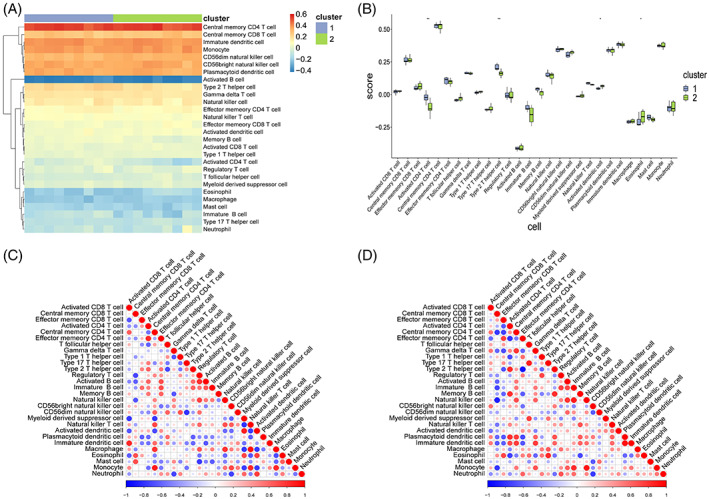
ssGSEA immune infiltration assessment. (A) Heatmap of immune scores. Red represents high infiltration level, and blue represents low infiltration level. (B) Box chart of immune scores. X‐axis represents 28 kinds of immune cells, y‐axis represents the level of immune infiltration, and each colour represents sample grouping. Wilcoxon rank sum test was used for statistical analysis. The above symbol represents the significance level of difference, * represents P < .05, ** represents P < .01, *** represents P < .001, **** represents P < .0001, and ns represents not significant. (C) Relevant bubble diagram of 28 immune cells in group 1 samples. (D) Relevant bubble diagram of 28 immune cells in group 2 samples.
Moreover, to determine the correlation between immune cells, the correlation coefficients between immune cells were calculated in the two groups of samples (Figure 10C,D). The results revealed that some immune cells had different correlations between the two groups of samples. For example, three types of dendritic cells and central memory CD8+ T cells exhibited a positive correlation in the first group of patients but a negative correlation in the second group of patients, indicating that the two groups of samples had different immune microenvironment.
We used another method, the CIBERSORT package, to calculate the infiltration levels of the 22 immune cells in the two groups of samples (Figure 11A); the direct correlation between all hub genes and immune cell infiltration levels was calculated, and the significantly related gene‐immune cell pairs (Figure 11B–F) were screened. The results revealed that METTL3‐Neutrophils, HNRNPA2B1‐Neutrophils, YTHDF1‐follicular helper T cells, YTHDC1‐follicular helper T cells, and ALKBH5‐Neutrophils were significantly correlated. Among them, YTHDF1‐follicular helper T cells and THDC1‐ follicular helper T cells were positively correlated, whereas the other three pairs were negatively correlated, indicating that some m6A genes directly affect the infiltration level of certain immune cells in the body, which warrants further investigation.
FIGURE 11.
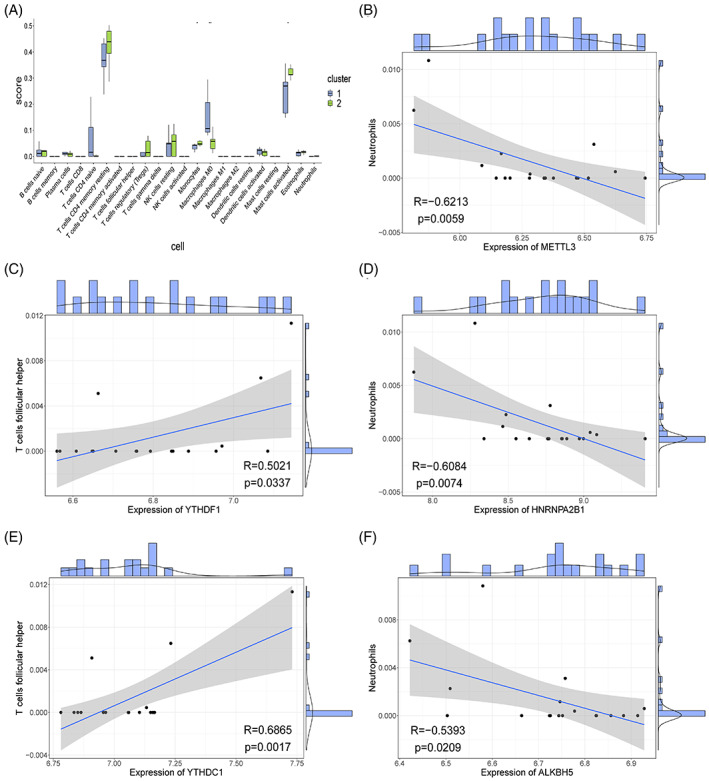
Immune infiltration assessment using CIBERSORT. (A) Immune scoring box chart. X‐axis represents 22 kinds of immune cells, y‐axis represents the level of immune infiltration, and each colour represents sample grouping. Wilcoxon rank sum test was used for statistical analysis. The above symbol represents the significance level of difference, * represents P < .05, ** represents P < .01, *** represents P < .001, **** represents P < .0001, and ns represents not significant. (B‐F) Correlation scatter. Each point in the figure represents a sample, the straight line is the correlation fitting curve, the shaded part is the confidence interval, and the outside of the figure is the histogram and density curve.
4. DISCUSSION
Enhanced collagen synthesis occurs when the regulation of collagen metabolism is impaired, which is likely to form pathological scars. 31 Keloids and hypertrophic scars are clinically similar and are easily confused during diagnosis. Although both are pathological scars, they exhibit unique growth characteristics. The most important feature of keloids is their continuous growth, which often goes beyond the boundary of the original wound, exhibiting invasive growth. 32 , 33 A hypertrophic scar grows rapidly within 3–6 months after wound healing, but after months or years of degradation, the scar eventually matures and clinical symptoms (such as itching and pain) decline or disappear. 34 , 35 Owing to the complexity of keloid pathogenesis, the current common prevention and treatment methods are not effective. Therefore, it is necessary to identify new targets related to keloids at the molecular level and potential biomarkers in the early stages to inhibit keloid growth and provide clinical references for the diagnosis and treatment of keloids. Therefore, with a focus on m6A‐related genes, we downloaded the GSE44270 and GSE185309 datasets from the GEO database, integrated the expression profiles of these two datasets, and conducted a comprehensive bioinformatic analysis of expression data from 18 keloid and 11 normal skin tissue samples. We screened m6A‐related genes from the literature, overlapped them with the existing expression profiles, and screened 36 m6A‐related genes (10 writer genes, 23 reader genes, and 3 eraser genes). We observed differences in the expression of these 36 m6A‐related genes between the keloid and normal tissues. We found that these three types of m6A genes had different expression trends; in particular, IGF2BP3, from the reader category, exhibited an obvious upregulation in keloid patients. Next, we performed immunohistochemical analysis of this gene, which revealed its high expression in keloids compared with that in normal tissues. Similarly, we inferred that IGF2BP3 is a target gene and could be considered a potential diagnostic biomarker of keloids. IGF2BP3 is a newly identified member of the m6A reader family. It binds to the target mRNA in an m6A‐dependent manner, recognises m6A modification sites, enhances mRNA stability by binding to the target mRNA, and protects m6A‐modified mRNA from degradation. 15 , 36 IGF2BP3 is mainly expressed in human tumours, such as liver and bladder cancers. 37 , 38 Keloids are benign skin tumours. However, the role of IGF2BP3 in keloids has not been elucidated; therefore, it should be explored in future studies.
We constructed a keloid diagnosis model for all m6A genes and screened 27 genes using ridge and logistic regression methods. Five genes with the highest influence coefficients were METTL16, YTHDF3, YTHDC2, WTAP, and ZCCHC4. METTL16 has recently been identified as an RNA methyltransferase responsible for depositing N‐methyladenosine (MA) in a few transcripts, and it acts as both an activity‐dependent and an activity‐independent methyltransferase in gene regulation. METTL16 plays an important role in liver cancer. However, the relationship between METTL16 and keloids has not been studied. 39 It has been previously reported that YTHDF3 relies on m6A methylation to effectively improve the translation of its target, but its overexpression promotes the occurrence and development of breast cancer. 40 , 41 However, the role of YTHDF3 in keloids has not been studied. As an m6A reader protein, YTHDC2 has been reported to play an important role in several types of tumours, 42 , 43 but its role in keloid pathogenesis is not reported. WTAP is an important component of the m6A methyltransferase complex. It interacts with the METTL3‐METTL14 heterodimer and jointly participates in the regulation of m6A modifications; however, its role in keloid development is not clear. 44 ZCCHC4 is a member of the zinc‐finger protein family and is an RNA‐binding protein. 45 A few previous studies have reported its role in keloids. In the present study, analysis, we found that these five m6A‐related genes were closely related to keloids using bioinformatics analyses; however, only a few studies have investigated keloids. Therefore, we believe that the role of these five genes in the pathogenesis of keloids should be explored. 46
To further analyse the interaction between m6A genes, we used the STRING database to construct a PPI network and extracted the first 10 genes for further analysis. We found that the regulation process of these genes was the same, suggesting that they had similar biological functions. We also used the K‐means clustering method to cluster these 10 hub genes in all keloid tissues. When the number of clusters was two, the contour value was the largest and the clustering effect was the best. Visual analysis of these genes revealed that six genes had significant differences between the two groups (P < .05), especially Heterogeneous Nuclear Ribonucleoprotein A2/B1 (HNRNPA2B1) and Methyltransferase‐like protein 14 (METTL14) exhibited high levels of difference (P < .001). HNRNPA2B1 belongs to a group of multifunctional RNA‐binding proteins that play an important role in the transcription process and are related to several key cellular functions. 47 Similarly, METTL14 is a major RNA N6 adenosine methyltransferase that participates in tumour progression by regulating RNA function; however, the role of these two genes has not been reported in the pathogenesis of keloids. 48 Therefore, these potential biomarkers warrant further investigation.
Furthermore, GO enrichment analysis and GSEA of all genes elucidated that these genes were related to cell proliferation and metabolism during scar repair. Finally, we used ssGSEA and CIBERSORT to explore the correlation between keloids and various immune cell types and found that the type of infiltrating immune cells significantly changed during keloid repair, especially activated CD4+ T cells, type 2 helper T cells, activated dendritic cells, and eosinophil cells. The immune system plays an indispensable role during keloid formation. Therefore, recognising changes in immune cells is important for understanding the mechanisms underlying keloid formation and development. Previous studies have reported that the degree of CD3+ cell infiltration in keloid tissues is higher and the number of T cells in the keloid tissues is significantly higher than those in the peripheral blood, which is related to the size of keloids, suggesting that the occurrence of keloids is closely related to the role of T cells. 49
To the best of our knowledge, this is the first study to explore the relationship between keloids and m6A‐related genes using bioinformatic analysis. However, the study has a few limitations. First, we analysed two datasets; however, the sample size was limited. Therefore, a larger dataset is required to verify our results. Second, this study lacked clinical information; therefore, we could not analyse patients according to relevant clinical characteristics. Future studies should focus on in vivo and in vitro experiments to clarify the role of m6A‐related genes in the pathogenesis of keloids and their potential mechanisms.
5. CONCLUSIONS
We analysed the relationship between m6A‐related genes and keloids using bioinformatics tools, which revealed that some genes could be used as potential diagnostic biomarkers for keloids. Therefore, the results of this study provide a reference for the treatment of this challenging disease and for the development of new therapeutic targets.
AUTHOR CONTRIBUTIONS
Ronghua Yang, Xiaoxiang Wang, Jie Huang and Sitong Zhou conceived and designed the experiments; Xiaoxiang Wang, Wenlian Zheng and Wentao Chen performed the experiments; Ronghua Yang, Wenjun Gan, Xinchi Qin and Xiaodong Chen analysed the data; Ronghua Yang, Xiaoxiang Wang, Wenlian Zheng and Wentao Chen, Wenjun Gan and Xinchi Qin prepared the figures and/or tables; Jie Huang, Xiaodong Chen and Sitong Zhou drafted the work or revised it critically for important content.
CONFLICT OF INTEREST STATEMENT
The authors have no conflicts of interest to declare.
Supporting information
Data S1. Supporting Information
ACKNOWLEDGEMENTS
We thank the databases mentioned in our study. This study was supported by the National Natural Science Foundation of China (82002913), Guangdong Basic and Applied Basic Research Foundation (2021A1515011453, 2022A1515012160, 2021B1515120036, and 2022A1515012245), the Medical Scientific Research Foundation of Guangdong Province (A2022293) and Foshan 14th‐fifth high‐level key specialty construction project.
Yang R, Wang X, Zheng W, et al. Bioinformatics analysis and verification of m6A related genes based on the construction of keloid diagnostic model. Int Wound J. 2023;20(7):2700‐2717. doi: 10.1111/iwj.14144
Ronghua Yang and Xiaoxiang Wang contributed to the work equally.
Contributor Information
Jie Huang, Email: 3376369233@qq.com.
Xiaodong Chen, Email: cxd234@163.com.
Sitong Zhou, Email: sitongzhou@hotmail.com.
DATA AVAILABILITY STATEMENT
The datasets presented in this study can be found in online repositories. The names of the repository/repositories and accession number(s) can be found in the article/Data S1.
REFERENCES
- 1. Al‐Attar A, Mess S, Thomassen JM, Kauffman CL, Davison SP. Keloid pathogenesis and treatment. Plast Reconstr Surg. 2006;117(1):286‐300. [DOI] [PubMed] [Google Scholar]
- 2. Wang JC, Fort CL, Hom DB. Location propensity for keloids in the head and neck. Facial Plast Surg Aesthet Med. 2021;23(1):59‐64. [DOI] [PubMed] [Google Scholar]
- 3. Cavalie M, Sillard L, Montaudie H, et al. Treatment of keloids with laser‐assisted topical steroid delivery: a retrospective study of 23 cases. Dermatol Ther. 2015;28(2):74‐78. [DOI] [PubMed] [Google Scholar]
- 4. Berman B, Maderal A, Raphael B. Keloids and hypertrophic scars: pathophysiology, classification, and treatment. Dermatol Surg. 2017;43(Suppl 1):S3‐S18. [DOI] [PubMed] [Google Scholar]
- 5. Shaarawy E, Hegazy RA, Abdel Hay RM. Intralesional botulinum toxin type a equally effective and better tolerated than intralesional steroid in the treatment of keloids: a randomized controlled trial. J Cosmet Dermatol. 2015;14(2):161‐166. [DOI] [PubMed] [Google Scholar]
- 6. Wan H, Yan YD, Hu XM, et al. Inhibition of mitochondrial VDAC1 oligomerization alleviates apoptosis and necroptosis of retinal neurons following OGD/R injury. Ann Anat. 2023;247:152049. [DOI] [PubMed] [Google Scholar]
- 7. Zhang G, Guan Q, Chen G, Qian F, Liang J. DNA methylation of the CDC2L1 gene promoter region decreases the expression of the CDK11p58 protein and reduces apoptosis in keloid fibroblasts. Arch Dermatol Res. 2018;310(2):107‐115. [DOI] [PubMed] [Google Scholar]
- 8. Nyika DT, Khumalo NP, Bayat A. Genetics and epigenetics of keloids. Adv Wound Care. 2022;11(4):192‐201. [DOI] [PubMed] [Google Scholar]
- 9. Ma S, Chen C, Ji X, et al. The interplay between m6A RNA methylation and noncoding RNA in cancer. J Hematol Oncol. 2019;12(1):121. [DOI] [PMC free article] [PubMed] [Google Scholar]
- 10. Deng X, Chen K, Luo GZ, et al. Widespread occurrence of N6‐methyladenosine in bacterial mRNA. Nucleic Acids Res. 2015;43(13):6557‐6567. [DOI] [PMC free article] [PubMed] [Google Scholar]
- 11. He L, Li H, Wu A, Peng Y, Shu G, Yin G. Functions of N6‐methyladenosine and its role in cancer. Mol Cancer. 2019;18(1):176. [DOI] [PMC free article] [PubMed] [Google Scholar]
- 12. Hahn JM, Glaser K, McFarland KL, Aronow BJ, Boyce ST, Supp DM. Keloid‐derived keratinocytes exhibit an abnormal gene expression profile consistent with a distinct causal role in keloid pathology. Wound Repair Regen. 2013;21(4):530‐544. [DOI] [PubMed] [Google Scholar]
- 13. Leek JT, Johnson WE, Parker HS, Jaffe AE, Storey JDJB. The sva package for removing batch effects and other unwanted variation in high‐throughput experiments. Bioinformatics. 2012;28(6):882‐883. [DOI] [PMC free article] [PubMed] [Google Scholar]
- 14. Shi H, Wei J, He C. Where, when, and how: context‐dependent functions of RNA methylation writers, readers, and erasers. Mol Cell. 2019;74(4):640‐650. [DOI] [PMC free article] [PubMed] [Google Scholar]
- 15. Chen XY, Zhang J, Zhu JS. The role of m(6)a RNA methylation in human cancer. Mol Cancer. 2019;18(1):103. [DOI] [PMC free article] [PubMed] [Google Scholar]
- 16. Du K, Zhang L, Lee T, Sun T. M(6)a RNA methylation controls neural development and is involved in human diseases. Mol Neurobiol. 2019;56(3):1596‐1606. [DOI] [PubMed] [Google Scholar]
- 17. Xu J, Liu Y, Liu J, et al. The identification of critical m(6)a RNA methylation regulators as malignant prognosis factors in prostate adenocarcinoma. Front Genet. 2020;11:602485. [DOI] [PMC free article] [PubMed] [Google Scholar]
- 18. Yates AD, Achuthan P, Akanni W, et al. Ensembl 2020. Nucleic Acids Res. 2020;48(D1):D682‐D688. [DOI] [PMC free article] [PubMed] [Google Scholar]
- 19. Mering C v, Huynen M, Jaeggi D, et al. STRING: a database of predicted functional associations between proteins. Nucleic Acids Res. 2003;31(1):258‐261. [DOI] [PMC free article] [PubMed] [Google Scholar]
- 20. Shannon P, Markiel A, Ozier O, et al. Cytoscape: a software environment for integrated models of biomolecular interaction networks. Genome Res. 2003;13(11):2498‐2504. [DOI] [PMC free article] [PubMed] [Google Scholar]
- 21. Chin C‐H, Chen S‐H, Wu H‐H, et al. cytoHubba: identifying hub objects and sub‐networks from complex interactome. BMC Syst Biol. 2014;8(4):1‐7. [DOI] [PMC free article] [PubMed] [Google Scholar]
- 22. Chang L, Zhou G, Soufan O, Xia JJ. miRNet 20: network‐based visual analytics for miRNA functional analysis and systems biology. Nucleic Acids Res. 2020;48(W1):W244‐W251. [DOI] [PMC free article] [PubMed] [Google Scholar]
- 23. Ashburner M, Ball CA, Blake JA, et al. Gene ontology: tool for the unification of biology. The Gene Ontology Consortium. Nat Genet. 2000;25(1):25‐29. [DOI] [PMC free article] [PubMed] [Google Scholar]
- 24. Yu G, Wang LG, Han Y, He QY. clusterProfiler: an R package for comparing biological themes among gene clusters. Omics. 2012;16(5):284‐287. [DOI] [PMC free article] [PubMed] [Google Scholar]
- 25. Wu T, Hu E, Xu S, et al. clusterProfiler 4.0: a universal enrichment tool for interpreting omics data. Innovation. 2021;2(3):100141. [DOI] [PMC free article] [PubMed] [Google Scholar]
- 26. Subramanian A, Tamayo P, Mootha VK, et al. Gene set enrichment analysis: a knowledge‐based approach for interpreting genome‐wide expression profiles. Proc Natl Acad Sci USA. 2005;102(43):15545‐15550. [DOI] [PMC free article] [PubMed] [Google Scholar]
- 27. Liberzon A, Birger C, Thorvaldsdottir H, et al. The molecular signatures database (MSigDB) hallmark gene set collection. Cell Syst. 2015;1(6):417‐425. [DOI] [PMC free article] [PubMed] [Google Scholar]
- 28. Hänzelmann S, Castelo R, Guinney JJB. GSVA: gene set variation analysis for microarray and RNA‐seq data. BMC Bioinformatics. 2013;14(1):1‐15. [DOI] [PMC free article] [PubMed] [Google Scholar]
- 29. Charoentong P, Finotello F, Angelova M, et al. Pan‐cancer immunogenomic analyses reveal genotype‐immunophenotype relationships and predictors of response to checkpoint blockade. Cell Rep. 2017;18(1):248‐262. [DOI] [PubMed] [Google Scholar]
- 30. Steen CB, Liu CL, Alizadeh AA, Newman AM. Profiling cell type abundance and expression in bulk tissues with CIBERSORTx. Methods Mol Biol. 2020;2117:135‐157. [DOI] [PMC free article] [PubMed] [Google Scholar]
- 31. van der Veer WM, Bloemen MC, Ulrich MM, et al. Potential cellular and molecular causes of hypertrophic scar formation. Burns. 2009;35(1):15‐29. [DOI] [PubMed] [Google Scholar]
- 32. Xu X, Gu S, Huang X, et al. The role of macrophages in the formation of hypertrophic scars and keloids. Burns Dent Traumatol. 2020;8:tkaa006. [DOI] [PMC free article] [PubMed] [Google Scholar]
- 33. Datubo‐Brown DD. Keloids: a review of the literature. Br J Plast Surg. 1990;43(1):70‐77. [DOI] [PubMed] [Google Scholar]
- 34. Bond JS, Duncan JAL, Mason T, et al. Scar redness in humans: how long does it persist after incisional and excisional wounding? Plast Reconstr Surg. 2008;121(2):487‐496. [DOI] [PubMed] [Google Scholar]
- 35. Alster TS, West TB. Treatment of scars: a review. Ann Plast Surg. 1997;39(4):418‐432. [DOI] [PubMed] [Google Scholar]
- 36. Huang H, Weng H, Sun W, et al. Recognition of RNA N(6)‐methyladenosine by IGF2BP proteins enhances mRNA stability and translation. Nat Cell Biol. 2018;20(3):285‐295. [DOI] [PMC free article] [PubMed] [Google Scholar]
- 37. Chao JA, Patskovsky Y, Patel V, Levy M, Almo SC, Singer RH. ZBP1 Recognition of beta‐Actin zipcode induces RNA looping. Genes Dev. 2010;24(2):148‐158. [DOI] [PMC free article] [PubMed] [Google Scholar]
- 38. Szarvas T, vom Dorp F, Niedworok C, et al. High insulin‐like growth factor mRNA‐binding protein 3 (IMP3) protein expression is associated with poor survival in muscle‐invasive bladder cancer. BJU Int. 2012;110(6 Pt B):E308‐E317. [DOI] [PubMed] [Google Scholar]
- 39. Su R, Dong L, Li Y, et al. METTL16 exerts an m(6)A‐independent function to facilitate translation and tumorigenesis. Nat Cell Biol. 2022;24(2):205‐216. [DOI] [PMC free article] [PubMed] [Google Scholar]
- 40. Anita R, Paramasivam A, Priyadharsini JV, Chitra S. The m6A readers YTHDF1 and YTHDF3 aberrations associated with metastasis and predict poor prognosis in breast cancer patients. Am J Cancer Res. 2020;10(8):2546‐2554. [PMC free article] [PubMed] [Google Scholar]
- 41. Shi H, Wang X, Lu Z, et al. YTHDF3 facilitates translation and decay of N(6)‐methyladenosine‐modified RNA. Cell Res. 2017;27(3):315‐328. [DOI] [PMC free article] [PubMed] [Google Scholar]
- 42. Tanabe A, Tanikawa K, Tsunetomi M, et al. RNA helicase YTHDC2 promotes cancer metastasis via the enhancement of the efficiency by which HIF‐1alpha mRNA is translated. Cancer Lett. 2016;376(1):34‐42. [DOI] [PubMed] [Google Scholar]
- 43. He JJ, Li Z, Rong ZX, et al. M(6)a reader YTHDC2 promotes radiotherapy resistance of nasopharyngeal carcinoma via activating IGF1R/AKT/S6 signaling Axis. Front Oncol. 2020;10:1166. [DOI] [PMC free article] [PubMed] [Google Scholar]
- 44. Ping XL, Sun BF, Wang L, et al. Mammalian WTAP is a regulatory subunit of the RNA N6‐methyladenosine methyltransferase. Cell Res. 2014;24(2):177‐189. [DOI] [PMC free article] [PubMed] [Google Scholar]
- 45. Ma H, Wang X, Cai J, et al. N(6‐)Methyladenosine methyltransferase ZCCHC4 mediates ribosomal RNA methylation. Nat Chem Biol. 2019;15(1):88‐94. [DOI] [PMC free article] [PubMed] [Google Scholar]
- 46. Yan WT, Yang YD, Hu XM, et al. Do pyroptosis, apoptosis, and necroptosis (PANoptosis) exist in cerebral ischemia? Evidence from cell and rodent studies. Neural Regen Res. 2022;17(8):1761‐1768. [DOI] [PMC free article] [PubMed] [Google Scholar]
- 47. Wu B, Su S, Patil DP, et al. Molecular basis for the specific and multivariant recognitions of RNA substrates by human hnRNP A2/B1. Nat Commun. 2018;9(1):420. [DOI] [PMC free article] [PubMed] [Google Scholar]
- 48. Xu Z, Peng B, Cai Y, et al. N6‐methyladenosine RNA modification in cancer therapeutic resistance: current status and perspectives. Biochem Pharmacol. 2020;182:114258. [DOI] [PubMed] [Google Scholar]
- 49. Wang X, Chen H, Tian R, et al. Macrophages induce AKT/beta‐catenin‐dependent Lgr5(+) stem cell activation and hair follicle regeneration through TNF. Nat Commun. 2017;8:14091. [DOI] [PMC free article] [PubMed] [Google Scholar]
Associated Data
This section collects any data citations, data availability statements, or supplementary materials included in this article.
Supplementary Materials
Data S1. Supporting Information
Data Availability Statement
The datasets presented in this study can be found in online repositories. The names of the repository/repositories and accession number(s) can be found in the article/Data S1.


