

Abstract
Eight rhenium(I) tricarbonyl aqua complexes with the general formula fac-[Re(CO)3(N,N′-bid)(H2O)][NO3] (1–8), where N,N′-bid is (2,6-dimethoxypyridyl)imidazo[4,5-f]1,10-phenanthroline (L1), (indole)imidazo[4,5-f]1,10-phenanthroline (L2), (5-methoxyindole)-imidazo[4,5-f]1,10-phenanthroline (L3), (biphenyl)imidazo[4,5-f]1,10-phenanthroline (L4), (fluorene)imidazo[4,5-f]1,10-phenanthroline (L5), (benzo[b]thiophene)imidazo[4,5-f]1,10-phenanthroline (L6), (5-bromothiazole)imidazo[4,5-f]1,10-phenanthroline (L7), and (4,5-dimethylthiophene)imidazo[4,5-f]1,10-phenanthroline (L8), were synthesized and characterized using 1H and 13C{1H} NMR, FT-IR, UV/Vis absorption spectroscopy, and ESI-mass spectrometry, and their purity was confirmed by elemental analysis. The stability of the complexes in aqueous buffer solution (pH 7.4) was confirmed by UV/Vis spectroscopy. The cytotoxicity of the complexes (1–8) was then evaluated on prostate cancer cells (PC3), showing a low nanomolar to low micromolar in vitro cytotoxicity. Worthy of note, three of the Re(I) tricarbonyl complexes showed very low (IC50 = 30–50 nM) cytotoxic activity against PC3 cells and up to 26-fold selectivity over normal human retinal pigment epithelial-1 (RPE-1) cells. The cytotoxicity of both complexes 3 and 6 was lowered under hypoxic conditions in PC3 cells. However, the compounds were still 10 times more active than cisplatin in these conditions. Additional biological experiments were then performed on the most selective complexes (complexes 3 and 6). Cell fractioning experiments followed by ICP-MS studies revealed that 3 and 6 accumulate mostly in the mitochondria and nucleus, respectively. Despite the respective mitochondrial and nuclear localization of 3 and 6, 3 did not trigger the apoptosis pathways for cell killing, whereas 6 can trigger apoptosis but not as a major pathway. Complex 3 induced a paraptosis pathway for cell killing while 6 did not induce any of our other tested pathways, namely, necrosis, paraptosis, and autophagy. Both complexes 3 and 6 were found to be involved in mitochondrial dysfunction and downregulated the ATP production of PC3 cells. To the best of our knowledge, this report presents some of the most cytotoxic Re(I) carbonyl complexes with exceptionally low nanomolar cytotoxic activity toward prostate cancer cells, demonstrating further the future viability of utilizing rhenium in the fight against cancer.
Short abstract
This report presents Re(I) carbonyl complexes with exceptionally low nanomolar cytotoxic activity toward prostate cancer cells, demonstrating further the future viability of utilizing rhenium in the fight against cancer.
Introduction
Rhenium(I) tricarbonyl complexes are attractive due to a number of potential applications. These include but are not limited to photophysics,1,2 artificial photosynthetic materials,3−5 supramolecular systems,6−8 electrocatalysis,9,10 photoinduced catalysis,9,10 and nuclear medicine.11,12 For decades, organometallic compounds have proven to be auspicious anticancer drug candidates,13−17 and as such, complexes may afford diverse mechanisms of action. Rhenium organometallic compounds display several innate properties, such as large Stokes shifts, long-lived emission states, emission tunability through ligand variation, and high quantum yields. These characteristics allow simplified elucidation of the mechanism of action and the cellular distribution of the compounds through emission spectroscopy. Due to their ability to chelate with metal ions such as N,N′-donor bidentate ligands, imidazole-phenanthroline derivatives play a pivotal role in biochemistry, analytical chemistry, and electrochemistry.18−23 Several synthetic polycyclic compounds of the type [M(L,L′)2]n+, where M is a transition metal ion and L,L′ is an imidazo-phenanthroline-type ligand, have been reported to successfully interact with DNA.24,25
An essential requirement of cancer treatments is the ability to induce cancer cell death while preserving the life of healthy non-cancerous cells. In recent studies, the use of rhenium(I) tricarbonyl complexes as possible anticancer agents has shown promising results.26−31 Wang et al. reported rhenium(I) tricarbonyl complexes with the ability to exert irreversible oxidative stress as well as glutathione metabolism disorder by means of accumulating in the mitochondria.32 A rhenium isonitrile complex reported by Wilson et al. induces apoptosis by means of an unfolded protein response and additionally shows in vitro and in vivo anticancer activity toward ovarian cancer cells.33,34 Furthermore, they reported the scaffold protein NUBP2 that are involved in Fe–S cluster biogenesis, as a relevant target for a Re(I) complex (TRIP).35 Simpson et al. designed rhenium(I) complexes that have the ability to induce cell death by means of the inhibition of the phosphorylation of Aurora-A kinase.36 Delasoie et al. reported a Re(I) tricarbonyl complex that exhibited selectivity toward HCT-116 cells,37 while Ye et al. reported a rhenium(I)-based histone deacetylase inhibitor with the ability to target mitochondria as well as suppress histone deacetylases activity.38
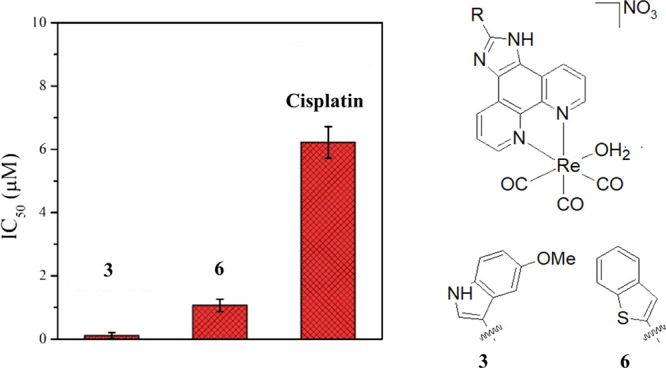
The development of anticancer agents that exhibit numerous mechanisms of action is of great importance since such compounds may have the ability to overcome typical obstacles such as ineffectiveness toward tumors and drug resistance.39,40 A promising strategy in drug development to increase the potential of anticancer drugs in exhibiting multiple mechanisms of action is the coordination of organic molecules with anticancer potential to various metals. With this in mind and the recent success of imidazo[4,5-f]1,10-phenanthroline derivatives as prospective anticancer agents in colorectal and liver cancer,41−43 we designed a small library of rhenium(I) tricarbonyl complexes (Figure 1) with N,N′-bidentate imidazo[4,5-f]1,10-phenanthroline derivative ligand systems, with systematic changes with N,S and aromatic motifs on the backbone, having an appended aqua ligand to evaluate their potentials as anticancer agents. Rhenium(I) tricarbonyl complexes are usually kinetically inert, which will help increase the complex half-life to reach the target. The aqua ligand will further increase the possibility of target binding.44 The deprotonation of the metal bonded labile aqua ligand and DNA binding ability of the complexes were investigated. Furthermore, we carried out in vitro cytotoxicity studies against prostate cancer and normal cells to obtain a small structure–activity relationship (SAR). The cellular localization, cellular uptake pathways, and possible cell killing pathways of the complexes were also studied.
Figure 1.

Chemical structures of rhenium(I) tricarbonyl complexes 1–8.
Results and Discussion
Synthesis and Characterization
The procedure reported by Alberto et al. was utilized for the synthesis of the rhenium(I) carbonyl complex-starting synthon fac-[NEt4]2[Re(CO)3(Br)3] (ReAA).45 The characteristic CO stretching frequencies of ReAA were observed at 1864 and 1998 cm–1, respectively. The three Br– ligands were replaced by labile aqua ligation via the addition of AgNO3 at pH 2, resulting in the intermediate fac-[Re(CO)3(H2O)3][NO3] compound. Water is a good leaving group and can thus be effortlessly replaced by other ligands. Complexes 1–8 were obtained by the addition of the respective N,N′ bidentate ligands, viz., (2,6-dimethoxypyridyl)imidazo[4,5-f]1,10-phenanthroline (L1), (indole)imidazo-[4,5-f]1,10-phenanthroline (L2), (5-methoxyindole)imidazo[4,5-f]1,10-phenanthroline (L3) (biphenyl)imidazo[4,5-f]1,10-phenanthroline (L4), (fluorene)imidazo[4,5-f]1,10-phenanthroline (L5), (benzo[b]thiophene)imidazo[4,5-f]1,10-phenanthroline (L6), (5-bromothiazole)imidazo[4,5-f]1,10-phenanthroline (L7), and (4,5-dimethylthiophene)imidazo-[4,5-f]1,10-phenanthroline (L8), respectively, to the acidic fac-[Re(CO)3(H2O)3][NO3] solution, producing the fac-[Re(CO)3(N,N′-bid)(H2O)][NO3]-type compounds. The general synthetic procedure for 1–8 is illustrated in Scheme 1. All compounds were characterized using 1H and 13C{1H} NMR, FT-IR, UV/Vis absorption spectroscopy, and ESI-mass spectrometry, and their purity was confirmed by elemental analysis.
Scheme 1. General Synthetic Procedure for Compounds 1–8.

X-ray Crystallography
fac-[Re(CO)3(L3)(Br)] (3a) was grown from a solution of fac-[Re(CO)3(L3)(H2O)][NO3] and NEt4Br in DMSO. The aqua complex did not yield any suitable crystals; however, upon substitution of the axial aqua ligand with a bromido ligand, crystals suitable for single crystal crystallography were obtained. The crystallographic data for 3a is summarized in Table S1, and the molecular diagram of the crystal structure is given in Figure 2. fac-[Re(CO)3(L3)(Br)] (3a) crystallized in the triclinic P1̅ space group, with one molecule and one solvent dimethyl sulfoxide molecule in the asymmetric unit. The bond distances and angles of 3a are in the range of similar structures and are reported in Table 1.46−53
Figure 2.

Molecular representation of the crystal structure of fac-[ReI(CO)3(L3)(Br)]·DMSO (3a). Hydrogen atoms (except two N–H) are omitted for clarity, and ellipsoids are drawn at the 50% probability level.
Table 1. Selected Bond Distances and Angles (Å, °) of 3a.
| selected bond distances (Å) | selected bond angles (°) | ||
|---|---|---|---|
| Re1-C3 | 1.918(6) | N1-Re1-N2 | 75.32(16) |
| Re1-C1 | 1.905(6) | C3-Re1-C2 | 87.7(2) |
| Re1-C2 | 1.919(6) | C1-Re1-N1 | 96.03(18) |
| Re1-N2 | 2.173(4) | C2-Re1-Br1 | 91.79(18) |
| Re1-N1 | 2.182(4) | C1-Re1-Br1 | 178.37(17) |
| Re1-Br1 | 2.629(10) | C3-Re1-Br1 | 89.90(16) |
| N1-Re1-Br1 | 84.32(11) | ||
| N2-Re1-Br1 | 83.98(12) | ||
A dihedral angle of 14.2(2)°, between the equatorial plane (O2–C2–Re1–C3–O3) and the plane through the imidazo[4,5-f]1,10-phenanthroline ligand (N1, N2, C1–C12), is observed and expresses the significant bend of the (methoxyindole)imidazo[4,5-f]1,10-phenanthroline ligand out of the equatorial plane toward the bromido ligand (Figure S1).
The solid-state structure of 3a is stabilized by one intramolecular weak interaction (C21–H21···N4), two intermolecular hydrogen bonding interactions (N3–H3A···O5, N5–H5A···Br1), three weak interactions (C11–H11···Br1, C24–H24···O4, and C25–H25C···O5), two Y–X···Cg π-interactions (Re1–Br1···Cg1 and S1–O5···Cg2) with X···Cg distances of 2.947(2) Å and 3.728(5) Å respectively, and an extensive network (forty nine) of π–π-interactions with Cg···Cg distances smaller than 3.8 Å (Tables S2 and S3 and Figure S2). An infinite one-dimensional O–H···O–H chain along the c axis is observed that is formed by the two hydrogen bonding interactions (N3–H3A···O5 and N5–H5A···Br1) (Figure S3). The intra- and intermolecular interactions in the crystal structure of 3a were quantified and confirmed using Hirshfeld surface analysis (Figures S4 and S5). From the fingerprint plots of 3a, it is clear that the H···H and O···H/H···O interactions contribute significantly to the packing and overall stabilization of the crystal structure (Figure S6).
Stability Studies of the Complexes
The stability of the complexes in phosphate buffer (pH 7.4) and FBS solution was monitored by UV/Vis absorption measurements over 6 h. No isosbestic point was observed during the measurement of UV/Vis spectra of 1–8 in the buffer solution; however, a time-dependent decrease in absorbance was noticed (Figures S7–S10). This was due to the poor water solubility, which leads to precipitation of the complexes in aqueous solution. It is very important to note that the solubility of the complexes increases significantly in the presence of FBS, as recently observed with Ru(II) polypyridyl complexes (Figure S11).54 The stability of complexes 1–8 was also tested in DMSO solution (Figures S7–S10). Multiple isosbestic points were observed in the DMSO solution for complexes 6–8, suggesting a binding with DMSO, which was not observed for complexes 1–5. The binding of complexes 6 and 8 with DMSO was also confirmed by ESI-MS measurements (Figure S12). In fact, observing the ESI-MS spectra for both complexes 6 and 8, we noticed a DMSO–complex adduct ([ReI(L6/L8)(CO)3(DMSO)]+) as well as a methanolic adduct ([ReI(L6/L8)(CO)3(CH3OH)]+). Moreover, a significant amount of the parent complex without the water ([ReI(L6/L8)(CO)3]+) was detected (Figure S12). We suggest that the formation of the methanolic adduct is due to the presence of a high amount of methanol in the ESI-MS sample solution, replacing either the water molecule or the DMSO. Unfortunately, due to the poor solubility of complex 7 in methanol, we could not analyze the DMSO binding using ESI-MS.
The stability of the complexes in DMSO was further confirmed by 1H NMR; complexes 3 and 6 were dissolved in DMSO for 24 h after which it was dried. The 1H NMR spectrum of 3 was the same before and after 24 h in DMSO (Figure S13), confirming the results of the UV/Vis experiments. On the other hand, only 50% of 6 was still intact after it was dissolved in DMSO for 24 h while 50% was the DMSO adduct. We confirmed that ∼70% of the aqua complex 6 is still intact after it was dissolved in DMSO for 6 h (Figure S14).
Influence of H+ Ions – Acid Dissociation Constant Determination
Preliminary cytotoxicity studies indicated that 3 and 6 showed the best cytotoxicity and selectivity. For this reason, it was decided to proceed with 3 and 6 with a more detailed investigation, which also included intracellular accumulation, cellular uptake, mitochondrial respiration, cell death pathways, and ROS generation.
The pH dependence of 3 and 6 was studied at 25.0 °C from pH 5.5 to 11 in DMF:H2O 7:3 (v/v %) solution. The stability of 3 and 6 in DMF:H2O 7:3 (v/v %) at pH 5.5 for 24 h was confirmed; the UV/Vis spectra is provided in the Supporting Information (Figures S15 and S16). Equation 1 describes the general acid/base behavior of the monoprotic species HA, while eq 2 was utilized for the determination of the acid dissociation constants of 3 and 6, where A is the absorbance at the specific pH, Ah is the absorbance of the protonated species, A0 is the absorbance of the deprotonated species, and Ka1 is the acid dissociation constant.
| 1 |
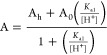 |
2 |
The acid dissociation constants of 3 and 6 were determined spectrophotometrically by adjusting the pH of a 2 × 10⁻⁵ M solution of 3 and 6 at wavelengths 433 and 283 nm, respectively, while measuring the absorbance each time (Figures S17 and S18). The nonlinear fit of this data to eq 2 allowed for determining the pKa1 values of 3 and 6 as 8.95 (±4) and 9.14 (±2), respectively. This is illustrated in Figure 3. These values correspond with those of similar mononuclear deprotonation products and shows that the complexes are all in the aqua form under physiological conditions.55−57 Egli et al.55 determined the pKa values of fac-[Re(CO)3(H2O)3]+, yielding the deprotonation products fac-[Re(CO)3(H2O)2(OH)] and fac-[Re(CO)3(H2O)(OH)2]− to be pKa1 = 7.5 ± 0.2 and pKa2 = 9.3 ± 0.3, respectively, while Schutte et al.56 calculated the pKa of fac-[Re(CO)3(Trop)(H2O)] (where Trop = tropolonato) to be 8.96 ± 0.02. The pKa values of four rhenium dicarbonyl complexes ([Re(CO)2(N,N)(P)(H2O)]+ with N,N = 1,10′-phenanthroline and 2,9-dimethyl 1,10-phenanthroline, P = PTA and DAPTA) were determined and were in the range 9.09 ± 0.03 to 9.28 ± 0.03. Therefore, no considerable difference is observed in the pKa values in these rhenium(I) complexes, whether the ligand trans to the aqua ligand is a carbonyl or phosphine ligand or whether the bidentate ligand has N,N or O,O atom donors.
Figure 3.

(a) Plot of absorbance vs pH for 3. [Re] = 2 × 10⁻⁵ M, 25 °C, 367 nm, μ = 1 M (NaClO4). (b) Plot of absorbance vs pH for 6. [Re] = 2 × 10⁻⁵ M, 25 °C, 332 nm, μ = 1 M (NaClO4).
DNA Binding Study
A preliminary UV/Vis DNA-complex titration study indicated that 6 has the highest binding constant in the series, and later on, we found out that 6 is the most cytotoxic complex in hand. Hence, to check the possible ways of DNA binding by 6, we have performed (a) a binding study with a model nucleobase (guanosine) by 1HNMR and ESI-MS for a possibility of covalent binding, (b) an ethidium bromide displacement assay for intercalation, and (c) a DNA melting assay to confirm the binding ability.
Surprisingly, in the1H NMR spectra of guanosine binding kinetics, we only observed a secondary interaction of 6 with guanosine, despite 6 having a labile neutral water molecule in the Re center (Figures S19–S22). The binding study between the Re center of complex 6 and N7 of guanosine was monitored by 1H NMR in DMF at 37 °C (Figures S19–S22). From the initial time (1 h), we observed a 0.015 ppm downfield shift of the H8 peak along with the shift of Hb and Hc. Considering Ha, we did not find any shift during the course of the study. This would suggest that the shift of the mentioned protons (Hb, Hc, and H8) is due to some secondary interaction but not to the binding with N7 of guanosine with the Re center. Moreover, the amine of guanosine is not taking part in the secondary noncovalent interaction (Figure S20). When we analyzed the same solution by ESI-MS, we found a little peak of 6 and a guanosine adduct along with an important amount of free ligand (Figure S23). However, we could not find any alteration of 1H NMR peaks of 6 with time (Figure S19) and the peaks were not shifted in the 1H NMR spectra studying the stability of 6 (Figure S23). Hence, the formation of the adduct and the degradation of 6 have occurred only in the ESI-MS measurement conditions. Therefore, we deduced that the complex cannot form any covalent bond with DNA via the Re center.
The presence of a planar ring system increases the possibility of DNA intercalation. Hence, to measure the intercalation ability of 6, we performed an ethidium bromide (EB) displacement assay by fluorescence quenching of the EB-DNA adduct (Figure S24). The apparent binding constant for intercalation of 6 with ctDNA is in the order of 3.9 (1) × 106 M–1, suggesting the possible targeting of DNA via intercalation. Finally, the DNA binding properties of complex 6 was confirmed by measuring DNA melting temperature (Figure 4). We observed a shift of ctDNA melting temperature toward higher temperature of 6-bound ctDNA (ΔTm; 1 ± 0.4 °C and 4 ± 0.1 °C for 6 and EB, respectively, (Figure 4)) in comparison to unbound/normal ctDNA melting temperature.
Figure 4.
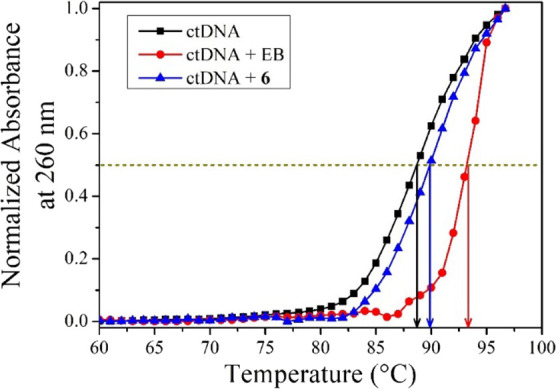
ctDNA melting curve. Conc. of ctDNA was 40 μM, conc. of EB and 6 was 30 μM. Temperature: 60–97 °C; holding time: 1 min, 1 °C/min and the abs was recorded with every 1 °C change in temperature.
Distribution Coefficient (log P Values)
The distribution coefficient (log P value) of the complexes was determined using the standard shake flask method.58 All the complexes showed almost equal distribution coefficients within 1.5–2.0 (Figure 5), suggesting hydrophobicity. This suggests that the derivatization on the N–N bidentate ligand of Re complexes might not be very useful to change the solubility and lipophilicity of the compounds. Overall, the log P values of our complexes compared well with other Re tricarbonyl compounds reported in the literature.30,59
Figure 5.

Bar plot representing the log P values of complexes 1–8.
BSA Binding
Serum albumin is the most abundant protein present in the blood and plays an important role in the delivery of hydrophobic compounds to the cell. Importantly, serum albumin contains a free thiol from 34-cysteine60−63 and Re complexes have very high binding affinity for sulfur donors.64,65 BSA has an intrinsic fluorescence emission maximum at 341 nm upon excitation at 280 nm.66,67 The internal fluorescence quenching was observed upon binding with our compound. Hence, fluorescence titrations between BSA and different concentrations of the complex were performed to measure the binding constant. The bovine serum albumin (BSA) binding study suggests that all complexes can bind BSA with a moderately high binding constant in the order of 105 M–1 except for complex 7 (Table 2, Figures S25–S28). A significantly low binding constant was observed for 7 (0.4 × 10⁵ M–1). The Stern–Volmer quenching constant signifies the distance between an inhibitor and the fluorescent molecules.68−70 The decrease of Ksv indicates a long distance between the inhibitor and fluorescence protein. We observed the Ksv in the order of 104 M–1, suggesting a moderate fitting in the hydrophobic pocket of BSA.
Table 2. Affinity of Complexes 1–8 for BSAa.
| complex | Stern–Volmer quenching constant (Ksv × 104, M–1) | binding constant (Ka × 105, M–1) | number of binding sites (n) |
|---|---|---|---|
| 1 | 2.41 ± 0.05 | 2.71 ± 2.91 | 1.23 ± 0.13 |
| 2 | 1.06 ± 0.03 | 1.10 ± 0.79 | 1.24 ± 0.08 |
| 3 | 2.98 ± 0.15 | 1.81 ± 1.16 | 1.18 ± 0.07 |
| 4 | 2.95 ± 0.09 | 1.46 ± 0.06 | 1.18 ± 0.01 |
| 5 | 2.57 ± 0.07 | 1.04 ± 0.30 | 1.15 ± 0.03 |
| 6 | 2.82 ± 0.07 | 2.29 ± 0.98 | 1.23 ± 0.05 |
| 7 | 0.83 ± 0.03 | 0.40 ± 1.16 | 1.16 ± 0.03 |
| 8 | 1.60 ± 0.10 | 0.94 ± 1.11 | 1.10 ± 0.20 |
All plots are available in Figures S25–S28.
Cytotoxicity
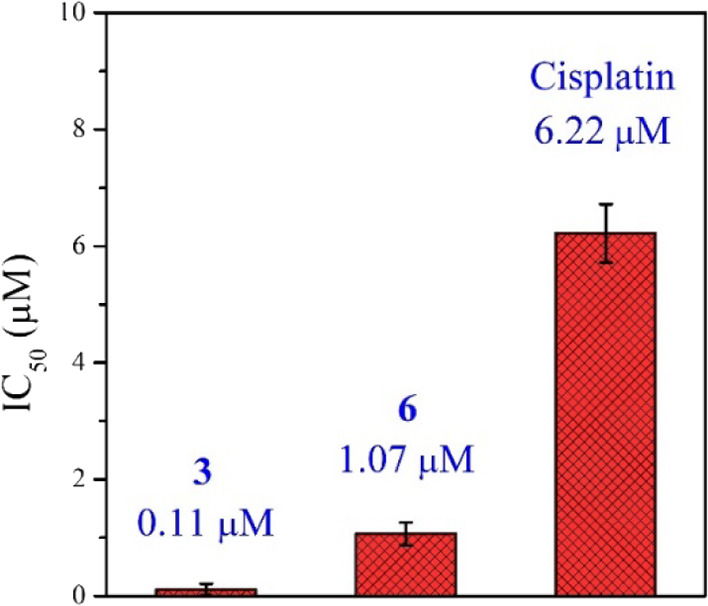
The in vitro anticancer activity of the complexes was determined against human prostate cancer (PC3) and compared with the normal retinal pigment epithelial-1 (RPE-1) cells. The results are summarized in Table 3. Among the eight complexes, 4–6 showed cytotoxicity in the low nanomolar range (0.04, 0.03, and 0.05 μM, respectively). Such low values are scarce in the literature for similar compounds. However, the three complexes are highly cytotoxic against normal RPE-1 cells as well (0.12, 0.27, and 0.65 μM, respectively). Despite this, it is very exciting to notice that almost all complexes are more toxic against cancer cells than normal cells. Complex 3 is the most promising by showing a 26-fold selectivity with an IC50 value of 0.32 μM against PC3 cells. Additionally, it is almost 21 times more cytotoxic than cisplatin against PC3 cells. Interestingly, it was observed by ICP-MS that the most selective complexes 3 and 6 were localizing in the mitochondria and nuclei, respectively, suggesting that they have a different mode of action. In general, we observed that a fused ring or similar derivatization in the N–N bidentate ligand could be useful to increase cytotoxicity. Very interestingly, comparing complexes 2 and 3, the introduction of a methoxy moiety in the indole ring of 2 showed a positive impact on the IC50 values with an increase of almost 15-fold in cytotoxicity.
Table 3. Cytotoxicity of Complexes 1–8 under the Normoxic Conditions in Comparison to Cisplatin.
| IC50 (μM) ± S.D.a |
|||
|---|---|---|---|
| complex | PC3 | RPE-1 | selectivityb |
| 1 | 4.6 ± 0.5 | 0.36 ± 0.02 | |
| 2 | 5 ± 3 | 23 ± 2 | 5 |
| 3 | 0.32 ± 0.03 | 8.2 ± 0.4 | 26 |
| 4 | 0.04 ± 0.01 | 0.12 ± 0.01 | 3 |
| 5 | 0.03 ± 0.01 | 0.27 ± 0.02 | 9 |
| 6 | 0.05 ± 0.01 | 0.65 ± 0.03 | 13 |
| 7 | 1.4 ± 0.40 | 4.2 ± 0.5 | 3 |
| 8 | 0.41 ± 0.04 | 1.79 ± 0.04 | 4 |
| cisplatin | 6.9 ± 0.5 | 36 ± 4 | 5 |
S.D. is the standard deviation. The IC50 value was determined using the standard Resazurin assay after 48 h of treatment under normoxic conditions (∼15% O2 level). The representative plots are provided in Figures S29–S33.
Selectivity represents the ratio between IC50 against RPE-1 and IC50 against PC3 cells.
Despite the high cytotoxic activity of complexes against PC3 cells in normoxia, a decrease in cytotoxicity (IC50, μM: 5.5 ± 1.3 for 3 and 7.0 ± 2.2 for 6) was observed for complexes 3 and 6 when they were evaluated in hypoxic conditions (Table S4). However, a decrease in cytotoxicity of cisplatin (IC50, >50 μM) in hypoxic conditions was also observed. Hence, in hypoxic conditions, despite the decreased cytotoxicity of 3 and 6 against PC3 cells, they were still around 10 times more active than cisplatin. Very importantly, when the compounds were tested against 3D multicellular PC3 cell spheroids, we observed a small decrease in IC50 concentration (Figure 6), indicating that the compounds are efficient in penetrating the more tumor-like environment of cell spheroids.
Figure 6.
IC50 values represent the cytotoxicity of complexes against 3D multicellular PC3 cells spheroid (average diameter of 435 μm) after 72 h of incubation with the respective complexes in normoxic conditions, determined using the AlamarBlue assay.
Intracellular Accumulation Study
Most of the rhenium(I) carbonyl complexes reported so far preferentially target mitochondria.14,32,59,71 In order to investigate the possible cellular target of the complexes, we measured the accumulation of complexes 3 and 6 in the nuclei and mitochondria using cell fractionation and ICP-MS and not using the intrinsic luminescent properties of the Re(I) tricarbonyl complex. In fact, it was reported that different cellular accumulation results were observed between these methods since the luminescence properties of this type of metal complex are environment-dependent and can alter the confocal results.72−74 We found that 3 targets the mitochondria, whereas 6 mostly targets the nuclei and, to a lesser extent, the mitochondria (Figure 7). This observation is interesting since there are very few examples of Re(I) tricarbonyl complexes that target the nuclei.
Figure 7.
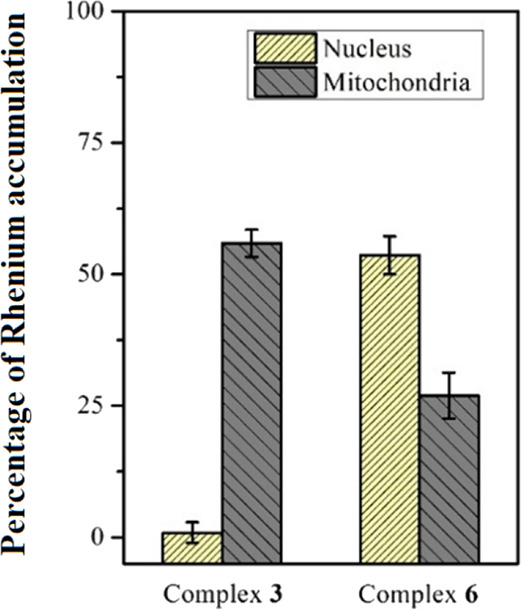
Percentage of Re(I) accumulation in the nucleus and mitochondria compared to total uptake by PC3 cells. The amount of rhenium in the isolated nucleus and mitochondria from complex-treated PC3 cells was quantified using ICP-MS.
Cellular Uptake and Uptake Pathways
The cellular uptake pathways of complexes 3 and 6 have been investigated using known uptake pathways inhibitors, viz., 1 mM tetraethylammonium chloride (cationic transporter inhibitor),75 5 μM oligomycin and 50 mM 2-deoxy-d-glucose (metabolic inhibitors),76,77 and 50 mM ammonium chloride (endocytotic inhibitor).78−80 The cells were pre-treated with the respective inhibitors to block the transporter channel. Hence, the uptake of complexes might get affected if the complex utilizes those transporters. For both complexes 3 and 6, a significantly less amount of complex uptake was observed in the presence of an endocytotic inhibitor (i.e., ammonium chloride)78−80 and at 4 °C in comparison to the control (Figure 8B,C). Hence, the result suggests that endocytotic and passive diffusions were majorly involved in complex uptake. Surprisingly, a significantly high uptake of complex 6 was observed compared to 3, which could explain the low nanomolar cytotoxicity of 6 (Figure 8A).
Figure 8.

(A–C) Amount (ng) of rhenium in PC3 cells upon 2 h of incubation with either complex 3 or 6 in the presence and absence of cellular uptake pathways inhibitor. The amount of Re was quantified by ICP-MS. 1 mM tetraethylammonium chloride (cationic transporter inhibitor), 5 μM oligomycin and 50 mM 2-deoxy-d-glucose (metabolic inhibitors), and 50 mM ammonium chloride (endocytotic inhibitor) were used.
Mitochondrial Respiration Test
Since a significant amount of the complexes 3 and 6 accumulated in the mitochondria, the possible influence of the compounds in the PC3 cells’ oxygen consumption was measured by the Mito stress test using a Seahorse XF Analyzer. In both cases, a significant amount of concentration-dependent mitochondrial dysfunction was identified. Initially, a concentration-dependent lowering of basal respiration was observed for both complexes 3 and 6 (Figure 9 and Figure S34). Furthermore, a significant drop in ATP production was identified (Figure S35).
Figure 9.

Mito stress test profile in PC3 cells measured by a Seahorse XeF4 after 24 h treatment with complexes 3 and 6 and cisplatin in normoxic conditions. OCR stands for oxygen consumption rate. The experiment was performed using specific electron transport chain inhibitors, viz., oligomycin (inhibitor of ATP synthase (complex V)), FCCP (uncoupling agent), antimycin-A (complex III inhibitors), and rotenone (complex I inhibitor).
Cell Death Pathways and ROS Generation
The cell death pathways induced by 3 and 6 in PC3 cells were analyzed by measuring cytotoxicity in the presence of specific cell death pathway inhibitors, viz., 3-methyladenine (autophagy), Z-VAD-FMK (apoptosis), cycloheximide (paraptosis), and necrostatin-1 (necrosis). A significant amount of increase in the IC50 value (around 2 times) of complex 3 against paraptosis inhibitor-treated PC3 cells was observed (Figure 10). Finally, the paraptosis induction in PC3 cells by complex 3 was confirmed by observing vacuole formations in the bright field image of PC3 cells treated with compound 3 (SI, Figure S36). Of note, similar kinds of Re complexes are known to induce cell death by paraptosis.38,59 In the case of complex 6, a very little decrease in IC50 dose was noticed when the cells were pre-treated with an apoptosis inhibitor (Figure 10). Hence, we performed the well-known annexin-V assay to confirm the apoptosis pathway. As we found a non-apoptosis pathway for cell killing during IC50 dose determination of 3 in the presence of an apoptosis inhibitor (Figure 10), complex 3 did not induce apoptosis, whereas for complex 6, a concentration-dependent induction of apoptosis was observed (Figure 11). However, the amount of apoptosis induction by 6 was very low (Figure 11), suggesting that apoptosis may not be a major pathway for cell killing. In the case of cisplatin, we observed an important increase of the IC50 value in the presence of both apoptosis and autophagy inhibitors (Figure 10). The observed apoptosis and autophagy induction by cisplatin agrees with literature reports.81
Figure 10.

IC50 values of respective complexes against PC3 cells in the presence of inhibitors in comparison to the cytotoxicity without any inhibitor. The inhibitors were pre-incubated for 1 h. The respective metal complexes were then loaded and incubated for 36 h in normoxic conditions (details in the Experimental section).
Figure 11.

Induction of apoptosis of compound-treated PC3 cells were measured by flow cytometry after 24 h compound exposure. The compound-treated cells were stained dually with Annexin V-PE and PI prior to analysis. Lower left quadrant (both Annexine V and PI-negative fraction): intact cells. Lower right quadrant (Annexine V-positive/PI-negative fraction): early apoptosis. Upper right quadrant (Annexine V-positive/PI-positive fraction): late apoptosis. Upper left quadrant (Annexine V-negative/PI-positive fraction): necrosis. Staurosporine, an apoptosis inducer, was used as positive control.
Metal complexes are very well-known to generate ROS due to the presence of easily accessible multiple oxidation states. The generation of ROS inside the PC3 cells treated with the two Re derivatives was analyzed using a standard ROS detection kit. The result suggested that the compounds do not play a role in altering the ROS homeostasis of the cells. In fact, after treatment with complexes 3 and 6, the ROS level (Figure S37) inside the cells was similar to the control.
Conclusions
This study reports the synthesis, characterization, DNA binding mode, and in vitro cytotoxicity of eight rhenium(I) tricarbonyl complexes. All complexes showed stability in aqueous solution and can bind to BSA with binding constants ranging from 104 to 105 M–1. The pKa values of 3 and 6 indicate that these complexes will be in the aqua form under biological conditions. The Re(I) carbonyl complexes showed exceptionally low nanomolar cytotoxicity against prostate adenocarcinoma (PC3) and a degree of selectivity toward cancer cells over normal human retinal pigment epithelial-1 (RPE-1) cells. The most selective complexes 3 and 6 were found to localize in mitochondria and nuclei, respectively. Moreover, both complexes 3 and 6 downregulated the mitochondrial ATP production in PC3 cells. The most selective complex 3 followed a paraptosis pathway for cell killing. On the other hand, despite the intercalation of complex 6 with DNA and the induction of mitochondrial dysfunction after treatment, only a very little percentage of cells induced apoptosis. This suggests that apoptosis is a minor pathway for cell killing. Surprisingly, 6 did not follow any of the other tested cell death pathways, i.e., necrosis, autophagy, or paraptosis. Very interestingly, this suggests that the presence of different functional groups on the same phenanthroline ligand core could induce different cell death mechanisms, while maintaining a very promising IC50 range.
Experimental Section
General Procedures and Instrumentation
The IR spectra were recorded at room temperature on a PerkinElmer BX II IR spectrometer in the range 4000–370 cm. The liquid-state 1H and 13C{1H} NMR spectra were recorded at 25.0 °C on a 600 MHz Avance II Bruker spectrometer operating at 600 and 151 MHz for 1H and 13C, respectively, and dimethyl sulfoxide-d6 (DMSO-d6) was used as solvent. The chemical shifts (δ) are reported in parts per million (ppm); for DMSO-d6, the spectra were referenced relative to the solvent peak (2.50 ppm for 1H and 39.52 ppm for 13C). Coupling constants (J) are reported in Hz. Electrospray ionization mass spectrometry (ESI-MS) of 1–8 was recorded on a SCIEX 4000 QTRAP hybrid triple quadrupole ion trap mass spectrometer either in positive or in negative ESI mode with samples injected as methanol solutions. The ionization voltage was set at 5500 V in positive mode with a 10 psi curtain gas setting and 20 psi ionization gas (GS1) setting. The UV/Vis spectra were recorded in the range of 100–1100 nm at room temperature on a LAMBDA 265 UV/Visible spectrophotometer. The spectrometer utilizes a Xenon Flash interface. The intensity data was collected on a Bruker X8 ApexII 4 K Kappa CCD diffractometer, equipped with graphite monochromated Mo K(α) radiation with a wavelength of 0.71073 Å, using an exposure time of 20 s/frame. A total of 1568 frames were collected with a frame width of 0.5° with 99.7% completeness accomplished. Phi and omega scans are reported at 100 K. All cell refinements as well as data reductions were performed using SAINT-Plus software.82 Absorption corrections were made using the multiscan technique and the SADABS software package. All structures were solved with the SIR-97 software package,83 and structure refinement was made using SHELXL-201384 and WinGX.85 The molecular graphics were drawn using DIAMOND.86 All non-hydrogen atoms were refined anisotropically. Methyl and aromatic hydrogen atoms were placed in geometrically idealized positions and constrained to ride on their parent atoms, with C–H = 0.98 and 0.95 A° and Uiso(H) = 1.5Ueq(C) and 1.2Ueq(C), respectively. The NH hydrogen atoms were located in the difference Fourier map and freely refined with Uiso(H) = 1.5Ueq(N). The Fc versus Fo plot proved five reflections to be outliers, and they were removed from the refinement as systematic errors.
Synthesis
The starting synthon fac-[NEt4]2[Re(CO)3(Br)3] (ReAA) and the ligands (2,6-dimethoxypyridyl)imidazo[4,5-f]1,10-phenanthroline (L1), (indole)imidazo[4,5-f]1,10-phenanthroline (L2), (5-methoxyindole)imidazo[4,5-f]1,10-phenanthroline (L3), (biphenyl)imidazo[4,5-f]1,10-phenanthroline (L4), (fluorene)imidazo[4,5-f]1,10-phenanthroline (L5), (benzo[b]thiophene)imidazo[4,5-f]1,10-phenanthroline (L6), (5-bromothiazole)imidazo[4,5-f]1,10-phenanthroline (L7), and (4,5-dimethylthiophene)imidazo[4,5-f]1,10-phenanthroline (L8) have been synthesized and characterized as reported previously in the literature.45,5013C{1H} NMR was attempted for 1–8; however, after 18,000 scans on highly concentrated NMR samples, poor or no peaks were obtained. Due to economic implications, other characterization methods were relied upon.
General Synthetic Procedure for Re(I) Tricarbonyl Complexes
ReAA was added to 3 equiv of AgNO3 solution in 10 mL of water (at pH 2) and stirred at room temperature for 24 h, which resulted in a gray/white precipitate of AgBr. The precipitate was filtered, and 1.1 equiv of the ligand was added to the filtrate. The solution was stirred at 80 °C for 12 h, and a solid was separated from the solution. The reaction mixture was filtered and washed three times with distilled water to yield a solid product.
fac-[Re(CO)3(L1)(H2O)][NO3] (1)
0.206 g (0.267 mmol) ReAA, 0.136 g (0.801 mmol) AgNO3, 0.099 g (0.294 mmol) L1. Yield: 0.0902 g (0.131 mmol, 49%); elemental analysis for C23H17N6O9Re: calculated: C = 39.04%, N = 11.88%, H = 2.42%; found: C = 38.91%, N = 11.90%, H = 2.44%.; IR (ATR, cm–1): νN-H = 3346, νO-H = 3064, 2958, νC=O = 2028, 1896, νC=N = 1605, νC=N = 1582, 1452, νC-O = 1323, 1274.; 1H NMR (400 MHz, DMSO-d6): δ 9.5 (4H, m), 8.6 (1H, d, J = 8.2 Hz), 8.2 (2H, bs), 6.7 (1H, d, J = 8.2 Hz), 4.2 (3H, s), 4.0 (3H, s) ppm; 13C{1H} NMR (151 MHz, DMSO-d6): δ 196.9, 164.2, 163.9, 159.8, 159.6, 150.0, 142.5, 142.3, 124.6, 105.1, 104.6, 103.2, 102.9, 54.6, 54.5, 54.4, 54.3 ppm. UV/Vis (DMSO): λmax = 350 nm, ε = 12,223 M–1 cm–1. ESI-MS (CH3OH, +ve ion mode): m/z 627.9 ([M - NO3– - H2O]+); calcd, 627.6).
fac-[Re(CO)3(L2)(H2O)][NO3] (2)
0.201 g (0.260 mmol) ReAA, 0.132 g (0.777 mmol) AgNO3, 0.096 g (0.286 mmol) L2. Yield: 0.098 g (0.143 mmol, 55%); elemental analysis for C24H15N6O7Re: calculated: C = 42.04%, N = 12.26%, H = 2.21%; found: C = 41.94%, N = 12.31%, H = 2.19%; IR (ATR, cm–1): νN-H = 3387, νO-H = 3074, νC=O = 2019, 1912, 1886, νC=N = 1576, νC=N = 1318; 1H NMR (400 MHz, DMSO-d6): δ 9.4 (4H, overlying multiplet, singlet, and doublet), 8.7 (1H, s), 8.3 (2H, overlying singlets), 8.1 (1H, s), 7.6 (1H, s), 7.3 (2H, s) ppm; 13C{1H} NMR (151 MHz, DMSO-d6): δ 197.0, 143.6, 137.0, 134.3, 127.2, 127.1, 125.5, 123.1, 121.8, 121.1, 112.7 ppm; UV/Vis (DMSO): λmax = 345 nm, ε = 23,989 M–1 cm–1. ESI-MS (CH3OH, +ve ion mode): m/z 606.2 ([M - NO3– - H2O]+); calcd, 605.6).
fac-[Re(CO)3(L3)(H2O)][NO3] (3)
0.20 g (0.260 mmol) ReAA, 0.132 g (0.780 mmol) AgNO3, 0.104 g (0.286 mmol) L3. Yield: 0.0614 g (0.0858 mmol, 33%); elemental analysis for C25H17N6O8Re: calculated: C = 41.96%, N = 11.74%, H = 2.39%; found: C = 41.86%, N = 11.72%, H = 2.38%; IR (ATR, cm–1): νN-H = 3121, νO-H = 2921, 2852, νC=O = 2028, 1936, 1910, νC=N = 1603, νC=N = 1319, νC-O = 1217. 1H NMR (600 MHz, DMSO-d6): δ 11.7 (1H, s), 9.3 (2H, broad singlet), 9.2 (2H, singlet), 8.2 (2H, broad singlet), 8.1 (2H, s), 7.5 (1H, d, J = 8.7 Hz), 6.9 (1H, d, J = 8.6 Hz), 3.9 (3H, s) ppm. 13C{1H} NMR (151 MHz, DMSO-d6): δ 155.1, 132.1, 126.1, 125.7, 113.3, 113.0, 103.6, 55.9 ppm. UV/Vis (DMSO): λmax = 390 nm, ε = 19,145 M–1 cm–1; ESI-MS (CH3OH, +ve ion mode): m/z 636.2 ([M - NO3– - H2O]+); calcd, 635.6).
fac-[Re(CO)3(L4)(H2O)][NO3] (4)
0.102 g (0.132 mmol) ReAA, 0.067 g (0.397 mmol) AgNO3, 0.054 g (0.145 mmol) L4. Yield: 0.0219 g (0.0303 mmol, 23%); elemental analysis for C28H18N5O7Re: calculated: C = 46.53%, N = 9.69%, H = 2.51%; found: C = 46.23%, N = 9.71%, H = 2.48%. IR (ATR, cm–1): νO-H = 3091, 3027, νC=O = 2038, 1993, 1956, νC=C = 1808, 1775, 1610, νC=N = 1554, νC=N = 1339. 1H NMR (600 MHz, DMSO-d6): δ 13.9 (1H, s), 9.1 (4H, s), 8.3 (2H, d, J = 7.3 Hz), 8.0 (2H, broad singlet), 7.9 (2H, d, J = 7.4 Hz), 7.8 (2H, d, J = 7.0 Hz), 7.5 (2H, t, J = 13.8, 6.9 Hz), 7.4 (1H, t, J = 13.8, 6.9 Hz) ppm. 13C{1H} NMR (151 MHz, DMSO-d6): δ 151.6, 141.9, 139.6, 129.5, 129.0, 128.5, 127.7, 127.4, 127.2, 125.1 ppm. UV/Vis (DMSO): λmax = 337 nm, ε = 25,793 M–1 cm–1. ESI-MS (CH3OH, +ve ion mode): m/z 643.2 ([M - NO3– - H2O]+); calcd, 642.6).
fac-[Re(CO)3(L5)(H2O)][NO3] (5)
0.10 g (0.130 mmol) ReAA, 0.066 g (0.39 mmol) AgNO3, 0.055 g (0.143 mmol) L5. Yield: 0.0343 g (0.0469 mmol, 36%); elemental analysis for C29H18N5O7Re: calculated: C = 47.41%, N = 9.53%, H = 2.47%; found: C = 47.44%, N = 9.50%, H = 2.43%. IR (ATR, cm–1): νN-H = 3471, νO-H = 3057, 2902, νC=O = 2028, 1926, 1905, νC=N = 1610, νC=C = 1557, 1476, νC-H = 1446, νC=N = 1317. 1H NMR (600 MHz, DMSO-d6): δ 9.1 (4H, merged singlet), 8.3 (1H, s), 8.2 (1H, d, J = 7.6 Hz), 8.0 (3H, merged singlet), 7.9 (1H, d, J = 4.6 Hz), 7.6 (1H, d, J = 7.3 Hz), 7.3 (2H, dt, J = 29.2, 7.3 Hz), 4.0 (2H, s) ppm. 13C{1H} NMR (151 MHz, DMSO-d6): δ 152.2, 146.7, 144.1, 144.0, 143.1, 140.7, 139.2, 128.2, 127.8, 127.4, 125.7, 125.6, 125.1, 123.2, 120.9, 120.8, 36.8 ppm. UV/Vis (DMSO): λmax = 342 nm, ε = 29,853 M–1 cm–1. ESI-MS (CH3OH, +ve ion mode): m/z 655.2 ([M - NO3– - H2O]+); calcd, 654.7).
fac-[Re(CO)3(L6)(H2O)][NO3] (6)
0.199 g (0.258 mmol) ReAA, 0.131 g (0.774 mmol) AgNO3, 0.10 g (0.283 mmol) L6. Yield: 0.105 g (0.149 mmol, 58%); elemental analysis for C24H14N5O7SRe: calculated: C = 41.02%, N = 9.97%, S = 4.56%, H = 2.01%; found: C = 41.20%, N = 9.96%, S = 4.60%, H = 2.02%. IR (ATR, cm–1): νN-H = 3397, νO-H = 3075, νC=O = 2028, 1920, 1894, νC=N = 1660, νC=C = 1581, 1562, νC=N = 1370, 1304. 1H NMR (400 MHz, DMSO-d6): δ 9.5 (1H, dd, J = 15.3, 4.7 Hz), 9.3 (1H, broad singlet), 9.1 (2H, overlapping singlets), 8.3 (2H, overlapping singlets), 8.0 (3H, m), 7.5 (2H, overlapping signals) ppm. 13C{1H} NMR (101 MHz, DMSO-d6): δ 196.9, 152.8, 148.6, 140.2, 140.0, 139.9, 133.2, 132.8, 127.6, 126.6, 126.2, 125.7, 125.5, 125.3, 125.2, 124.9, 124.2, 123.4, 123.2, 123.0 ppm. UV/Vis (DMSO): λmax = 369 nm, ε = 28,040 M–1 cm–1. ESI-MS (CH3OH, +ve ion mode): m/z 623.1 ([M - NO3– - H2O]+); calcd, 622.6).
fac-[Re(CO)3(L7)(H2O)][NO3] (7)
0.206 g (0.267 mmol) ReAA, 0.136 g (0.801 mmol) AgNO3, 0.112 g (0.294 mmol) L7. Yield: 0.0254 g (0.0347 mmol, 13%); elemental analysis for C19H10N6O7SBrRe: calculated: C = 31.15%, N = 11.47%, S = 4.37%, Br = 10.91%, H = 1.37%; found: C = 31.25%, N = 11.51%, S = 4.41%, Br = 10.89%, H = 1.35%. IR (ATR, cm–1): νN-H = 3398, νO-H = 3059, νC=O = 2025, 1918, 1893, νC=N = 1608, νC=N = 1312, 1254, νC-Br = 805, νC-S = 805. 1H NMR (400 MHz, DMSO-d6): δ 13.9 (1H, s), 11.7 (1H, s), 9.5 (2H, s), 8.2 (3H, overlying singlets), 7.5 (1H, triplet, J = 16.9, 8.72), 6.9 (1H, doublet, J = 8.7 Hz) ppm. 13C{1H} NMR (101 MHz, DMSO-d6): δ 197.0, 159.0, 152.4, 145.3, 140.0, 128.1, 124.5 ppm. UV/Vis (DMSO): λmax = 261 nm, ε = 1494 M–1 cm–1. ESI-MS (CH3OH, +ve ion mode): m/z 671.1 ([M - NO3–]+); calcd, 670.5).
fac-[Re(CO)3(L8)(H2O)][NO3] (8)
0.203 g (0.264 mmol) ReAA, 0.135 g (0.792 mmol) AgNO3, 0.112 g (0.294 mmol) L8. Yield: 0.0609 g (0.0896 mmol, 34%); elemental analysis for C22H16N5O7SRe: calculated: C = 38.82%, N = 10.29%, S = 4.71%, H = 2.37%; found: C = 38.85%, N = 10.27%, S = 4.69%, H = 2.38%. IR (ATR, cm–1): νN-H = 3066, νO-H = 2923, 2865, νC=O = 2025, 1904, 1894, νC=N = 1617, νC=C = 1586, 1545, νC-S = 806. 1H NMR (400 MHz, DMSO-d6): δ 14.1 (1H, s), 9.4 (2H, d, J = 4.9 Hz), 9.1 (2H, broad multiplet), 8.1 (2H, broad doublet, J = 19.8 Hz), 7.6 (1H, s), 2.4 (3H, s), 2.2 (3H, s) ppm. 13C{1H} NMR (101 MHz, DMSO-d6): δ 197.9, 190.0, 151.7, 148.7, 137.0, 134.8, 133.2, 132.9, 130.3, 127.8, 126.9, 13.8, 13.5 ppm. UV/Vis (DMSO): λmax = 341 nm, ε = 6340 M–1 cm–1. ESI-MS (CH3OH, +ve ion mode): m/z 601.1 ([M - NO3– - H2O]+); calcd, 600.6).
Stability Study
The stability of the complexes in DMSO, aqueous buffer, and FBS solutions was monitored using time-dependent UV/Vis absorption measurements. Briefly, the concentration of each complex was maintained at 10 μM except for complex 7. In fact, due to poor solubility, we used 5 μM concentration for compound 7. A 1:20 v/v DMSO:10 mM phosphate buffer pH 7.4 in the presence of 4 mM NaCl solution of the complexes was used to evaluate the aqueous solution stability. In the case of the stability in FBS solution, we prepared the complex solution in 1:99 v/v DMSO:10 mM phosphate buffer pH 7.4 in the presence of 10% FBS. The stability of the complexes in solution was monitored up to 6 h.
Determination of Acid Dissociation Constant (pKa)
pH measurements were performed using a Hanna pH211 Microprocessor pH meter, equipped with a HI 1131 probe, which was calibrated using standard buffer solutions, with pH = 4.01, 7.00, and 10.00. A Varian Cary 50 Conc UV/Vis spectrophotometer coupled to a personal computer capable of performing least squares analyses on the absorption values vs pH data was utilized for the kinetic measurements. Microsoft Office Excel (2019) and Scientist Micromath, version 2.01 were used to fit the collected data to specific functions.87,88 A circulating water bath system was used to control and maintain the temperature at 25 °C. The ionic strength (μ) of all solutions was maintained at 1 M NaClO4.
The stability of complexes in DMSO solution was also monitored by ESI-MS measurement. Briefly, 10 μM DMSO solution of the complexes was incubated for 48 h at 37 °C. Finally, 10 μL of DMSO solution was diluted in 1 mL of methanol and analyzed by ESI-MS.
Distribution Coefficient
The distribution coefficient or lipophilicity (log D) was determined using a standard shake flask technique.58 Briefly, 40 μL of 1 mM DMSO solution of complex was added to 4 mL of pre-equilibrated 10 mM phosphate buffer (pH 7.4) octanol mixture (1:1 v/v) and agitated continuously in a vertical shaker for 6 h. Then, each layer of the mixture was separated by centrifugation and transferred to new vials. Further, the complex concentration in each layer was determined by measuring their absorption spectra. Finally, the lipophilicity was determined using eq 3 below.
| 3 |
BSA Binding Study
The BSA binding study was performed by measuring the internal fluorescence quenching of BSA. BSA has an intrinsic fluorescence emission maxima at 341 nm upon excitation at 280 nm.66,67 Briefly, 20 μM BSA solution in 1× Tris buffer (pH 7.4) was incubated with different concentrations (0–10 equiv) of complex solution for 15 min at 37 °C. Further, their fluorescence intensities were recorded at 341 nm upon excitation at 280 nm. Finally, the fluorescence quenching constant and the binding constant were calculated using the Stern–Volmer equation (eq 4) and the Scatchard equation (eq 5), respectively.
| 4 |
| 5 |
In the equations, the fluorescence emission intensity of native protein is denoted as F0, the fluorescence emission intensity in the presence of quencher is denoted as F, [Q] corresponds to the concentration of quencher for F, Ksv is the Stern–Volmer quenching constant, Ka is denoted as the binding constant of quencher and protein, and n is the number of binding sites per protein molecule. Complexes showed no emission at 341 nm when excited at 280 nm.
DNA Binding Study
With Model Nucleobase
The DNA binding ability of complex 6 through covalent bond formation was studied in the presence of a model nucleobase, guanosine, using 1H NMR and ESI-MS. Precisely, 1.5 mM DMF-d7 solution of complex 6 was allowed to react with 3 mM guanosine solution in DMF-d7 at 37 °C and the binding was monitored at different intervals of time by recording 1H NMR spectra up to 24 h. Finally, after 24 h, 5 μL of DMF solution was diluted in 1 mL of methanol and analyzed by ESI-MS.
Preparation of ctDNA Solution
Calf thymus deoxyribonucleic acid (ctDNA) and tris–HCl buffer solution (pH = 7.4, 1 M) were purchased from Sigma Aldrich, South Africa, and used without further purification. The ctDNA stock solution was prepared by stirring a solution of ctDNA in Tris–HCl buffer for 12 h at room temperature. The purity of the stock solution was confirmed by the ratio of A260nm/A280nm (1.843), indicating that the solution was free of protein.45,81,89,91 This solution was stored at 4 °C between scans and discarded 2 days after preparation. The molar extinction coefficient value of ctDNA at 260 nm (6600 L mol–1 cm–1) was employed in the determination of the stock solution concentration.
Ethidium Bromide Displacement Assay
To check the possibility of DNA intercalation due to the presence of a planer fused ring ligand system, we performed the standard ethidium bromide (EB) displacement assay. Precisely, 10 μM ctDNA solution in 1× Tris·NaCl buffer was incubated at 37 °C with 3 equiv of EB for 30 min. After this, 0 to 10 equiv of complex 6 were added to the solution and incubated for an additional 30 min at 37 °C. Each solution was excited at 540 nm, and emission was measured from 550 to 800 nm. Finally, the apparent binding constant (Kapp) was measured using eq 6.
| 6 |
where [EB] is the concentration of EB (30.0 μM) and [C50] is the concentration of complex when the reduction of fluorescence reach 50%. KEB is the binding constant of EB (KEB = 1 × 10⁷ M–1 for ctDNA).90 The IC50 values were calculated from plots of normalized fluorescence intensity versus complex concentration (Figure S24B).
DNA Melting
The DNA binding ability of complex 6 was confirmed by measuring the DNA melting temperature prior to complex binding. Briefly, 40 μM ctDNA was incubated with 30 μM of the complex at 37 °C for 15 min. Afterward, the absorbance of the solution was measured at 260 nm in each °C increment in temperature within the range from 60–97 °C. A Cary UV 300 (Agilent Technologies) was used to measure all absorbances. The experiment was programmed with a 1 °C/min temperature ramp rate from the temperature range 60–97 °C, and the holding time was 1 min. Finally, the absorbance of each experiment was normalized to 0 and 1 and further compared with the melting temperature of native ctDNA.
Cell Lines and Cell Culture
Human prostate adenocarcinoma (PC3) and normal human retinal pigment epithelial-1 (RPE-1) cells were originally procured from the American Type Culture Collection (ATCC). The PC3 and RPE-1 cells were maintained in Ham’s F-12K (Kaighn’s) Medium and DMEM/F-12, GlutaMAX Supplement medium containing 10% fetal bovine serum (GIBCO) and 1% penicillin–streptomycin (100 units/mL, GIBCO), respectively.
Cytotoxicity
The standard Resazurin assay was performed to determine the cytotoxicity of the synthesized complexes. In particular, 4 × 10³ cells were seeded in each well of a 96 well microplate and incubated at 37 °C under normoxic conditions (∼15% O2 level). After 24 h of the initial incubation period, the medium was replenished by a fresh metal complex-containing medium (100 μL/well) and incubated for an additional 48 h. Initially, the metal complex was dissolved in DMSO and the target concentration was achieved by further dilution with the medium. A total of seven or nine different concentrations of the metal complex solutions from 10 nM to 100 μM were used to observe the dose-dependent cytotoxicity. The ultimate concentration of DMSO in each well was ≤1%. Finally, the metal complex-containing medium was carefully aspirated and an equal volume of Resazurin (0.2 mg/mL)-containing medium was added. After 4 h of incubation at 37 °C, the fluorescence of the produced resorufin product (λex = 540 nm, λem = 590 nm) was measured in either a Tecan infinite F200PRO Microplate Reader or a Cytation 5, Cell Imaging Multi-Mode Reader, BioTek. Finally, the half-maximal inhibitory concentration (IC50) value was calculated using the GraphPad Prism 5 software from the plot of % of cell viability vs log[complex concentration] after applying nonlinear fitting. Each of the reported IC50 values is the mean of three individual experiments with standard deviation, and each concentration was assayed in sextuplicate in each successive experiment.
The cytotoxic inactivation of most selective complexes 3 and 6 in hypoxic conditions (2.0% O2) was also measured against PC3 cells. A similar protocol as stated in normoxia cytotoxicity was followed to determine their IC50 in hypoxic conditions, keeping everything unaltered except the incubation in the presence of 2.0% O2. Initially, at least three consecutive cell passages were maintained in hypoxic conditions before starting any experiments.
Cytotoxicity against 3D Cell Spheroid
1 × 10⁴ PC3 cells were seeded in each well of a Corning 96 Well Ultra-Low Attachment Treated Spheroid Microplate. After 96 h of incubation at 37 °C in normoxic conditions, the average spheroid size observed was 435 μm. Half of the medium was replaced by an equal volume of complex-containing (two times of target concentrations) medium. After 72 h, the cell viability was measured using the AlamarBlue assay. Finally, the IC50 values were determined by using GraphPad Prism 5 software after applying four parameter fitting.
Intracellular Accumulation Study
The fluorescence property is highly dependent on pH and the cellular microenvironment.74,91 Hence, we quantified Re in different cellular organelles using ICP-MS to determine the complex localization in cells.
An adequate number of PC3 cells were seeded in a 150 mm diameter Petri dish using F12K medium and incubated in normoxic conditions at 37 °C. The medium from each Petri dish was replenished every 2 days. When the cell confluency reached around 80–90%, a fresh medium containing 5 μM complexes 3 or 6 was added and incubated for an additional 1.5 h in normoxic conditions at 37 °C. Cells were harvested by trypsinization. The medium was removed by centrifugation, and the cell pellet was washed twice with cold DPBS. The nucleus and mitochondria of treated cells were then isolated using the standard kit protocols mentioned below. To determine the total rhenium uptake, 5 × 10⁵ cells were collected and digested using 100 μL of 70% nitric acid at 60 °C for 12 h. The acid solution was further diluted using 4900 μL of MilliQ water. Finally, the rhenium concentration was measured using ICP-MS. Each experiment was performed in triplicate.
Nuclei: The nuclei isolation kit, Nuclei EZ Prep (NUC101) (Sigma-Aldrich) was used to isolate the nuclei from the complex-treated cells, and the standard kit protocol was employed for the isolation process. The complex-treated cells were exposed to 4 mL of ice-cold Nuclei EZ lysis buffer and vortexed briefly to lyse the cells. The solution was settled at 4 °C for another 5 min and centrifuged at 500g for 5 min at 4 °C. The supernatant was removed carefully. The cell and nucleus pellets were redissolved using ice-cold Nuclei EZ lysis buffer, and the same process was repeated to maximize the nuclei yield. During this isolation step, both the nucleus and cells were stained with the trypan blue dye prior to counting using a hemocytometer to obtain the exact number of the nuclei and intact cells.
Mitochondria: The mitochondria isolation kit (MITOISO2) (Sigma-Aldrich) was used to isolate the mitochondria from the complex-treated cells, and the standard kit protocol was employed for the isolation procedures. By following the kit protocol, the complex-treated cells were lysed using 1× extraction buffer at 4 °C using a Dounce homogenizer. The exact number of lysed cells was counted using a hemocytometer after trypan blue staining. The intact cells and other heavier cell fragments were removed from the solution by centrifugation at 600g for 10 min at 4 °C. The supernatant was transferred carefully and centrifuged at 11000g for 10 min at 4 °C to isolate the mitochondria. Hence, the total amount of isolated mitochondria corresponds to the total lysed cells. The percentage of rhenium accumulation in the nucleus and mitochondria was calculated using the total accumulated rhenium corresponding to 5 × 10⁵ cells.
Sample Preparation for ICP-MS
The samples were digested in either 100 μL (cell pellet) or 500 μL (nucleus and mitochondria pellet) of 70% HNO3 at 60 °C for 12 h. The acid solution was further diluted (1:50 v/v) with MilliQ water. Finally, the rhenium concentration in the solution was analyzed using a high-resolution ICP-MS instrument of ThermoScientific (Element II, ThermoScientific) at the Institut de Physique du Globe de Paris, France.
Cellular Uptake Pathways
1.5 × 10⁶ PC3 cells were seeded in a 6 cm Petri dish and incubated in normoxic conditions at 37 °C. After 24 h of seeding, the cells were treated with different cellular uptake pathways inhibitors for 2 h in normoxic conditions. The inhibitor used here were as follows: 1 mM tetraethylammonium chloride (cationic transporter inhibitor), 5 μM oligomycin and 50 mM 2-deoxy-d-glucose (metabolic inhibitors), and 50 mM ammonium chloride (endocytotic inhibitor) as different uptake pathway inhibitors. Additionally, we pre-incubated the cells at 4 °C for 2 h to determine the involvement of passive transport on the cellular uptake process. After 2 h, cells were washed twice with DPBS and 5 μM of complex (3 and 6) solution was added. After 2 h of incubation in normoxic conditions, cells were harvested using trypsinization and counted. 1 × 10⁶ cells were separated and digested in 100 μL of conc. HNO3. Finally, the acid solution was diluted by addition of 4900 μL of MQ water to keep the acid % within 2. The rhenium concentration in solution was measured by ICP-MS. Each successive experiment and control experiments were performed three times to determine the average value with standard deviation.
Mito Stress Test Using Seahorse Apparatus
3 × 10⁴ PC3 cells/well were seeded of a Seahorse XF Cell Culture Microplate using 80 μL of FBS-supplemented F12K medium and incubated in normoxic conditions for 24 h at 37 °C. The medium was replaced by an equal volume of compound (3, 0.4 and 5 μM; 6, 0.05 and 2 μM; and cisplatin, 7 and 30 μM)-containing medium. After 24 h of treatment, media were removed, and the treated cells were washed very carefully with the Seahorse XF medium three times. Finally, the cells were incubated at 37 °C for 1 h in a non-CO2 incubator. The Mito Stress assay was run in a Seahorse Xfe96 instrument (Agilent) at 37 °C using multiple inhibitors, viz., ATP synthase inhibitor (oligomycin, 1 μM), proton gradient and mitochondrial membrane potential collapsing agent (FCCP, 1 μM), and mitochondrial respiratory complex I and III inhibitors (rotenone, 1 μM and antimycin A, 1 μM, respectively). After the experiment, the cells were fixed using 4% p-formaldehyde solution and the nucleus was stained with DAPI. Each well was imaged in a Cytation 5 Cell Imaging Multimode Reader (BioTek) using a 10× objective lens. Finally, the cells from each image were calculated by using Gen5 software (Figure S35) and by utilizing the cell count and the data was normalized against the same cell number.
Cell Death Mechanism
To evaluate the possible cell death pathways, we measured the cell viability in the presence of different cell death pathway inhibitors.44,75 Briefly, 1 × 10³ PC3 cells/well were seeded in 96-well plates and incubated for 24 h in normoxic conditions at 37 °C. The medium was removed and treated with inhibitors for 1 h. Autophagy inhibitor (3-methyladenine (100 μM)), apoptosis inhibitor (Z-VAD-FMK (20 μM)), paraptosis inhibitor (cycloheximide (0.1 μM)), and necrosis inhibitor (necrostatin-1 (60 μM)) were the different inhibitors used. After 1 h, the inhibitor-containing medium was removed and washed with 1× DPBS. Then, different concentrations of complex solution were added and incubated for 36 h in normoxic conditions. Finally, the cell viability was determined by Resazurin assay (check the Cytotoxicity section for details) to evaluate the IC50 values.
Annexin-V/PI Assay for Apoptosis Detection
1.5 × 10⁶ PC3 cells were seeded in a 6 cm Petri dish using a F12K medium and incubated at 37 °C in normoxic conditions. After 24 h of incubation, the medium was replenished with a complex-containing medium and incubated additionally for 24 h. Two different concentrations of complexes 3 and 6 were used to determine the possible apoptosis pathways for cell killing. The cells were then harvested by trypsinization and washed twice with DPBS. The cells were further stained with both FITC-tagged Annexin-V (cat. no. 556419, BD Biosciences) and propidium iodide (cat. no. 51-66211E, BD Biosciences). Finally, the stained cells were analyzed using a BD LSR II flow cytometry instrument (BD Biosciences) at Institut Curie, Paris, France.
ROS Analysis
1.5 × 10⁴ PC3 cells were seeded in the dark in 96-well plates for 24 h. Four different concentrations of complexes 3 and 6 were used to treat the cells for 8 h, and then two different concentrations of H2O2 were used to treat the cells for 30 min (10 and 15 μM). The medium was removed, and 40 μM DCFH-DiOxy-Q (Kit No. ab238535, Abcam) in 10% FBS containing HEPES was added in each well followed by incubation at 37 °C for 30 min. The cells were washed twice with HEPES, and finally fluorescence intensity was measured (λex/λem; 485/530 nm) using a Cytation 5 Cell Imaging Multimode Reader (BioTek). Then, the cells were fixed using p-formaldehyde and stained using DAPI. The cells were finally counted in the same way as stated before and utilized to normalize the data.
Acknowledgments
The Grant holder acknowledges that opinions, findings, and conclusions or recommendations expressed in any publication generated by the NRF supported research are that of the author(s) and that the NRF accepts no liability whatsoever in this regard. We sincerely acknowledge Mr. Pierre Burckel, Institut de Physique du Globe de Paris, for his kind help regarding all the ICP-MS measurements and Mr. Francois Jacobs for the crystal data collection.
Supporting Information Available
The Supporting Information is available free of charge at https://pubs.acs.org/doi/10.1021/acs.inorgchem.3c00730.
Crystallographic data (Tables S1–S3) and interactions (Figures S1–S6), stability studies (Figures S7–S14), pKa determination (Figures S15–S18), DNA binding studies (Figures S19–S24), BSA binding studies (Figures S25–S28), cytotoxicity (Table S4 and Figures S29–S33), mitochondrial respiration test (Figures S34–S37), 1H NMR spectra (Figures S38–S45), and FT-IR spectra of complexes (Figures S46–S53) (PDF)
Author Contributions
# L.E.E. and K.P. contributed equally to the work.
Author Contributions
The manuscript was written through contributions of all authors. All authors have given approval to the final version of the manuscript. L.E.E.: writing – original draft and investigation. K.P.: investigation and writing – original draft. M.D.P.: investigation and writing. G.G.: supervision, writing – review & editing. H.G.V.: supervision and writing – review & editing. M.S.-S.: funding acquisition, project administration, writing – review & editing, and conceptualization. B.S.: investigation.
Financial assistance from the University of the Free State is gratefully acknowledged. This work is based on research supported in part by the National Research Foundation of South Africa, unique grant number 116246. The intracellular accumulation study was financially supported by the European Union’s Horizon 2020 research and innovation programme (Marie Skłodowska-Curie Innovative Training Network Nature-ETN, H2020-MSCA-ITN-2019-861381) and ERC Consolidator Grant PhotoMedMet to G.G. (GA 681679), by the ITMO Cancer AVIESAN (Alliance Nationale pour les Sciences de la Vie et de la Sante/National Alliance for Life Sciences & Health) within the framework of the Cancer Plan (G.G.) and has received support under the program “Investissements d’ Avenir” launched by the French Government and implemented by the ANR with the reference ANR-10-IDEX-0001-02 PSL (G.G.).
The authors declare no competing financial interest.
Supplementary Material
References
- Kirgan R. A.; Sullivan B. P.; Rillema D. P.. Topics in Current Chemistry, 281st ed.; Balzani V.; Campagna S., Eds.; Springer-Verlag: Berlin, Heidelberg, 2007. [Google Scholar]
- Kalyanasundaram K.Photochemistry of Polypyridine and Porphyrin Complexes; Academic Press: London, San Diego, 1992. [Google Scholar]
- Arakawa H.; Aresta M.; Armor J. N.; Barteau M. A.; Beckman E. J.; Bell A. T.; Bercaw J. E.; Creutz X. C.; Dinjus O. E.; Dixon D. A.; Domen K.; Dubois D. L.; Eckert J.; Fujita E.; Gibson O. D. H.; Goddard W. A.; Goodman D. W.; Keller J.; Kubas G. J.; Kung H. H.; Lyons J. E.; Manzer L. E.; Marks T. J.; Morokuma K.; Nicholas K. M.; Periana R.; Que L.; Rostrup-nielson J.; Sachtler W. M. H.; Schmidt L. D.; Sen A.; Somorjai G. A.; Stair P. C.; Stults B. R.; Tumas W. Catalysis Research of Relevance to Carbon Management : Progress , Challenges, and Opportunities. Chem. Rev. 2001, 101, 953–996. 10.1021/cr000018s. [DOI] [PubMed] [Google Scholar]
- Morris A. J.; Meyer G. J.; Fujita E. Molecular Approaches to the Photocatalytic Reduction of Carbon Dioxide for Solar Fuels. Acc. Chem. Res. 2009, 42, 1983–1994. 10.1021/ar9001679. [DOI] [PubMed] [Google Scholar]
- Benson E. E.; Kubiak C. P.; Sathrum A. J.; Smieja J. M. Renewable Energy Issue Energy Research to Liquid Fuels W. Chem. Soc. Rev. 2009, 2009, 89–99. [DOI] [PubMed] [Google Scholar]
- Balzani V.; Schoonover J. R.; Scandola F.. Inorganic Chemistry: Molecular Level Artificial Photosynthetic Materials, 44th ed.; Meyer G. J., Ed.; John Wiley & Sons Inc.: New York, 1997. [Google Scholar]
- Balzani V.; Scandola F.; Supramolecular Photochemistry V.; Kemp T. J., Ed.; Ellis Horwood: London, 1991. [Google Scholar]
- Grätzel M. Solar Energy Conversion by Dye-Sensitized Photovoltaic Cells. Inorg. Chem. 2005, 44, 6841–6851. 10.1021/ic0508371. [DOI] [PubMed] [Google Scholar]
- Nazeeruddin M. K.; Grätzel M.. Semiconductor Photochemistry and Photophysics; Ramamurthy V.; Schanze K. S., Eds.; Marcel Dekker Inc.: New York, 2003, 10.1201/9780203912294 [DOI] [Google Scholar]
- Keene F. R.; Sullivan B. P.. Electrochemical and Electrocatalytic Reactions of Carbon Dioxide; Sullivan B. P.; Krist H. E.; Guard H. E., Eds.; Elsevier: Amsterdam, 1992. 10.1524/zpch.1995.189.part_2.278 [DOI] [Google Scholar]
- Lo K. K.; Ng D. C.; Hui W.; Cheung K. Isothiocyanate Moiety – Versatile Labelling Reagents for Biomolecules. J. Chem. Soc., Dalton Trans. 2001, 3, 2634–2640. 10.1039/b103371a. [DOI] [Google Scholar]
- Amoroso A. J.; Arthur R. J.; Coogan M. P.; Hayes A. J.; Court J. B.; Ferna V.; Lloyd D.; Millet C.; Pope S. J. A. A. Thiol-Reactive Luminophore for Fluorescence Microscopy Accumulates in Mitochondria w Z. New J. Chem. 2008, 32, 1097–1102. 10.1039/b802215a. [DOI] [Google Scholar]
- Gasser G.; Ott I.; Metzler-nolte N. Organometallic Anticancer Compounds. J. Med. Chem. 2011, 54, 3–25. 10.1021/jm100020w. [DOI] [PMC free article] [PubMed] [Google Scholar]
- Hartinger C. G.; Metzler-nolte N.; Dyson P. J. Challenges and Opportunities in the Development of Organometallic Anticancer Drugs. Organometallics 2012, 31, 5677–5685. 10.1021/om300373t. [DOI] [Google Scholar]
- Gasser G.; Metzler-nolte N. The Potential of Organometallic Complexes in Medicinal Chemistry. Curr. Opin. Chem. Biol. 2012, 16, 84–91. 10.1016/j.cbpa.2012.01.013. [DOI] [PubMed] [Google Scholar]
- Bruijnincx P. C. A.; Sadler P. J. New Trends for Metal Complexes with Anticancer Activity. Curr. Opin. Chem. Biol. 2008, 12, 197–206. 10.1016/j.cbpa.2007.11.013. [DOI] [PMC free article] [PubMed] [Google Scholar]
- Hartinger C. G.; Dyson P. J. Bioorganometallic Chemistry — from Teaching Paradigms to Medicinal Applications. Chem. Soc. Rev. 2009, 38, 391–401. 10.1039/b707077m. [DOI] [PubMed] [Google Scholar]
- Slikboer S. R.; Pitchumony T. S.; Banevicius L.; Mercanti N.; Edem P. E.; Valliant J. F. Imidazole Fused Phenanthroline (PIP) Ligands for the Preparation of Multimodal Re(i) and 99mTc(i) Probes. Dalton Trans. 2020, 49, 14826–14836. 10.1039/d0dt02829k. [DOI] [PubMed] [Google Scholar]
- Qasim S. S.; Ali S. S.; Ahmed S. K.; June A. Research Journal of Pharmaceutical, Biological and Chemical. Res. J. Pharm. Biol. Chem. Sci. 2011, 2, 423–428. [Google Scholar]
- Jayabharathi J.; Thanikachalam V.; Perumal M. V. A Study on the Binding Interaction between the Imidazole Derivative and Bovine Serum Albumin by Fluorescence Spectroscopy. J. Lumin. 2012, 132, 707–712. 10.1016/j.jlumin.2011.10.023. [DOI] [Google Scholar]
- Gomleksiz M.; Alkan C.; Erdem B. Synthesis, Characterization and Antibacterial Activity of Imidazole Derivatives of 1,10-Phenanthroline and Their Cu(II), Co(II) and Ni(II) Complexes. S. Afr. J. Chem. 2013, 66, 107–112. [Google Scholar]
- Chao H.; Li R.; Ye B.; Li H.; Feng X.; Cai J.; Zhou J.; Ji L. Syntheses, Characterization and Third Order Non-Linear Optical Properties of the Ruthenium. J. Chem. Soc., Dalton Trans. 1999, 3711–3717. [Google Scholar]
- Bonello R. O.; Morgan I. R.; Yeo B. R.; Jones L. E. J.; Benson M.; Fallis I. A.; Pope S. J. A. ACSC. J. Organomet. Chem. 2013, I. 10.1016/j.jorganchem.2013.08.031. [DOI] [Google Scholar]
- Rafique S.; Idrees M.; Nasim A.; Akbar H.; Athar A. Transition Metal Complexes as Potential Therapeutic Agents. Mol. Biol. 2010, 5, 38–45. [Google Scholar]
- Shaheen F.; Badshah A.; Gielen M.; Dusek M.; Fejfarova K.; De Vos D.; Mirza B. Synthesis , Characterization , Antibacterial and Cytotoxic Activity of New Palladium(II) Complexes with Dithiocarbamate Ligands: X-Ray Structure of Bis(Dibenzyl-1-S :S0-Dithiocarbamato) Pd(II). J. Org. Chem. 2007, 692, 3019–3026. 10.1016/j.jorganchem.2007.03.019. [DOI] [Google Scholar]
- Leonidova A.; Gasser G. Underestimated Potential of Organometallic Rhenium Complexes as Anticancer Agents. ACS Chem. Biol. 2014, 9, 2180–2193. 10.1021/cb500528c. [DOI] [PubMed] [Google Scholar]
- Liew H. S.; Mai C. W.; Zulkefeli M.; Madheswaran T.; Kiew L. V.; Delsuc N.; Lee Low M. Recent Emergence of Rhenium(I) Tricarbonyl Complexes as Photosensitisers for Cancer Therapy. Molecules 2020, 25, 1–23. 10.3390/molecules25184176. [DOI] [PMC free article] [PubMed] [Google Scholar]
- Pan Z. Y.; Cai D. H.; He L. Dinuclear Phosphorescent Rhenium(i) Complexes as Potential Anticancer and Photodynamic Therapy Agents. Dalton Trans. 2020, 49, 11583–11590. 10.1039/d0dt02424d. [DOI] [PubMed] [Google Scholar]
- Capper M. S.; Packman H.; Rehkämper M. Rhenium-Based Complexes and in Vivo Testing: A Brief History. ChemBioChem 2020, 21, 2111–2115. 10.1002/cbic.202000117. [DOI] [PMC free article] [PubMed] [Google Scholar]
- Bauer E. B.; Haase A. A.; Reich R. M.; Crans D. C.; Kühn F. E. Organometallic and coordination rhenium compounds and their potential in cancer therapy. Coord. Chem. Rev. 2019, 393, 79. 10.1016/j.ccr.2019.04.014. [DOI] [Google Scholar]
- Collery P.; Desmaele D.; Vijaykumar V. Design of Rhenium Compounds in Targeted Anticancer Therapeutics. Curr. Pharm. Des. 2019, 25, 3306–3322. 10.2174/1381612825666190902161400. [DOI] [PubMed] [Google Scholar]
- Wang F. X.; Liang J. H.; Zhang H.; Wang Z. H.; Wan Q.; Tan C. P.; Ji L. N.; Mao Z. W. Mitochondria-Accumulating Rhenium(I) Tricarbonyl Complexes Induce Cell Death via Irreversible Oxidative Stress and Glutathione Metabolism Disturbance. ACS Appl. Mater. Interfaces 2019, 11, 13123–13133. 10.1021/acsami.9b01057. [DOI] [PubMed] [Google Scholar]
- King A. P.; Marker S. C.; Swanda R. V.; Woods J. J.; Qian S.-B.; Wilson J. J. A Rhenium Isonitrile Complex Induces Unfolded Protein Response-Mediated Apoptosis in Cancer Cells. Chem. – Eur. J. 2019, 25, 9206–9210. 10.1002/chem.201902223. [DOI] [PMC free article] [PubMed] [Google Scholar]
- Marker S. C.; King A. P.; Granja S.; Vaughn B.; Woods J. J.; Boros E.; Wilson J. J. Exploring the In Vivo and In Vitro Anticancer Activity of Rhenium Isonitrile Complexes. Inorg. Chem. 2020, 59, 10285–10303. 10.1021/acs.inorgchem.0c01442. [DOI] [PMC free article] [PubMed] [Google Scholar]
- Neuditschko B.; King A. P.; Huang A.; Janker L.; Bileck A.; Borutzki Y.; Marker S. C.; Gerner C.; Wilson J. J.; Meier-Menches S. M. An Anticancer Rhenium Tricarbonyl Targets Fe-S Cluster Biogenesis in Ovarian Cancer Cells. Angew. Chem., Int. Ed. 2022, 61, e202209136 10.1002/anie.202209136. [DOI] [PMC free article] [PubMed] [Google Scholar]
- Simpson P. V.; Falasca M.; Massi M. Properties and Prospects for Rhenium(i) Tricarbonyl N-Heterocyclic Carbene Complexes. Chem. Commun. 2018, 54, 12429–12438. 10.1039/c8cc06596a. [DOI] [PubMed] [Google Scholar]
- Delasoie J.; Pavic A.; Voutier N.; Vojnovic S.; Crochet A.; Nikodinovic-Runic J.; Zobi F. Identification of Novel Potent and Non-Toxic Anticancer, Anti-Angiogenic and Antimetastatic Rhenium Complexes against Colorectal Carcinoma. Eur. J. Med. Chem. 2020, 204, 112583 10.1016/j.ejmech.2020.112583. [DOI] [PubMed] [Google Scholar]
- Ye R. R.; Tan C. P.; Lin Y. N.; Ji L. N.; Mao Z. W. A Phosphorescent Rhenium(I) Histone Deacetylase Inhibitor: Mitochondrial Targeting and Paraptosis Induction. Chem. Commun. 2015, 51, 8353–8356. 10.1039/c5cc02354h. [DOI] [PubMed] [Google Scholar]
- Hanahan D.; Weinberg R. A. Review Hallmarks of Cancer : The Next Generation. Cell 2011, 144, 646–674. 10.1016/j.cell.2011.02.013. [DOI] [PubMed] [Google Scholar]
- Banerjee S.; Li Y.; Wang Z.; Sarkar F. H. Multi-Targeted Therapy of Cancer by Genistein. Cancer Lett. 2008, 269, 226–242. 10.1016/j.canlet.2008.03.052. [DOI] [PMC free article] [PubMed] [Google Scholar]
- Hu S.; Ma W.; Wang Y.; Zhou Z.; Zhang R.; Du K.; Zhang H.; Sun M.; Jiang X.; Tu H.; Tang X.; Yoa X.; Chen P. Synthesis and anticancer evaluations of novel 1H-imidazole [4,5-f][1,10] phenanthroline derivative for the treatment of colorectal cancer. Eur. J. Pharmacol. 2022, 928, 175120 10.1016/j.ejphar.2022.175120. [DOI] [PubMed] [Google Scholar]
- Bai M.; Liu N.; Zhou Y.; Liu J.; Zou J.; Tan W.; Huang X.; Mei W. Synthesis of Fluorinated Imidazole[4,5f][1,10]phenanthroline Derivatives as Potential Inhibitors of Liver Cancer Cell Proliferation by Inducing Apoptosis via DNA Damage. ChemMedChem 2022, 17, e202100537 10.1002/cmdc.202100537. [DOI] [PubMed] [Google Scholar]
- Ali I.; Lone M. N.; Aboul-Enein H. Y. Imidazoles as Potential Anticancer Agents. MedChemComm 2017, 8, 1742–1773. 10.1039/c7md00067g. [DOI] [PMC free article] [PubMed] [Google Scholar]
- Knopf K. M.; Murphy B. L.; MacMillan S. N.; Baskin J. M.; Barr M. P.; Boros E.; Wilson J. J. In vitro anticancer activity and in vivo biodistribution of rhenium(I) tricarbonyl aqua complexes. J. Am. Chem. Soc. 2017, 139, 14302–14314. 10.1021/jacs.7b08640. [DOI] [PMC free article] [PubMed] [Google Scholar]
- Alberto R.; Egli A.; Abram U.; Hegetschweiler C. K.; Gramlich V.; Schubiger P. A. Synthesis and Reactivity of [NEt4]2[ReBr3(CO)3]. Formation and Structural Characterization of the Clusters [NEt4][Re3(u-OH)3(CO)9] and [NEt4][Re2(u-OH)3(CO)6] by Alkaline Titration. J. Chem. Soc., Dalton Trans. 1994, 2815–2820. 10.1039/DT9940002815. [DOI] [Google Scholar]
- Hevia E.; Pérez J.; Riera V.; Miguel D.; Kassel S.; Rheingold A. New Synthetic Routes to Cationic Rhenium Tricarbonyl Bipyridine Complexes with Labile Ligands. Inorg. Chem. 2002, 41, 4673–4679. 10.1021/ic020174c. [DOI] [PubMed] [Google Scholar]
- Hevia E.; Pérez J.; Riera L.; Riera V.; Miguel D. Reactive Alkoxide Complexes of Groups 6 and 7 Metals. Organometallics 2002, 21, 1750–1752. 10.1021/om010977s. [DOI] [Google Scholar]
- Hightower S. E.; Corcoran R. C.; Sullivan B. P. Unusual, Bifurcated Photoreactivity of a Rhenium(I) Carbonyl Complex of Triethynylphosphine. Inorg. Chem. 2005, 44, 9601–9603. 10.1021/ic050901e. [DOI] [PubMed] [Google Scholar]
- Domínguez S. E.; Alborés P.; Fagalde F. Photoinduced Linkage Isomerization in New Rhenium(I) Tricarbonyl Complexes Coordinated to N-Nitrite and O-Nitrite. Polyhedron 2014, 67, 471–480. 10.1016/j.poly.2013.10.002. [DOI] [Google Scholar]
- Kapp L. E.; Schutte-Smith M.; Twigge L.; Visser H. G. Synthesis, Characterization and DNA Binding of Four Imidazo[4,5-f]1,10-Phenanthroline Derivatives. J. Mol. Struct. 2022, 1247, 131235 10.1016/j.molstruc.2021.131235. [DOI] [Google Scholar]
- Schutte M.; Visser H. G. Aqua-Tricarbonyl(4-Carboxy-Pyridine-2-Carboxylatto-Κ2 N,O2)Rhenium(I). Acta Crystallogr., Sect. E: Struct. Rep. Online 2008, 64, m1226–m1227. 10.1107/S160053680802761X. [DOI] [PMC free article] [PubMed] [Google Scholar]
- Schutte M.; Visser H. G.; Brink A. Bromidotricarbonylrhenium(I). Acta Crystallogr., Sect. E: Struct. Rep. Online 2009, 65, 1320–m1576. 10.1107/S1600536809047242. [DOI] [PMC free article] [PubMed] [Google Scholar]
- Schutte M.; Visser H. G.; Roodt A. Tetra-Ethyl-Ammonium Bromidotricarbonyl(Tropolonato)Rhenate(I). Acta Crystallogr., Sect. E: Struct. Rep. Online 2010, 66, m859–m860. 10.1107/S1600536810024505. [DOI] [PMC free article] [PubMed] [Google Scholar]
- Vinck R.; Gandioso A.; Burckel P.; Saubaméa B.; Cariou K.; Gasser G. Red-Absorbing Ru(II) Polypyridyl Complexes with Biotin Targeting Spontaneously Assemble into Nanoparticles in Biological Media. Inorg. Chem. 2022, 61, 13576–13585. 10.1021/acs.inorgchem.2c02214. [DOI] [PubMed] [Google Scholar]
- Egli A.; Hegetschweiler K.; Alberto R.; Abram U.; Schibli R.; Hedinger R.; Gramlich V.; Kissner R.; Schubiger P. A. Hydrolysis of the Organometallic Aqua Ion Fac-Triaquatricarbonylrhenium(I). Mechanism, PKa, and Formation Constants of the Polynuclear Hydrolysis Products. Organometallics 1997, 16, 1833–1840. 10.1021/om960894p. [DOI] [Google Scholar]
- Schutte M.; Roodt A.; Visser H. G. Coordinated Aqua vs Methanol Substitution Kinetics in fac-Re(I) Tricarbonyl Tropolonato Complexes. Inorg. Chem. 2012, 51, 11996–12006. 10.1021/ic301891u. [DOI] [PubMed] [Google Scholar]
- Schutte-Smith M.; Marker S. C.; Wilson J. J.; Visser H. G. Aquation and Anation Kinetics of Rhenium(I) Dicarbonyl Complexes: Relation to Cell Toxicity and Bioavailability. Inorg. Chem. 2020, 59, 15888–15897. 10.1021/acs.inorgchem.0c02389. [DOI] [PubMed] [Google Scholar]
- Zhang C.; Wang Y.; Wang F. Determination and temperature dependence of n-octanol/water partition coefficients for seven sulfonamides from (298.15 to 333.15) K. Bull. Korean Chem. Soc. 2007, 28, 1183–1186. [Google Scholar]
- Ye R. R.; Tan C. P.; Chen M. H.; Hao L.; Ji L. N.; Mao Z. W. Mono- and Dinuclear Phosphorescent Rhenium(I) Complexes: Impact of Subcellular Localization on Anticancer Mechanisms. Chem. - Eur. J. 2016, 22, 7800–7809. 10.1002/chem.201505160. [DOI] [PubMed] [Google Scholar]
- Sugio S.; Kashima A.; Mochizuki S.; Noda M.; Kobayashi K. Crystal structure of human serum albumin at 2.5A resolution. Protein Eng. 1999, 12, 439–446. 10.1093/protein/12.6.439. [DOI] [PubMed] [Google Scholar]
- Fanali G.; di Masi A.; Trezza V.; Marino M.; Fasano M.; Ascenzi P. Human serum albumin: from bench to bedside. Mol. Aspects Med. 2012, 33, 209–290. 10.1016/j.mam.2011.12.002. [DOI] [PubMed] [Google Scholar]
- Curry S.; Mandelkow H.; Brick P.; Franks N. Crystal structure of human serum albumin complexed with fatty acid reveals an asymmetric distribution of binding sites. Nat. Struct. Biol. 1998, 5, 827–835. 10.1038/1869. [DOI] [PubMed] [Google Scholar]
- Oettl K.; Marsche G. Redox state of human serum albumin in terms of cysteine-34 in health and disease. Methods Enzymol. 2010, 474, 181–195. 10.1016/S0076-6879(10)74011-8. [DOI] [PubMed] [Google Scholar]
- Karges J.; Kalaj M.; Gembicky M.; Cohen S. M. ReI Tricarbonyl Complexes as Coordinate Covalent Inhibitors for the SARS-CoV-2 Main Cysteine Protease. Angew. Chem., Int. Ed. 2021, 60, 10716–10723. 10.1002/anie.202016768. [DOI] [PMC free article] [PubMed] [Google Scholar]
- Capper M. S.; Carcia A. E.; Macia N.; Lai B.; Lin J.-B.; Nomura M.; Alihosseinzadeh A.; Ponnurangam S.; Heyne B.; Shemanko C. S.; Jalilehvand F. Cytotoxicity, cellular localization and photophysical properties of Re(I) tricarbonyl complexes bound to cysteine and its derivatives. J. Biol. Inorg. Chem. 2020, 25, 759–776. 10.1007/s00775-020-01798-9. [DOI] [PubMed] [Google Scholar]
- Alagesan M.; Sathyadevi P.; Krishnamoorthy P.; Bhuvanesh N. S. P.; Dharmaraj N. DMSO containing ruthenium(II) hydrazone complexes: in vitro evaluation of biomolecular interaction and anticancer activity. Dalton Trans. 2014, 43, 15829–15840. 10.1039/C4DT01032A. [DOI] [PubMed] [Google Scholar]
- Singh N.; Kumar N.; Rathee G.; Sood D.; Singh A.; Tomar V.; Dass S. K.; Chandra R. Privileged scaffold chalcone: synthesis, characterization and its mechanistic interaction studies with BSA employing spectroscopic and chemoinformatics approaches. ACS Omega 2020, 5, 2267–2279. 10.1021/acsomega.9b03479. [DOI] [PMC free article] [PubMed] [Google Scholar]
- Alanazi A. M.; Abdelhameed A. S.; Bakheit A. H.; Darwish I. A. Exploring the interaction forces involved in the binding of the multiple myeloma drug lenalidomide to bovine serum albumin. J. Mol. Liq. 2017, 238, 3–10. 10.1016/j.molliq.2017.04.110. [DOI] [Google Scholar]
- Sulkowska A.; Rownicka J.; Bojko B.; Sulkowski W. Interaction of anticancer drugs with human and bovine serum albumin. J. Mol. Struct. 2003, 651-653, 133–140. 10.1016/S0022-2860(02)00642-7. [DOI] [Google Scholar]
- Szkudlarek A.; Wilk M.; Maciazek-Jurczyk M. In Vitro Investigations of Acetohexamide Binding to Glycated Serum Albumin in the Presence of Fatty Acid. Molecules 2020, 25, 2340. 10.3390/molecules25102340. [DOI] [PMC free article] [PubMed] [Google Scholar]
- Yang J.; Zhao J. X.; Cao Q.; Hao L.; Zhou D.; Gan Z.; Ji L. N.; Mao Z. W. Simultaneously Inducing and Tracking Cancer Cell Metabolism Repression by Mitochondria-Immobilized Rhenium(I) Complex. ACS Appl. Mater. Interfaces 2017, 9, 13900–13912. 10.1021/acsami.7b01764. [DOI] [PubMed] [Google Scholar]
- Imstepf S.; Pierroz V.; Rubbiani R.; Felber M.; Fox T.; Gasser G.; Alberto R. Organometallic Rhenium Complexes Divert Doxorubicin to the Mitochondria. Angew. Chem., Int. Ed. 2016, 55, 2792–2795. 10.1002/anie.201511432. [DOI] [PubMed] [Google Scholar]
- Imstepf S.; Pierroz V.; Raposinho P.; Bauwens M.; Felber M.; Fox T.; Shapiro A. B.; Freudenberg R.; Fernandes C.; Gama S.; Gasser G.; Motthagy F.; Santos I. R.; Alberto R. Nuclear Targeting with an Auger Electron Emitter Potentiates the Action of a Widely Used Antineoplastic Drug. Bioconjugate Chem. 2015, 2397–2407. 10.1021/acs.bioconjchem.5b00466. [DOI] [PubMed] [Google Scholar]
- Konkankit C. C.; King A. P.; Knopf K. M.; Southard T. L.; Wilson J. J. In Vivo Anticancer Activity of a Rhenium(I) Tricarbonyl Complex. ACS Med. Chem. Lett. 2019, 10, 822–827. 10.1021/acsmedchemlett.9b00128. [DOI] [PMC free article] [PubMed] [Google Scholar]
- Karges J.; Kuang S.; Maschietto F.; Blacque O.; Ciofini I.; Chao H.; Gasser G. Rationally designed ruthenium complexes for 1- and 2- photon photodynamic therapy. Nat. Commun. 2020, 11, 3262. 10.1038/s41467-020-16993-0. [DOI] [PMC free article] [PubMed] [Google Scholar]
- Hao W.; Chang C.-P. B.; Tsao C.-C.; Xu J. Oligomycin-induced Bioenergetic Adaptation in Cancer Cells with Heterogeneous Bioenergetic Organization. J. Biol. Chem. 2010, 285, 12647–12654. 10.1074/jbc.M109.084194. [DOI] [PMC free article] [PubMed] [Google Scholar]
- Zhang D.; Li J.; Wang F.; Hu J.; Wang S.; Sun Y. 2-Deoxy-D-glucose targeting of glucose metabolism in cancer cells as a potential therapy. Cancer Lett. 2014, 355, 176–183. 10.1016/j.canlet.2014.09.003. [DOI] [PubMed] [Google Scholar]
- Dantuma N. P.; Pijnenburg M. A. P.; Diederen J. H. B.; van der Horst D. J. Developmental down-regulation of receptor-mediated endocytosis of an insect lipoprotein. J. Lipid Res. 1997, 38, 254–265. 10.1016/S0022-2275(20)37438-1. [DOI] [PubMed] [Google Scholar]
- Dean R. T.; Jessup W.; Roberts C. R. Effects of exogenous amines on mammalian cells, with particular reference to membrane flow. Biochem. J. 1984, 217, 27–40. 10.1042/bj2170027. [DOI] [PMC free article] [PubMed] [Google Scholar]
- Gillespie E. J.; Ho C.-L. C.; Balaji K.; Bradley K. A. Selective inhibitor of endosomal trafficking pathways exploited by multiple toxins and viruses. PNAS 2013, 110, E4904–E4912. 10.1073/pnas.1302334110. [DOI] [PMC free article] [PubMed] [Google Scholar]
- Guan R.; Chen Y.; Zeng L.; Rees T. W.; Jin C.; Huang J.; Chen Z.-S.; Ji L.; Chao H. Oncosis-inducing cyclometalated iridium(III) complexes. Chem. Sci. 2018, 9, 5183–5190. 10.1039/C8SC01142G. [DOI] [PMC free article] [PubMed] [Google Scholar]
- Bruker, SAINT-Plus, Version 7.12 (including XPREP), Bruker AXS Inc., Madison, Wisconsin, USA, 2004. [Google Scholar]
- Altomare A.; Burla M. C.; Camalli M.; Cascarano G. L.; Giacovazzo C.; Guagliardi A.; Moliterni A. G. G.; Polidori G.; Spagna R. J. Appl. Crystallogr. 1999, 32, 115–119. 10.1107/S0021889898007717. [DOI] [Google Scholar]
- Sheldrick G. M. Acta Crystallogr., Sect. A: Found. Crystallogr. 2008, 64, 112–122. 10.1107/S0108767307043930. [DOI] [PubMed] [Google Scholar]
- Farrugia L. J. J. Appl. Crystallogr. 1999, 32, 837–838. 10.1107/S0021889899006020. [DOI] [Google Scholar]
- Diamond - Crystal and Molecular Structure Visualization, Crystal Impact, H. Putz & K. Brandenburg GbR, Kreuzherrenstr. 102, 53227 Bonn, Germany, 2022.
- Microsoft Office . Microsoft Corporation 2019.
- MicroMath. Scientist. MicroMath Inc.: Salt Lake City, UT: 1995. [Google Scholar]
- Sirajuddin M.; Ali S.; Badshah A. Drug-DNA Interactions and Their Study by UV-Visible, Fluorescence Spectroscopies and Cyclic Voltametry. J. Photochem. Photobiol., B 2013, 124, 1–19. 10.1016/j.jphotobiol.2013.03.013. [DOI] [PubMed] [Google Scholar]
- Malina J.; Hannon M. J.; Brabec V. DNA binding of dinuclear iron(II) metallosupramolecular cylinders. DNA unwinding and sequence preference. Nucleic Acids Res. 2008, 36, 3630–3638. 10.1093/nar/gkn244. [DOI] [PMC free article] [PubMed] [Google Scholar]
- Gasser G.; Neumann S.; Ott I.; Seitz M.; Heumann R.; Metzler-Nolte N. Preparation and Biological Evaluation of Di-HeteroOrganometallic-Containing PNA Bioconjugates. Eur. J. Inorg. Chem. 2011, 36, 5471–5478. 10.1002/ejic.201100734. [DOI] [Google Scholar]
Associated Data
This section collects any data citations, data availability statements, or supplementary materials included in this article.