Abstract
Backgrounds
In inflammatory bowel disease microenvironment, transdifferentiation of myeloid-derived suppressor cells (MDSCs) and M2 macrophage accumulation are crucial for the transition of colitis-to-cancer. New insights into the cross-talk and the underling mechanism between MDSCs and M2 macrophage during colitis-to-cancer transition are opening new avenues for colitis-associated cancer (CAC) prevention and treatment.
Methods
The role and underlying mechanism that granulocytic MDSCs (G-MDSCs) or exosomes (Exo) regulates the differentiation of monocytic MDSCs (M-MDSCs) into M2 macrophages were investigated using immunofluorescence, FACS, IB analysis, etc, and employing siRNA and antibodies. In vivo efficacy and mechanistic studies were conducted with dextran sulfate sodium-induced CAC mice, employed IL-6 Abs and STAT3 inhibitor.
Results
G-MDSCs promote the differentiation of M-MDSC into M2 macrophages through exosomal miR-93–5 p which downregulating STAT3 activity in M-MDSC. IL-6 is responsible for miR-93–5 p enrichment in G-MDSC exosomes (GM-Exo). Mechanistically, chronic inflammation-driven IL-6 promote the synthesis of miR-93–5 p in G-MDSC via IL-6R/JAK/STAT3 pathway. Early use of IL-6 Abs enhances the effect of STAT3 inhibitor against CAC.
Conclusions
IL-6-driven secretion of G-MDSC exosomal miR-93–5 p promotes the differentiation of M-MDSC into M2 macrophages and involves a STAT3 signaling mechanism that promote colitis-to-cancer transition. Combining STAT3 inhibitors with strategies that inhibit IL-6-mediated G-MDSC exosomal miR-93–5 p production is beneficial for the prevention and treatment of CAC.
Keywords: myeloid-derived suppressor cells, macrophages, immunotherapy, gastrointestinal neoplasms, inflammation
WHAT IS ALREADY KNOWN ON THIS TOPIC
Myeloid-derived suppressor cells (MDSCs) and M2 macrophages accumulate under inflammatory bowel disease and colitis-associated cancer (CAC) conditions, but the interaction between them, as well as the role in regulating the transition of colitis-to-cancer are unclear.
WHAT THIS STUDY ADDS
Here, we report that granulocytic MDSCs (G-MDSCs) promote the differentiation of monocytic MDSC (M-MDSC) into M2 macrophages through releasing exosomal miR-93–5 p. IL-6 is responsible for miR-93–5 p enrichment in G-MDSC exosomes.
HOW THIS STUDY MIGHT AFFECT RESEARCH, PRACTICE OR POLICY
These findings are the first to demonstrate that G-MDSCs promote the differentiation of M-MDSC into M2 macrophages, thereby facilitating colitis-to-cancer transition. Blocking the crosstalk between MDSCs and M2 is beneficial for the prevention and treatment of CAC.
Introduction
Colitis-associated cancer (CAC) does not display the adenoma-carcinoma sequence which is typical for sporadic colorectal cancer (CRC). Chronic inflammation and the increased turnover of epithelial cells contribute to the development of low-grade and high-grade dysplasia, which may further transform into CAC.1–3 Inflammatory bowel disease (IBD), a key factor in CAC-extrinsic inflammation, which can result in immunosuppression, thereby providing a preferred background for CAC development.4 Myeloid-derived suppressor cells (MDSCs) and M2 macrophages are the two main cell populations with immunosuppressive function infiltrating inflammatory colorectal tissue.2 MDSCs are a heterogeneous population of immature myeloid cells hallmarked by their potent immunosuppressive function in a vast array of pathological conditions. In IBD or CAC patients, MDSCs massively infiltrate the inflamed intestinal tissue or tumor microenvironment. MDSCs facilitate CAC progression by promoting chronic inflammation, promoting blood vessel formation, constructing immunosuppressive tumor microenvironment, and promoting the stemness of colon cancer cell.2 5–7 MDSCs are mainly divided into granulocytic MDSCs (G-MDSCs) and monocytic MDSCs (M-MDSCs).8 M2 macrophages are induced by IL-4 and IL-13 to express arginase 1 (Arg-1), and IL-10.9 STAT6 is crucial for enhancing the expression of M2-associated genes.10
M2 macrophages and MDSCs were once thought to be beneficial for controlling IBD-related inflammation due to their immunosuppressive properties. In models of autoimmune colitis elicited by CD8+ T cells or dextran sulfate sodium (DSS), the transfer of MDSC suppressed development of disease.11 These results suggest that initial expansion of suppressive MDSCs may function to restrain excessive Th1 responses. M2 macrophages could promote tissue repair and inflammation resolution to reduce IBD symptoms.12 Promotion of M2 macrophage polarization was also once considered a strategy to treat IBD. However, therapeutic strategies for IBD based on MDSCs and M2 macrophages have not achieved the desired effect. One reason is that this immunosuppressive effect is not sufficient to control autoimmune and microorganism-driven robust inflammatory responses. Another key reason is that the phenotype and function of these myeloid cells are altered due to complex inflammatory microenvironment and crosstalk between each other. Chronic colonic G-MDSCs acquire antigen-presenting functions and induce T cell activation and IL-17 production.13 Adoptively transferred CD11b+Ly6Chi cells are converted into proinflammatory cells and promote intestinal inflammation.14 15 Human G-MDSCs from the peripheral blood of patients with IBD not only fail to suppress the autologous T cell response but also enhance T cell proliferation.16 Therefore, the inflammatory response is not effectively controlled due to the persistence of autoimmune responses and micro-organisms, and instead translates into chronic inflammation. Conversely, these functionally diverse immunosuppressive cells recruited by inflammation provide a favorable immunosuppressive microenvironment, thereby providing a preferred background for the upcoming tumor development.
In this study, we attempted to uncover the crosstalk and the underlying mechanism between MDSCs and M2 macrophages based on exosomes-mediated intercellular communication. These works provide a linkage mechanism between inflammation and cancer development.
Results
Profiles of MDSC subgroups and M2 macrophage in colorectal tissues during CAC induction
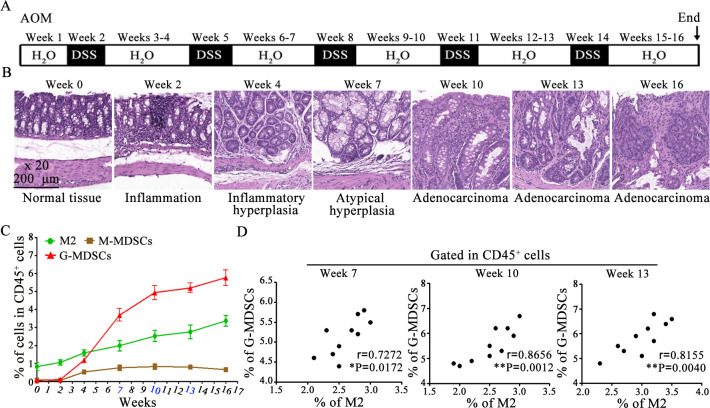
MDSCs and M2 macrophages are abundantly infiltrated in inflammatory or cancerous colorectal tissues. Although it has been reported that M-MDSCs infiltrating into tumor tissues can rapidly differentiate into tumor-associated macrophages (TAMs),17–19 the relationship between MDSCs and M2 macrophages remains unclear in an inflammatory environment. CAC mice were induced with AOM/DSS and the percentages of MDSC subgroups or M2 macrophage was analyzed by FACS. CAC mice underwent the process of sequence evolution such as inflammation, inflammatory hyperplasia, atypical hyperplasia, and adenocarcinoma (figure 1A,B). Tissue-infiltrating G-MDSCs and M2 macrophages continued to increase, while M-MDSCs remained low (figure 1C). Next, the correlation between G-MDSCs and M2 macrophages at weeks 10, 13 and 16 was analyzed. The percentage of G-MDSCs was positively correlated with the percentage of M2 macrophages (figure 1D). These results suggest that G-MDSCs may involve in M2 macrophage accumulation in colorectal tissues starting from the chronic inflammatory stage.
Figure 1.
MDSC subgroups and M2 macrophage profiling in colorectal tissues. (A) Schematic of CAC mice induction. (B) Representative H&E-stained sections of colorectal tissues at different times. (C) Percentages of MDSC subgroups and M2 macrophage in colorectal tissue. (D) The correlation between G-MDSCs and M2 macrophages was determined by the Pearson’s correlation test (n=10). Data are representative of three independent experiments and are presented as mean±SEM. CAC, colitis-associated cancer; G-MDSCs, colitis-associated cancers; MDSC, myeloid-derived suppressor cell. AOM, azoxymethane. (*p<0.05, **p<0.01, one-way ANOVA test; error bars, SD).
G-MDSCs promote the differentiation of M-MDSC into M2 macrophages
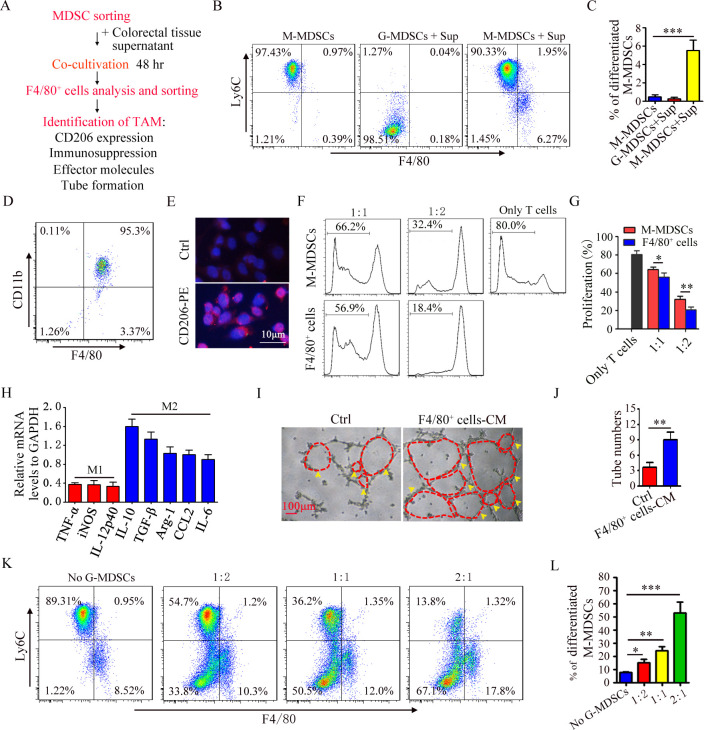
Given the positive correlation between G-MDSCs and M2 macrophages and the fact that M-MDSC differentiates into M2 macrophages in the tumor microenvironment,18 we investigated the role of G-MDSCs in the differentiation of M-MDSC into M2 macrophages. The working flow chart is depicted in figure 2A. Splenic G-MDSCs and M-MDSCs were sorted from IBD mice. High-purity G-MDSCs and M-MDSCs were obtained (online supplemental figure S1A,B). We first analyzed the effect of colorectal tissue supernatant (Sup) on the differentiation of M-MDSC or G-MDSC into M2 macrophages. M-MDSCs could differentiate into F4/80+Ly6Clow cells, but G-MDSCs could not (figure 2B,C). We furtherly analyzed the phenotype and function of F4/80+Ly6Clow cells. F4/80+Ly6Clow cells were sorted using immunomagnetic beads and high-purity F4/80+ cells were sorted (figure 2D). We examined the surface membrane molecule, immunosuppressive function, cytokine profile, and their ability to promote angiogenesis. These cells highly expressed CD206 (figure 2E) and suppressed CD4+ T cell proliferation (figure 2F,G). The cytokine-associated genes, including IL-10, TGF-β, Arg-1, CCL2, and IL-6, were upregulated (figure 2H). The culture medium from F4/80+ cells significantly increased number of luminal formation (figure 2I,J). Therefore, these results suggest that M-MDSC differentiate into M2 macrophage. G-MDSCs and M-MDSCs were co-cultured in the presence of Sup. As shown in figure 2K, G-MDSCs promoted the differentiation of M-MDSC into M2 macrophages (figure 2K,L). Therefore, G-MDSCs could promote the differentiation of M-MDSC into M2 macrophages.
Figure 2.
G-MDSCs pomote the differentiation of M-MDSC into M2 macrophages. (A) Flow chart of inducing M-MDSCs to differentiate into M2 macrophages. (B) FACS analysis of the percentage of CD11b+Ly6Chi cell and CD11b+Ly6Clow cell. (C) Summary graphs of the percentage of differentiated M-MDSCs (F4/80+Ly6Clow cells) to total M-MDSCs. (D) FACS analysis of sorted CD11b+F4/80+ cells. (E) Immunofluorescence analysis of CD206 in CD11b+F4/80+ cells. (F) T cell proliferation was detected using FACS. (G) Summary graphs of the percentage of proliferating T cells (n=3). (H) mRNA expression of cytokines in CD11b+F4/80+ cells was analyzed by qRT-PCR (n=3). (I) Representative results of tube formation (n=3). (J) Summary graphs of tube number (n=3). (K) The percentage of F4/80+Ly6Clow cell were detected by FACS (n=3). (L) Summary graphs of the percentage of differentiated M-MDSC to total M-MDSC (n=3). Statistical analyses were performed using unpaired t-tests. G-MDSCs, colitis-associated cancers; MDSC, myeloid-derived suppressor cell; M-MDSCs, monocytic MDSCs. (*p<0.05, **p<0.01, ***p<0.001,one-way ANOVA test; error bars, SD).
jitc-2022-006166supp001.pdf (261.7KB, pdf)
G-MDSCs promote the differentiation of M-MDSC into M2 macrophages via exosome secretion
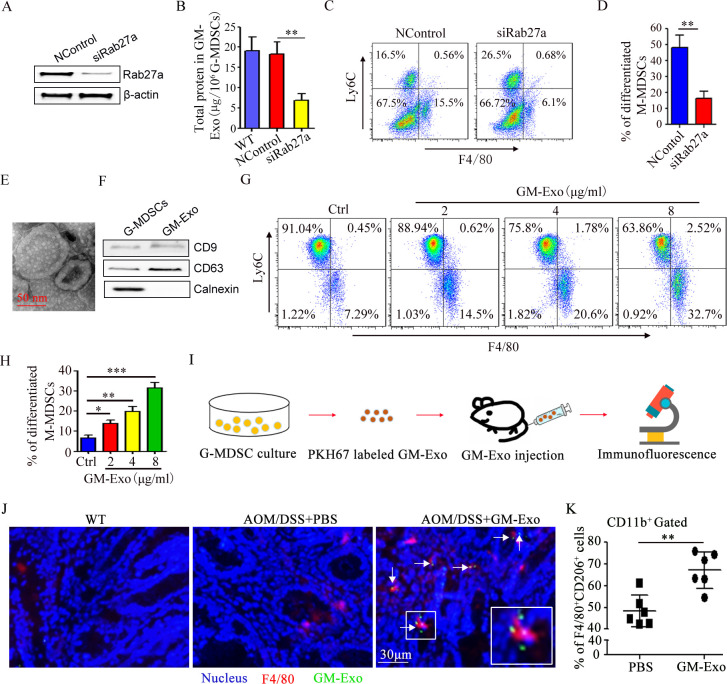
Exosomes have been proposed to act as intercellular communicators via cargo.20 Our previous work also found that G-MDSCs promote CRC cell stemness by exosomes (GM-Exo).6 To observe the role of GM-Exo in promoting the differentiation of M-MDSC into M2 macrophages, Rab27a was knocked down in G-MDSCs with siRab27a as our previous report.6 The expression of Rab27a was effectively reduced (figure 3A), and exosomes secretion was obviously inhibited (figure 3B). SiRab27a-treated G-MDSCs were co-cultured with M-MDSCs. The proportion of M-MDSC that differentiated into M2 macrophages was analyzed. The ability of G-MDSCs to promote the differentiation of M-MDSC into M2 macrophages decreased when exosome secretion was inhibited (figure 3C,D). We also investigate the direct effect of GM-Exo on the differentiation of M-MDSC into M2 macrophages. GM-Exo was prepared and identified according to our previous method.6 GM-Exo displayed closed round vesicles with diameters of ~100 nm (figure 3E). GM-Exo expressed CD63 and CD9, which are characteristic exosomes molecules. In contrast, calnexin was not detected in the purified GM-Exo preparations (figure 3F). GM-Exo were used to treat M-MDSCs in the presence of Sup. GM-Exo promoted the differentiation of M-MDSC into M2 macrophages in a dose-dependent manner (figure 3G,H). Nextly, we investigated the effect of GM-Exo on M2 macrophage accumulation in vivo (figure 3I). CAC mice were injected with PKH67-labeled GM-Exo. Colorectal tissue was isolated, and F4/80 expression and GM-Exo localization were analyzed. GM-Exo localized in colorectal tissue and promoted the expression of F4/80 (figure 3J). Moreover, GM-Exo increased the infiltration of F4/80+CD206+ cell in colorectal tissue (figure 3K). These data confirm that GM-Exo promotes the differentiation of M-MDSC into M2 macrophages.
Figure 3.
G-MDSCs promote the differentiation of M-MDSC into M2 macrophages via exosome. (A) Total protein in GM-Exo (n=3). (B) The percentage of F4/80+Ly6Clow cell were detected by FACS (n=3). (C) Summary graphs of the percentage of differentiated M-MDSCs to total M-MDSCs (n=3). (D) Representative micrograph of GM-Exo. (E) The percentage of F4/80+Ly6Clow cell were detected by FACS (n=3). (F) Summary graphs of the percentage of differentiated M-MDSCs to total M-MDSCs (n=3). (G) Flow chart of GM-Exo-induced differentiation of M-MDSC into M2 macrophages in vivo. (H) Immunofluorescence for detecting F4/80 and GM-Exo. Images were representative of six random fields. (I) Summary graphs of the percentage of F4/80+CD206+ cells in colorectal tissues (n=6). Statistical analyses were performed using unpaired t-tests. G-MDSCs, granulocytic myeloid-derived suppressor cells; M-MDSCs, monocytic MDSCs. (*p<0.05, **p<0.01, ***p<0.001, one-way ANOVA test or unpaired t test; error bars, SD).
GM-Exo promotes the differentiation of M-MDSC into M2 macrophages through downregulating STAT3 activity
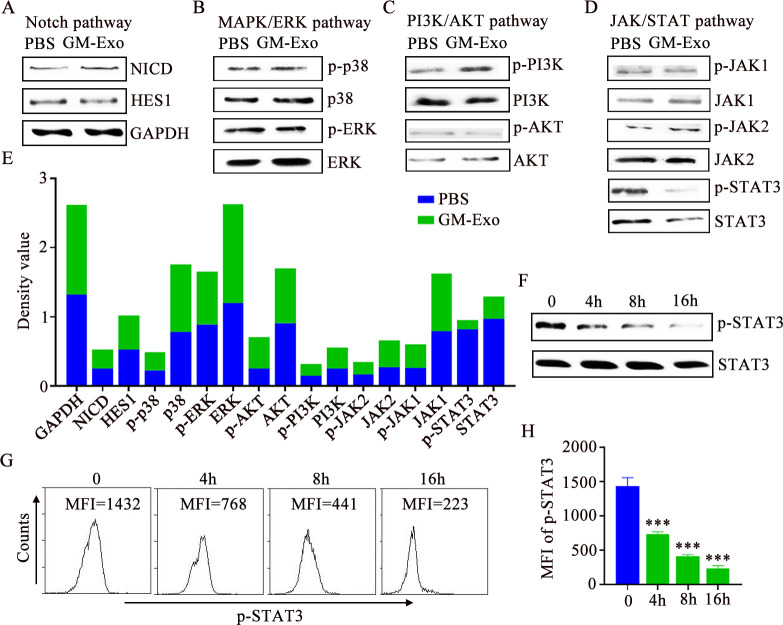
To explore the mechanism by which GM-Exo promotes the differentiation of M-MDSC into M2 macrophages, we observed changes in major signaling pathways in M-MDSCs after GM-Exo treatment. There are no significant changes in Notch pathway and MAPK pathway (figure 4A,B). There is an upregulation of p-PI3K in the PI3K/AKT pathway (figure 4C). Notably, GM-Exo significantly downregulated the levels of p-STAT3 and STAT3, although there is no significant change of its upstream molecular, including JAK1 and JAK2 (figure 4D,E). These results suggest that GM-Exo may promote the differentiation of M-MDSC into M2 macrophages by downregulating STAT3 activity. In fact, STAT3 has a unique function in controlling the differentiation of MDSC into M2 macrophages.18 21 22 Kumar et al found that CD45 tyrosine phosphatase activity promoted the differentiation of M-MDSC into M2 macrophages through inhibiting STAT3 activity.18 We further validated the effect of GM-Exo on p-STAT3 level. The results showed that p-STAT3 levels gradually decreased over time after GM-Exo treatment (figure 4F–H). Therefore, STAT3 inhibition is the key reason for GM-Exo-mediated differentiation of M-MDSC into M2 macrophages.
Figure 4.
GM-Exo downregulate the STAT3 activity in M-MDSC. (A–D) Signaling proteins were analyzed by IB analysis (n=3). (E) Optical density values of proteins. (F) IB analysis of p-STAT3 and STAT3 in M-MDSCs (n=3). (G) Representative result of p-STAT3 MFI value in M-MDSC (n=3). (H) Summary graphs of p-STAT3 MFI values (n=3). tatistical analyses were performed using unpaired t-tests. M-MDSCs, monocytic myeloid-derived suppressor cells. (***p<0.001, one-way ANOVA test; error bars, SD). MFI, mean fluorescence intensity; PBS, phosphate buffer saline; GAPDH, glyceraldehyde-3-phosphate dehydrogenase
GM-Exo downregulates STAT3 activity in M-MDSCs via miR-93-5p
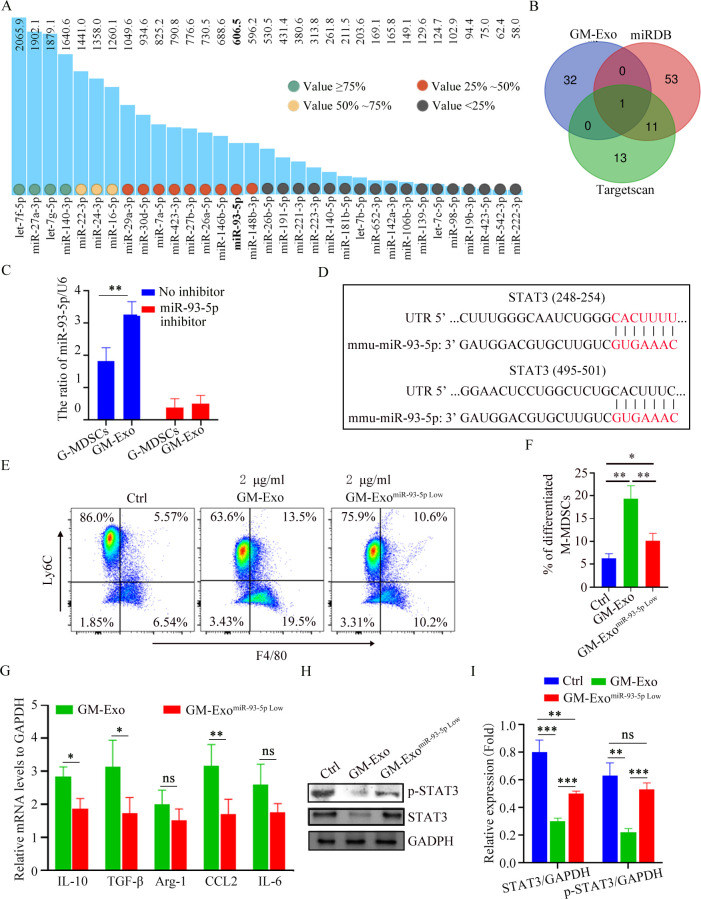
Exosomal miRNAs play critical role in regulating cell biology.23 Based on the fact that GM-Exo down-regulates the level of STAT3 in M-MDSCs without affecting the upstream molecule JAKs, we speculated that GM-Exo-loaded miRNAs might directly play a role in regulating the differentiation of M-MDSC into M2 macrophages. We analyzed the sequencing results of miRNAs in GM-Exo based on our previous report.24 MiRNAs with expression value greater than 50 were nominated as candidates (figure 5A). TargetScan and miRDB were used for miRNA target prediction and functional annotations. MiR-93–5 p was screened as the only candidate miRNA that may potentially be involved in regulating STAT3 (figure 5B,D). Both G-MDSCs and GM-Exo highly expressed miR-93–5 p (figure 5C). We prepared GM-Exo with low miR-93–5 p expression (GM-ExomiR-93-5p) by transfecting miR-93–5 p inhibitor into G-MDSCs and treated M-MDSCs (figure 5C). The result showed that miR-93–5 p downregulation significantly inhibited GM-Exo-mediated differentiation of M-MDSC into M2 macrophages (figure 5E,F). Consistently, downregulation of miR-93–5 p significantly inhibited GM-Exo-mediated upregulation of IL-10, TGF-β, Arg-1, CCL2, and IL-6 in M-MDSCs (figure 5G). Therefore, GM-Exo promotes the differentiation of M-MDSC into M2 macrophages via miR-93–5 p. We further investigated the effect of miR-93–5 p on p-STAT3 and STAT3 expression in M-MDSCs. Results showed that downregulating miR-93–5 p restored GM-Exo-mediated suppression of p-STAT3 in M-MDSCs (figure 5H,I). Therefore, GM-Exo promotes the differentiation of M-MDSC into M2 macrophages through miR-93–5 p cargo-mediated STAT3 inhibition.
Figure 5.
GM-Exo downregulate the STAT3 activity in M-MDSCs via miR-93–5 p. (A) MiRNAs with expression value are greater than 50 in GM-Exo. (B) Venn diagram of predicted miRNA by Targetscan and miRDB databases. (C) The relative expression of miR-93–5 p was analyzed using qRT-PCR (n=3). (D) Binding sites between the STAT3 3’ UTR and miR-93–5 p were identified by Targetscan. (E) M-MDSCs were cultured for 72 hours in the presence of Sup and GM-Exo. The percentage of F4/80+Ly6Clow cell were detected by FACS (n=3). (F) Summary graphs of the percentage of differentiated M-MDSCs to total M-MDSCs (n=3). (G) mRNA expression of cytokines in M-MDSCs was analyzed by qRT-PCR (n=3). (H) IB analysis of p-STAT3 and STAT3 levels in exosomes-treated M-MDSC for 48 hours. (I) Summary graphs of relative expression of p-STAT3 and STAT3 in exosomes-treated M-MDSCs (n=3). Statistical analyses were performed using unpaired t-tests. M-MDSCs, monocytic myeloid-derived suppressor cells. (*p<0.05, **p<0.01, ***p<0.001, ns, not significant, one-way ANOVA test or unpaired t test; error bars, SD).
IL-6 promotes miR-93-5p loading in GM-Exo by activating STAT3 in G-MDSCs
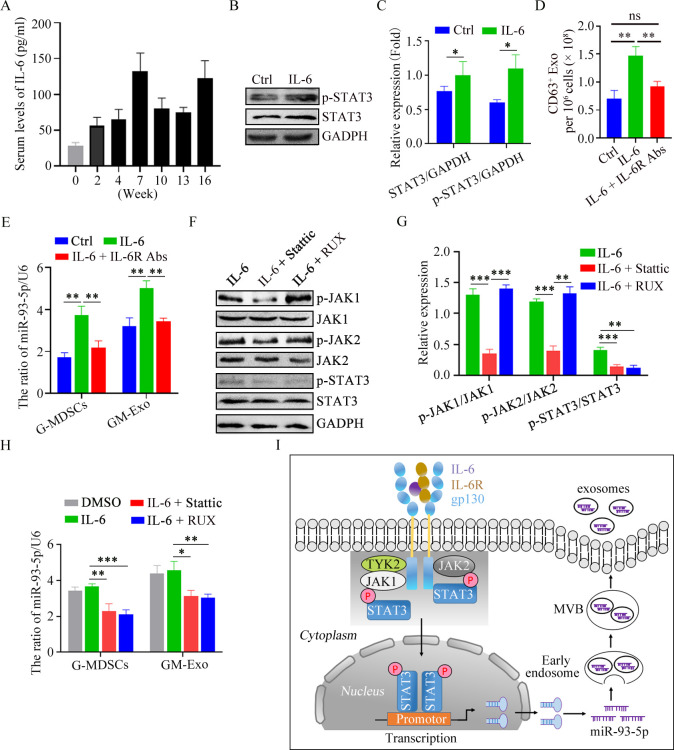
The inflammatory microenvironment is responsible for immune cell phenotype and function in IBD patients.8 25 We further explored the reason for the enrichment of mi-R-93–5 p in GM-Exo based on elevated inflammatory molecules, including IL-6, IL-1β, IFN-γ, IL-17, GM-CSF, LPS, TNF-α, IL-23, etc. Splenic G-MDSCs from mice at the second week of modeling were treated with these molecules. The results showed that IL-6 treatment could significantly increase the content of mi-R-93–5 p in G-MDSCs (online supplemental figure S2). To further clarify the time point at which IL-6 promotes the production of exosomal miR-93–5 p in vivo, the concentration of IL-6 in serum was detected in the process of sequence evolution. The results showed that the level of IL-6 at various stages of CAC induction was higher than that of normal mice, especially at weeks 7 and 16 (figure 6A). IL-6 is a strong activator of STAT3, causing the activation and translocation of STAT3 signaling,26 which drives MDSC expansion.27 We observed the effect of IL-6 on STAT3 activity in G-MDSCs. The results showed that p-STAT3 level was significantly increased in IL-6-treated splenic G-MDSCs (figure 6B,C). The ability of IL-6 in GM-Exo secretion was also evaluated. IL-6 enhanced the ability of G-MDSC to secrete exosomes, and this effect was inhibited by anti-IL-6R antibody (figure 6D). These results suggest that IL-6 promotes the secretion of GM-Exo through IL-6R. We further investigated the effect of IL-6 on the expression of miR-93–5 p in G-MDSCs and GM-Exo. The results showed that both G-MDSCs and GM-Exo highly expressed miR-93–5 p after IL-6 treatment (figure 6E), and this effect was also inhibited by anti-IL-6R mAb (figure 6E). These results suggest that IL-6 promotes miR-93–5 p loading in GM-Exo.
Figure 6.
IL-6 promotes GM-Exo miR-93–5 p production in a JAK/STAT3-dependent manner. (A) IL-6 levels were detected by ELISA (n=6). (B) IB analysis of p-STAT3 and STAT3 in G-MDSC. (C) Summary graphs of p-STAT3 and STAT3 in G-MDSC (n=3). (D) Exosomes from G-MDSCs were quantified (n=3). (E) The relative expression of miR-93–5 p in G-MDSCs and GM-Exo was analyzed using qRT-PCR (n=3). (F) IB analysis of proteins in G-MDSCs. (G) Summary graphs of proteins (n=3). (H) The relative expression of miR-93–5 p was analyzed using qRT-PCR (n=3). (I) Schematic diagram of IL-6-mediated G-MDSC exosomal miR-93–5 p production in a JAK/STAT3-dependent manner. Statistical analyses were performed using unpaired t-tests. G-MDSCs, granulocytic myeloid-derived suppressor cells (*p<0.05, **p<0.01, ***p<0.001, ns, not significant, one-way ANOVA test or unpaired t test; error bars, SD).
We explored the reason why IL-6 promoted miR-93–5 p production. Based on the fact that the JAK/STAT pathway is the major downstream signal of IL-6R, we evaluated the role of this pathway in miR-93–5 p synthesis in G-MDSCs and loading in GM-Exo. Ruxolitinib is a selective inhibitor of JAK1/2. Stattic is a STAT3 inhibitor that inhibits STAT3 phosphorylation at Y705 and S727 sites. Ruxolitinib and Stattic could reduce the levels of p-JAK1/p-JAK2 and p-STAT3 in IL-6-treated G-MDSCs, respectively, (figure 6F,G). Consistently, both Ruxolitinib and Stattic could inhibit IL-6-mediated upregulation of miR-93–5 p in G-MDSC and GM-Exo (figure 6H). Therefore, IL-6 promotes miR-93–5 p synthesis in G-MDSCs by activating the JAK/STAT3 pathway via Il-6R and increases the abundance of miR-93–5 p in GM-Exo (figure 6I).
Early application of anti-IL-6 Abs enhances the effect of STAT3 inhibitor against CAC
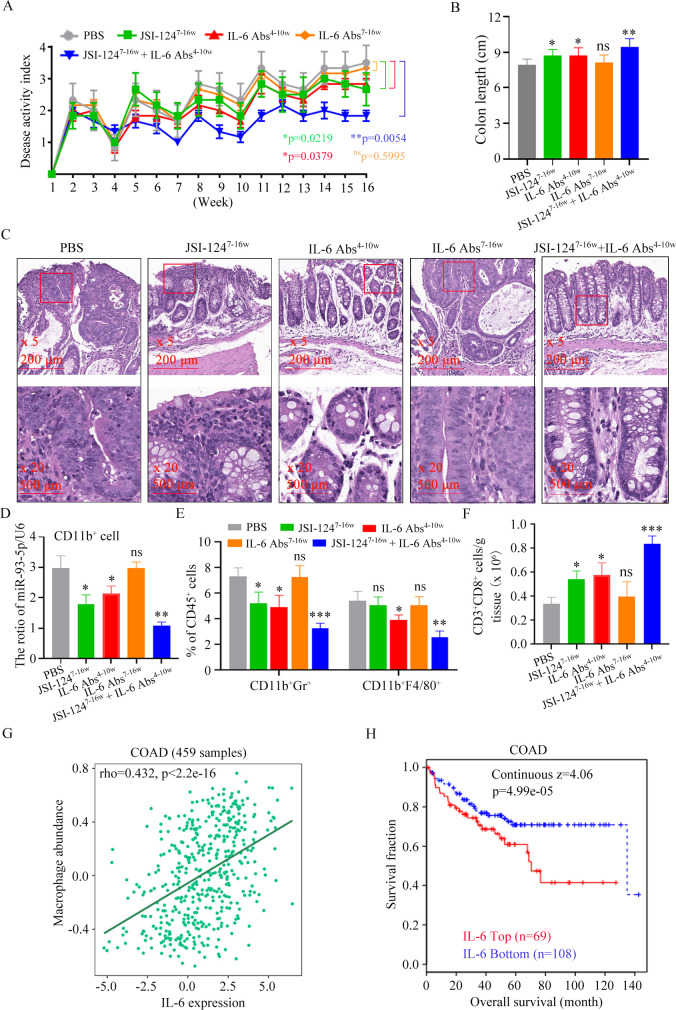
Targeting STAT3 signaling has emerged as a promising therapeutic strategy for numerous cancers.28 29 JSI-124, a STAT3 inhibitor, inhibits the proliferation of CRC cell.18 As described above, at week 7 of CAC induction, IL-6 level (figure 6A), G-MDSCs and M2 macrophages infiltrating colorectal were increased (figure 1C). IL-6R signaling is closely associated with risk factors for colon adenocarcinoma (COAD)(online supplemental figure S3). Therefore, as early as the inflammatory stage, IL-6 may promote the secretion of exosomal miR-93–5 p, which mediates the differentiation of M-MDSC into M2 macrophages, thereby providing a preferred immunosuppressive microenvironment for the upcoming CAC. We attempted to inhibit CAC occurrence by early application of anti-IL-6 Abs in combination with JSI-124. The Disease Activity Index (DAI) scores of mice treated with IL-6 Abs alone from week 4 to week 10 or JSI-124 alone were lower than those in the PBS-treated group (figure 7A). The overlay of these two regimens significantly decreased the DAI (figure 7A). These results suggest that blocking the action of IL-6 in the inflammatory stage and inhibiting STAT3 signaling in the dysplasia stage are more beneficial to inhibit CAC progression. This conclusion was also confirmed by colon length changes (figure 7B) and pathological changes (figure 7C). Therefore, IL-6, which is elevated during the inflammatory phase, has a critical role in the development of CAC.
Figure 7.
Early application of anti-IL-6 Abs sensitizes CAC to STAT3 inhibitor. (A) Changes in DAI during AOM/DSS treatment (n=6). (B) Length of the colon (n=6). (C) Representative images of histological sections (n=6). (D) The relative expression of miR-93–5 p was analyzed using qRT-PCR. (n=6). (E) Percentage of CD11b+Gr-1+ cells or CD11b+F4/80+ cells in CD45+ cells (n=6). (F) Quantification of CD3+CD8+ cell (n=6). (G) The correlation between macrophage and IL-6 in COAD patients was determined by the Pearson’ s correlation test. (H) Analysis of the relationship between IL-6 and overall survival in COAD patients using TIDE database. Statistical analyses were performed using two-way ANOVA for DAI comparison and multiple unpaired t-tests for the remaining data.(*p<0.05, **p<0.01, ***p<0.001, ns, not significant).CAC, colitis-associated cancer; DAI, Disease Activity Index; DSS, dextran sulfate sodium; COAD, colon adenocarcinoma; AOM, azoxymethane.
We examined the role of each regimen on miR-93–5 p expression in CD11b+ cells from colorectal tissue. The miR-93–5 p expression in mice treated with IL-6 Abs alone from week 4 to week 10 or JSI-124 alone were lower than those in the PBS-treated group (figure 7D). The overlay of these two regimens significantly decreased miR-93–5 p expression (figure 7D). These results suggest that elevated IL-6 during early inflammatory stages mediates the high expression of miR-93–5 p in CD11b+ cells. Early application of IL-6 Abs could reduce the infiltration of MDSCs and M2 macrophages in tumor tissue (figure 7E), which supported the specific role of IL-6 in early myeloid cell infiltration and crosstalk. Combined application of IL-6 Abs and JSI-124 significantly reduced myeloid cells in tumor site (figure 7E), which supported the specific nature of JSI-124’ s effect on STAT3 which plays a key role in myeloid cell expansion. IL-6 Abs and JSI-124-mediated reduction of myeloid cells and improvement of the immunosuppressive tumor microenvironment were also demonstrated by tumor-infiltrating CD8+ T cell analysis (figure 7F). We also found that IL-6 level was positively correlated with macrophage infiltration (figure 7G), and the survival rate of CRC patients with high serum IL-6 was significantly decreased using online database (figure 7H). Therefore, IL-6-mediated high expression of miR-93–5 p during inflammation promotes infiltration of myeloid cells and crosstalk, which plays a key role in the occurrence of CAC. The combined early application of IL-6 Abs and JSI-124 could significantly inhibit the progression of CAC.
Discussion
Myeloid cells are important players and coordinators in the process of inflammation to cancer transformation.30 31 Here, we show that G-MDSCs promote the differentiation of M-MDSC into M2 macrophages through exosomal miR-93–5 p promoting colitis-to-cancer transition. During the chronic intestinal inflammation phase, elevated IL-6 upregulates STAT3 activity in G-MDSC through IL-6R/JAK/STAT3 pathway, which increases the miR-93–5 p transcription and subsequent enrichment in GM-Exo. Exosomal miR-93–5 p promotes the differentiation of M-MDSC into M2 macrophages through inhibiting the activity of STAT3 in M-MDSCs. Our studies, therefore, reveal the critical role of exosomes-mediated crosstalk between myeloid cells in inflammatory-cancer transformation.
Chronic colonic disorders promote MDSC recruitment and activation.2 We showed that IL-6 level was significantly increased during the chronic intestinal inflammation phase. IL-6 upregulate STAT3 activity through IL-6R/JAK/STAT3 pathway, which increases the miR-93–5 p transcription in G-MDSCs and the enrichment of miR-93–5 p in GM-Exo. STAT3 is one of the major drivers of MDSC expansion and involved MDSC-mediated immune suppression. Activated STAT3 regulates the expression of various effector molecules, which is crucial for the proliferation and activation of MDSCs. STAT3-mediated biological responses play complex roles in the phenotype and function of myeloid cells due to the different environments in which myeloid cells are located.32 In this study, we found G-MDSC exosomal miR-93–5 p inhibited STAT3 activity in M-MDSCs and promoted the differentiation of M-MDSC to M2 macrophages. Studies have demonstrated that downregulation of p-STAT3 is the main reason for the differentiation of tumor tissue infiltrating M-MDSC into TAMs.18 21 22 Our results are consistent with these conclusions, although the M-MDSCs in our study were in a chronic inflammatory microenvironment. M2 macrophages differentiated from M-MDSCs in our study have a similar phenotype and function to TAMs. We identified miR-93–5 p as the only miRNA in GM-Exo targeting STAT3. Zhu and colleagues reported that miR-93–5 p suppressed Th17 differentiation by targeting STAT3.24 G-MDSC exosomal miR-93–5 p is likely to be involved in the regulating the differentiation of M-MDSC into M2 macrophages in colitis, explaining why colorectal tissue-infiltrating M2 macrophages continued to increase, while M-MDSCs remained at lower levels during the stage of intestinal inflammation. Of course, it is well known that GM-Exo carry multiple active components, such as other non-coding RNA, proteins and lipids. Whether those components are involved in the regulation of immune response and colitis-to-cancer transition need further study.
It is also clear that elevated STAT3 activity accelerates tumor initiation and progression after dysplasia by promoting the abnormal proliferation of intestinal epithelial cells and tumor cells. Therefore, inhibition of IL-6-mediated G-MDSC exosomal miR-93–5 p secretion during the inflammatory stage is beneficial to inhibit M2 macrophage accumulation and inflammatory-cancer transformation. Moreover, choosing the right time to use STAT3 inhibitor is crucial for delaying the occurrence and progression of CAC. Anti-IL-6 Abs not only inhibited the antitumor immunosuppression mediated by massive expansion of G-MDSCs but also inhibited the differentiation of M-MDSC to M2 macrophages mediated by exosomal miR-93–5 p. This provided us with the opportunity to inhibit G-MDSC and M2 macrophages expansion before the tumorigenesis. Experiments in vivo further support this mechanism. Combined administration of Anti-IL-6 Abs and STAT3 inhibitor had more profound antitumor effect.
Conclusions
Collectively, these data indicate that IL-6 leads to more miR-93–5 p synthesis in G-MDSCs and exosomal miR-93–5 p release during the inflammation stage. Exosomal miR-93–5 p promotes M-MDSC differentiation into M2 macrophage through inhibiting STAT3, which accelerates colitis-to-cancer transition. Our results highlight G-MDSC-specific function in the regulation of the differentiation of M-MDSC into M2 macrophages (online supplemental figure S4). These findings suggest that combining STAT3 inhibitors with strategies that inhibit G-MDSC exosomal miR-93–5 p production is beneficial for the prevention and treatment of CAC.
Methods
Cell lines and mice
Human umbilical vein endothelial cell (HUVEC) cells were purchased from the American Type Culture Collection. Mice were from the Animal Research Center of Yangzhou University.
Induction of CAC, scoring of the DAI, and treatment
Female BALB/c mice were given a single intraperitoneal injection of AOM (10 mg kg−1 body weight). 1 week later, the animals received 2% DSS in their drinking water for 7 days and then no treatment for 14 days. A cycle is 21 days. The mice were exposed to five cycles.
To observe the distribution of GM-Exo in colorectal tissue, GM-Exo was labeled with PKH67 and injected as we previously described.6 Colorectal tissues were isolated after 24 hours. Tissue cryosections were stained with F4/80 Abs. To observe the role of JSI-124 and IL-6 Abs in CAC progression, mice were divided into five groups. In JSI-1247-16w group, mice were treated i.p. with JSI-124 (1 mg/kg/3 days) from week 7 to week 16. In IL-6 Abs4-10w group, mice were treated i.p. with IL-6 Abs (5 mg/kg/3 days) from week 4 to the week 10. In JSI-1247-16w+IL-6 Abs4-10w group, mice were treated with JSI-124 and IL-6 Abs. The DAI was assessed as previously described.33
Preparation of colorectal tissue supernatant and single-cell suspension
On the seventh week of CAC induction, colorectal was isolated and soaked in penicillin (100 U/mL) and streptomycin (0.1 mg/mL) for 15 min, and then washed with PBS. Tissue was cut into tissue pieces and grinded. The liquid was resuspended in PBS and centrifuged at 500 g for 5 min (Float is sucked out), 1000 g for 30 min, and 100 000 g for 16 hours. The supernatant was filtered through a 0.22 µm filter. The filtrate is the colorectal tissue supernatant (Sup). Sup is quantified based on protein concentration and was diluted to 2 mg/mL. Colorectal single-cell suspension was prepared as we previously described.6
MDSC isolation
Splenic or colorectal G-MDSCs and M-MDSCs were isolated from spleen cell suspension or colorectal single-cell suspensions using a mouse MDSC isolation kit according to the manufacturer’ s instructions as our previous report.6 34
Small interfering RNA treatment
MDSCs were plated in 24-well plate and then transfected with Rab27a siRNA or their negative controls following the manufacturer’ s protocols. The Rab27a siRNA oligonucleotides are shown below:Sense primer, 5’-GGAGAGGUUUCGUAGCUUAUU-3’, Antisense primer, 5’-UAAGCUACGAAACCUCUCCUU-3’.
Study on the expression and regulation of miR-93-5p in G-MDSC in vitro
G-MDSCs (2×10⁶/well) were seeded in 24-well plates in the present of GM-CSF (1 ng/mL) and Sup (2 µg/mL). Additional IL-6 (5 ng/mL), IL-1β (5 ng/mL), IFN-γ (5 ng/mL), IL-17 (5 ng/mL), GM-CSF (5 ng/mL), LPS (5 ng/mL), TNF-α (5 ng/mL), and IL-23 (5 ng/mL) were added in each group, respectively. After 48 hours incubation, cells were collected. Total RNA was extracted and the levels of miR-93–5 p were detected by qRT-PCR.
GM-Exo purification and characterization
GM-Exo were isolated from G-MDSC culture supernatant as our previous report.6 Morphology was observed by transmission electron microscopy. Exosomes particles were quantified with an ExoELISA complete kit (CD63 detection). For the purification of GM-ExomiR-93-5p Low, we transfected miR-93–5 p inhibitor into G-MDSCs. After 24 hours, the culture supernatant was collected and exosomes were isolated.
Exosomes were labeled using PKH67 and detected as our previous report.6 A 30 µg exosomes was injected via tail vein. After 24 hours, the distribution of exosomes in colorectal tissues was observed by immunofluorescence.6
Differentiation of M-MDSC into M2 macrophages
M-MDSCs (1.5×10⁶/well) were cultured in 24-well plate in the present of GM-CSF (1 ng/mL) and Sup (2 µg/mL). After 48 hours, the percentages of Ly6C+F4/80 cells (M-MDSCs) and Ly6Clow F4/80+ cells (macrophages) were detected by FCM. Calculate the percentage of M-MDSC differentiated to macrophages to total M-MDSCs. That is, Ly6ClowF4/80+ cells/(Ly6ClowF4/80+ cells + Ly6C+F4/80 cells). F4/80+ cells were sorted by immunomagnetic beads. F4/80+ cell phenotype and function were identified.
Flow cytometry analysis
3×10⁶ cells were resuspended in PBS. Fluorescent-conjugated antibody was added and incubated. Cells were analyzed by FCM. Murine MDSCs, CD11b+Gr-1+; murine G-MDSCs, CD11b+Ly6G+Ly6Clow/-; murine M-MDSCs,CD11b+Ly6G-Ly6C+; macrophages, CD11b+CD68+F4/80+; M2 macrophages, CD11b+CD206+F4/80+; Differentiated M2 macrophages, CD11b+F4/80+Ly6Clow.; Cytotoxic T lymphocytes, CD3+CD8+.
H&E staining
Mouse colorectal tissue was fixed with 4% paraform aldehyde, dehydrated with ethanol, waxdip, and embed. Paraffin slices were prepared and stained with H&E. The tissues were examined using microscope.
Immunofluorescence
For the analysis of CD206, F4/80+ cells were seeded on glass slides and cultured for 24 hours. For the analysis of CDF4/80+ cell infiltrating in colorectal tissue, paraffin sections were dewaxed, soaked, and retrieved antigens. The slides were fixed with 4% paraformaldehyde and blocked. The diluted primary antibody was added and incubated at 4°C overnight. The fluorescein-conjugated secondary antibody was added. DAPI was added. Images were observed with a fluorescence microscope.
HUVEC tube-formation assay
HUVEC were cultured for 48 hours in the present of 50 µl F4/80+ cell-CM (culture medium) and imaged using a microscope.
Analyzing T cell proliferation through CFSE dilution assay
CD4+ T cells were isolated from the splenocytes of wild-type mice as our previously described.6 CD4+ T cells were stained with 5 µM CFSE. CFSE-labeled CD4+ T cells were co-cultured with M-MDSCs or F4/80+ cells for 5 days in the present of anti-CD3 (1 µg/mL) and anti-CD28 (1 µg/mL) mAbs. Cells were analyzed using FCM.
Selection of candidate miRNAs targeting STAT3
Online databases TargetScan (http://www.targetscan.org/vert_80/) and miRDB (http://www.mirdb.org/cgi-bin/) were used for miRNA target prediction. Online tool (http://bioinformatics.psb.ugent.be/webtools/Venn/) is used to screen candidate miRNAs and draw Venn diagram.
Determination of associations of IL-6 signaling with prognosis and risk factors in COAD
The correlations between IL-6 or IL-6R expression and macrophage abundance in COAD (colon adenocarcinoma) was predicted with TIDE database. The correlation between IL-6 and overall survival in COAD was predicted with TISIDB database. The correlations between IL-6R expression and risk factors for COAD were predicted with TISIDB database.
Immunoblotting
The protein was separated by SDS-PAGE and transferred to PVDF membranes. PVDF membranes were blocked, and incubated with the primary antibodies and then secondary antibodies. The membranes were examined by ChemiDoc imaging system.
ELISA
The levels of various cytokines were measured using commercial ELISA kits. For the detection of IL-6 in mouse serum, tail blood was collected and centrifuged at 1000 g for 10 min. The IL-6 content in serum was detected with the Mouse IL-6 ELISA Kit.
RNA extraction and quantitative real-time PCR
Total RNA was extracted, and cDNA was synthesized. mRNA expression was evaluated using qRT-PCR. The 2-ΔΔCt method was used to calculate the target mRNA expression. Primers for qRT-PCR are listed in online supplemental table S1.
Statistical analysis
Statistical analysis was performed using GraphPad Prism V.8. Data are presented as mean±SEM. A p<0.05 is considered statistically significant, and the level of significance was indicated as ns, not statistically significant; *, p<0.05; **, p<0.01; **, p<0.001.
Acknowledgments
We gratefully thank Dr. JoÖrge from University of Ghana and Dr. Dongwei Zhu from Jiangsu University for additional proofreading and technical support of the manuscript, as well as Prof. Wenzhang Zha, Prof. Zheng Wang and Dr. Guan Sun from The First people's Hospital of Yancheng for useful suggestions.
Footnotes
YW and HL contributed equally.
Contributors: YW, HL, YD and SW: manuscript draft, data acquisition and analysis. HL, ZZ, KS, DB and YW: material and technological support. ZZ and YD: assessment of the histopathology images. YW, YD, SW and HL: manuscript revision, proof, study concept and design, obtained funding and study supervision. All authors read and approved the final manuscript. YW: the guarantor. YW and HL: equal contributors. Correspondence: YD, YW, and SW.
Funding: This work was supported by the National Science Foundation of China (No.81902906), Scientific Research Project of Jiangsu Commission of Health (No.H2019102).
Competing interests: None declared.
Provenance and peer review: Not commissioned; externally peer reviewed.
Supplemental material: This content has been supplied by the author(s). It has not been vetted by BMJ Publishing Group Limited (BMJ) and may not have been peer-reviewed. Any opinions or recommendations discussed are solely those of the author(s) and are not endorsed by BMJ. BMJ disclaims all liability and responsibility arising from any reliance placed on the content. Where the content includes any translated material, BMJ does not warrant the accuracy and reliability of the translations (including but not limited to local regulations, clinical guidelines, terminology, drug names and drug dosages), and is not responsible for any error and/or omissions arising from translation and adaptation or otherwise.
Data availability statement
Data are available on reasonable request.
Ethics approval
All animal experiments were in accordance with protocols approved by the Institutional Animal Care and Use Committee of Xuzhou Medical University, Yancheng Clinical College (ID: (2019)-K005).
References
- 1. Rogler G. Chronic ulcerative colitis and colorectal cancer. Cancer Lett 2014;345:235–41. 10.1016/j.canlet.2013.07.032 [DOI] [PubMed] [Google Scholar]
- 2. Wang Y, Ding Y, Deng Y, et al. Role of myeloid-derived suppressor cells in the promotion and immunotherapy of colitis-associated cancer. J Immunother Cancer 2020;8:e000609. 10.1136/jitc-2020-000609 [DOI] [PMC free article] [PubMed] [Google Scholar]
- 3. Kiely M, Lord B, Ambs S. Immune response and inflammation in cancer health disparities. Trends Cancer 2022;8:316–27. 10.1016/j.trecan.2021.11.010 [DOI] [PMC free article] [PubMed] [Google Scholar]
- 4. Shah SC, Itzkowitz SH. Colorectal cancer in inflammatory bowel disease: mechanisms and management. Gastroenterology 2022;162:715–30. 10.1053/j.gastro.2021.10.035 [DOI] [PMC free article] [PubMed] [Google Scholar]
- 5. Ke Z, Wang C, Wu T, et al. PAR2 deficiency enhances myeloid cell-mediated immunosuppression and promotes colitis-associated tumorigenesis. Cancer Lett 2020;469:437–46. 10.1016/j.canlet.2019.11.015 [DOI] [PubMed] [Google Scholar]
- 6. Wang Y, Yin K, Tian J, et al. Granulocytic myeloid-derived suppressor cells promote the stemness of colorectal cancer cells through exosomal S100A9. Adv Sci (Weinh) 2019;6:1901278. 10.1002/advs.201901278 [DOI] [PMC free article] [PubMed] [Google Scholar]
- 7. Solito S, Pinton L, Mandruzzato S. In brief: myeloid-derived suppressor cells in cancer. J Pathol 2017;242:7–9. 10.1002/path.4876 [DOI] [PMC free article] [PubMed] [Google Scholar]
- 8. Grover A, Sanseviero E, Timosenko E, et al. Myeloid-Derived suppressor cells: a propitious road to clinic. Cancer Discov 2021;11:2693–706. 10.1158/2159-8290.CD-21-0764 [DOI] [PubMed] [Google Scholar]
- 9. Lin Y, Yang X, Yue W, et al. Chemerin aggravates DSS-induced colitis by suppressing M2 macrophage polarization. Cell Mol Immunol 2014;11:355–66. 10.1038/cmi.2014.15 [DOI] [PMC free article] [PubMed] [Google Scholar]
- 10. Yu T, Gan S, Zhu Q, et al. Modulation of M2 macrophage polarization by the crosstalk between STAT6 and TRIM24. Nat Commun 2019;10:4353. 10.1038/s41467-019-12384-2 [DOI] [PMC free article] [PubMed] [Google Scholar]
- 11. Haile LA, von Wasielewski R, Gamrekelashvili J, et al. Myeloid-Derived suppressor cells in inflammatory bowel disease: a new immunoregulatory pathway. Gastroenterology 2008;135:871–81, 10.1053/j.gastro.2008.06.032 [DOI] [PubMed] [Google Scholar]
- 12. Lawrence T, Natoli G. Transcriptional regulation of macrophage polarization: enabling diversity with identity. Nat Rev Immunol 2011;11:750–61. 10.1038/nri3088 [DOI] [PubMed] [Google Scholar]
- 13. Ostanin DV, Kurmaeva E, Furr K, et al. Acquisition of antigen-presenting functions by neutrophils isolated from mice with chronic colitis. J Immunol 2012;188:1491–502. 10.4049/jimmunol.1102296 [DOI] [PMC free article] [PubMed] [Google Scholar]
- 14. Rivollier A, He J, Kole A, et al. Inflammation switches the differentiation program of ly6chi monocytes from antiinflammatory macrophages to inflammatory dendritic cells in the colon. J Exp Med 2012;209:139–55. 10.1084/jem.20101387 [DOI] [PMC free article] [PubMed] [Google Scholar]
- 15. Varol C, Vallon-Eberhard A, Elinav E, et al. Intestinal lamina propria dendritic cell subsets have different origin and functions. Immunity 2009;31:502–12. 10.1016/j.immuni.2009.06.025 [DOI] [PubMed] [Google Scholar]
- 16. Kontaki E, Boumpas DT, Tzardi M, et al. Aberrant function of myeloid-derived suppressor cells (mdscs) in experimental colitis and in inflammatory bowel disease (IBD) immune responses. Autoimmunity 2017;50:170–81. 10.1080/08916934.2017.1283405 [DOI] [PubMed] [Google Scholar]
- 17. Su M-T, Kumata S, Endo S, et al. LILRB4 promotes tumor metastasis by regulating mdscs and inhibiting mir-1 family mirnas. Oncoimmunology 2022;11:2060907. 10.1080/2162402X.2022.2060907 [DOI] [PMC free article] [PubMed] [Google Scholar]
- 18. Kumar V, Cheng P, Condamine T, et al. CD45 phosphatase inhibits STAT3 transcription factor activity in myeloid cells and promotes tumor-associated macrophage differentiation. Immunity 2016;44:303–15. 10.1016/j.immuni.2016.01.014 [DOI] [PMC free article] [PubMed] [Google Scholar]
- 19. Solito S, Bronte V, Mandruzzato S. Antigen specificity of immune suppression by myeloid-derived suppressor cells. J Leukoc Biol 2011;90:31–6. 10.1189/jlb.0111021 [DOI] [PubMed] [Google Scholar]
- 20. Yong T, Wei Z, Gan L, et al. Extracellular-vesicle-based drug delivery systems for enhanced antitumor therapies through modulating the cancer-immunity cycle. Adv Mater 2022;34:e2201054. 10.1002/adma.202201054 [DOI] [PubMed] [Google Scholar]
- 21. Kodumudi KN, Woan K, Gilvary DL, et al. A novel chemoimmunomodulating property of docetaxel: suppression of myeloid-derived suppressor cells in tumor bearers. Clin Cancer Res 2010;16:4583–94. 10.1158/1078-0432.CCR-10-0733 [DOI] [PMC free article] [PubMed] [Google Scholar]
- 22. Tu SP, Jin H, Shi JD, et al. Curcumin induces the differentiation of myeloid-derived suppressor cells and inhibits their interaction with cancer cells and related tumor growth. Cancer Prev Res (Phila) 2012;5:205–15. 10.1158/1940-6207.CAPR-11-0247 [DOI] [PMC free article] [PubMed] [Google Scholar]
- 23. Preethi KA, Selvakumar SC, Ross K, et al. Liquid biopsy: exosomal micrornas as novel diagnostic and prognostic biomarkers in cancer. Mol Cancer 2022;21:54. 10.1186/s12943-022-01525-9 [DOI] [PMC free article] [PubMed] [Google Scholar]
- 24. Zhu D, Tian J, Wu X, et al. G-MDSC-derived exosomes attenuate collagen-induced arthritis by impairing th1 and th17 cell responses. Biochim Biophys Acta Mol Basis Dis 2019;1865:165540. 10.1016/j.bbadis.2019.165540 [DOI] [PubMed] [Google Scholar]
- 25. Abraham C, Abreu MT, Turner JR. Pattern recognition receptor signaling and cytokine networks in microbial defenses and regulation of intestinal barriers: implications for inflammatory bowel disease. Gastroenterology 2022;162:1602–16. 10.1053/j.gastro.2021.12.288 [DOI] [PMC free article] [PubMed] [Google Scholar]
- 26. Yoon S, Woo SU, Kang JH, et al. Stat3 transcriptional factor activated by reactive oxygen species induces IL6 in starvation-induced autophagy of cancer cells. Autophagy 2010;6:1125–38. 10.4161/auto.6.8.13547 [DOI] [PubMed] [Google Scholar]
- 27. Vasquez-Dunddel D, Pan F, Zeng Q, et al. Stat3 regulates arginase-I in myeloid-derived suppressor cells from cancer patients. J Clin Invest 2013;123:1580–9. 10.1172/JCI60083 [DOI] [PMC free article] [PubMed] [Google Scholar]
- 28. Zou S, Tong Q, Liu B, et al. Targeting STAT3 in cancer immunotherapy. Mol Cancer 2020;19:145. 10.1186/s12943-020-01258-7 [DOI] [PMC free article] [PubMed] [Google Scholar]
- 29. He P, Miao Y, Sun Y, et al. Discovery of a novel potent STAT3 inhibitor HP590 with dual p-tyr(705)/ser(727) inhibitory activity for gastric cancer treatment. J Med Chem 2022. 10.1021/acs.jmedchem.2c00413 [DOI] [PubMed] [Google Scholar]
- 30. Xu W, Dong J, Zheng Y, et al. Immune-checkpoint protein vista regulates antitumor immunity by controlling myeloid cell-mediated inflammation and immunosuppression. Cancer Immunol Res 2019;7:1497–510. 10.1158/2326-6066.CIR-18-0489 [DOI] [PMC free article] [PubMed] [Google Scholar]
- 31. Wang D, Cabalag CS, Clemons NJ, et al. Cyclooxygenases and prostaglandins in tumor immunology and microenvironment of gastrointestinal cancer. Gastroenterology 2021;161:1813–29. 10.1053/j.gastro.2021.09.059 [DOI] [PubMed] [Google Scholar]
- 32. Rah B, Rather RA, Bhat GR, et al. JAK/stat signaling: molecular targets, therapeutic opportunities, and limitations of targeted inhibitions in solid malignancies. Front Pharmacol 2022;13:821344. 10.3389/fphar.2022.821344 [DOI] [PMC free article] [PubMed] [Google Scholar]
- 33. Ghia J-E, Blennerhassett P, Deng Y, et al. Reactivation of inflammatory bowel disease in a mouse model of depression. Gastroenterology 2009;136:2280–8. 10.1053/j.gastro.2009.02.069 [DOI] [PubMed] [Google Scholar]
- 34. Zheng Y, Tian X, Wang T, et al. Long noncoding RNA PVT1 regulates the immunosuppression activity of granulocytic myeloid-derived suppressor cells in tumor-bearing mice. Mol Cancer 2019;18:61. 10.1186/s12943-019-0978-2 [DOI] [PMC free article] [PubMed] [Google Scholar]
Associated Data
This section collects any data citations, data availability statements, or supplementary materials included in this article.
Supplementary Materials
jitc-2022-006166supp001.pdf (261.7KB, pdf)
Data Availability Statement
Data are available on reasonable request.


