

Abstract
Background Thymoma is the most common tumor of the anterior mediastinum. However, the correlation between thymoma stage and pulmonary function was not assessed. Our objective in this study was to describe the pulmonary function in thymoma subjects stratified with different staging systems.
Methods A total of 143 subjects with a diagnosis of thymoma who underwent extended thymectomy for thymoma between January 2001 and December 2019 were reviewed retrospectively. All the subjects experienced pulmonary function tests (PFTs) using Master Screen PFT system and total respiratory resistance measurement.
Results We evaluated 143 subjects with a diagnosis of thymoma; the significant differences were observed in mean values of vital capacity, inspiratory volume (IC), total lung capacity (TLC), ratio of residual volume to total lung capacity (RV/TLC), forced vital capacity, forced expiratory volume in 1 second, ratio of forced expiratory volume in 1 second to forced vital capacity, peak expiratory flow, peak inspiratory flow, maximum ventilation volume, total airway resistance, and diffusing capacity for carbon monoxide (DLCO) across upper airway obstruction classification. PFTs of subjects with varying Masaoka stages are different. RV and RV/TLC of subjects in stages III and IV were higher than those of normal level, while DLCO of subjects in stage IV was lower than the normal level, and the mean level of IC showed significant difference between stage II and stage III.
Discussion The pulmonary function patterns of thymoma subjects significantly correlate with tumor location and size rather than clinical Masaoka stage.
Keywords: surgery, thymoma, pulmonary function tests, upper airway obstruction (UAO), cohort study
Introduction
Thymoma is the most common tumor of the anterior mediastinum. It often affects middle- or older-aged adults with roughly equal proportions of males and females. 1 2 3 As a neoplasm of the thymic epithelial cells that are normally responsible for T lymphocyte maturation, thymomas can be classified as “malignant” or “benign” on the basis of the presence or absence of capsular invasion. 2 4 Although the pathogenesis of thymoma is unknown, the previous histological evidence reveals that thymomas frequently have an accompanying rich infiltrate of T cells. 5 Subsequently, the abnormally conditional T cells are released into the circulation, thereby resulting in autoimmune abnormalities, such as myasthenia gravis (MG), blood disorders, and connective tissue diseases. 6
Only one-third subjects experience chest pain, cough, and other symptoms compared with one-third to one-half of subjects presenting with an asymptomatic anterior mediastinal mass on chest radiograph. 1 In the latter situation, the slow-growing thymoma tends to infiltrate adjacent thoracic organs. Therefore, the initial clinical presentations are majorly associated with invasion of lung hilum or trachea. 7 This progression from tumor growth is responsible for change in pulmonary function parameters. However, the correlation between thymoma stage and pulmonary function has not been assessed to our best knowledge. Lung function examination is one of the important evaluation indexes before thoracic surgery; preoperative preparation is the key to the success of surgery. In this study, we conducted a retrospective study to analyze the pulmonary function in thymoma subjects stratified according to different staging systems in the Beijing Chest Hospital over the past 20 years.
Methods
Subjects
This study was conducted in the Beijing Chest Hospital, a tertiary hospital for tuberculosis and thoracic cancer. The medical records of 143 subjects who underwent extended thymectomy for thymoma between January 2001 and December 2019 were reviewed retrospectively. All the subjects were diagnosed with the pathology results, whereas those with comorbidities that could affect pulmonary function, including asthma, chronic obstructive pulmonary disease, previous episode of tuberculosis, pneumonectomy, long-term exposure to toxic gas or powder, chest deformity, chronic cardiac dysfunction, chronic kidney dysfunction, and severe anemia. Demographic (i.e., sex and age) and clinical data (i.e., body mass index [BMI], smoking status, comorbid MG, clinical finding, etc.) were extracted from electronic case records. The protocols applied in this study were approved by the Ethics Committee of Beijing Chest Hospital, Capital Medical University. Consider that this study presented no more than minimal risk of harm to patient subjects, and the institutional review board approved a waiver of patient informed consent.
Pulmonary Function Tests
All the subjects experienced pulmonary function tests (PFTs) using Master Screen PFT system (Jaeger, Wurzburg, Germany) and total respiratory resistance measurement with Master Screen impulse oscillometry system (Jaeger, Wurzburg, Germany). The following parameters were derived: vital capacity as a percentage of expected value (VC% pred), inspiratory volume as a percentage of expected value (IC% pred), total lung capacity as a percentage of expected value (TLC% pred), residual volume as a percentage of expected value (RV% pred), ratio of residual volume to total lung capacity (RV/TLC% pred), forced vital capacity as a percentage of expected value (FVC% pred), forced expiratory volume in 1 second as a percentage of expected value (FEV 1 % pred), ratio of forced expiratory volume in 1 second to forced vital capacity (FEV 1 /FVC), maximum ventilation volume as a percentage of expected value (MVV% pred), peak inspiratory flow (PIF), peak expiratory flow as a percentage of expected value (PEF% pred), total airway resistance as a percentage of expected value (Rtot% pred), diffusing capacity for carbon monoxide as a percentage of expected value (DLCO% pred), the diffusion coefficient (DLCO/VA% pred). The standards of pulmonary function testing were issued by the European Respiratory Society. 8
Definitions
Based on the patterns of flow–volume loops (FVLs) in subjects with upper airway obstruction (UAO), the thymoma subjects were divided into five groups following the Miller and Hyatt's definitions, which depended on the location of the obstruction and the nature of the lesion. 9 Variable extrathoracic UAO (VE-UAO) was characterized by showing inspiratory plateau and FEF 50% /FIF 50% >1 ( Fig. 1A ); variable intrathoracic UAO (VI-UAO) was characterized by showing expiratory plateau and the FEF 50% /FIF 50% <1 ( Fig. 1B ); fixed UAO was characterized by lack of changes in caliber during inhalation or exhalation ( Fig. 1C ); unilateral mainstem bronchial obstruction (UMBO) 10 type was characterized by the butterfly-shaped pattern in FVLs ( Fig. 1D ). In addition, the subjects were clinically staged according to modified Masaoka classification as described previously. 11
Fig. 1.
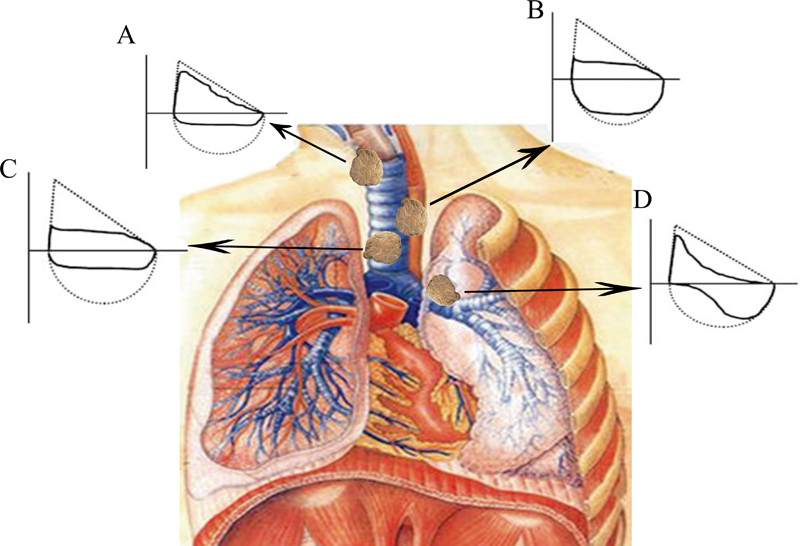
Flow–volume curve ( F – V curve), the dotted line is the normal velocity volume curve. Variable extrathoracic UAO: the obstruction site is outside the thoracic inlet. During inhalation, the airway pressure is lower than the atmospheric pressure, the tracheal wall tends to collapse and close, and the inspiratory resistance increases, resulting in obvious restriction of inspiratory flow. When exhaling, the airway tends to expand because the airway pressure is higher than the atmospheric pressure, and the airflow restriction may not be obvious. The F – V curve is characterized by inspiratory phase platform and FEF 50% /FIF 50% >1 (A) . Variable intrathoracic UAO (VI-UAO): the obstruction site is within the thoracic inlet. During inhalation, the thoracic negative pressure increases, the airway expands, the airway resistance decreases, and the airflow restriction in the inspiratory phase is not obvious. During exhalation, the negative pressure in the thoracic cavity decreased significantly, the trachea retracted, and the airway resistance increased, aggravating the original obstruction, which showed that the expiratory flow was significantly limited, especially in the early and middle stages of force-dependent exhalation, which was reflected in the significant decrease of PEF, FEF 25% , and FEF 50% . The F – V curve is characterized by expiratory phase platform and FEF 50% /FIF 50% <1 (B) . Fixed UAO: the lesion site is more extensive or rigid and airflow restriction is no longer affected by the respiratory phase. It was characterized by lack of changes in caliber during inhalation or exhalation, the inspiratory and expiratory flows were significantly limited and showed a plateau FEF 50% /FIF 50% is close to 1 (C) . Unilateral mainstem bronchial obstruction type (UMBO): the bronchial resistance of the healthy side is normal, and the early respiratory flow rises rapidly to the peak, so the initial flow is large. The bronchial resistance of the affected side increases and the respiratory flow slows down, so the terminal flow decreases significantly. The F – V curve changes in a double butterfly shape (D) . FEF 50% , forced expiratory flow at 50% of FVC; FIF 50% , forced inspiratory flow at 50% of FVC; FVC, forced vital capacity; PEF, peak expiratory flow.
Statistical Analysis
All of the data are presented as mean ± standard deviation (SD). The predicted values proposed by the European Respiratory Society guidelines were used. The Student's t -test was used to compare the mean respiratory parameter of subjects among different groups for variables with normal distribution, while the Wilcoxon rank-sum test was used for nonnormal data. All calculations were conducted with SPSS 21.0 (IBM Corp., Armonk, New York, United States). The level of significance was set at p < 0.05.
Results
Demographic and Clinical Characteristics
We evaluated 143 subjects with a diagnosis of thymoma. Forty-eight percent of the 143 subjects were male (age, mean ± SD: 48.4 ± 12.1 years). The high BMI was noted in 81 subjects (56.6%), and 28.0% had a history of cigarette smoking. In addition, 64 (44.8%) subjects had MG, containing 23 (16.1%) blepharoptosis and 41 (28.7%) dyspnea. In addition, the major location of thymoma was anterior/anterior and superior mediastinum, accounting for 86.7% (124/143) of cases, and 12.6% primarily within the superior mediastinum. The remaining 0.7% developed in the posterior mediastinum ( Table 1 ).
Table 1. Demographic and clinical characteristics of thymoma patients included in this study.
| Characteristics | No. (%) (n = 143) |
|---|---|
| Sex (male, %) | 69 (48.3) |
| Age (mean, SD) | 48.4 (12.1) |
| Body mass index (BMI, kg/m 2 ) | |
| <18.5 | 7 (4.9) |
| 18.5–25 | 76 (53.1) |
| ≥25 | 81 (56.6) |
| Smoke | |
| No | 103 (72.0) |
| Yes | 40 (28.0) |
| Myasthenia gravis | 64 (44.8) |
| Blepharoptosis | 23 (16.1) |
| Dyspnea | 41 (28.7) |
| Location | |
| Anterior/anterior and superior | 124 (86.7) |
| Middle | 18 (12.6) |
| Posterior | 1 (0.7) |
| Invaded phrenic nerve | |
| No | 93 (65.0) |
| Yes | 50 (35.0) |
| Tumor size (cm) | |
| ≤7 | 93 (65.0) |
| >7 | 50 (35.0) |
| Comorbidity | |
| CHD | 1 (0.7) |
| Hypertension | 11 (7.6) |
| Diabetes | 7 (4.9) |
Abbreviation: CHD, coronary heart disease.
Pulmonary Function Tests in UAO Groups
The pulmonary function parameters are summarized in Table 2 , stratified to UAO classification. The mean levels of PEF and MVV in the VI-UAO group were lower than normal levels, whereas the level of RV/TLC was slightly higher than the normal level. For the fixed group, the values of VC, IC, FVC, FEV 1 , PEF, MVV, and DLCO were lower than normal levels, respectively. In addition, the UMBO group had lower FEV 1 and DLCO levels than normal levels, but higher RV and RV/TLC levels.
Table 2. Lung function parameters of thymoma subjects stratified to upper airway obstruction classification.
| UAO classification ( n = 143) |
Pulmonary volume | Pulmonary diffusing capacity | |||||||
|---|---|---|---|---|---|---|---|---|---|
| VC% | IC% | RV% | TLC% | RV/TLC% | DLCO% | DLCO/VA% | |||
| Normal ( n = 35) | 100.8 ± 11.4 | 104.3 ± 25.0 | 118.8 ± 33.9 | 104.2 ± 15.6 | 109.6 ± 20.0 | 88.0 ± 16.2 | 95.8 ± 18.2 | ||
| VE ( n = 38) | 99.2 ± 12.3 | 110.0 ± 22.6 | 116.3 ± 30.5 | 101.3 ± 15.2 | 111.2 ± 18.7 | 85.4 ± 15.9 | 95.2 ± 13.2 | ||
| VI ( n = 20) | 85.9 ± 12.9 a b | 92.9 ± 26.9 b | 115.8 ± 36.2 | 93.5 ± 14.2 | 120.4 ± 26.2 | 80.6 ± 14.4 | 98.1 ± 20.3 | ||
| Fixed ( n = 30) | 78.2 ± 15.4 a b | 78.8 ± 22.0 a b c | 124.4 ± 40.0 | 91.1 ± 17.0 a | 132.8 ± 28.2 a b | 69.3 ± 18.5 a | 89.0 ± 20.8 | ||
| UMBO ( n = 20) | 91.2 ± 13.7 | 93.3 ± 21.5 | 122.8 ± 25.8 | 98.9 ± 13.8 | 121.9 ± 14.2 | 78.9 ± 14.5 | 100.7 ± 17.2 | ||
| F/t value | 16.32 | 8.477 | 0.354 | 3.789 | 5.809 | 6.377 | 1.513 | ||
| p -Value | <0.001 | <0.001 | 0.841 | 0.006 | <0.001 | <0.001 | 0.202 | ||
| UAO classification ( n = 143) |
Pulmonary ventilation | Respiratory mechanics | |||||||
| FVC% | FEV 1 % | FEV 1 /FVC | MVV% | PEF% | PIF% | Rtot% | |||
| Normal ( n = 35) | 101.6 ± 11.6 | 84.1 ± 6.0 | 103.2 ± 12.1 | 99.2 ± 22.6 | 100.8 ± 16.5 | 4.8 ± 1.6 | 84.5 ± 36.4 | ||
| VE ( n = 38) | 99.7 ± 13.1 | 81.5 ± 6.8 | 96.7 ± 12.4 | 90.8 ± 20.3 | 97.1 ± 14.1 | 3.3 ± 1.3 a | 85.3 ± 31.4 | ||
| VI ( n = 20) | 87.9 ± 13.3 a b | 82.2 ± 8.0 a b | 86.4 ± 13.0 | 74.1 ± 16.1 a | 71.7 ± 16.7 a | 3.8 ± 1.4 | 104.0 ± 39.8 | ||
| Fixed ( n = 30) | 77.9 ± 16.1 a b | 77.1 ± 15.1 a b | 72.3 ± 17.3 | 65.3 ± 17.9 a b | 66.6 ± 21.3 a b | 2.9 ± 1.0 a c | 111.1 ± 39.8 a | ||
| UMBO ( n = 20) | 91.4 ± 13.9 | 76.2 ± 7.8 a | 83.2 ± 12.6 a | 85.3 ± 19.0 | 93.1 ± 21.2 d | 4.0 ± 1.3 d | 90.6 ± 39.1 | ||
| F/t value | 15.861 | 3.681 | 24.782 | 14.384 | 22.487 | 9.877 | 3.158 | ||
| p -Value | <0.001 | 0.007 | <0.001 | <0.001 | <0.001 | <0.001 | 0.016 | ||
Abbreviations: DLCO, diffusing capacity for carbon monoxide; FEV 1 , forced expiratory volume in 1 second; FVC, forced vital capacity; IC, inspiratory volume; MVV, maximum ventilation volume; PEF, peak expiratory flow; PIF, peak inspiratory flow; RV, residual volume; TLC, total lung capacity; UAO, upper airway obstruction; UMBO, unilateral mainstem bronchial obstruction; VC, vital capacity; VE, variable extrathoracic; VI, variable intrathoracic.
Note: The bold values represent that the level is lower than the normal range, while the italic value represents that the level is higher than the normal range.
Represents the significant difference compared with the normal group.
Represents the significant difference compared with the VE group.
Represents the significant difference compared with the VI group.
Represents the significant difference compared with the fixed group.
Overall, significant differences were observed in mean values of VC, IC, TLC, RV/TLC, FVC, FEV 1 , FEV 1 /FVC, PEF, PIF, MVV, Rtot, and DLCO across the four groups ( p < 0.05). When setting the normal group as the reference, we found that the significant differences existed for VI-UAO, fixed-UAO, and UMBO groups, respectively ( p < 0.05).
Pulmonary Function Tests of Subjects with Varying Masaoka Stages
We further analyzed the pulmonary function parameters among subjects with different Masaoka stages. As shown in Table 3 , the mean levels of pulmonary ventilation and respiratory mechanics were within normal levels for all groups. In contrast, the RV and RV/TLC of subjects in stages III and IV were higher than normal level, while the DLCO value of subjects in stage IV was lower than the normal level. Of note, the mean level of IC showed a significant difference between stages II and III ( p = 0.04).
Table 3. Comparison of lung function parameters in thymoma patients stratified to Masaoka stage.
| Masaoka stage ( n = 143) |
Pulmonary volume | Pulmonary diffusing capacity | ||||||
|---|---|---|---|---|---|---|---|---|
| VC% | IC% | RV% | TLC% | RV/TLC% | DLCO% | DLCO/VA% | ||
| I ( n = 41) | 92.4 ± 14.9 | 94.0 ± 25.0 | 113.2 ± 22.2 | 97.1 ± 13.4 | 113.4 ± 15.8 | 84.4 ± 19.1 | 100.2 ± 18.3 | |
| II ( n = 37) | 97.4 ± 13.9 | 109.0 ± 28.0 | 114.4 ± 42.9 | 104.5 ± 15.0 | 117.2 ± 31.8 | 83.6 ± 17.2 | 92.9 ± 17.3 | |
| III ( n = 28) | 88.3 ± 16.2 | 89.7 ± 19.1 a | 127.5 ± 30.8 | 93.7 ± 17.3 | 120.3 ± 18.3 | 80.4 ± 15.7 | 94.7 ± 18.8 | |
| IV ( n = 37) | 89.8 ± 16.9 | 90.3 ± 25.8 | 122.1 ± 37.6 | 92.8 ± 17.6 | 121.7 ± 27.3 | 75.4 ± 15.7 | 92.5 ± 17.0 | |
| F/t value | 2.31 | 3.784 | 1.482 | 2.871 | 0.954 | 2.151 | 1.602 | |
| p -Value | 0.079 | 0.040 | 0.222 | 0.08 | 0.416 | 0.097 | 0.192 | |
| Masaoka stage ( n = 143) |
Pulmonary ventilation | Respiratory mechanics | ||||||
| FVC% | FEV 1 % | FEV 1 /FVC | MVV% | PEF% | PIF% | Rtot% | ||
| I ( n = 41) | 93.8 ± 15.5 | 91.8 ± 13.9 | 81.4 ± 7.9 | 88.9 ± 20.4 | 90.0 ± 17.1 | 3.8 ± 1.4 | 100.0 ± 54.0 | |
| II ( n = 37) | 96.8 ± 14.5 | 93.5 ± 19.2 | 80.7 ± 10.5 | 80.2 ± 22.1 | 87.2 ± 27.8 | 3.6 ± 1.6 | 101.1 ± 57.7 | |
| III ( n = 28) | 90.2 ± 17.0 | 84.4 ± 19.5 | 79.2 ± 12.6 | 80.9 ± 24.6 | 81.7 ± 23.5 | 4.1 ± 1.8 | 90.9 ± 41.5 | |
| IV ( n = 37) | 89.6 ± 17.3 | 88.1 ± 17.6 | 80.7 ± 8.0 | 86.3 ± 25.6 | 89.4 ± 21.2 | 3.6 ± 1.4 | 93.6 ± 34.8 | |
| F/t value | 1.548 | 1.717 | 0.291 | 1.237 | 0.881 | 1.65 | 2.151 | |
| p -Value | 0.205 | 1.166 | 0.832 | 0.299 | 0.453 | 0.181 | 0.097 | |
Abbreviations: DLCO, diffusing capacity for carbon monoxide; FEV 1 , forced expiratory volume in 1 second; FVC, forced vital capacity; IC, inspiratory volume; MVV, maximum ventilation volume; PEF, peak expiratory flow; PIF, peak inspiratory flow; RV, residual volume; TLC, total lung capacity; VC, vital capacity.
Note: The bold value represents that the level is lower than the normal range, while the italic value represents that the level is higher than the normal range.
Represents the significant difference compared with Stage II.
Correlation of Pulmonary Function with MG
The co-existence of MG has a significant association with respiratory insufficiency; thus we compared the pulmonary function parameters between MG and non-MG groups. As listed in Table 4 , those subjects with comorbidity in the MG group had lower mean levels of MVV and DLCO than normal levels, which were more likely to be lower than those in the non-MG group, but the difference was not statistically significant.
Table 4. To compare the lung function indicators of thymoma complicated with myasthenia gravis.
| Comorbid myasthenia gravis ( n = 143) |
Pulmonary volume | Pulmonary diffusing capacity | ||||||
|---|---|---|---|---|---|---|---|---|
| VC% | IC% | RV% | TLC% | RV/TLC% | DLCO% | DLCO/VA% | ||
| No ( n = 79) | 95.7 ± 14.9 | 102.2 ± 26.4 | 119.6 ± 35.5 | 101.6 ± 16.0 | 116.9 ± 23.9 | 83.7 ± 17.0 | 93.4 ± 17.1 | |
| Yes ( n = 64) | 87.9 ± 15.6 | 91.3 ± 24.2 | 115.6 ± 30.7 | 94.5 ± 15.2 | 119.6 ± 22.9 | 77.9 ± 17.1 | 97.5 ± 18.8 | |
| F/T value | 0.327 | 0.728 | 3.09 | 0.297 | 0.292 | 0.109 | 2.27 | |
| p -Value | 0.569 | 0.395 | 0.081 | 0.587 | 0.590 | 0.742 | 0.134 | |
| Comorbid myasthenia gravis ( n = 143) |
Pulmonary ventilation | Respiratory mechanics | ||||||
| FVC% | FEV 1 % | FEV 1 /FVC | MVV% | PEF% | PIF% | Rtot% | ||
| I ( n = 41) | 95.7 ± 15.3 | 95.7 ± 15.3 | 95.7 ± 15.3 | 88.1 ± 25.4 | 89.7 ± 24.5 | 3.9 ± 1.6 | 80.0(63.4,115.0) | |
| IV ( n = 37) | 89.2 ± 16.6 | 89.2 ± 16.6 | 89.2 ± 16.6 | 79.8 ± 18.9 | 84.8 ± 19.7 | 3.6 ± 1.5 | 86.7(67.1,120.0) | |
| F/T value | 1.268 | 1.268 | 1.268 | 3.336 | 2.772 | 0.071 | -0.721 | |
| p -Value | 0.262 | 0.262 | 0.262 | 0.07 | 0.098 | 0.791 | 0.471 | |
Abbreviations: DLCO, diffusing capacity for carbon monoxide; FEV 1 , forced expiratory volume in 1 second; FVC, forced vital capacity; IC, inspiratory volume; MVV, maximum ventilation volume; PEF, peak expiratory flow; PIF, peak inspiratory flow; RV, residual volume; TLC, total lung capacity; VC, vital capacity.
Note: The bold value represents that the level is lower than the normal range, while the italic value represents that the level is higher than the normal range.
Discussion
To the best of our knowledge, this is the first study to describe the pulmonary function of thymoma subjects by stratified classification. Our data demonstrate that the pulmonary function patterns of thymoma subjects significantly correlate with tumor location and size rather than clinical Masaoka stage. In VI-UAO subjects, the most differences were observed in pulmonary ventilation parameters, reflecting the impeded expiratory flows. The impeded airflows in the subjects affected by UMBO occurred in the posterior part of the breathing phase, thereby leading to the low FEV 1 and DLCO values. For fixed UAO subjects, due to the limited airflow in both expiration and inspiration phages, the values of multiple parameters were out of expired value. In addition, the Masaoka classification criteria, an indicator for guiding treatment and predicting clinical outcomes, 11 12 has limited impact on the parameters of pulmonary function. One possible explanation is that the mediastinum provides spatial compensation for tumor growth. The effect emerges only when it invades the diaphragm and adjacent lung tissue, thus extruding continuously lung tissue and elevating the predicted values of RV and RV/TLC.
The most important parameter for identifying an obstructive dysfunction in subjects is the FEV 1 /FVC ratio. The low FEV 1 /FVC is an independent risk factor for morbidity and mortality, regardless of whether FEV 1 is within the normal range. 13 14 In our cohort, we identified that the fixed UAO subjects had the lowest FEV1/VC level compared to other groups, indicating that subjects in this group have the increased odds for mortality, especially after thymectomy surgery. More attention should be paid to these subjects undergoing higher risk of respiratory dysfunction.
Corresponding to the location of the thymoma, our results confirm that 87% of the tumors are found in the anterior/anterior and superior mediastinum, which is consistent to a previous report. 3 This fact faithfully reflects the normal location of the thymus in host. Notably, the imbalanced high proportion of individuals with high BMI value was noted in thymoma subjects. It is well known that adult human thymus degenerates into fat tissue. 15 A recent experimental study by Silva revealed that high-fat diets resulted in the abnormal thymus lipid profile, 16 indicating that the lipid metabolism produces great effects on the structure and function of thymus. The excessive accumulation of fat in thymus presumably would increase the likelihood of malignant transformation of thymic epithelial cells. More direct experimental evidence is required to elucidate the correlation between lipid metabolism and thymoma pathogenesis.
MG is considered an adverse prognostic factor in thymoma cases in view of a higher perioperative mortality. 17 18 On the contrary, several recent reports revealed that MG is a potential favorable prognostic factor in the case of thymoma. 19 20 In our report, we found no significant difference in pulmonary function parameters between MG and non-MG group. On one hand, the concurrent MG may result in an earlier diagnosis of thymoma with a less advanced stage. On the other hand, this phenomenon is associated with the benefit of steroids, which are widely used for treatment of both diseases. 21
We also acknowledge several limitations of this study. First, all subjects were enrolled from a single center. The methodological bias would weaken the confidence of our conclusion. Second, we did not establish the relationship between pulmonary function at baseline and clinical outcomes after surgery. Nevertheless, this study extends our knowledge on pulmonary function of thymoma subjects by various stratified classifications.
Conclusion
In conclusion, our data demonstrate that the pulmonary function patterns of thymoma subjects significantly correlate with tumor location and size rather than clinical Masaoka stage. The fixed UAO subjects have the lowest FEV 1 /VC level compared to other groups, indicating that these subjects have the increased odds for mortality. In addition, no significant difference in pulmonary function parameters is identified between MG and non-MG group. The imbalanced high proportion of individuals with high BMI value was noted in thymoma subjects, highlighting the potential correlation between lipid metabolism and thymoma pathogenesis, but this needs to be further studied in the future.
Funding Statement
Funding None.
Conflict of Interest None declared.
Ethics Approval Statement
The study design complies with the Helsinki Research Ethics Statement and was approved by the Ethics Committee of Beijing Chest Hospital (2019) interim review no. (85).
Authors' Contribution
Q.L., X.S., H.R., B.L., and X.Y. designed and supervised the project. H.R. and B.L. collected the clinical samples. H.R. did postoperative patient follow-up. H.R gathered and processed the data. H.R. and B.L. performed the data analysis. H.R. and Q.L. drafted the manuscript. All authors reviewed, discussed, and edited the final version of the manuscript. All the authors read and approved the final manuscript.
References
- 1.Lucchi M, Ricciardi R, Melfi Fet al. Association of thymoma and myasthenia gravis: oncological and neurological results of the surgical treatment Eur J Cardiothorac Surg 20093505812–816.discussion 816 [DOI] [PubMed] [Google Scholar]
- 2.Engels E A, Pfeiffer R M. Malignant thymoma in the United States: demographic patterns in incidence and associations with subsequent malignancies. Int J Cancer. 2003;105(04):546–551. doi: 10.1002/ijc.11099. [DOI] [PubMed] [Google Scholar]
- 3.Engels E A.Epidemiology of thymoma and associated malignancies J Thorac Oncol 20105(10, Suppl 4):S260–S265. [DOI] [PMC free article] [PubMed] [Google Scholar]
- 4.Müller-Hermelink H K, Marx A. Thymoma. Curr Opin Oncol. 2000;12(05):426–433. doi: 10.1097/00001622-200009000-00007. [DOI] [PubMed] [Google Scholar]
- 5.Christopoulos P, Fisch P. Acquired T-cell immunodeficiency in thymoma patients. Crit Rev Immunol. 2016;36(04):315–327. doi: 10.1615/CritRevImmunol.2017018916. [DOI] [PubMed] [Google Scholar]
- 6.Souadjian J V, Enriquez P, Silverstein M N, Pépin J M. The spectrum of diseases associated with thymoma. Coincidence or syndrome? Arch Intern Med. 1974;134(02):374–379. [PubMed] [Google Scholar]
- 7.Katsura M, Kouso H, Shikada Y, Ushijima C, Momosaki S, Takeo S. Primary intrapulmonary thymoma. Gen Thorac Cardiovasc Surg. 2015;63(01):56–59. doi: 10.1007/s11748-013-0283-8. [DOI] [PubMed] [Google Scholar]
- 8.Singh S J, Puhan M A, Andrianopoulos V et al. An official systematic review of the European Respiratory Society/American Thoracic Society: measurement properties of field walking tests in chronic respiratory disease. Eur Respir J. 2014;44(06):1447–1478. doi: 10.1183/09031936.00150414. [DOI] [PubMed] [Google Scholar]
- 9.Miller R D, Hyatt R E. Evaluation of obstructing lesions of the trachea and larynx by flow-volume loops. Am Rev Respir Dis. 1973;108(03):475–481. doi: 10.1164/arrd.1973.108.3.475. [DOI] [PubMed] [Google Scholar]
- 10.Shi Y H, Zhu S W, Mao X Z et al. Transcriptome profiling, molecular biological, and physiological studies reveal a major role for ethylene in cotton fiber cell elongation. Plant Cell. 2006;18(03):651–664. doi: 10.1105/tpc.105.040303. [DOI] [PMC free article] [PubMed] [Google Scholar]
- 11.Roden A C, Yi E S, Jenkins S M et al. Reproducibility of 3 histologic classifications and 3 staging systems for thymic epithelial neoplasms and its effect on prognosis. Am J Surg Pathol. 2015;39(04):427–441. doi: 10.1097/PAS.0000000000000391. [DOI] [PubMed] [Google Scholar]
- 12.Roden A C, Yi E S, Jenkins S M et al. Modified Masaoka stage and size are independent prognostic predictors in thymoma and modified Masaoka stage is superior to histopathologic classifications. J Thorac Oncol. 2015;10(04):691–700. doi: 10.1097/JTO.0000000000000482. [DOI] [PubMed] [Google Scholar]
- 13.Pellegrino R, Viegi G, Brusasco V et al. Interpretative strategies for lung function tests. Eur Respir J. 2005;26(05):948–968. doi: 10.1183/09031936.05.00035205. [DOI] [PubMed] [Google Scholar]
- 14.Mannino D M, Buist A S, Petty T L, Enright P L, Redd S C. Lung function and mortality in the United States: data from the First National Health and Nutrition Examination Survey follow up study. Thorax. 2003;58(05):388–393. doi: 10.1136/thorax.58.5.388. [DOI] [PMC free article] [PubMed] [Google Scholar]
- 15.Salas J, Montiel M, Jiménez E et al. Angiogenic properties of adult human thymus fat. Cell Tissue Res. 2009;338(02):313–318. doi: 10.1007/s00441-009-0867-x. [DOI] [PubMed] [Google Scholar]
- 16.Silva C, Perris P D, Fernandez I et al. Effects of high-fat diets from different sources on serum and thymus lipid profile: study in an experimental model. Endocr Metab Immune Disord Drug Targets. 2014;14(02):77–83. doi: 10.2174/1871530314666140519160607. [DOI] [PubMed] [Google Scholar]
- 17.Osserman K E, Genkins G. Studies in myasthenia gravis: review of a twenty-year experience in over 1200 patients. Mt Sinai J Med. 1971;38(06):497–537. [PubMed] [Google Scholar]
- 18.Shamji F, Pearson F G, Todd T R, Ginsberg R J, Ilves R, Cooper J D. Results of surgical treatment for thymoma. J Thorac Cardiovasc Surg. 1984;87(01):43–47. [PubMed] [Google Scholar]
- 19.Masaoka A, Yamakawa Y, Niwa H et al. Extended thymectomy for myasthenia gravis patients: a 20-year review. Ann Thorac Surg. 1996;62(03):853–859. doi: 10.1016/s0003-4975(96)00376-1. [DOI] [PubMed] [Google Scholar]
- 20.Casey E M, Kiel P J, Loehrer P J., Sr Clinical management of thymoma patients. Hematol Oncol Clin North Am. 2008;22(03):457–473. doi: 10.1016/j.hoc.2008.03.010. [DOI] [PubMed] [Google Scholar]
- 21.Evoli A, Minisci C, Di Schino C et al. Thymoma in patients with MG: characteristics and long-term outcome. Neurology. 2002;59(12):1844–1850. doi: 10.1212/01.wnl.0000032502.89361.0c. [DOI] [PubMed] [Google Scholar]