

Environmental exposures, especially air pollution, have been linked with heart disease.1 Air pollution alone is estimated to cause 6 to 9 million deaths globally annually, mostly attributable to ischemic heart disease and stroke.1 The health impact of environmental exposures varies significantly depending on the susceptibility and vulnerability of the exposed populations.2 Underrepresented minorities and people of color often face higher exposures to various pollutants, owing to historic inequities and structural racism, which impact cardiovascular disease disparities.1,3 We sought to characterize contemporary racial differences in environmental exposures throughout the United States.
This is a cross-sectional analysis of population-weighted exposure estimates for 11 environmental indicators collected from the 2020 EPA-EJSCREEN (Environmental Protection Agency’s Environmental Justice Screening tool), which incorporates the most recent available environmental metrics (2014 to 2020).4 These indicators include: particulate matter <2.5 μm (PM2.5), ozone, diesel particulate matter, living in a house built before 1960 (lead paint indicator), air toxics respiratory hazard index, air toxics cancer risk, proximity to risk management plan (RMP) facilities, proximity to national priority list (NPL) site, proximity to hazardous waste facilities, wastewater discharge, and traffic proximity and volume. Minority and White populations were characterized based on the 5-year 2019 American Community Survey estimates. Minority populations represent all people other than single-race non-Hispanic White individuals. A t test was used to compare population-weighted exposures, and Pearson’s correlation was used to correlate the percentage of minorities with levels of exposure to pollutants at the block group level.
A total of 217,739 block groups were included representing 322,903,030 subjects (125,721,853 minorities and 197,181,177 White individuals). Population-weighted means for all 11 indicators were higher in the minority group than the White group (Figure 1), with excess mean exposure ranging between 2% (ozone) to 107% (proximity to traffic). The percentage of minority subjects in each census-block correlated with the census-block levels of each of the following exposures: PM2.5 (R = 0.33, p <0.0001), ozone (R = 0.07, p <0.0001), diesel PM (R = 0.37, p <0.0001), traffic proximity and volume (R = 0.26, p <0.0001), percentage of houses built before 1960 (lead paint indicator) (R = 0.12, p <0.0001), air toxics respiratory hazard index (R = 0.41, p <0.0001), air toxics cancer risk (R = 0.29, p <0.0001), proximity to RMP facilities (R = 0.27, p <0.0001), proximity to hazardous waste facilities (R = 0.13, p <0.0001), and proximity to NPL sites (R = 0.13, p <0.0001).
Figure 1.
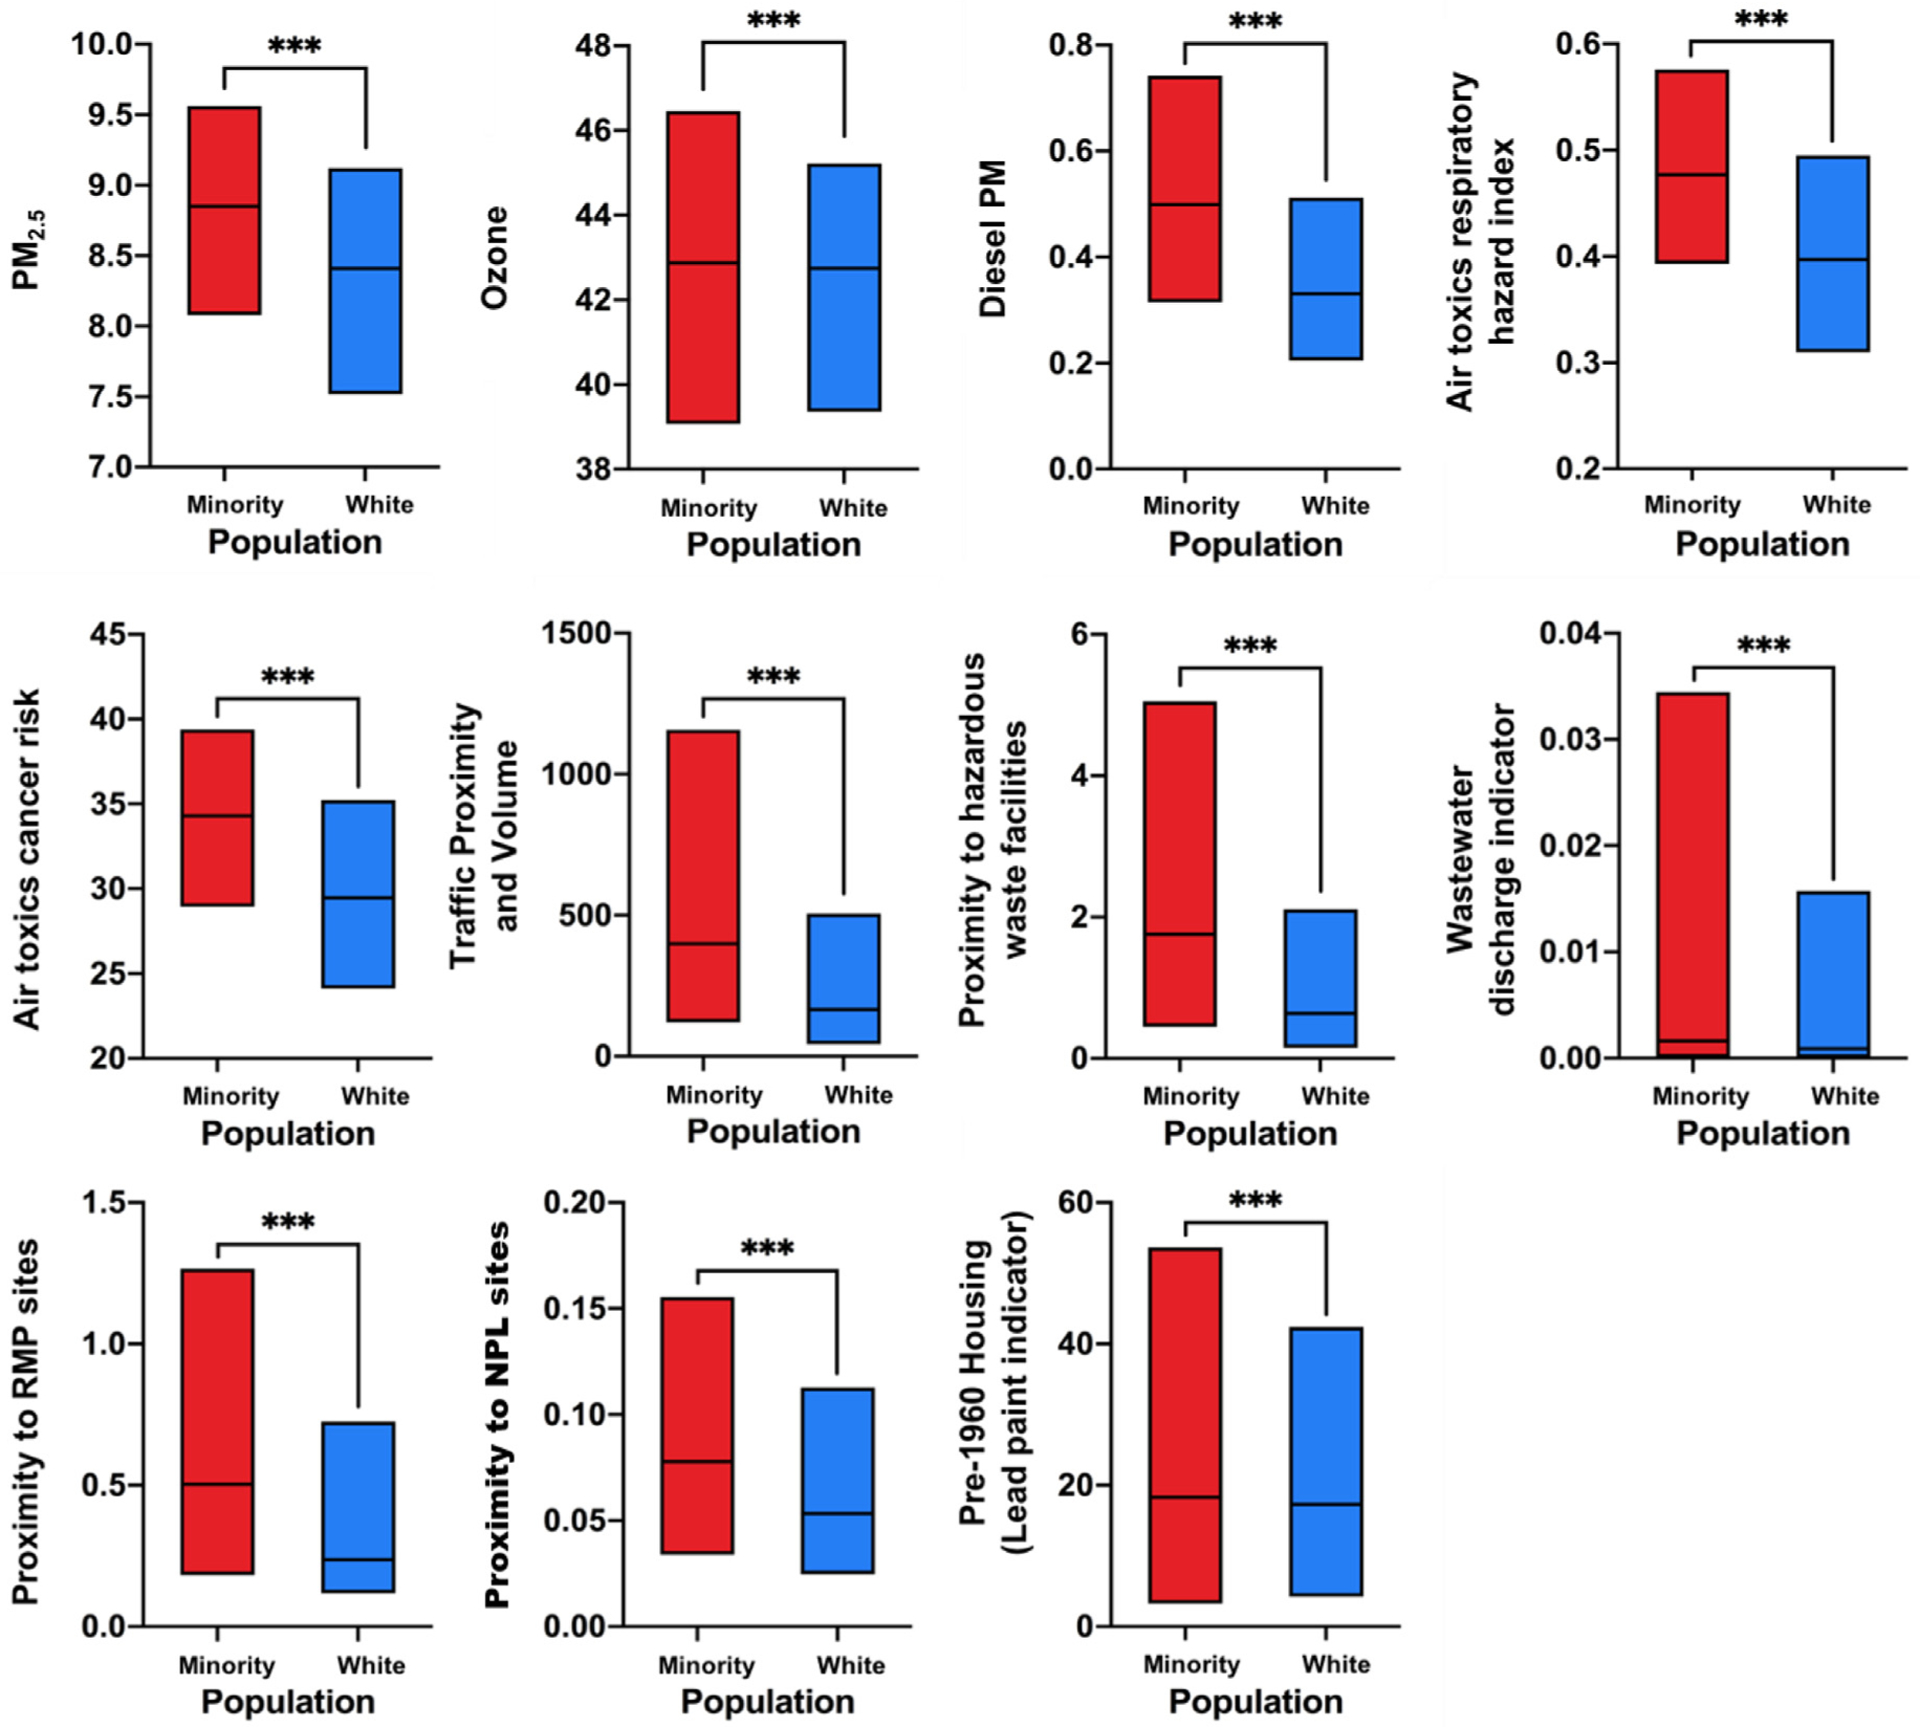
Population-weighted exposures of minority versus White populations to 11 environmental indicators.
NPL = national priority list; PM = particulate matter; RMP = risk management plan; *** = p-value < 0.001.
These data highlight historic economic, educational, and political preferences and policies that resulted in inequities for minority populations and may have also contributed to environmental injustice, as evidenced by adverse environmental exposures. This disparate exposure to a variety of pollutants could, in turn, be responsible for disparities in cardiovascular disease outcomes observed throughout the United States. For instance, we have shown that inhabitants of historically segregated neighborhoods, which have higher concentrations of minority populations, experience an increased risk of detrimental cardiometabolic health outcomes partly because of increased exposures to PM2.5 and diesel PM.5 Here, we extend these findings and characterize various environmental injustices that minority populations experience. Further, minority patients who may harbor multiple preexisting chronic noncommunicable diseases could perhaps be even more vulnerable to adverse environmental exposures, compounding their harmful cardiovascular impacts. This study is limited because of modeled environmental exposures in EPA-EJSCREEN, which provided estimated pollutant exposures of small geographic areas that are prone to exposure mischaracterization. However, the size of the sample set and the concordance of these estimates across multiple pollutants suggest that these estimates may be credible.
Air toxics respiratory hazard index = ratio of exposure concentration to health-based reference concentration; Air toxics cancer risk = lifetime cancer risk from inhalation of air toxics; Diesel PM = diesel particulate matter level in air, μg/m3; Proximity to RMP Sites = count of RMP (potential chemical accident management plan) facilities within 5 km (or nearest one beyond 5 km), each divided by distance in kilometers; Proximity to NPL sites = count of proposed or listed NPL—also known as superfund—sites within 5 km (or nearest one beyond 5 km), each divided by distance in kilometers; Wastewater discharge indicator = modeled toxic concentrations at stream segments within 500 meters, divided by distance in kilometers (km); Traffic proximity and volume = average annual daily count of vehicles at major roads within 500 m, divided by distance in meters; Proximity to hazardous waste facilities = count of hazardous waste facilities within 5 km (or nearest beyond 5 km), each divided by distance in kilometers. PM2.5 = PM2.5 levels in air, μg/m3; Ozone = ozone summer seasonal average of daily maximum 8-hour concentration in air in parts per billion; Pre-1960 housing = fraction of housing units built pre-1960, as an indicator of potential lead paint exposure.
Acknowledgments
This work was partly funded by the National Institute on Minority Health and Health Disparities, Bethesda, Maryland, award number P50MD017351.
Footnotes
Disclosures
The authors have no conflicts of interest to declare.
References
- 1.Rajagopalan S, Landrigan PJ. Pollution and the heart. N Engl J Med 2021;385:1881–1892. [DOI] [PubMed] [Google Scholar]
- 2.Stilianakis N Susceptibility and vulnerability to health effects of air pollution: the case of nitrogen dioxide. Joint Research Centre, European Commission; Available at: https://publications.jrc.ec.europa.eu/repository/bitstream/JRC98587/lb-na-27634-en-n%20.pdf Accessed on September 20, 2022. [Google Scholar]
- 3.Bullard RD. Environmental justice in the 21st century: race still matters. Phylon 2001;49:151–171. [Google Scholar]
- 4.US EPA, Ejscreen O. Environmental justice screening and mapping tool. Available at: XXX. Accessed on February 20, 2022.
- 5.Motairek I, Lee EK, Janus S, Farkouh M, Freedman D, Wright J, Nasir K, Rajagopalan S, Al-Kindi S. Historical neighborhood redlining and contemporary cardiometabolic risk. J Am Coll Cardiol 2022;80:171–175. [DOI] [PMC free article] [PubMed] [Google Scholar]