Abstract
Purpose:
We have previously used Immuno Tomography (IT) to identify label-retaining stem cell populations in the cornea and meibomian gland. While this method provides the unique ability to quantify stem cell populations comprised of 1–4 cells, the number of antigens that can be sequentially used to characterize these unique cells is limited by antigen stability after antibody stripping and re-probing. To address this deficiency, we have evaluated the capability of Imaging Mass Cytometry™ (IMC™) to generate multiplexed images using metal-conjugated antibodies to label IT plastic sections and generate 3-dimensional IMC data sets (3D IMC).
Methods:
K5–H2B-GFP mice, 56 days after doxycycline chase, were sacrificed and eyelid tissue processed for IT. A total of 400 serial, plastic sections, 2 μm thick, were then probed using metal-tagged antibodies specific for sox 9, collagen type I, E-cadherin, Ki67, GFP, αSMA, vimentin, and DNA intercalator. Multiplexed images were then generated using an Imaging Mass Cytometry system (Fluidigm®), and 3D reconstructions were assembled.
Results:
All 8 metal-labeled tags were detected and their images were successfully assembled into 3D IMC data sets. GFP-labeled nuclei were identified within the meibomian glands in comparable numbers to those previously reported for slow-cycling meibomian gland stem cells.
Conclusions:
These findings demonstrate that IMC can be used on plastic sections to generate multiplexed, 3D data sets that can be reconstructed to show the spatial localization of meibomian gland stem cells. We propose that 3D IMC might prove valuable in more fully characterizing stem cell populations in different tissues.
Keywords: Imaging mass cytometry, Immuno tomography, Meibomian gland, 3D imaging, Metal-conjugated antibody
1. Introduction
Immunohistochemistry (IHC) is a morphologic technique for the localization and identification of cells, proteins, and other antigens within tissue sections. Today IHC is likely the most commonly used method for detecting and analyzing normal and pathologic tissue structure and function. As is well-known, IHC uses tagged antibodies directed against specific antigens that are then exposed to tissue sections and later analyzed using fluorescent or light microscopic techniques. A major limitation of IHC techniques is the limited number of antibody tags that can be used simultaneously to identify cells or other antigens of interest. This limitation can be partially overcome by the repeated staining and probing of adjacent tissue sections, allowing for reconstruction of the cellular and tissue organization. Recently, this limitation has been addressed by the development of Imaging Mass Cytometry (IMC), wherein antibodies, labeled with heavy metal isotopes, are reacted with tissue sections [1–3]. The sections are then raster-scanned using a laser to ablate 1 μm diameter spots, vaporize tissue and the plume of material from each spot is then analyzed by inductively coupled plasma mass spectrometer, to measure amounts of the metal isotopic labels in each spot. The IMC system has 135 mass channels available, and imaging for more than 40 tagged antibodies simultaneously on a single section has been reported [3,4].
While IMC provides a more comprehensive way of labeling tissue structures, imaging still relies on a single, 2-dimensional tissue section that again only incompletely represents the full, 3-dimensional organization of cells and other antigens of interest. Specifically, rare cell populations, such as stem cells, may not be captured in a single tissue section. Recently we have used Immuno Tomography (IT) to localize label-retaining stem cell populations in the meibomian gland and corneal epithelium of the bitransgenic, H2B-GFP/K5tTA mouse [5–7]. These studies have shown that for the meibomian gland there may be only 4–6 label-retaining cells per gland, while in the cornea, very small foci (2–4 cells) of label-retaining cells are distributed sparsely around the limbus. While IT can probe multiple antigens, antibodies need to be applied sequentially, followed by imaging, stripping, and then re-probing, leading to loss of signal [8]. To address this limitation, we were interested in adapting IMC to IT. This would allow for a more complete 3-dimensional reconstruction of the cellular organization of the meibomian gland and corneal epithelial stem cell population and demonstrate the future potential to use 40 different antibody probes simultaneously.
Since IT uses plastic tissue embedding to facilitate semi-thin (2 μm thick) tissue sectioning, we performed a preliminary study to determine if IT would hinder laser tissue ablation and/or limit antibody labeling and thus would reduce the imaging ability of IMC to detect label-retaining cells. In this paper, we report that IMC can be used on semi-thin (2 μm thick) serially sectioned, plastic-embedded tissue to generate 3-dimensional reconstructions that can localize small populations of label-retaining cells in the meibomian gland.
2. Method and results
2.1. Animals
Mice were maintained in accordance with the ARVO Statement on the Use of Animals in Ophthalmic and Vision Research, and their use approved by the Institutional Animal Care and Use Committee (IACUC) of the University of California, Irvine. H2B-GFP/K5tTA mice were generated by crossing K5tTA-transgenic mice with TRE/H2B-GFP-transgenic mice obtained from Jackson Laboratory (005104; Bar Harbor, ME, USA) as described by Parfitt et al. [5]. These mice express the GFP-labeled H2B histone driven by the tetracycline response element (TRE), which is turned off when mice are fed doxycycline. Starting at birth, mice were fed normal chow for 56 days to ensure GFP nuclear labeling of all basal and differentiated cells within the meibomian gland. Mice were then switched to doxycycline chow (2 mg/kg, Bio-Serv, Flemington, NJ), during which time GFP-labeled H2B was turned off, and cycling cells diluted nuclear GFP labeling two-fold with each division. Mice were kept on doxycycline for 56 days to remove all fast-cycling cells and then sacrificed by carbon dioxide asphyxiation. The upper eyelids were excised, fixed in 2% paraformaldehyde in PBS for 24 h and embedded in low-melting-point agarose. The agarose blocks were dehydrated through increasing levels of ethanol (50–75–90–100% at 30-min intervals) and then infiltrated with butyl methyl methacrylate resin (BMMA; Sigma-Aldrich Corp., St. Louis, MO) and polymerized under UV light at 4 °C as described previously [8]. The BMMA plastic blocks were serially sectioned at 2 μm using a Leica EM UC7 Ultramicrotome (Leica Biosystems, Nussloch, Germany) and Diatome® diamond knife (Nidau, Switzerland). This resulted in ordered ribbons of tissue comprised of 400 planes of 1.5 × 1.5 × 0.002 mm in size.
2.2. Antibody panel and metal conjugation
The antibody panel used in this experiment was designed to stain cellular/extracellular structures, nuclei, and GFP labeled stem cells. Anti-GFP (clone EPR14104; Abcam, Ab 220802) was custom-conjugated to the Dy162 isotope using Maxpar® X8 Antibody Labeling Kit (Fluidigm, catalog number 201162B) based on its user guide (PRD002). Briefly, the X8 polymer was pre-loaded with the lanthanide of interest and the purified carrier-free antibody was washed and partially reduced by TCEP solution under controlled time and temperature. Then, the antibody was conjugated with lanthanide-loaded polymer. It was ready to be used after a few washes.
All the other metal-tagged antibodies were purchased from Fluidigm Corporation and used at the concentrations shown in Table 1.
Table 1.
Antibodies used for IMC.
| Metal Tag | Antigen | Vendor | Clone | Catalog Number | Dilution (from 0.5 mg/mL stock) | Concentration on Tissue (μg/mL) |
|---|---|---|---|---|---|---|
|
| ||||||
| Pr141 | aSMA | Fluidigm | 1A4 | 3141017D | 1:200 | 2.5 |
| Nd143 | Vimentin | Fluidigm | D21H3 | 3143027D | 1:200 | 2.5 |
| Sm147 | Sox9 | Fluidigm | EPR14335 | 3147022D | 1:50 | 10 |
| Gd158 | E-cadherin | Fluidigm | 24E10 | 3158029D | 1:100 | 5 |
| Dy162 | GFP | Abcam | EPR14104 | ab220802 | 1:1000 | 0.5 |
| Er168 | Ki67 | Fluidigm | B56 | 3168022D | 1:100 | 5 |
| Tm169 | Collagen 1 | Fluidigm | Polyclonal | 3169023D | 1:200 | 2.5 |
2.3. Tissue staining
BMMA sections were deplasticized in acetone for 10 min and rehydrated in descending grades of ethanol (90, 70, and 50%) 10 min each followed by 2 washes in 1× PBS [8]. The rest of the steps were performed based on the user guide, Imaging Mass Cytometry Staining Protocol for FFPE Sections (PN 400322 A3), from Fluidigm. Heat-induced epitope retrieval was done for 30 min at 96 °C in target retrieval solution, pH 9, using a heat block. The slides were incubated with the metal-conjugated antibody cocktail (Table 1) overnight at 4 °C after being blocked in 3% BSA buffer. After washes on the following day, slides were stained with 0.5 μM Cell-ID™ Intercalator-Ir (Fluidigm, 201192B) to visualize the DNA. Upon air drying, the slides were ready to be imaged.
2.4. Imaging Mass Cytometry
Images were acquired using a research prototype instrument analogous in operating principle to the current Hyperion™ Imaging System [9] used for IMC, with modifications that enabled 400 Hz operation and 1.5 μm spot size.
2.5. Image processing
Data from each channel obtained with the prototype Imaging Mass Cytometry system were exported to 16-bit tiff files and loaded into Fiji [10] using the BioFormats import module. The per-channel information was converted into a stack of images of 16-bit data with each plane separated by 2 μm. As each plane occupied approximately 2.9 Mb of data, the 16-bit stacks were converted to 8-bit gray scale data, greatly reducing the size of the files.
The stacked data set from the 169 Tm-collagen channel was first imported into Amira 5.3.3 (Visage Imaging, http://www.visageimaging.com/) and then each plane of data translated and/or rotated relative to the adjacent upper and lower plane to align and reconstruct a three-dimensional data set (see Fig. 1). The transformations for each plane were then applied to the other data sets so that each stack of information was precisely co-registered with the other data sets.
Fig. 1.
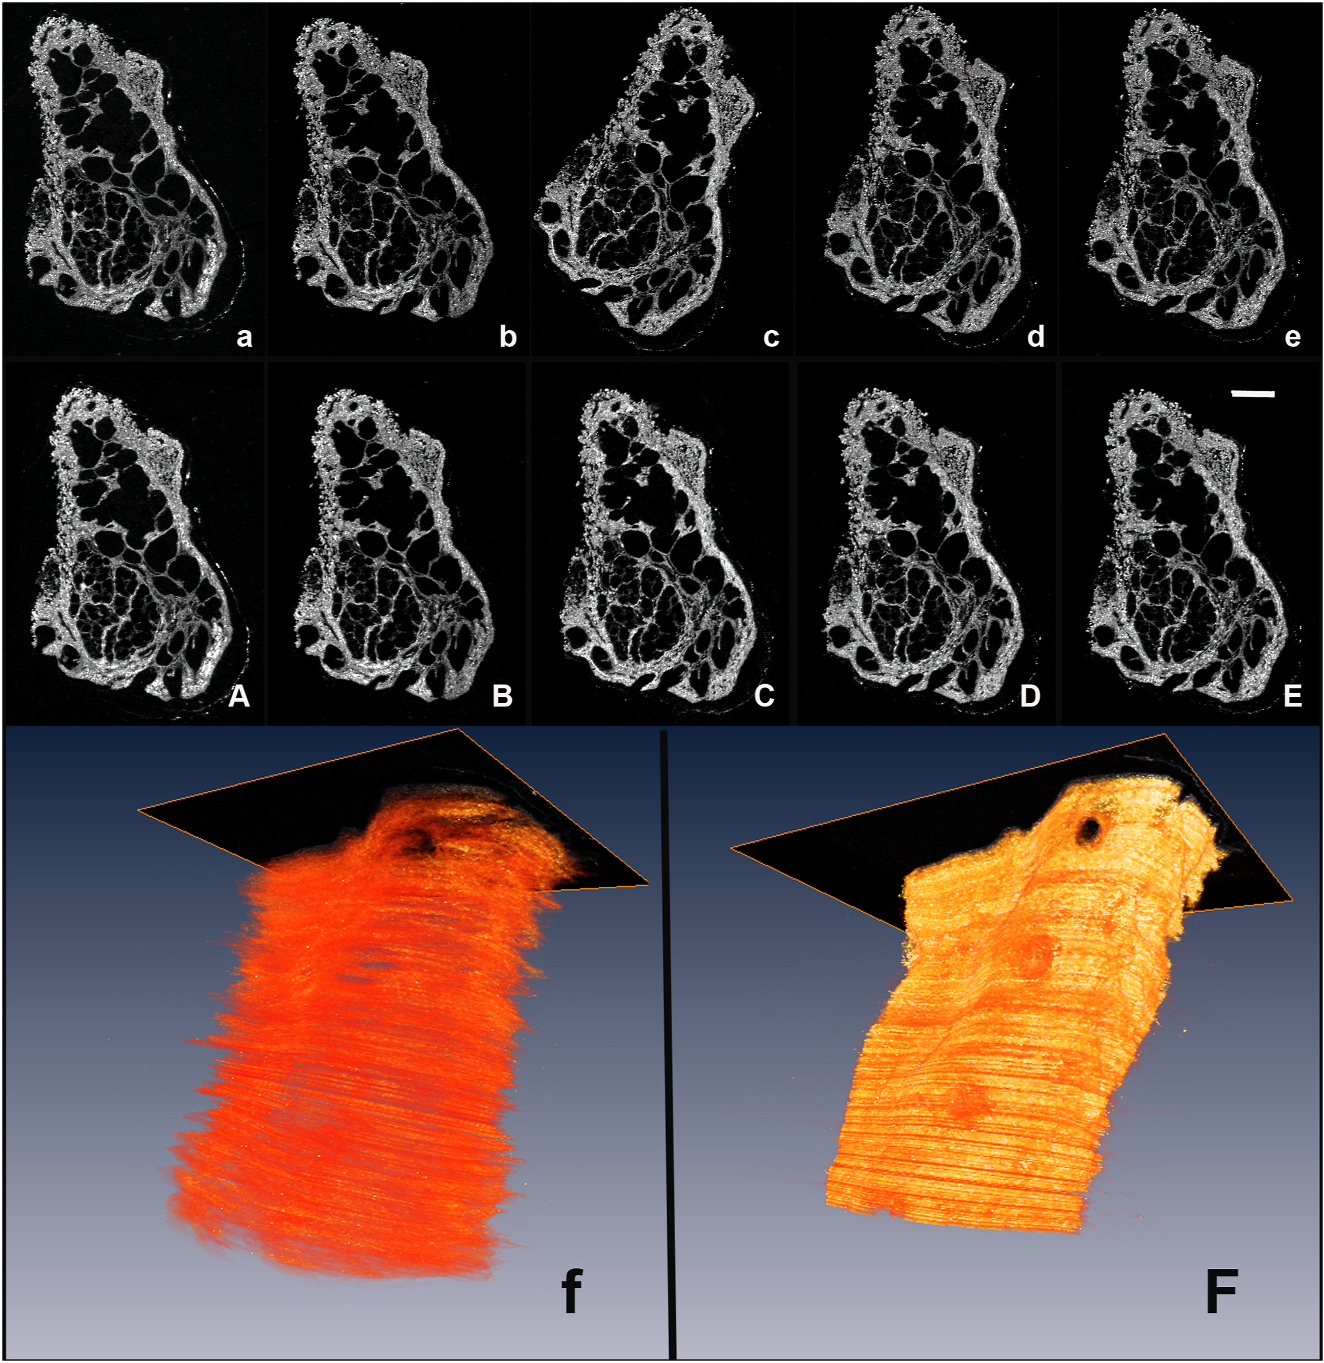
Alignment of image planes using Amira Software. Individual images from the collagen channel (a–e) were manually rotated and translated into an aligned stack (A–E). The improvement of alignment is shown in the 3D renderings of the collagen channel before (f) and after (F) alignment.
To identify the co-localization of GFP-labeled cells to other specific markers, individual planes from each channel were assembled into stacks using the Import Special subroutine in the MetaMorph® Image Processing Software (Molecular Devices, Inc., Downingtown, PA, USA). Each image stack was then saved and processed for noise reduction using the Despeckle program in Fiji. Stacks were then viewed in MetaMorph, and identical regions of interest (ROIs) for each channel were identified using the Stack/Keep Planes and the Create Regions/Duplicate Stack subroutines in MetaMorph. Small 3D ROIs were then generated. These ROIs combined the collagen (Blue), GFP (Green), and marker of interest (Red) into an RGB image using the Overlay subroutine in MetaMorph. A sample ROI, shown in Fig. 2, localizes GFP-label-retaining cells (A, arrow) to nuclei (A), Ki67 (B), Sox 9 (C), E-cadherin (D), vimentin (E) and αSMA (F). As shown in earlier studies, GFP-labeled nuclei, a marker for slow-cycling cells, appeared to be localized to the interface between the acinar cells and ductal epithelium as suggested by the stronger E-cadherin staining of GFP-labeled cells (D).
Fig. 2.
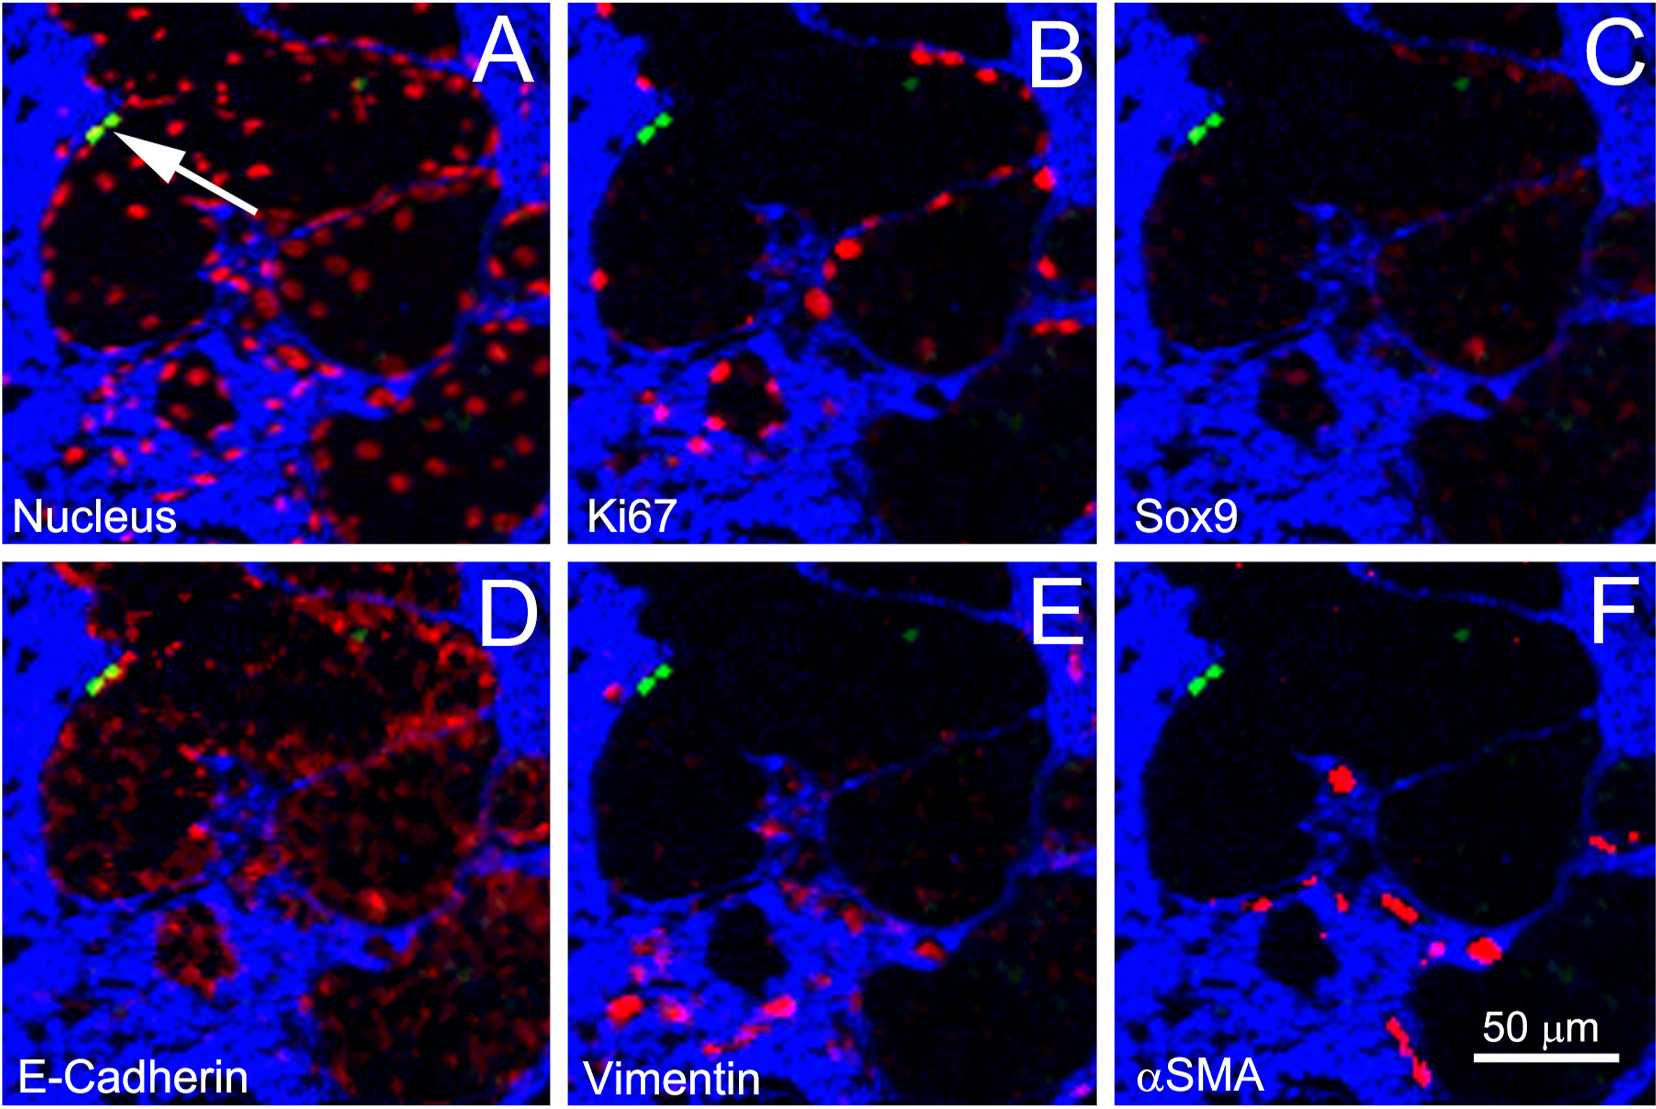
Localization of GFP-label-retaining cells (Green), with collagen (Blue) and other markers (Red) for nucleus (A), Ki67 (B), Sox9 (C), E-cadherin (D), vimentin (E), and αSMA (F).
2.6. 3D Data visualization
Within the Amira software, the data sets were segmented on a plane-by-plane basis to identify the specific staining pattern for each antibody employed. Surfaces of the segmented information were rendered and visualized within the software. It was noted that the renderings of the complete tissue, which included hair follicles and muscle and connective tissue overlaid and mingled with the meibomian gland structures, make the visualization of the GFP-retaining cells difficult (Fig. 3). To overcome this, the aligned data sets were exported out of Amira and loaded into Fiji. Using the collagen data set, the glandular structures were highlighted as negative space bordered by the positive signal from the collagen stain as previously described [11]. Each plane of the collagen stack was subsequently used to define a mask of meibomian gland structures that was then applied to the remaining stacks with information outside of the mask deleted from each plane. These trimmed stacks were then saved and transferred back to Amira for visualization (Fig. 4, and Supplemental Movie 1).
Fig. 3.
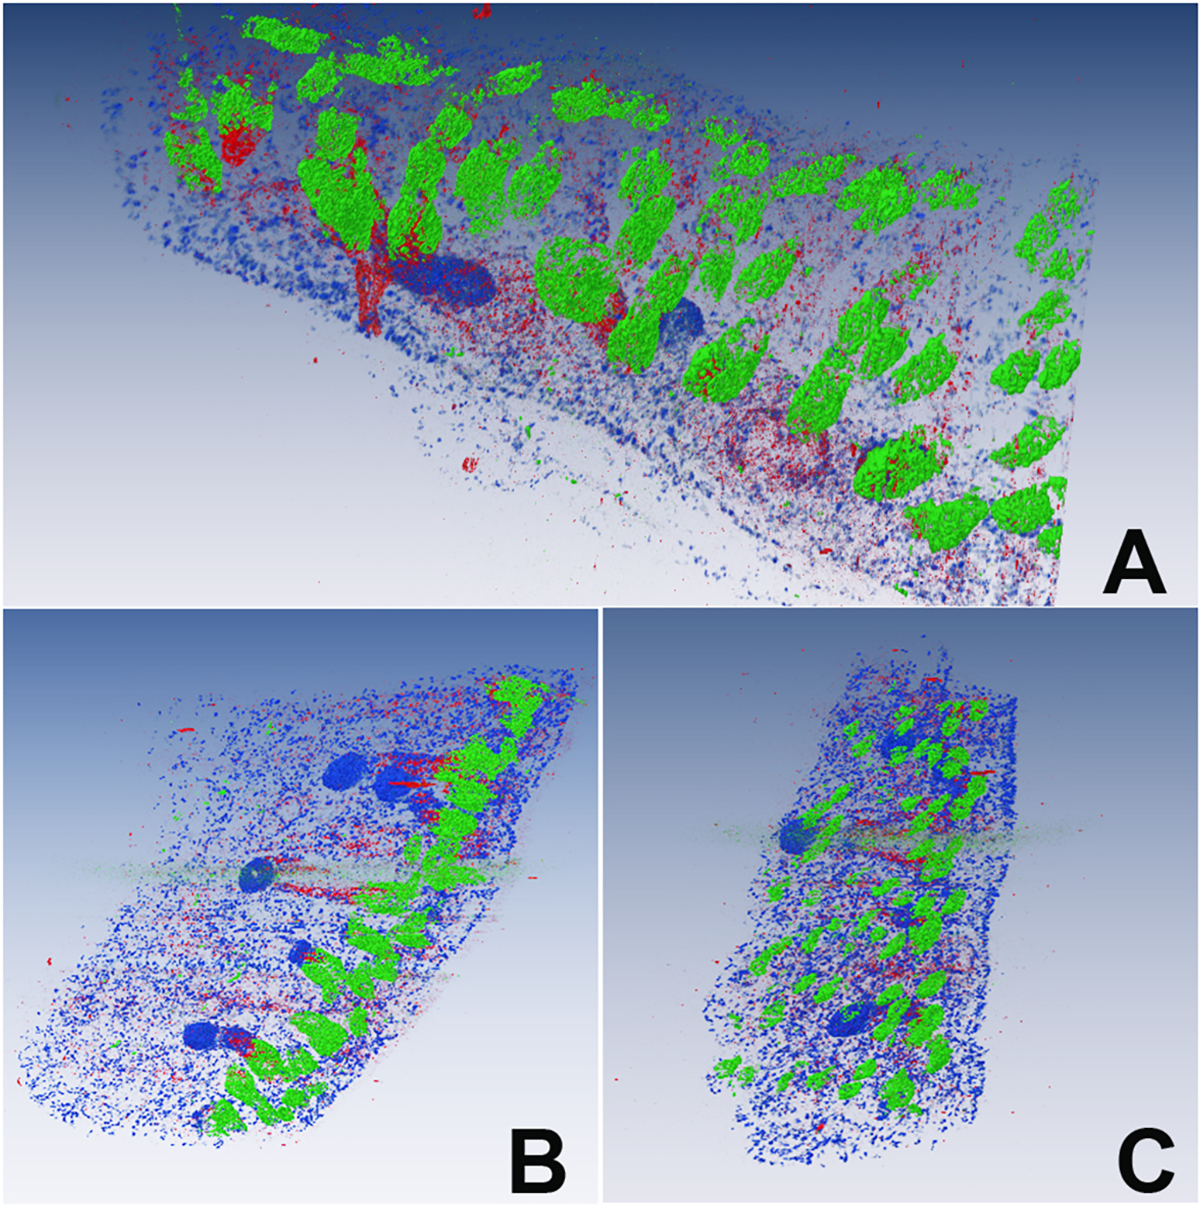
3D reconstruction of the entire tissue data set showing 3–4 meibomian glands embedded in the eyelid along with GFP-labeled bulge cells of the hair follicle (Green), Ki67-labeled proliferating cells (Blue), and Sox9-labeled cells (Red) at different orientations (A–C).
Fig. 4.
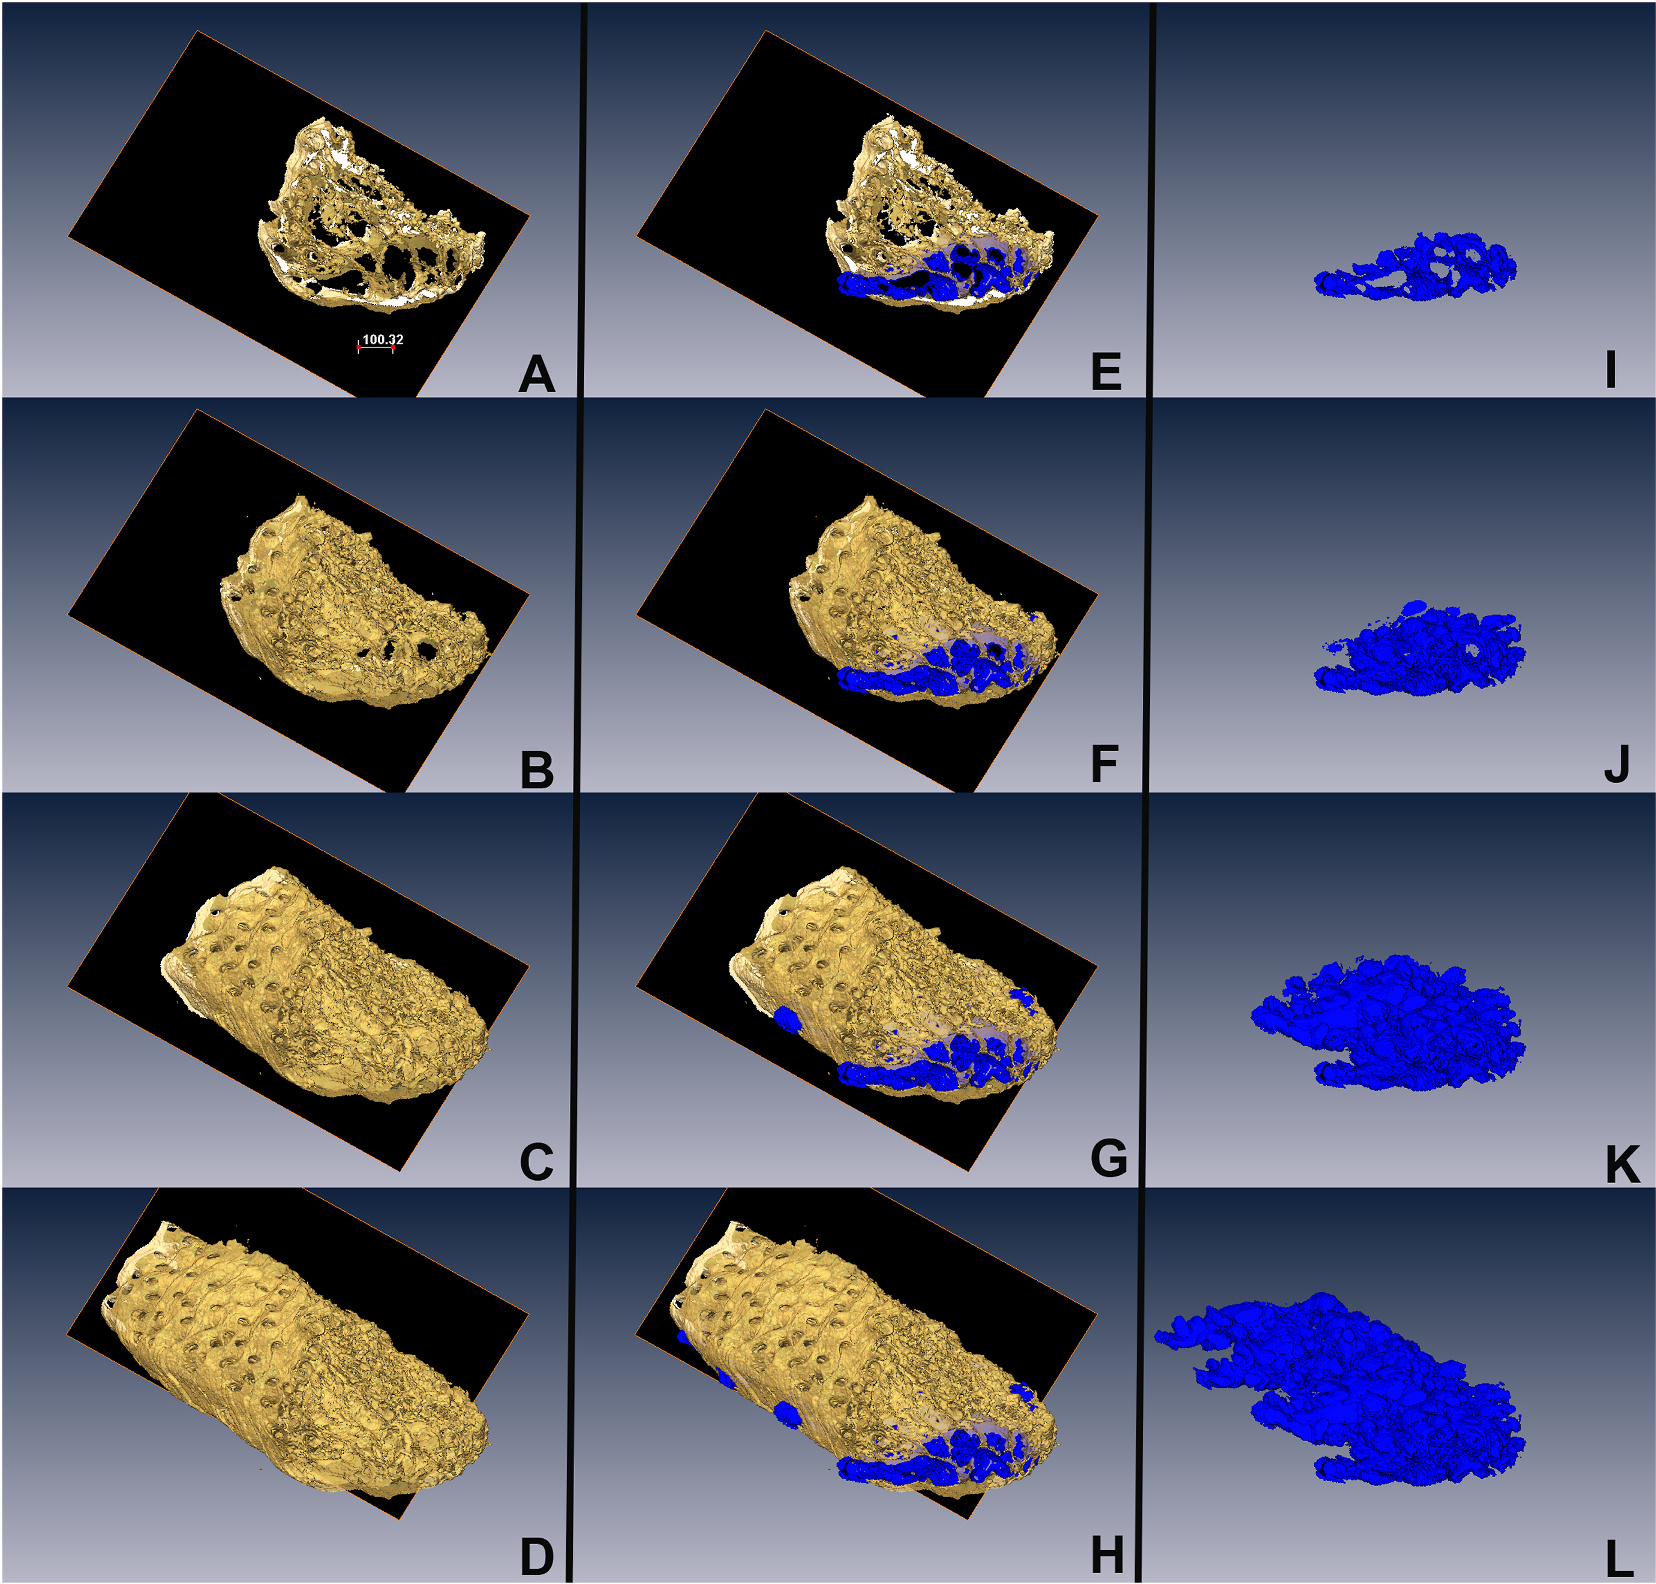
Segmentation of the meibomian gland from the eyelid using the collagen channel as a mask (A–D, Gold). For each plane, non-collagen regions were identified (E–H, Blue) and then reconstructed to identify the meibomian glands in the eyelid tissue (I–L).
Supplementary video related to this article can be found at https://doi.org/10.1016/j.jtos.2022.04.008
Fig. 5 demonstrates the volumetric reconstruction of the meibomian glands of the tissue as well as the localization of the label-retaining H2B-GFP cells (green channel), Sox9 (red channel), and Ki67 (blue channel). No overlap between the H2B-GFP cells and the cells containing Ki67 was observed (Supplemental Movie 2).
Fig. 5.
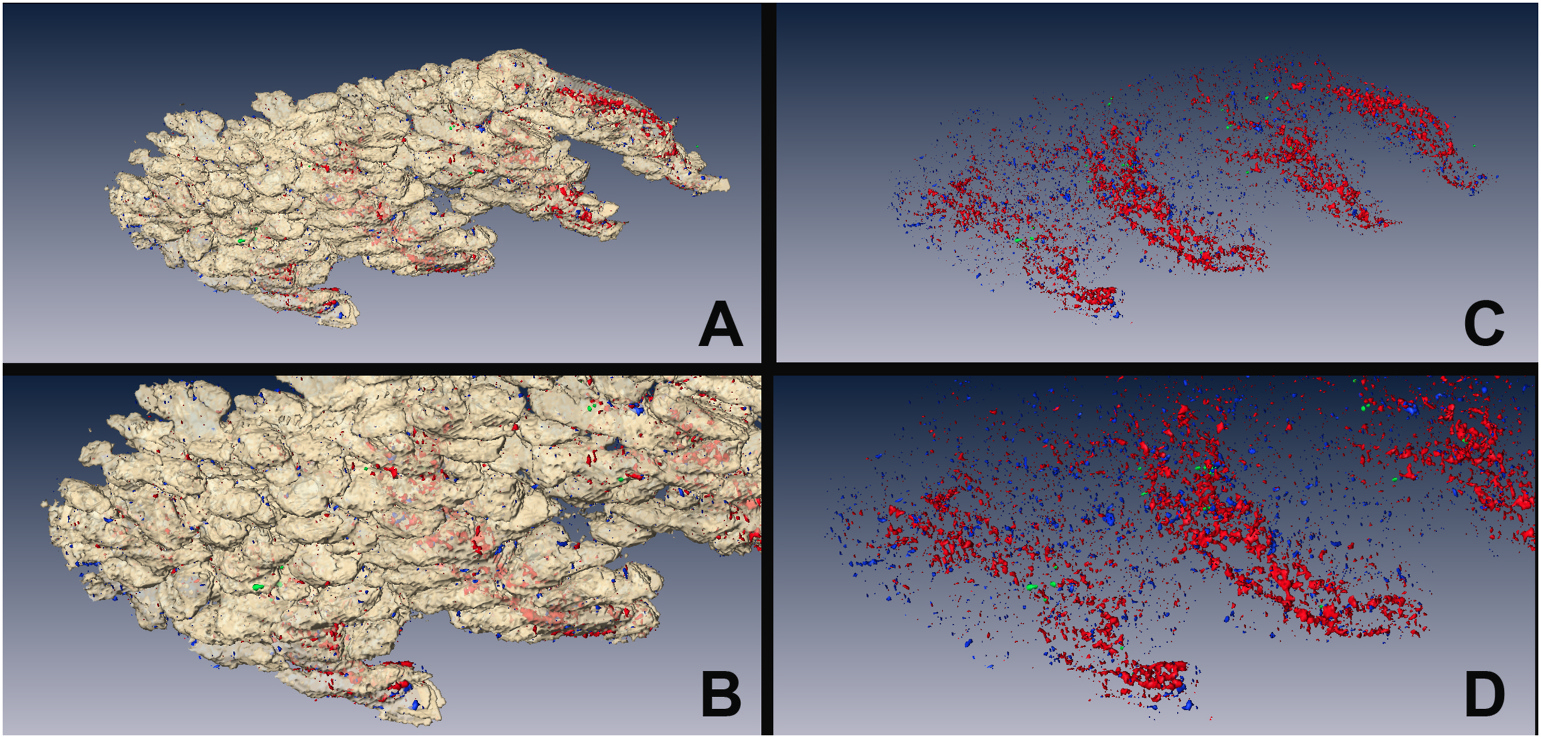
Using the segmented region of the meibomian gland as a mask, the non-meibomian gland eyelid tissue was extracted from the 3D reconstruction to reveal the shape of the gland (A and B, white shell) and the spatial distribution of GFP-label-retaining cells (Green), Ki67-proliferating cells (Blue), and E-cadherin-positive ductal epithelium (Red) as shown in C and D.
3. Discussion
While a recent report demonstrates the capability of performing 3D IMC using paraffin embedded tissue [12], to our knowledge this report presents for the first time a technique for combining Immuno Tomography and Imaging Mass Cytometry to generate 3D IMC data sets using plastic embedded (BMMA) tissue sections for better preservations of tissue morphology. This technique may be valuable in characterizing rare and small-sized cell populations within tissues, and particularly useful for probing stem cell populations. As we have previously shown, IT can be used to identify rare, label-retaining cells in both the meibomian gland and cornea. These label-retaining cells are comprised of 1–4 cell clusters, localized to the interfacial regions of the tissue, including the acinar-duct and cornea-limbus [5–7]. The identification of these clusters can be achieved only through serial sectioning of tissue to identify the rare tissue section containing very slow-cycling cells. This very low frequency of detection severely limits the ability to even partially characterize the niche environment, and to identify the supporting cell types. Even using IT, there are a limited number of times that plastic tissue sections can be stripped and re-probed to gain a better understanding of this unique cell population [8].
On the other hand, IMC has the ability to probe multiple antigens on a single tissue section to characterize different cell populations and tissue structures more completely than is possible using conventional IHC or IT. Some 30 to 40 antibodies labeled with heavy metal ions can be used to map multiple cell populations, identifying cell frequency and cell associations. This highly multiplexed approach to IHC has already had major impacts on characterizing cancer phenotypes [2,13], identifying tumor/immune cell interactions [14], and generating cell-tissue atlases [15]. In a recent study, Kuett et al. have used 3D IMC to spatially characterize a ductal breast carcinoma sample using 152 serial paraffin slices [12]. So far, IMC was limited to staining paraffin sections, which are generally not ideal for serial sectioning, therefore restricting the IMC application domain. However, combining the better preservation of tissue structure using plastic embedding and immunostaining techniques with the ability to perform highly multiplexed staining using IMC opens a novel and unique approach for probing stem cell populations.
This new ability to perform 3D IMC may be particularly valuable for characterizing and confirming single-cell RNA sequencing (scRNAseq) data that can identify unique cellular biomarkers, differentiation pathways, and potential transcription/signaling networks controlling tissue organization. Recently, unbiased, computational bioinformatic analysis has been used to identify biomarkers for corneal epithelial stem cells, early transient amplifying cells, mature amplifying cells, and differentiated corneal epithelial cells in the mouse [16]. Successful application of single-cell RNA transcriptomics has also been used to classify human corneal epithelial cell populations and to build a single-cell atlas of the human cornea [17–21]. Using the information obtained from scRNAseq and evaluating those results with the techniques described here to simultaneously identify up to 40 biomarkers have the potential to fully characterize the spatial relationships between biomarkers identified by scRNAseq, thus providing researchers with a powerful new tool. Importantly, using the H2B-GFP mouse and pulse-chase labeling of putative stem cells, variable slow-cycling cell populations can be directly correlated to unbiased, single-cell sequencing pathway projections, which will help in establishing a stem cell differentiation atlas for the cornea and meibomian gland.
As demonstrated here, 3D IMC is a novel imaging technique, although not one without a couple limitations. First, we limited the antibodies used in this study to those already developed by Fluidigm and known to have some cross-reactivity to mouse antigens. However, as indicated in Table 1, most of these antibodies showed weak reactivity as noted by the high concentrations that were used for section staining, except for anti-GFP. In cases where antibodies are used at low dilutions, this can increase the cost of immunostaining slides. For future studies, a wider range of antibodies specific for mouse needs to be identified and labeled, which may require considerable effort. The second limitation concerns the time required to scan 400 tissue sections. For the current study we imaged a small region of 639 μm × 860 μm at 1.5 μm resolution which took around 16 min/section and less than 4.5 days to complete imaging all 400 sections. In contrast, a similar study using the current commercially available Hyperion™ Imaging System would take approximately 26 min/section to image, or approximately 7 days to cover 400 sections, thus nearly doubling the time required to generate the data. This limitation might be minimized by prescreening the sections using fluorescence-based IT to identify regions containing cells of interest and then reducing the number of sections scanned to only one slide, thus reducing the IMC instrument time by 80–90%. This approach would result in identification of rare cells in 3-dimensional space using fluorescence imaging followed by deeper characterization of the identified cells and their ROIs with IMC. A similar approach has been described by Gerdtsson et al. to identify and characterize rare tumor cells in liquid biopsies [22].
In summary, our work shows the compatibility of IMC workflow with BMMA embedded tissue sections offering a superior platform for 3D imaging via array tomography.
Supplementary Material
Acknowledgement
We would like to thank Dr. Liang Lim and Taunia Closson, Standard BioTools Canada Inc., for their help with data transfer and image acquisition, respectively.
Supported by: NIH/NEI EY021510, an Unrestricted Grant from Research to Prevent Blindness, Inc. RPB-203478, and the Skirball Program in Molecular Ophthalmology.
Footnotes
Declaration of competing interest
L.G., D.S and A.L. are employees of, and receive remuneration from Standard BioTools (formerly Fluidigm) Corporation. Otherwise, the authors declare that they have no conflict of interest.
Fluidigm, Cell-ID, Hyperion, Imaging Mass Cytometry, IMC and Maxpar are trademarks and/or registered trademarks of Fluidigm Corporation or its affiliates in the United States and/or other countries. All other trademarks are the sole property of their respective owners.
For Research Use Only. Not for use in diagnostic procedures.
References
- [1].de Vries NL, van Unen V, Ijsselsteijn ME, Abdelaal T, van der Breggen R, Farina Sarasqueta A, et al. High-dimensional cytometric analysis of colorectal cancer reveals novel mediators of antitumour immunity. Gut 2020;69:691–703. [DOI] [PMC free article] [PubMed] [Google Scholar]
- [2].Giesen C, Wang HA, Schapiro D, Zivanovic N, Jacobs A, Hattendorf B, et al. Highly multiplexed imaging of tumor tissues with subcellular resolution by mass cytometry. Nat Methods 2014;11:417–22. [DOI] [PubMed] [Google Scholar]
- [3].Newell EW, Sigal N, Bendall SC, Nolan GP, Davis MM. Cytometry by time-of-flight shows combinatorial cytokine expression and virus-specific cell niches within a continuum of CD8+ T cell phenotypes. Immunity 2012;36:142–52. [DOI] [PMC free article] [PubMed] [Google Scholar]
- [4].Ijsselsteijn ME, van der Breggen R, Farina Sarasqueta A, Koning F, de Miranda N. A 40-marker panel for high dimensional characterization of cancer immune microenvironments by imaging mass cytometry. Front Immunol 2019;10:2534. [DOI] [PMC free article] [PubMed] [Google Scholar]
- [5].Parfitt GJ, Geyfman M, Xie Y, Jester JV. Characterization of quiescent epithelial cells in mouse meibomian glands and hair follicle/sebaceous glands by immunofluorescence tomography. J Invest Dermatol 2015;135(4):1175–7. 10.1038/jid.2014.484. [DOI] [PMC free article] [PubMed] [Google Scholar]
- [6].Parfitt GJ, Kavianpour B, Wu KL, Xie Y, Brown DJ, Jester JV. Immunofluorescence tomography of mouse ocular surface epithelial stem cells and their niche microenvironment. Invest Ophthalmol Vis Sci 2015;56:7338–44. [DOI] [PMC free article] [PubMed] [Google Scholar]
- [7].Parfitt GJ, Lewis PN, Young RD, Richardson A, Lyons JG, Di Girolamo N, et al. Renewal of the holocrine meibomian glands by label-retaining, unipotent epithelial progenitors. Stem Cell Rep 2016;7:399–410. [DOI] [PMC free article] [PubMed] [Google Scholar]
- [8].Parfitt GJ, Xie Y, Reid KM, Dervillez X, Brown DJ, Jester JV. A novel immunofluorescent computed tomography (ICT) method to localise and quantify multiple antigens in large tissue volumes at high resolution. PLoS One 2012;7:e53245. [DOI] [PMC free article] [PubMed] [Google Scholar]
- [9].Straus RN, Carew A, Sandkuijl D, Closson T, Baranov CVI, Loboda A. Analytical figures of merit for a novel tissue imaging system. J. Anal. At. Spectrom. 2017;32:1044–51. [Google Scholar]
- [10].Schindelin J, Arganda-Carreras I, Frise E, Kaynig V, Longair M, Pietzsch T, et al. Fiji: an open-source platform for biological-image analysis. Nat Methods 2012;9:676–82. [DOI] [PMC free article] [PubMed] [Google Scholar]
- [11].Jester BE, Nien CJ, Winkler M, Brown DJ, Jester JV. Volumetric reconstruction of the mouse meibomian gland using high-resolution nonlinear optical imaging. Anat Rec 2011;294:185–92. [DOI] [PMC free article] [PubMed] [Google Scholar]
- [12].Kuett L, Catena R, Özcan A, Plüss A, Ali HR, Sa’d MA, et al. Three-dimensional imaging mass cytometry for highly multiplexed molecular and cellular mapping of tissues and the tumor microenvironment. Nat Cancer 2022;3(1):122–33. 10.1038/s43018-021-00301-w. [DOI] [PMC free article] [PubMed] [Google Scholar]
- [13].Ali HR, Jackson HW, Zanotelli VRT, Danenberg E, Fischer JR, H B, et al. Imaging mass cytometry and multiplatform genomics define the phenogenomic landscape of breast cancer. Nat Can (Que) 2020;1:163–75. [DOI] [PubMed] [Google Scholar]
- [14].Elaldi R, Hemon P, Petti L, Cosson E, Desrues B, Sudaka A, et al. High dimensional imaging mass cytometry panel to visualize the tumor immune microenvironment contexture. Front Immunol 2021;12:666233. [DOI] [PMC free article] [PubMed] [Google Scholar]
- [15].Singh N, Avigan ZM, Kliegel JA, Shuch BM, Montgomery RR, Moeckel GW, et al. Development of a 2-dimensional atlas of the human kidney with imaging mass cytometry. JCI Insight 2019;4. [DOI] [PMC free article] [PubMed] [Google Scholar]
- [16].Kaplan N, Wang J, Wray B, Patel P, Yang W, Peng H, et al. Single-cell RNA transcriptome helps define the limbal/corneal epithelial stem/early transit amplifying cells and how autophagy affects this population. Invest Ophthalmol Vis Sci 2019;60:3570–83. [DOI] [PMC free article] [PubMed] [Google Scholar]
- [17].Collin J, Queen R, Zerti D, Bojic S, Dorgau B, Moyse N, et al. A single cell atlas of human cornea that defines its development, limbal progenitor cells and their interactions with the immune cells. Ocul Surf 2021;21:279–98. [DOI] [PMC free article] [PubMed] [Google Scholar]
- [18].Collin J, Queen R, Zerti D, Dorgau B, Georgiou M, Djidrovski I, et al. Co-expression of SARS-CoV-2 entry genes in the superficial adult human conjunctival, limbal and corneal epithelium suggests an additional route of entry via the ocular surface. Ocul Surf 2021;19:190–200. [DOI] [PMC free article] [PubMed] [Google Scholar]
- [19].Dou S, Wang Q, Qi X, Zhang B, Jiang H, Chen S, et al. Molecular identity of human limbal heterogeneity involved in corneal homeostasis and privilege. Ocul Surf 2021;21:206–20. [DOI] [PubMed] [Google Scholar]
- [20].Li DQ, Kim S, Li JM, Gao Q, Choi J, Bian F, et al. Single-cell transcriptomics identifies limbal stem cell population and cell types mapping its differentiation trajectory in limbal basal epithelium of human cornea. Ocul Surf 2021;20:20–32. [DOI] [PMC free article] [PubMed] [Google Scholar]
- [21].Li JM, Kim S, Zhang Y, Bian F, Hu J, Lu R, et al. Single-cell transcriptomics identifies a unique entity and signature markers of transit-amplifying cells in human corneal limbus. Invest Ophthalmol Vis Sci 2021;62:36. [DOI] [PMC free article] [PubMed] [Google Scholar]
- [22].Gerdtsson E, Pore M, Thiele JA, Gerdtsson AS, Malihi PD, Nevarez R, et al. Multiplex protein detection on circulating tumor cells from liquid biopsies using imaging mass cytometry. Converg Sci Phys Oncol 2018;4. [DOI] [PMC free article] [PubMed] [Google Scholar]
Associated Data
This section collects any data citations, data availability statements, or supplementary materials included in this article.


