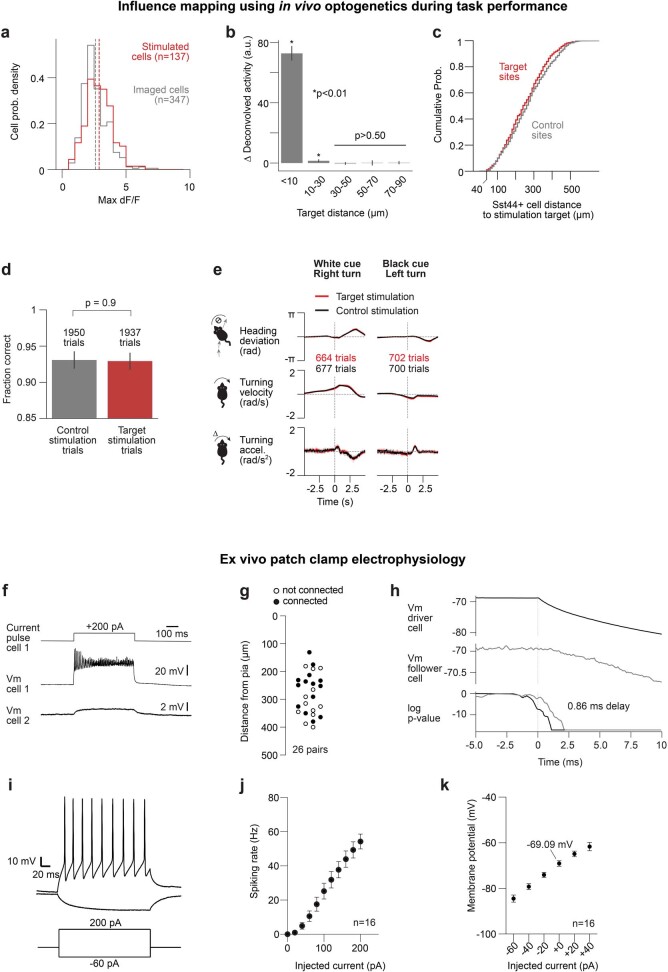
Extended Data Fig. 3. Characterization of in vivo influence mapping and slice electrophysiology experiments.
a, Distribution of peak dF/F of Sst44 cells during photostimulation sessions (n = 20) and during paired sessions from the same field of view without photostimulation (n = 20). Dashed lines indicate the mean of each distribution. 4 mice. b, Change in deconvolved cell activity as a function of the photostimulation target distance. p-values evaluated using the Wilcoxon signed rank test vs zero across trials. Number of trials: < 10 µm: 600, 10–30 µm: 600, 30–50 µm: 800, 50–70 µm: 350, 70–90 µm: 300. 12 isolated cells, 6 mice. Mean and bootstrapped 95% confidence intervals are shown. c, Distribution of target and control sites from influenced (non-stimulated, >40 µm from nearest target) Sst44+ cells. 141 target sites and 141 control sites total. The total number of target sites is slightly larger than the number of stimulated Sst44 cells (n = 137) because some photostimulated cells were not detected by the cell detection algorithm if they were not successfully stimulated. d–e, Stimulating 4–10 Sst44 cells in PPC does not change the mouse’s choice or turning behaviour. d, Fraction correct on control and target trials. p-value evaluated with Wilcoxon rank-sum test across trials. e, Turning behaviour triggered on photostimulation on target and control trials. Mean and bootstrapped 95% confidence intervals are shown. 4 mice, 20 sessions. f–k, Characterization of Sst44 cell electrophysiology. f, Mean membrane voltage from an example connected pair of Sst44 cells shown with a positive current pulse. g, Distribution of distance of cell pairs from pia. h, Example trace showing how we computed the delay in the membrane voltage deflection between the driver and follower cell. For each cell, we computed the p-value (Wilcoxon rank-sum test, one-sided) at each time point by comparing a sliding 2 ms window to an equivalent window centred at 1.5 ms before the pulse onset and computed the average time delay (horizontal distance between the two log(p) curves) between natural log(p) values of −5 and −10. Natural log is plotted. See Methods for more details. i–k, Characterization of intrinsic excitability. i, Example trace showing membrane voltage in response to a positive and negative current pulse. j, Spiking rate as a function of injected current. k, Membrane potential as a function of injected current. Mean and s.e.m. are shown in j–k.

