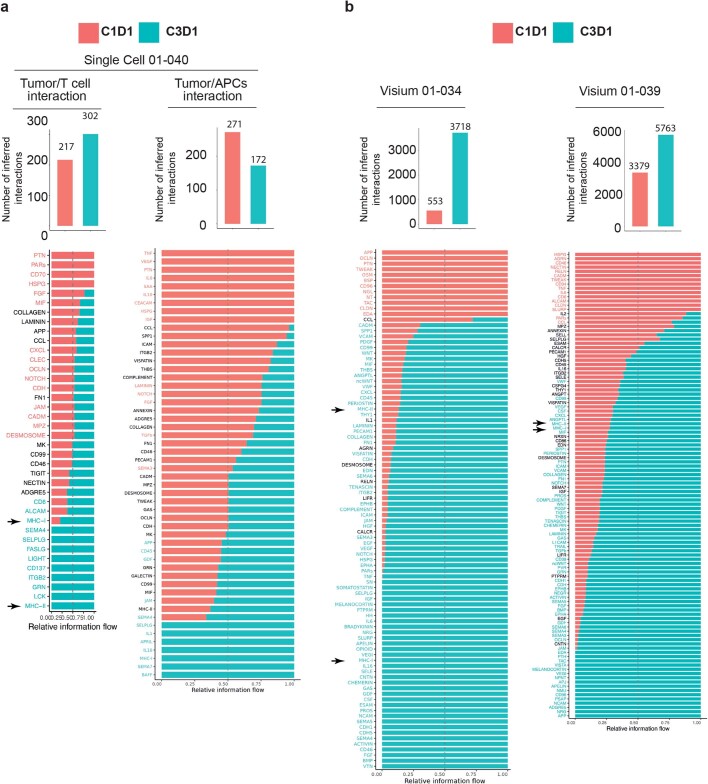
Extended Data Fig. 6. NP137 treatment impacts tumor cell communication with immune cell types.
a, Histograms showing the number of inferred interaction (upper panel) from the single cell RNA seq analysis (patient 01-040) by CellChat packages and (lower panel) the significant genes were ranked based on their differences of overall information flow between C1D1 and C3D1. The left panels investigate the communication between Tumor and lymphocyte cells. The right panels investigate the communication between Tumor and APCs. b, Histograms showing the number of inferred interaction (upper panel) from the Visium assays (patients 01-034 and 01-039) by CellChat packages and (lower panel) the significant genes were ranked based on their differences of overall information flow between C1D1 and C3D1. The left and right panels correspond respectively to patient 01-034 and 01-039. Red and green are more enriched in C1D1 and C3D1 sample, respectively. Arrows indicate MHC-I and II genes which expression is enriched in C3D1 samples.

