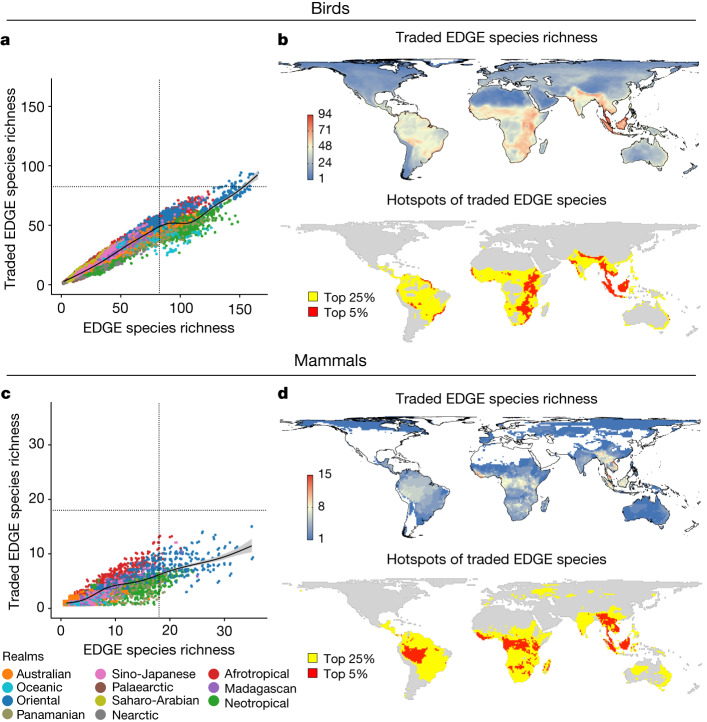
Fig. 2. Species richness of the top 25% of traded EDGE species of birds and mammals.
a,b, Birds (n = 997). c,d, Mammals (n = 270). b,d, Maps (b) and hotspots (d) of EDGE species richness. Cells highlighted yellow represent the top 25% of grid cells and those in red represent the top 5%. a,c, Relationship between species richness of the top 25% of traded species and the top 25% of overall species for each measure. Cells are colour coded by biogeographic realm. Black lines in scatterplots indicate a LOESS fit. Points jittered to avoid overlap in low EDGE species richness areas (see Supplementary Fig. 3 for greater clarity on trends within each biogeographic realm).

