

Abstract
In this study, an environmentally friendly “high-performance liquid chromatography (HPLC)” assay to quantify isotretinoin (ITN) in commercial products and solubility samples is designed and verified. A Nucleodur reverse-phase C18 column was used as the stationary phase to identify ITN. The ecologically friendly mobile phase was composed of ethyl acetate and ethanol (50:50 v/v), and it was delivered at a flow rate of 1.0 mL/min. ITN was measured at 354 nm in wavelength. The current HPLC method had a determination coefficient of 0.9994 and was linear in the 0.2–80 μg/g range. The current protocol for ITN measurement was also rapid (retention time = 2.78 min), accurate (%recoveries = 98.60–101.52), precise (% uncertainties = 0.71–0.98), and sensitive. According to the AGREE methodology, the current procedure received an outstanding greenness profile with an AGREE score of 0.76. By determining ITN in commercial products and solubility samples, the applicability of the current approach was proven. ITN was discovered to be present in 98.43% and 100.84%, respectively, of commercial capsule brands A and B. The ITN's solubility in numerous eco-friendly solvents was successfully measured. Under different stress conditions, the current approach was able to distinguish between its degradation products, demonstrating its stability-indicating characteristics. These findings indicated that ITN in procured capsules and solubility samples might be regularly tested by the suggested approach.
Keywords: AGREE, Isotretinoin, Environmentally friendly HPLC, Solubility, Validation
1. Introduction
An endogenous form of vitamin A, isotretinoin (ITN) (Fig. 1) is a retinoic acid's derivative [1]. It was first made available in 1979 to treat severe nodulocystic acne [2]. ITN is frequently used to treat a wide range of dermatological conditions, including acne, psoriasis, skin cancer, and ultra-violet (UV) aging, as well as to control epithelial cell proliferation and differentiation, sebum production, and collagen synthesis [[3], [4], [5]]. It can limit sebum secretion, diminish testosterone's ability to be converted to active dihydrotestosterone (DHT), and decrease 5-reductase activity [5,6]. Additionally, it can stop propionibacterium acnes from multiplying [6]. Studies on pigmentary diseases [7], photoaging [8], in-vitro and in-vivo carcinogenesis [9], and photoaging have all sparked interest in the preventative and therapeutic effects of ITN. Due to the teratogenicity of these substances, retinoid levels should also be evaluated [10,11]. Recently, a practical method for administering ITN orally to pediatric patient with neuroblastoma has been suggested [12]. It is a highly hydrophobic compound, which creates the difficulties in its dosage form design [13].
Fig. 1.
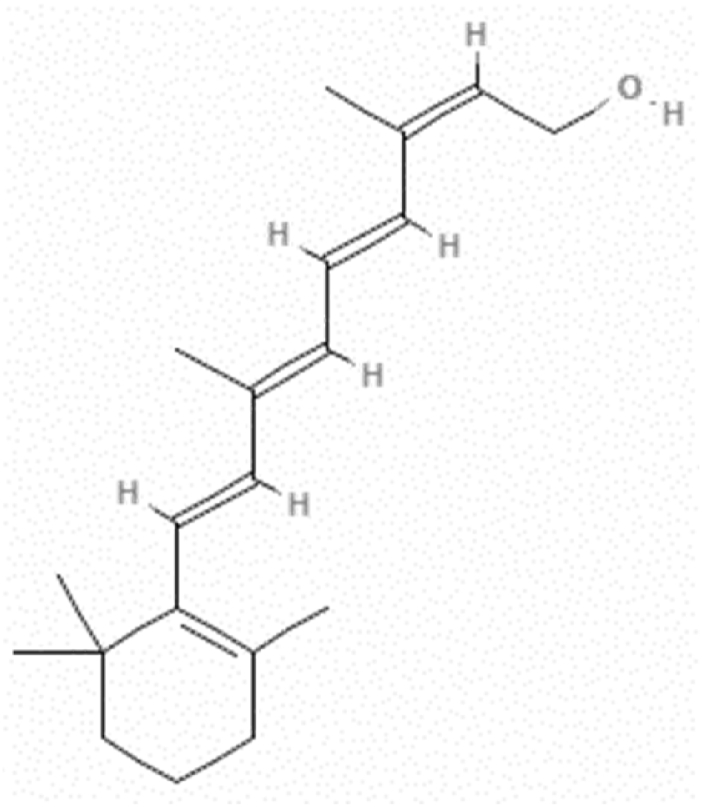
Molecular structure of isotretinoin (ITN).
Due to the photolability, thermal sensitivity as well as proneness to oxidation of retinoids including ITN, their quantitative measurement in pharmaceutical products is crucial for the stability-indicating tests and quality control of finished products [14]. Several techniques, including gas chromatography [15,16], microcalorimetry [17], thin layer chromatography (TLC), preparative layer chromatography [18], capillary zone electrophoresis, and micellar electrokinetic capillary chromatography [19,20] techniques have been used to determine ITN in commercial products and raw materials. Spectrophotometric techniques have been exploited to examine the photodegradability of tretinoin and ITN in liposomal and miroemulsion formulations [3,21]. For the quantitative estimation of ITN as well as its metabolite in biological samples, a variety of liquid chromatographic techniques have been used, including high-performance liquid chromatography (HPLC) with detections ranging from UV detection [[21], [22], [23], [24]], mass spectrometry [[25], [26], [27], [28]] or tandem mass spectrometry [29,30]. Numerous HPLC methods with UV detection have also been reported to determine ITN in pharmaceutical dosage forms [[31], [32], [33]].
Although the aforementioned techniques can identify and quantify ITN, the majority of the reported techniques have several drawbacks, such as low sensitivity, extended run times, laborious extraction and sample preparation processes, and increased utilization of environmentally unfavorable solvents like acetonitrile or tetrahydrofuran. Prior to being disposed-off into the ecosystem, these solvents were made to undergo various treatments. In order to reduce the damaging effects of hazardous solvents on the environment, one among the twelve principles of green chemistry lays emphasis on the application of alternative green/environmentally friendly solvents [34]. Literature survey of the works performed during the past 15 years demonstrates the exponential rise of application of ecologically benign and greener solvents [35,36]. Additionally, Capello [37] put up a concept for evaluating the effects of solvents on the environment based on the use of two environmental evaluation approaches i.e., environmental, health and safety assessment method [38] and life-cycle assessment method [39]. Different approaches have been put forward for assessing the environment friendly profile of analytical assays [[40], [41], [42], [43], [44]]. All twelve green analytical chemistry (GAC) principles, however, are only taken into consideration by the “analytical GREEnness (AGREE)” metric methodology among those approaches [42]. The described analytical methods of ITN measuring have not yielded a greenness index. In light of this, the purpose of this study was to create an environmentally friendly approach to identify and quantify ITN in commercial products and solubility samples utilizing isocratic stability-indicating HPLC connected to UV–Vis detector. Additionally, it is also intended to calculate the developed method's greenness profile by means of “AGREE: The Analytical Greenness Calculator”. The “International Council for Harmonization (ICH)-Q2-R1” procedures [45] were followed in the validation of the current technique for determining ITN.
2. Materials and methods
2.1. Materials
The working reference of ITN was acquired from “BOC Sciences (Shirley, NY, USA)”. HPLC-grade eluents, including, methyl alcohol (MeOH), ethyl acetate (EA), acetone (Ace), and ethyl alcohol (EtOH) were procured from “E-Merck (Darmstadt, Germany)”. HPLC-grade water was procured using “Milli-Q® water purifier (Millipore, Lyon, France)”. Analytical grades were used for all additional materials and reagents. Commercial soft gelatin capsule brand A and B of ITN were procured from local pharmacy shop in Riyadh, Saudi Arabia.
2.2. Instrumentation and analytical procedures
“Waters HPLC system (Waters, Milford, MA, USA)”, comprised of 1515 isocratic pump, 717 automatic sampler, UV–visible wavelength detector, a column oven, SCL 10AVP system controller, and an inline vacuum degasser, was used to quantify ITN at 25 ± 1 °C. The “Millennium program (version 32, Milford, MA, USA)” was utilized to process and interpret the data. A Nucleodur (dimensions: 150 mm × 4.6 mm and particle size: 5 μm) RP C18 analytical column was used to measure ITN. The eco-friendly eluent method utilized was a binary mixture of EA and EtOH (50:50% v/v). A flow of 1 mL/min was used to pump the mobile phase. The wavelength of ITN was determined to be 354 nm. The injection volume was for each sample was 20 μL, which was injected via waters autosampler.
2.3. ITN calibration curve
The needed quantity of ITN was dissolved to create an ITN stock solution with a 100 μg/g concentration using a green eluent system in triplications (n = 3). Using the green eluent system, the necessary aliquots from the stock solution of ITN (100 μg/g) were diluted to create the serial dilutions in the needed range of 0.2–80 μg/g. The suggested HPLC approach was used to measure the HPLC response for each ITN solution. The ITN calibration curve was created by plotting eight different ITN concentrations (0.2, 1, 10, 20, 40, 60, and 80 μg/g) vs. the recorded HPLC area. Triplications (n = 3) of each sample preparation and experiment were run.
2.4. Processing samples for ITN measurement in marketed capsules
The average mass of ten commercial soft gelatin capsule brands A and B—each having 20 mg of ITN—was determined. The oily contents of soft gelatin capsule brands A and B were obtained from the capsule using HPLC syringe. From each brand (A and B), an average weight (having 20 mg of ITN) was taken and dissolved in 10 mL of the environmentally friendly eluent system. Then, 1 mL of this solution was diluted further using the greener mobile phase to get the total volume of 100 mL. The obtained samples were used to determine ITN contents in soft gelatin capsule brands A and B using the current protocol in triplicates (n = 3).
2.5. Method development procedure
To provide an accurate stability-indicating ecofriendly HPLC method for the detection of INT in marketed products and solubility samples, several mixes of environmentally friendly solvents were examined as the eluent systems. Among the many environmentally friendly solvents that were examined were the environmentally friendly solvent compositions MeOH-water, EtOH-water, Ace-water, MeOH–EtOH, EA-MeOH, EA-EtOH, EA-Ace, and Ace-MeOH. The cost of the solvents, their greenness and toxicity, the method's sensitivity, the duration of the measurement, the measurement parameters, and the solvents' compatibility with one another were all taken into consideration when deciding on the most environmentally friendly eluent system. As a result, many environmentally safe solvent mixtures were looked at for use as eluent systems. Eventually, it was determined that a 50:50, v/v, mixture of EA and EtOH would make the best eluent system for subsequent investigation.
2.6. Validation parameters
Using ICH-Q2-R1 standards, a variety of parameters for the environmentally friendly stability-indicating HPLC approach for the assessment of ITN were validated [45]. The linearity of the environmentally friendly HPLC approach was investigated in the range of 0.2–80 μg/g by plotting the linearity graphs. The chromatographic response was determined after the freshly made ITN solutions were administered to the system in three copies (n = 3). The ITN calibration curve was produced by plotting HPLC area vs. ITN concentration.
The system suitability parameters for the eco-friendly HPLC test were established at the target concentration of ITN (10 μg/g). These parameters were determined in terms of the “tailing factor (As), capacity factor (k), and theoretical plate number (N)” [35,36].
Using a standard addition/spiking approach, the intra-assay and inter-assay accuracies of the environmentally friendly chromatography technique were measured and expressed as % recovery. The pre-determined target concentration of ITN (10 μg/g) was spiked with additional 0%, 50%, and 150% of ITN solution to obtain the concentrations of 10, 15, and 25 μg/g in triplicates (n = 3). This was done to assess intra-day accuracy. For intra-assay accuracy, all of these concentrations were examined on the same day. To evaluate the inter-assay accuracy, all three of the additional spiked ITN solutions were examined in triplicates on three consecutive days (n = 3). For each additional spiking concentration, the recovery percentage for both accuracy was determined.
Utilizing intra-day and inter-day changes in terms of percent relative standard deviation (%RSD), the environmentally friendly chromatography method's precision was measured. To evaluate the intra-day precision, three replicates of 10, 15, and 25 μg/g solutions of ITN were employed on the same day. Inter-day precision was evaluated at the 10, 15, and 25 μg/g solutions of ITN on three consecutive days. Both precisions were evaluated in triplicates (n = 3) and expressed as %RSD.
The robustness of the environmentally friendly chromatography method was evaluated to assess the influence of intentional modifications on ITN chromatographic measurements. The target concentration of ITN (10 μg/g) was selected to determine robustness. Robustness was evaluated by varying the ecologically friendly solvent's mixture, flow rate, and detection wavelength. The chromatographic response varied when the original EA: EtOH (50:50 v/v) eluent system was changed to EA: EtOH (52:48 v/v) and EA: EtOH (48:52 v/v). The initial flow rate of 1 mL/min was altered to flow rates of 1.10 mL/min and 0.90 mL/min in order to evaluate robustness, and the differences in chromatographic response were recorded. The chromatographic response changes were recorded when the initial detection wavelength (354 nm) was changed to detection wavelengths of 360 nm and 350 nm for robustness testing.
The sensitivity of the environmentally friendly HPLC assay was assessed using the standard deviation approach and expressed as “limit of detection (LOD) and limit of quantitation (LOQ)” [45]. The standard deviation of the response was calculated in triplications (n = 3). The LOD and LOQ values for ITN were then calculated using the proven methods that have been supported by the literature [44,45].
2.7. Forced degradation/selectivity studies
In order to ascertain the selectivity and stability-indicating properties of the environmentally friendly HPLC assay, forced-degradation studies under a variety of stress conditions, including acidic (HCl) stress, alkali (NaOH) stress, oxidative (H2O2) stress, and thermal stress conditions, were carried out [44,46]. For these studies, the eluent system received newly generated ITN at the target concentration (10 μg/g). An aliquot (1 mL) of this solution was used to carry out acid or alkali hydrolysis by adding 4 mL of 1 M HCl or 4 mL of 1 M NaOH. These combinations were refluxed for 48 h at 60 °C to identify ITN in the presence of its acid- and base-degradation compounds, respectively, before being assessed using the HPLC test, which is more environmentally friendly [46].
For oxidative degradation investigations, ITN at the target concentration (10 μg/g) was freshly generated and added to the eluent system. It was oxidatively broken down by combining 1 mL of this solution with 4 mL of 30% H2O2. After being refluxed for 48 h at 60 °C, this combination was analyzed by a green HPLC method to find ITN in the presence of its oxidative-degradation byproducts [46].
The target concentration of ITN (10 μg/g) was diluted from 1 mL to 5 mL using an eluent system in order to conduct research on heat deterioration. When its thermal-degradation products were present, it was next tested for ITN detection using an eco-friendly HPLC assay [46].
2.8. Greenness evaluation
The greenness index for the present technique was measured by “AGREE metric approach” [42]. The AGREE indices (0.0–1.0) were predicted utilizing the “AGREE: The Analytical Greenness Calculator (version 0.5, Gdansk University of Technology, Gdansk, Poland, 2020)”.
2.9. Application of environmentally friendly HPLC assay in measurement of ITN in commercial soft gelatin capsules
The chromatographic responses were recorded after the processed samples of the commercial soft gelatin capsule brands A and B were injected to the apparatus in three copies (n = 3). The amount of ITN in commercial soft gelatin capsule brands A and B was determined using ITN calibration curve. The potential for interference from excipients of soft gelatin capsules was also studied.
2.10. Application of environmentally friendly HPLC assay in measurement of ITN in solubility samples
At 25 °C, a shake flask approach was used to determine the solubility of ITN in eight different environmentally friendly solvents, including water, MeOH, EtOH, ethylene glycol (EG), propylene glycol (PG), polyethylene glycol-400 (PEG-400), EA, and dimethyl sulfoxide (DMSO) [47]. The excess crystals of ITN (unknown concentration) were taken into known quantities of each environmentally friendly solvent in triplicates (n = 3). The collected samples were vortexed for 10 min before being placed in a water bath shaker for 72 h of continuous shaking at 100 rpm [48,49]. After equilibrium reached (equilibrium time = 72 h), the samples were cautiously taken from the shaker and centrifuged for 30 min at 5000 rpm. The supernatant from each sample was withdrawn carefully, diluted with the environmentally friendly eluent system (wherever required), and subjected for the measurement of ITN using the current protocol at a wavelength of 354 nm.
2.11. Statistical evaluation
All values are expressed as mean ± SD of three independent experiments. The value was statistical significance at p = 0.05. The MS Excel (2016) was used to calculate all validation parameters.
3. Results and discussion
3.1. Method development procedure
Table 1 contains an overview of the recorded chromatography parameters and the combination of numerous eco-friendly mobile phases. The chromatographic response of ITN was substandard due to the usage of MeOH-water (50:50 v/v), EtOH-water (50:50 v/v), and Ace-water (50:50 v/v) throughout the method development procedure. ITN displayed larger As values (As > 2.3) and low N values (<1500). In addition, INT had a poor chromatographic response when MeOH–EtOH (50:50 v/v), MeOH-Ace (50:50 v/v), and MeOH-EA (50:50 v/v) were employed, with greater As values (As > 1.70) and low N values (<2000). Moreover, the usage of EA-Ace (50:50 v/v) and EtOH-Ace (50:50 v/v) as environmentally friendly eluent systems was also examined. When As values were higher (As>1.80) and N values were low (<2000), the chromatographic performance of INT was once again below average. However, the binary mixture of EA and EtOH (50:50 v/v), which provided a dependable retention time (Rt), as well as As and N values, demonstrated a well-resolved and intact ITN chromatographic peak with good As value and higher N values (Fig. 2). The final environmentally friendly mobile phase for determining INT with an adequate As (1.04) and N (5231), rapid analysis (Rt = 2.78 min), and a quick analysis time (5 min) was therefore decided to be a binary mixture of EA and EtOH (50:50 v/v).
Table 1.
The optimization of environmentally friendly eluent systems and observed chromatographic responses for standard isotretinoin (ITN) (mean ± SD, n = 3).
| Greener eluent system | As | N | Rt |
|---|---|---|---|
| MeOH: water (50:50 v/v) | 2.34 ± 0.37 | 1248 ± 1.96 | 5.61 ± 0.31 |
| EtOH: water (50:50 v/v) | 2.3 ± 0.27 | 1378 ± 2.12 | 5.17 ± 0.26 |
| Ace: water (50:50 v/v) | 2.61 ± 0.46 | 1093 ± 1.84 | 6.59 ± 0.43 |
| MeOH: EtOH (50:50 v/v) | 1.81 ± 0.19 | 1479 ± 2.53 | 4.53 ± 0.24 |
| MeOH: Ace (50:50 v/v) | 2.41 ± 0.26 | 1122 ± 1.91 | 6.43 ± 0.24 |
| MeOH: EA (50:50 v/v) | 1.71 ± 0.10 | 1544 ± 2.64 | 4.03 ± 0.09 |
| EA: EtOH (50:50 v/v) | 1.04 ± 0.03 | 5231 ± 5.74 | 2.78 ± 0.02 |
| EA: Ace (50:50 v/v) | 1.85 ± 0.07 | 1664 ± 2.72 | 4.11 ± 0.07 |
| EtOH: Ace (50:50 v/v) | 1.92 ± 0.10 | 1654 ± 2.68 | 4.18 ± 0.09 |
As: tailing factor; N: number of theoretical plates; Rt: retention time.
Fig. 2.

A representative high-performance liquid chromatography (HPLC) chromatogram of ITN (10 μg/g concentration) obtained using EA: EtOH (50:50 v/v) environmentally friendly eluent system.
3.2. Validation parameters
Various parameters for the validation of current protocol were determined using ICH-Q2-R1 guidelines [45]. The ITN solution (0.2–80 μg/g) that was recently produced was used to create the linearity curves. Table 2 contains the results of a linear regression study of the ITN calibration curve. ITN's linear calibration curve ranged from 0.2 to 80 μg/g. With determination coefficient (R2) and regression coefficient (R) values of 0.9994 and 0.9997, respectively, on the calibration curve, the results demonstrate a significant correlation between observed responses and ITN concentrations. These results demonstrated the effectiveness of the current ITN determination technique.
Table 2.
Linear regression data for the calibration curve of ITN for the current protocol (mean ± SD, n = 3).
| Parameters | Values |
|---|---|
| Linearity range (μg/g) | 0.2–80 |
| Regression equation | y = 75179x+59230 |
| R2 | 0.9994 |
| R | 0.9997 |
| Slope ± SD | 75179 ± 124.45 |
| Intercept ± SD | 59230 ± 83.76 |
| SE of slope | 71.85 |
| SE of intercept | 48.36 |
| 95% CI of slope | 74869–75488 |
| 95% CI of intercept | 59021–59438 |
| LOD (ng/g) | 3.67 ± 0.18 |
| LOQ (ng/g) | 11.03 ± 0.54 |
R2: determination coefficient; R: regression coefficient; SE: standard error; CI: confidence interval; LOD: limit of detection; LOQ: limit of quantification.
Using the As, k, and N, the system suitability characteristics for the present technique were established. The present protocol's values for As, k, and N were found to be 1.04, 2.71, and 5231, respectively. The values were satisfactory and trustworthy for measuring ITN.
The accuracy of the current approach was assessed using the percent recovery of samples that had been extra spiked by 0 to 150% at three different concentrations. The findings are included in Table 3. The intra-assay and inter-assay % recoveries of ITN at three different concentrations were calculated to be 98.86–101.52 and 98.60–101.40%, respectively. The current procedure for measuring ITN has high recovery rates, indicating its accuracy.
Table 3.
Intra-day and inter-day accuracy data of ITN for the current protocol (mean ± SD; n = 3).
| Conc. (μg/g) | Intra-day accuracy |
Inter-day accuracy |
||||
|---|---|---|---|---|---|---|
| Conc. found (μg/g) ± SD | Recovery (%) | RSD (%) | Conc. found (μg/g) ± SD | Recovery (%) | RSD (%) | |
| 10 | 9.96 ± 0.10 | 99.60 | 1.00 | 9.86 ± 0.11 | 98.60 | 1.11 |
| 15 | 14.83 ± 0.13 | 98.86 | 0.87 | 15.21 ± 0.15 | 101.40 | 0.98 |
| 25 | 25.38 ± 0.19 | 101.52 | 0.74 | 24.88 ± 0.20 | 99.52 | 0.80 |
Table 4 contains the results of the intra-day and inter-day precisions, which are expressed as %RSD. The intraday precision %RSDs for ITN were discovered to range between 0.71 and 0.89%. The %RSDs for inter-day precision, on the other hand, varied between 0.79 and 0.98%. The present procedure for measuring ITN pointed to its precision with low %RSDs.
Table 4.
Intra-day and inter-day precision data of ITN for the current protocol (mean ± SD; n = 3).
| Conc. (μg/g) | Intra-day precision |
Inter-day precision |
||||
|---|---|---|---|---|---|---|
| Conc. found (μg/g) ± SD | SE | RSD (%) | Conc. found (μg/g) ± SD | SE | RSD (%) | |
| 10 | 10.11 ± 0.09 | 0.05 | 0.89 | 10.13 ± 0.10 | 0.05 | 0.98 |
| 15 | 14.91 ± 0.12 | 0.06 | 0.80 | 14.86 ± 0.13 | 0.07 | 0.87 |
| 25 | 25.29 ± 0.18 | 0.10 | 0.71 | 25.18 ± 0.20 | 0.11 | 0.79 |
Table 5 presents the findings of robustness analysis at the target concentration of ITN (10 μg/g). When examining robustness by changing the composition of the environmentally friendly eluent system, the %RSD and Rt were measured to be 1.00–1.15% and 2.77–2.79 min, respectively. The %RSD and Rt were measured to be 0.93–1.28% and 2.58–3.03 min, respectively, in the scenario of a robustness examination when the flow rate was changed. The %RSD and Rt were measured to be 1.00–1.06% and 2.76–2.80 min, respectively, in the scenario of robustness examination by changing detecting wavelength. Low RSDs and minimal Rt value variation in the current protocol for measuring INT point to its robustness.
Table 5.
Robustness data of ITN for the current protocol (mean ± SD; n = 3).
| Parameters | Conc. found (μg/g) ± SD | RSD (%) | Rt ± SD | RSD (%) |
|---|---|---|---|---|
| Eluent system (% v/v) | ||||
| (52:48) | 9.94 ± 0.10 | 1.00 | 2.77 ± 0.02 | 0.72 |
| (48:52) | 10.41 ± 0.12vd | 1.15 | 2.79 ± 0.03 | 1.07 |
| Flow speed (mL/min) | ||||
| (1.10) | 10.89 ± 0.14 | 1.28 | 2.58 ± 0.03 | 1.16 |
| (0.90) | 9.62 ± 0.09 | 0.93 | 3.03 ± 0.05 | 1.65 |
| Measurement wavelength (nm) | ||||
| 350 | 9.93 ± 0.10 | 1.00 | 2.76 ± 0.02 | 0.72 |
| 360 | 10.34 ± 0.11 | 1.06 | 2.80 ± 0.03 | 1.07 |
Table 2 contains the results of evaluating the current protocol's sensitivity in terms of “LOD and LOQ”. According to the findings, the “LOD and LOQ” by the current protocol are 3.67 ± 0.18 ng/g and 11.03 ± 0.54 ng/g, respectively. These outcomes demonstrated that ITN could be detected and measured using the existing procedure in a variety of concentrations.
The current HPLC method for the measurement of ITN was compared with reported HPLC methods used to measure ITN in solution form. Numerous validation parameters of current method compared with reported HPLC methods are provided in Table 6. The linearity of all reported HPLC methods was inferior to the current HPLC method [[31], [32], [33],50]. In addition, the accuracy of one of the reported HPLC methods was inferior to the current HPLC method [31]. However, the accuracy and precision of most of the reported HPLC methods was similar to the current HPLC method [32,33,50]. The LOD and LOQ values of reported HPLC methods were also inferior to the current HPLC method and hence the current HPLC method was more sensitive than reported ones [33,50]. In addition, none of the reported HPLC methods were environmentally friendly [[31], [32], [33],50]. Overall, the current HPTLC method has been found suitable for the measurement of ITN.
Table 6.
Comparative evaluation of validation parameters of the current protocol with reported HPLC with UV detection methods for the determination of ITN.
| Analytical method | Nature of sample | Linearity range | Accuracy (% recovery) | Precision (% RSD) | LOD | LOQ | Ref. |
|---|---|---|---|---|---|---|---|
| HPLC | Solution | 0.0002–0.5 (mM) | 100.9–104.3 | 0.63–1.37 | – | – | [31] |
| HPLC | Solution | 5-30 (μg/mL) | 99.3–101.2 | 0.30–0.70 | – | – | [32] |
| HPLC | Solution | 5-600 (μg/mL) | 98.67–101.51 | 0.04–0.36 | 0.04 (μg/mL) | 0.12 (μg/mL) | [33] |
| HPLC | Solution | 1-7 (μg/mL) | 100.1–101.6 | 0.76–1.5 | 0.12 (μg/mL) | 0.38 (μg/mL) | [50] |
| HPLC | Solution | 0.2–80 (μg/g) | 98.60–101.52 | 0.71–0.98 | 3.67 (ng/g) | 11.03 (μg/g) | Present work |
3.3. Forced degradation and selectivity evaluations
The selectivity and stability-indicating qualities for the current technique were investigated by exposing the target concentration (10 μg/g) of ITN to various stress situations. The results of selectivity under different circumstances utilizing the present methodology are summarized in Fig. 3 and Table 7. The degradant was not quantified/identified. The amount of ITN was measured after degradation. From the amount of ITN remained, the amount of degradation was calculated.
Fig. 3.

The representative HPLC chromatograms of ITN derived under (A) acid-induced degradation, (B) alkali-induced degradation, (C) oxidative degradation, and (D) thermal degradation of ITN.
Table 7.
Findings of forced-degradation studies of ITN at target concentration (10 μg/g) of ITN under various stress conditions for the current protocol (mean ± SD; n = 3).
| Stress condition | ITN Rt (minutes) | ITN remaining (μg/g) | ITN recovered (%) |
|---|---|---|---|
| 1 M HCl | 2.73 | 7.26 | 72.60 ± 1.76 |
| 1 M NaOH | 2.72 | 9.14 | 91.40 ± 2.13 |
| 30% H2O2 | 2.79 | 9.42 | 88.70 ± 1.96 |
| Thermal | 2.71 | 9.62 | 89.40 ± 2.07 |
Well-separated ITN peaks and a few extra peaks of degradation products could be seen in the chromatograms of the forced degradation study (Fig. 3). 72.60% of ITN was recovered under acid stress circumstances, while 27.40% was decomposed (Table 7). As a result, it was concluded that ITN was not stable under acidic degradations. The Rt value for ITN under acid stress was slightly shifted (Rt = 2.73 min) (Fig. 3A). At alkali-stress degradations, 91.40% of ITN was still recovered, while 8.60% was broken down (Table 7). It was determined that ITN was sufficiently stable under alkali degradation conditions as a consequence. The Rt value of ITN underwent a minor change after alkali-stress degradation (Rt = 2.72 min) (Fig. 3B). Under oxidative-stress degradations, it was discovered that 88.70% of ITN was recovered and 11.30% was degraded. The outcome was that ITN was shown to be sufficiently stable during oxidative stress degradation. Moreover, there was a little shift in the Rt value of ITN during oxidative stress degradation (Rt = 2.79 min) (Fig. 3C). Under thermal degradation, 89.40% of ITN was remained and 10.60% was decomposed. Hence, ITN was also found to be adequately stable under thermal degradation scenario. The Rt value of ITN under thermal degradation was also slightly shifted (Rt = 2.71 min) (Fig. 3D). Overall, acid degradation was where ITN degraded the fastest. It was discovered that ITN's degradation patterns matched those previously described in the literature [50]. The ability to assess ITN while its degradation products were present makes the current method one that suggests stability-indicating. Overall, these findings confirmed the present method's selectivity and stability-signaling capacities.
3.4. Greenness measurement
The greenness attributes of analytical procedures are evaluated using a variety of analytical approaches [[40], [41], [42], [43], [44]]. Only the AGREE approach evaluates the analytical approaches' greenness while taking into account all twelve GAC principles [42]. As a result, the AGREE method was used to determine the greenness traits of the current technique. Fig. 4 displays the computed overall AGREE score using the twelve unique GAC principles. The AGREE report sheet and AGREE score for each GAC concept are shown in Fig. 5. The current technique has great greenness features for measuring ITN, as evidenced by its total AGREE score of 0.76.
Fig. 4.

AGREE score for the current protocol of ITN measurement derived using AGREE calculator.
Fig. 5.

AGREE score sheet presenting AGREE scale for 12 distinct principles of GAC for the current protocol of ITN measurement derived using AGREE calculator.
3.5. Assay of ITN in commercial soft gelatin capsules
The present ITN assay procedure was proven to be effective, rapid, and sensitive. Hence, this protocol was applied to determine ITN in its procured soft gelatin capsules. Commercial capsule brands A and B's ITN assay results were found to be 98.43% and 100.84%, respectively. According to ICH guidelines, the % assay of drug in the pharmaceutical products must be in the range of 98–102% [45]. The obtained values of ITN in both capsule dosage forms were within the range of ICH guidelines and hence acceptable [45]. These results demonstrated that the ITN in commercially available formulations could be determined using the existing approach.
3.6. Determination of ITN in solubility samples
The current method was applied to measure the mole fraction solubility of ITN in different environmentally friendly solvents. For the calculation of mole fraction solubility, the concentrations on mass/mass basis are required. As a result, the solvent concentration was expressed in μg/g instead of μg/ml. By testing ITN solubility in eight distinct environmentally friendly solvents, such as water, MeOH, EtOH, EG, PG, PEG-400, EA, and DMSO at 25 °C, the potential of the current approach was also shown. At 25 °C, the mole fraction solubility of ITN in water, MeOH, EtOH, EG, PG, PEG-400, EA, and DMSO was determined to be 3.18 × 10⁻⁷, 4.43 × 10⁻⁴, 8.09 × 10⁻⁴, 6.24 × 10⁻⁴, 1.10 × 10⁻³, 5.58 × 10⁻³, 8.84 × 10⁻³, and 8.62 × 10⁻², respectively. At 25 °C, the mole fraction solubility of ITN in water, MeOH, EtOH, EG, PG, PEG-400, EA, and DMSO has been reported as 3.16 × 10⁻⁷, 4.45 × 10⁻⁴, 8.06 × 10⁻⁴, 6.27 × 10⁻⁴, 1.07 × 10⁻³, 5.56 × 10⁻³, 8.82 × 10⁻³, and 8.64 × 10⁻², respectively [13]. ITN had solubility values that were consistent with those reported in the literature in a number of environmentally friendly solvents [13]. These findings indicated that ITN solubility in various solvents may be determined using the current methodology.
4. Conclusion
Using a rapid, sensitive, stability-indicating, and environmentally friendly HPLC approach, the ITN in commercial products and solubility samples has been measured and verified. The ICH-Q2-R1 recommendations were used to validate the existing procedure. The current approach is effective, accurate, stability-indicating, robust, sensitive, and selective for measuring ITN. The current approach was proved to be trustworthy for detecting ITN in samples of solubility and commercial items. The AGREE analysis revealed that the current approach had exceptional greenness features. The proposed method was successful in identifying ITN even in the presence of its degradation products because of its selectivity and stability-indicating characteristics. These results suggest that the current method can be applied to precisely quantify ITN in a variety of sample matrices. Further research can be done to estimate ITN in the intricate biological sample matrices and to examine the pharmacokinetics of ITN.
Author contribution statement
Nazrul Haq: Conceived and designed the experiments; Performed the experiments; Analyzed and interpreted the data; Wrote the paper.
Sultan Alshehri: Miteb Alenazi: Abdulrahman Alwhaibi: Performed the experiments; Contributed reagents, materials, analysis tools or data.
Ibrahim A. Alsarra: Conceived and designed the experiments.
Faiyaz Shakeel: Conceived and designed the experiments; Analyzed and interpreted the data; Wrote the paper.
Data availability statement
Data included in article/supp. material/referenced in article.
Declaration of competing interest
The authors declare that they have no known competing financial interests or personal relationships that could have appeared to influence the work reported in this paper.
Acknowledgments
“The authors extend their appreciation to the Deputyship for Research & Innovation, Ministry of Education in Saudi Arabia for funding this research work through the project no. (IFKSUOR3-066)”.
References
- 1.Tang G.W., Russell R.M. 13-cis-retinoic acid is an endogenous compound in human serum. J. Lipid Res. 1990;31:175–182. [PubMed] [Google Scholar]
- 2.Peck G.L., Olsen T.G., Yoder F.W., Strauss J.S., Downing D.T., Pandya M., Butkus D., Arnaud-Battandier J. Prolonged remissions of cystic and conglobate acne with 13-cis retinoic acid. N. Engl. J. Med. 1979;300:329–333. doi: 10.1056/NEJM197902153000701. [DOI] [PubMed] [Google Scholar]
- 3.Ioele G., Cione E., Risoli A., Genchi G., Ragno G. Accelerated photostability study of tretinoin and isotretinoin in liposome formulations. Int. J. Pharm. 2005;293:251–260. doi: 10.1016/j.ijpharm.2005.01.012. [DOI] [PubMed] [Google Scholar]
- 4.Kane M.A. Analysis, occurrence, and function of 9-cis-retinoic acid. Biochim. Biophys. Acta. 2012;1821:10–20. doi: 10.1016/j.bbalip.2011.09.012. [DOI] [PubMed] [Google Scholar]
- 5.Ourique A.F., Melero A., da Silva C.D.B., Schaefer U.F., Pohlmann A.R., Guterres S.S., Lehr C.M., Kostka K.H., Beck R.C.R. Improved photostability and reduced skin permeation of tretinoin: development of a semisolid nanomedicine. Eur. J. Pharm. Biopharm. 2011;79:95–101. doi: 10.1016/j.ejpb.2011.03.008. [DOI] [PubMed] [Google Scholar]
- 6.Zouboulis C.J. Isotretinoin revisited: pluripotent effects on human sebaceous gland cells. Investig. Dermatol. 2006;126:2154–2156. doi: 10.1038/sj.jid.5700418. [DOI] [PubMed] [Google Scholar]
- 7.Ortonne J.P. Retinoid therapy of pigmentary disorders. Dermatol. Ther. 2006;19:280–288. doi: 10.1111/j.1529-8019.2006.00085.x. [DOI] [PubMed] [Google Scholar]
- 8.Singh M., Griffiths C.E. The use of retinoids in the treatment of photoaging. Dermatol. Ther. 2006;19:297–305. doi: 10.1111/j.1529-8019.2006.00087.x. [DOI] [PubMed] [Google Scholar]
- 9.Cowen E.W. Epidermal growth factor receptor inhibitors: a new era of drug reactions in a new era of cancer therapy. J. Am. Acad. Dermatol. 2007;56:514–517. doi: 10.1016/j.jaad.2006.11.004. [DOI] [PubMed] [Google Scholar]
- 10.Das B.C., Thapa P., Karki R., Das S., Mahapatra S., Liu T.C., Torregroza I., Wallace D.P., Kambhampati S., Van Veldhuizen P., Verma A., Ray S.K., Evans T. Retinoic acid signaling pathways in development and diseases. Bioorg. Med. Chem. 2014;22:673–683. doi: 10.1016/j.bmc.2013.11.025. [DOI] [PMC free article] [PubMed] [Google Scholar]
- 11.Thibodeau J., Filion S., Spear P., Paquin J., Boily M. Oxidation of retinoic acids in hepatic microsomes of wild bullfrogs Lithobates catesbeianus environmentally-exposed to a gradient of agricultural contamination. Ecotoxicology. 2012;21:1358–1370. doi: 10.1007/s10646-012-0889-0. [DOI] [PubMed] [Google Scholar]
- 12.Alwhaibi A., Alenazi M., Almadi B., Alotaibi A., Alshehri S.M., Shakeel F. A practical method for oral administration of pediatric oncology patient: a case study of neuroblastoma. J. Oncol. Pharm. Pract. 2023;29:755–759. doi: 10.1177/10781552221117814. [DOI] [PubMed] [Google Scholar]
- 13.Shakeel F., Haq N., Mahdi W.A., Alsarra I.A., Alshehri S., Alenazi M., Alwhaibi A. Solubilization and thermodynamic analysis of isotretinoin in eleven different green solvents at different temperatures. Materials. 2022;15:E8274. doi: 10.3390/ma15228274. [DOI] [PMC free article] [PubMed] [Google Scholar]
- 14.Gatti R., Gioia M.G., Cavrini V. Analysis and stability study of retinoids in pharmaceuticals by fluorescence. J. Pharm. Biomed. Anal. 2000;23:147–159. doi: 10.1016/s0731-7085(00)00285-5. [DOI] [PubMed] [Google Scholar]
- 15.Napoli J.L., Pramanik B.C., Williams J.B., Dawson M.I., Hobbs P.D. Quantification of retinoic acid by gas-liquid chromatography-mass spectrometry: total versus all-trans-retinoic acid in human plasma. J. Lipid Res. 1985;26:387–392. [PubMed] [Google Scholar]
- 16.Lima E.M., Diniz D.G., Antoniosi-Filho N.R. Development of a gas chromatography method for the determination of isotretinoin and its degradation products in pharmaceuticals. J. Pharm. Biomed. Anal. 2005;38:678–685. doi: 10.1016/j.jpba.2005.02.015. [DOI] [PubMed] [Google Scholar]
- 17.Tan X., Meltzer N., Lindenbaum S. Solid state stability studies of 13-cis-retinoic acid and all transretinoic acid using microcalorimetry and HPLC analysis. Pharm. Res. (N. Y.) 1992;9:1203–1208. doi: 10.1023/a:1015816225127. [DOI] [PubMed] [Google Scholar]
- 18.Crank G., Pardijanto M.S. Photooxidations and photosensitized oxidations of vitamin A and its palmitate ester. J. Photochem. Photobiol., A. 1995;85:93–100. [Google Scholar]
- 19.Huang Y.X., Chao Y.Y., Lin Y.H., Liou J.R., Chan H.C., Chen Y.L. Determination of 13-cis-retinoic acid and its metabolites in plasma by micellar electrokinetic chromatography using cyclodextrin-assisted sweeping for sample preconcentration. Molecules. 2021;26:E5865. doi: 10.3390/molecules26195865. [DOI] [PMC free article] [PubMed] [Google Scholar]
- 20.Bempong D.K., Honigberg I.L., Meltzer N.M. Separation of 13-cis and all-trans retinoic acid and their photodegradable products using capillary zone electrophoresis and micellar electrokinetic chromatography (MEC) J. Pharm. Biomed. Anal. 1993;11:829–833. doi: 10.1016/0731-7085(93)80076-d. [DOI] [PubMed] [Google Scholar]
- 21.Patel M.R., Patel R.B., Parikh J.R., Patel B.G. Improving the isotretonoin photostability by incorporating in microemulsion matrix. Int. Scholar Res. Not. 2011;2011 doi: 10.5402/2011/838016. [DOI] [PMC free article] [PubMed] [Google Scholar]
- 22.Kane M.A., Folias A.E., Napoli J.L. HPLC/UV quantitation of retinal, retinol, and retinyl esters in serum and tissues. Anal. Biochem. 2008;378:71–79. doi: 10.1016/j.ab.2008.03.038. [DOI] [PMC free article] [PubMed] [Google Scholar]
- 23.Ferguson S.A., Siitonen P.H., Cisneros F.J., Gough B., Young J.F. Steady state pharmacokinetics of oral treatment with 13-cis-retinoic acid or all-trans-retinoic acid in male and female adult rats. Basic Clin. Pharmacol. Toxicol. 2006;98:582–587. doi: 10.1111/j.1742-7843.2006.pto_359.x. [DOI] [PubMed] [Google Scholar]
- 24.Teglia C.M., Camara M.S., Goicoechea H.C. Rapid determination of retinoic acid and its main isomers in plasma by second-order high-performance liquid chromatography data modeling. Anal. Bioanal. Chem. 2014;406:7989–7998. doi: 10.1007/s00216-014-8268-8. [DOI] [PubMed] [Google Scholar]
- 25.McCaffery P., Evans J., Koul O., Volpert A., Reid K., Ullman M.D. Retinoid quantification by HPLC/MS(n) J. Lipid Res. 2002;43:1143–1149. doi: 10.1194/jlr.d200012-jlr200. [DOI] [PubMed] [Google Scholar]
- 26.Wang Y., Chang W.Y., Prins G.S., van Breemen R.B. Simultaneous determination of all-trans, 9-cis, 13-cis retinoic acid and retinol in rat prostate using liquid chromatography- mass spectrometry. J. Mass Spectrom. 2001;36:882–888. doi: 10.1002/jms.189. [DOI] [PubMed] [Google Scholar]
- 27.Wu L., Wu J., Zhou K., Cheng F., Bai Y.L., Feng Y.Q. Determination of isotretinoin in human plasma by high performance liquid chromatography–electrospray ionization mass spectrometry. J. Pharm. Biomed. Anal. 2011;56:324–329. doi: 10.1016/j.jpba.2011.05.012. [DOI] [PubMed] [Google Scholar]
- 28.Gong G.G., Zheng J., Li S., Bai Y.L., Feng Y.Q. Triple chemical derivatization strategy assisted liquid chromatography-mass spectrometry for determination of retinoic acids in human serum. Talanta. 2012;245 doi: 10.1016/j.talanta.2022.123474. [DOI] [PubMed] [Google Scholar]
- 29.Ruhl R. Method to determine 4-oxo-retinoic acids, retinoic acids and retinol in serum and cell extracts by liquid chromatography/diode-array detection atmospheric pressure chemical ionisation tandem mass spectrometry. Rapid Commun. Mass Spectrom. 2006;20:2497–2504. doi: 10.1002/rcm.2621. [DOI] [PubMed] [Google Scholar]
- 30.Kane M.A., Folias A.E., Wang C., Napoli J.L. Quantitative profiling of endogenous retinoic acid in vivo and in vitro by tandem mass spectrometry. Anal. Chem. 2008;80:1702–1708. doi: 10.1021/ac702030f. [DOI] [PMC free article] [PubMed] [Google Scholar]
- 31.Tashtoush M.B., Jacobson E.L., Jacobson M.K. A rapid HPLC method for simultaneous determination of tretinoin and isotretinoin in dermatological formulations. J. Pharm. Biomed. Anal. 2007;43:859–864. doi: 10.1016/j.jpba.2006.08.027. [DOI] [PubMed] [Google Scholar]
- 32.Guimarães C.A., Menaa F., Menaa B., Lebrun I., Quenca-Guillen J.S., Auada A.V.V., Mercuri L.P., Ferreira P., Santoro M.I.R.M. Determination of isotretinoin in pharmaceutical formulations by reversed-phase HPLC. J. Biomed. Sci. Eng. 2010;3:454–458. [Google Scholar]
- 33.Patel P., Kimbahune R., Kabra P., Delvadiya K., Nargund L.V.G. Development and validation of reverse phase liquid chromatography method for estimation of isotretinoin (13-cis retinoic acid) in pharmaceutical dosage form. Rasayan J. Chem. 2011;4:153–158. [Google Scholar]
- 34.Anastas P.T., Warner J.C. Oxford University Press; London: 1998. Green Chemistry: Theory and Practice. [Google Scholar]
- 35.Haq N., Alanazi F.K., Salem-Bekhit M.M., Rabea S., Alam P., Alsarra I.A., Shakeel F. Greenness estimation of chromatographic assay for the determination of anthracycline-based antitumor drug in bacterial ghost matrix of Salmonella typhimurium. Sus. Chem. Pharm. 2022;26 [Google Scholar]
- 36.Haq N., Alshehri S., Alam P., Ghoneim M.M., Hasan Z., Shakeel F. Green analytical chemistry approach for the determination of emtricitabine in human plasma, formulations, and solubility study samples. Sus. Chem. Pharm. 2022;26 [Google Scholar]
- 37.Capello C., Fischer U., Hungerbuhler K. What is a green solvent? A comprehensive framework for the environmental assessment of solvents. Green Chem. 2007;9:927–934. [Google Scholar]
- 38.Koller G., Fischer U., Hungerbuhler K. Assessing safety, health, and environmental impact early during process development. Ind. Eng. Chem. Res. 2000;39:960–972. [Google Scholar]
- 39.Environmental Management–Life Cycle Assessment–Principles and Framework, EN ISO 14040. European Committee for Standardisation; Brussels, Belgium: 1997. [Google Scholar]
- 40.Abdelrahman M.M., Abdelwahab N.S., Hegazy M.A., Fares M.Y., El-Sayed G.M. Determination of the abused intravenously administered madness drops (tropicamide) by liquid chromatography in rat plasma; an application to pharmacokinetic study and greenness profile assessment. Microchem. J. 2020;159 [Google Scholar]
- 41.Duan X., Liu X., Dong Y., Yang J., Zhang J., He S., Yang F., Wang Z., Dong Y. A green HPLC method for determination of nine sulfonamides in milk and beef, and its greenness assessment with analytical eco-scale and greenness profile. J. AOAC Int. 2020;103:1181–1189. doi: 10.1093/jaoacint/qsaa006. [DOI] [PubMed] [Google Scholar]
- 42.Pena-Pereira F., Wojnowski W., Tobiszewski M. AGREE-Analytical GREEnness metric approach and software. Anal. Chem. 2020;92:10076–10082. doi: 10.1021/acs.analchem.0c01887. [DOI] [PMC free article] [PubMed] [Google Scholar]
- 43.Alam P., Salem-Bekhit M.M., Al-Joufi F.A., Alqarni M.H., Shakeel F. Quantitative analysis of cabozantinib in pharmaceutical dosage forms using green RP-HPTLC and green NP-HPTLC methods: a comparative evaluation. Sus. Chem. Pharm. 2021;21 [Google Scholar]
- 44.Foudah A.I., Shakeel F., Alqarni M.H., Alam P. A rapid and sensitive stability-indicating green RP-HPTLC method for the quantitation of flibanserin compared to green NP-HPTLC method: validation studies and greenness assessment. Microchem. J. 2021;164 [Google Scholar]
- 45.International Conference on Harmonization (ICH), Q2 (R1): Validation of Analytical Procedures–Text and Methodology. 2005. Geneva, Switzerland. [Google Scholar]
- 46.Haq N., Iqbal M., Alanazi F.K., Alsarra I.A., Shakeel F. Applying green analytical chemistry for rapid analysis of drugs: adding health to pharmaceutical industry. Arab. J. Chem. 2017;10:S777–S785. [Google Scholar]
- 47.Higuchi T., Connors K.A. Phase-solubility techniques. Adv. Anal. Chem. Instrum. 1965;4:117–122. [Google Scholar]
- 48.Alqarni M.H., Haq N., Alam P., Abdel-Kader M.S., Foudah A.I., Shakeel F. Solubility data, Hansen solubility parameters and thermodynamic behavior of pterostilbene in some pure solvents and different (PEG-400 + water) cosolvent compositions. J. Mol. Liq. 2021;331 [Google Scholar]
- 49.Alanazi A., Alshehri S., Altamimi M., Shakeel F. Solubility determination and three dimensional Hansen solubility parameters of gefitinib in different organic solvents: experimental and computational approaches. J. Mol. Liq. 2020;299 [Google Scholar]
- 50.Hsi S.L., Surman P., Al-Kassas R. Development of a stability-indicating UPLC method for determination of isotretinoin in bulk drug. Pharmaceut. Dev. Technol. 2019;24:189–198. doi: 10.1080/10837450.2018.1454469. [DOI] [PubMed] [Google Scholar]
Associated Data
This section collects any data citations, data availability statements, or supplementary materials included in this article.
Data Availability Statement
Data included in article/supp. material/referenced in article.