Abstract
Background
Lung adenocarcinoma (LUAD) is the most common subtype of lung cancer, representing 40% of all cases of this tumor. Despite immense improvements in understanding the molecular basis, diagnosis, and treatment of LUAD, its recurrence rate is still high.
Methods
RNA-seq data from The Cancer Genome Atlas (TCGA) LUAD cohort were download from Genomic Data Commons Portal. The GSE13213 dataset from Gene Expression Omnibus (GEO) was used for external validation. Differential prognostic lysosome-related genes (LRGs) were identified by overlapping survival-related genes obtained via univariate Cox regression analysis with differentially expressed genes (DEGs). The prognostic model was built using Kaplan-Meier curves and least absolute shrinkage and selection operator (LASSO) analyses. In addition, univariate and multivariate Cox analyses were employed to identify independent prognostic factors. The responses of patients to immune checkpoint inhibitors (ICIs) were further predicted. The pRRophetic package and rank-sum test were used to compute the half maximal inhibitory concentrations (IC50) of 56 chemotherapeutic drugs and their differential effects in the low- and high-risk groups. Moreover, quantitative real-time polymerase chain reaction, Western blot, and human protein atlas (HPA) database were used to verify the expression of the four prognostic biomarkers in LUAD.
Results
Of the nine candidate differential prognostic LRGs, GATA2, TFAP2A, LMBRD1, and KRT8 were selected as prognostic biomarkers. The prediction of the risk model was validated to be reliable. Cox independent prognostic analysis revealed that risk score and stage were independent prognostic factors in LUAD. Furthermore, the nomogram and calibration curves of the independent prognostic factors performed well. Differential analysis of ICIs revealed CD276, ICOS, PDCD1LG2, CD27, TNFRSF18, TNFSF9, ENTPD1, and NT5E to be expressed differently in the low- and high-risk groups. The IC50 values of 12 chemotherapeutic drugs, including epothilone.B, JNK.inhibitor.VIII, and AKT.inhibitor.VIII, significantly differed between the two risk groups. KRT8 and TFAP2A were highly expressed, while GATA2 and LMBRD1 were poorly expressed in LUAD cell lines. In addition, KRT8 and TFAP2A were highly expressed, while GATA2 and LMBRD1 were poorly expressed in tumor tissues.
Conclusions
Four key prognostic biomarkers—GATA2, TFAP2A, LMBRD1, and KRT8—were used to construct a significant prognostic model for LUAD patients.
Keywords: Lung adenocarcinoma (LUAD), lysosome-related genes (LRGs), prognosis, immune infiltration, chemotherapeutic drugs
Highlight box.
Key findings
• We constructed a prognostic model with LRGs and analyzed the relationship between this model and immunity as well as mutations.
• We identified four key prognostic biomarkers (GATA2, TFAP2A, LMBRD1, and KRT8) to build a model with prognostic significance for LUAD patients.
What is known and what is new?
• Lysosomes play an important role in many diseases.
• This is the first study to use LRGs to construct a prognostic model. The prognostic model was related to TTN and TP53 mutations, TMB, immune microenvironment, immunotherapy response analysis, and various anticancer drugs in LUAD patients.
What is the implication, and what should change now?
• LRGs can help predict the prognosis of LUAD patients and may guide immunotherapy.
Introduction
Lung cancer is the most common type of cancer in the world. It is associated with poor prognosis, and is the leading cause of cancer mortality, accounting for more than one million deaths annually (1,2). Lung adenocarcinoma (LUAD) is the most common subtype of this tumor, accounting for approximately 40% of all lung cancer cases, and its frequency has been continually increasing (3,4). Genes encoding epidermal growth factor receptor and Ki-ras2 Kirsten rat sarcoma viral oncogene homolog (KRAS) are the most frequently mutated genes in LUAD (5). The overall survival rate of LUAD patients is less than 5 years, but has markedly improved due to recently emerged targeted therapies that employ “precision medicine” (6). Indeed, the predictive effect of oncogenic driver mutations with targeted therapies is a promising therapeutic modality. In the era of precision medicine, identifying new therapeutic targets requires us to recognize key genes driving carcinogenesis. Discovering more effective prognostic indicators and therapeutic methods for LUAD is absolutely essential.
Lysosomes are organelles composed of an acidic lumen, which contains several hydrolases, including nucleases, proteases, phosphatases, and lipases (7), and a phospholipid monolayer membrane. Lysosomes play an important role in many diseases. They participate in the occurrence and development of atherosclerotic plaques, and serve as the key nodes connecting lipid degradation, autophagy, apoptosis, inflammatory bodies, lysosomal biogenesis, and macrophage polarization. Research aimed at preventing and treating atherosclerosis is focused on lysosomes and mammalian target of rapamycin signaling (8). Changes in lysosome-related genes (LRGs) in Parkinson’s disease inhibit the degradation of misfolded proteins and damage lysosomal function (9,10). In tumor-related diseases, the activity of lysosomes is related to the phenotype of malignant cells. Lysosomes regulate tumor cell proliferation by manipulating growth factor signals and providing nutrition (11). The upregulation of cathepsin in lysosomes is related to tumor migration, invasion, and metastasis, indicating tumor progression and poor prognosis. Many cathepsins have been identified as prognostic markers or therapeutic targets (12,13). In addition, lysosomes mediate the development of radiation and chemotherapy resistance in tumor cells (11). However, little is known about the roles of lysosomes and LRGs in LUAD.
This study aimed to construct a prognostic model comprising LRGs. The relationships between the model and immunity as well as mutation were analyzed. Overall, this study found that LRGs can help predict the prognosis of LUAD patients and may guide immunotherapy. We present this article in accordance with the TRIPOD reporting checklist (available at https://tlcr.amegroups.com/article/view/10.21037/tlcr-23-14/rc). The analytical flow of this study is detailed in Figure S1.
Methods
Data source
RNA-seq data of The Cancer Genome Atlas (TCGA)-LUAD cohort retrieved from Genomic Data Commons Portal (https://portal.gdc.cancer.gov/) including 526 LUAD tissues and 59 normal samples. After excluding samples with incomplete survival or clinical information, 513 LUAD samples were selected for screening prognostic genes and constructing a prognostic model (available online: https://cdn.amegroups.cn/static/public/tlcr-23-14-1.xlsx). Furthermore, the GSE13213 dataset, downloaded from the Gene Expression Omnibus (GEO) database (https://www.ncbi.nlm.nih.gov/geo/), was utilized for external validation. It included expression profile and survival data of 117 LUAD samples (available online: https://cdn.amegroups.cn/static/public/tlcr-23-14-2.xlsx). A list of 144 LRGs was acquired from Vairo et al. (14). Ethics approval was not required for this part of the study as TCGA and GEO are public databases. The study was conducted in accordance with the Declaration of Helsinki (as revised in 2013).
Identification of differential prognostic LRGs in LUAD
First, differential expression analysis was applied to the 59 normal and 526 LUAD samples to identify differentially expressed genes (DEGs) in LUAD using the limma R package (version 3.44.3) with the criteria of P value <0.05 and |log2(fold change)| >0.5 (15). Then, the 144 LRGs were analyzed to obtain prognostic LRGs using univariate Cox regression survival analysis with P values <0.05. Differential prognostic LRGs were obtained by overlapping the DEGs and the prognostic LRGs. The results were visualized as a Venn diagram and a heatmap, which were plotted using the gglpot2 package (version 3.3.2) and Heatmap package (version 4.1.0), respectively.
Enrichment analysis of differential prognostic LRGs in LUAD
The differential prognostic LRGs were subjected to enrichment analyses using the Kyoto Encyclopedia of Genes and Genomes (KEGG) and Gene Ontology (GO) resource, which included the sub-ontologies of cellular components (CC), molecular function (MF), and biological process (BP). ClusterProfiler (version 4.0.2) in R with a selection criteria of P<0.05 was used for this purpose (16). In addition, GeneMANIA was used to explore the interactions among the differential prognostic LRGs, which were analyzed through protein-protein interaction (PPI) networks from the aspects of physical interactions, co-expression, predicted, shared protein domains, and genetic interactions.
Risk model construction and validation
Of the 513 LUAD samples, 360 and 153 were delegated to training and internal validation sets, respectively, based on a ratio of 7:3. The prognostic LRGs were subjected to logistic regression using least absolute shrinkage and selection operator (LASSO) with the following settings: family to “binomial” and type.measure to “class”. The feature genes obtained were studied by multivariate Cox analysis, and the most optimized model genes were selected by the “step” method.
The risk score of every LUAD patient, which aimed to assess the prognostic value of the risk model, was computed from the risk coefficient, obtained through multivariate Cox analysis and the expression levels of model genes, using the following formula: . Based on the median risk score, LUAD patients were separated into high- or low-risk groups. The efficacy of the risk model was further investigated by area under the curve (AUC) of the receiver operating characteristic (ROC) curves. The 1-, 3-, and 5-year survival time node ROC curves were plotted using the survivalROC package (version 3.1-12) according to the risk model obtained after Cox regression analyses. The same evaluation procedures were applied to both the internal and external validation sets to further determine the effectiveness of the risk model.
Establishment of a nomogram
Patients’ risk scores were compared according to the following clinical factors of different subgroups: age (>60 or ≤60 years), tumor (T) stage (T1, T2, T3, T4), node (N) stage (N0, N1, N2, N3), metastasis (M) stage (M0, M1, M2), and sex (male or female). T staging indicated the extent and size of the primary tumor, N staging indicated the spread of the tumor to the lymph nodes, and M staging indicated the extent of tumor metastasis. ROC curves were employed to further analyze the effects of the combination of the risk score and clinical factors.
Univariate Cox independent prognostic analysis was used to investigate the prognosis of LUAD patients based on the aforementioned clinicopathological characteristics, and those with P>0.05 were further input into the risk model to perform multivariate Cox independent prognostic analysis.
The cph function (rms package, version 6.1.0) was employed to construct an independent prognostic model from the clinicopathological factors screened out using multivariate Cox analysis. Finally, the nomogram was plotted to predict the 1-, 3-, and 5-year survival rates of LUAD patients, and was verified using the overall calibration curve.
Functional enrichment analyses
From the C5:GO (BP + CC + MF) and C2:CP:KEGG gene sets downloaded from Molecular Signatures Database v7.4 (https://www.gsea-msigdb.org), all genes from the risk groups in TCGA were subjected to gene set variation analysis (GSVA) to perform GO and KEGG enrichment analyses. Common functions and pathways were explored with the screening criteria of false discovery rate <0.25 and |normalized enrichment score| >1.
Analysis of immunotherapy response and mutation in the risk groups
The proportions of both stromal and immune cells in a tumor sample were obtained from the sum of quality expression determined by the Estimation of Stromal and Immune cells in Malignant Tumor tissues using Expression data (ESTIMATE) algorithm. The stromal, immune, and combined scores can also be analyzed separately. Immune cells or immune function as well as immune pathway activities within each sample were explored using single set gene sample enrichment analysis (ssGSEA) according to the immunocompetence. Before performing subsequent statistical analysis, ssGSEA was applied to the expression profile to obtain the rank value of each gene.
To investigate the immunotherapy response in the high- and low-risk groups, Tumor Immune Dysfunction and Exclusion (TIDE), rank-sum test, and differential analysis were applied to immune checkpoint inhibitors (ICIs). TIDE is a prediction tool for ICI responses. The differences in immunotherapy sensitivities between the two risk groups were estimated using TIDE, and the TIDE scores were applied to the rank-sum test. In addition, the corresponding expression of each reported ICI was extracted, and differential analysis was conducted in the high- and low-risk groups.
Gene mutation differences between the risk groups were explored using the maftools R package based on single nucleotide polymorphism mutation site data for LUAD. Subsequently, the tumor mutation burden (TMB) of each LUAD sample was computed using the tmb function in the maftools package, and compared between the two risk groups. Simultaneously, the relationship between TMB and risk score was analyzed. Based on the median TMB score, LUAD patients were classified into high-TMB or low-TMB groups, and the combined survival curves of these groups were plotted after Kaplan-Meier survival analysis.
Drug susceptibility analysis
The half maximal inhibitory concentration (IC50) values of 56 common chemotherapy drugs were obtained using the pRRophetic package in R (17), and the rank-sum test and ggplot2 were employed to compare and visualize IC50 differences between the high- and low-risk groups to further investigate the feasible guiding significance of patient risk scores for chemotherapy.
Analysis of prognostic biomarkers
Gene Transcription Regulation Database (https://gtrd.biouml.org/) was used to predict the genes targeting prognostic biomarkers (18), and clusterProfiler in R was utilized to explore their potential function (P<0.05 and count >2). The PPI network of prognostic biomarkers and target genes was constructed using GeneMANIA (https://genemania.org/) (19).
Clinical samples
Patients who were diagnosed with LUAD and had not undergone any radiotherapy or chemotherapy before surgery were selected for this study. Six pairs of LUAD tissue samples were obtained from the Affiliated Hospital of Nantong University between January 2021 and April 2022. The study was conducted in accordance with the Declaration of Helsinki (as revised in 2013). The study was approved by the Ethics Committee of the Affiliated Hospital of Nantong University (No. 2022-L165) and informed consent was taken from all the patients.
Cell culture
Human bronchial cells (16HBE) and lung cancer cells (H1299, and A549) were purchased from the American Type Culture Collection, and cultured in RPMI 1640 (Gibco, Thermo Fisher Scientific, Waltham, MA, USA) with 10% fetal bovine serum (Gibco) at 37 ℃ under 5% CO2.
Quantitative real-time polymerase chain reaction
Total RNA was extracted using TRIzol (Invitrogen, Waltham, MA, USA), and reversely transcribed into cDNA using a reverse transcription kit (Vazyme, Nanjing, China). Genes were amplified using a SYBR Green System (Vazyme), and glyceraldehyde 3-phosphate dehydrogenase was used as an internal reference. Relative gene expression was calculated by the comparative Ct method (2−ΔΔCt). The primer sequences were as follows: human GATA2 (forward primer: 5'-CGCACAACTACATGGAACCC-3'; reverse primer: 5'-CTGCGAGTCGAGGTGATTGA-3'); human TFAP2A (forward primer: 5'-TCCTTACCTCACGCCATCGA-3'; reverse primer: 5'-TGGACTTGGACAGGGACACG-3'); human LMBRD1 (forward primer: 5'-CGTGAAGCCCAAATCCAATAT-3'; reverse primer: 5'-TGCAGACCACTGCCTTCTCAT-3'); human KRT8 (forward primer: 5'-GGTCAAGGCACAGTACGAGGATA-3'; reverse primer: 5'-ACTTGGCGTTGGCATCCTTA-3'); human GAPDH (forward primer: 5'-CAACGTGTCAGTGGTGGACCTG-3'; reverse primer: 5'-GTGTCGCTGTTGAAGTCAGAGGAG-3').
Western blotting
RIPA lysis buffer (Sigma, St. Louis, MO, USA) containing a proteinase inhibitor cocktail (Servicebio, Wuhan, China) and phenylmethylsulfonyl fluoride (Servicebio) was used to extract total protein in tissues. Samples with the same protein concentration were resolved on a 12% polyacrylamide gel and transferred to a polyvinylidene fluoride membrane (Millipore, Burlington, MA, USA). Membranes were blocked with protein-free rapid sealing solution (Servicebio) at room temperature for 15 min, incubated with the following antibodies at 4 ℃ overnight: GATA2 (1:1,000, Proteintech Cat# 11103-1-AP, RRID:AB_10914503), TFAP2A (1:1,000, Affinity Biosciences Cat# AF0535, RRID:AB_2834124), LMBRD1 (1:1,000, ABclonal Cat# A15866, RRID:AB_2763294), KRT8 (1:2,000, Proteintech Cat# 27105-1-AP, RRID:AB_2918117). The membranes were washed with Tris-buffered saline (100 mM NaCl, 50 mM Tris-HCl, pH 7.6) containing 0.1% Tween 20 thrice for 10 min each, probed with anti-rabbit immunoglobulin G (heavy + light) [IgG (H + L)] (DyLight 800 Conjugate) (1:30,000, Cell Signaling Technology Cat# 5151, RRID:AB_10697505) for 2 h at room temperature, and washed again. The membranes were scanned and imaged using the Odyssey infrared imaging system (LI-COR, Lincoln, NE, USA). The intensity of each band was quantitatively determined by the ImageJ analysis system (Wayne Rasband, National Institutes of Health, USA).
Validation of human protein atlas (HPA)
Protein expression levels of GATA2, TFAP2A, LMBRD1, and KRT8 in carcinoma and normal para-carcinoma tissues were discerned through immunohistochemistry (IHC) images from the HPA database.
Statistical analysis
Gene expression profile and clinical data for the LUAD samples were downloaded from Genomic Data Commons Portal or the GEO database. Statistical analysis was performed using GraphPad Prism (version 7) and R packages. The Student’s t-test and paired t-test were used for independent and paired groups, respectively. The results for continuous variables were presented as the mean ± standard deviation. A P value ≤0.05 was considered statistically significant.
Results
Identification of differential prognostic LRGs in LUAD
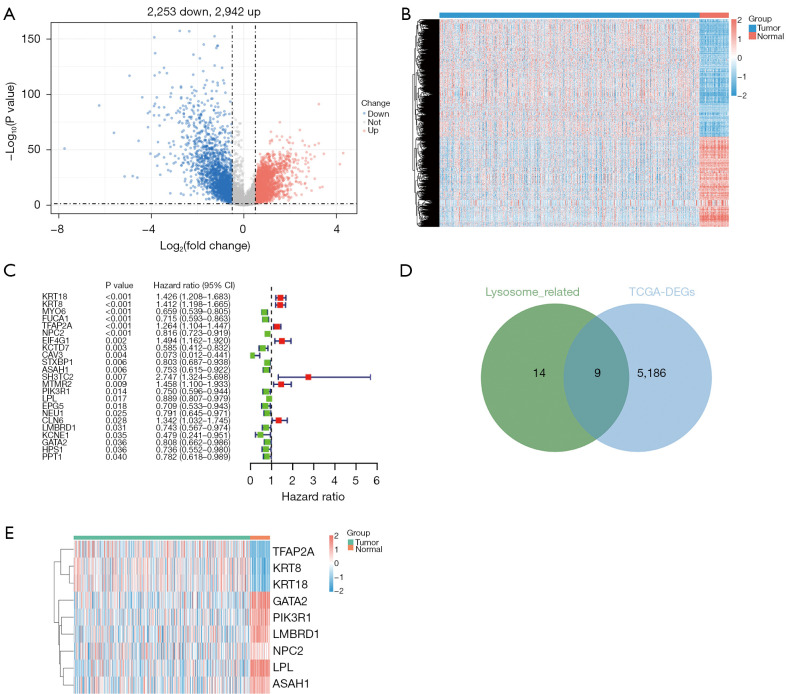
A total of 5,195 DEGs were identified in LUAD samples compared with normal samples, of which 2,942 were upregulated and 2,253 were downregulated (Figure 1A,1B). Moreover, univariate Cox regression analysis of the 144 LRGs revealed 23 prognostic LRGs with P<0.05 (Figure 1C). Finally, overlap analysis between the 5,195 DEGs and 23 prognostic LRGs yielded nine differential prognostic LRGs: TFAP2A, KRT8, KRT18, GATA2, PIK3R1, LMBRD1, NPC2, LPL, and ASAH1 (Figure 1D,1E).
Figure 1.
Identification of differential prognostic LRGs. (A) Volcano plot of differential genes. (B) Heatmap of differential genes. (C) Univariate Cox regression analysis of LRGs. (D) Identification of differential prognostic LRGs. (E) Expression of differential prognostic LRGs. CI, confidence interval; LRGs, lysosome-related genes.
Functional analyses of the nine differential prognostic LRGs
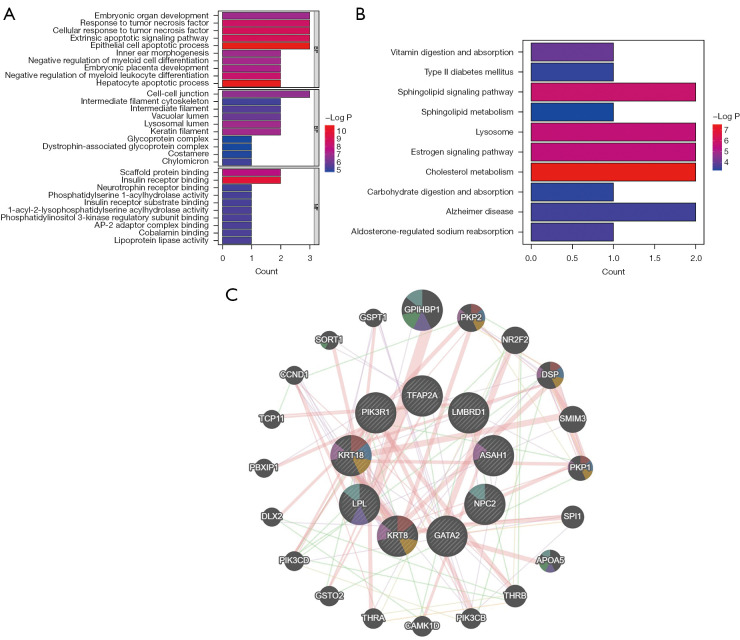
A total of 416 GO terms were enriched in these nine mRNAs. Under the BP sub-ontology, response to tumor necrosis factor, embryonic organ development, extrinsic apoptotic signaling pathway, and epithelial cell apoptotic process were mainly enriched; under CC, cell-cell junction, vacuolar lumen, and lysosomal lumen were mainly enriched; under MF, insulin receptor binding and scaffold protein binding were mainly enriched (Figure 2A). KEGG enrichment analysis revealed 19 terms that were mainly enriched, such as sphingolipid signaling pathway, lysosome, cholesterol metabolism, and estrogen signaling pathway (Figure 2B).
Figure 2.
Enrichment analysis and PPI network of differential prognostic LRGs. (A) GO enrichment of the nine differential prognostic LRGs. (B) KEGG pathway analysis of the nine differential prognostic LRGs. (C) The PPI network of the nine differential prognostic LRGs. BP, biological progress; CC, cellular component; MF, molecular function; PPI, protein-protein interaction; LRGs, lysosome-related genes; GO, Gene Ontology; KEGG, Kyoto Encyclopedia of Genes and Genomes.
The PPI network illustrated the interactions among these nine differential prognostic LRGs; for example, KRT8 co-expressed with KRT18 and DSP, LPL co-expressed with PIK3R1, GPIHBP1, and SMIM3. Additionally, physical interactions existed between KRT18 and KRT8, PKP2 and KRT8, PKP1 and KRT8, PKP1, and KRT18, etc. Genetic interactions existed between PIK3CD and LPL, predicted interactions between KRT8 and KRT18, and shared protein domains between KRT18 and KRT8 (Figure 2C).
Risk model based on GATA2, TFAP2A, LMBRD1, and KRT8 was effective
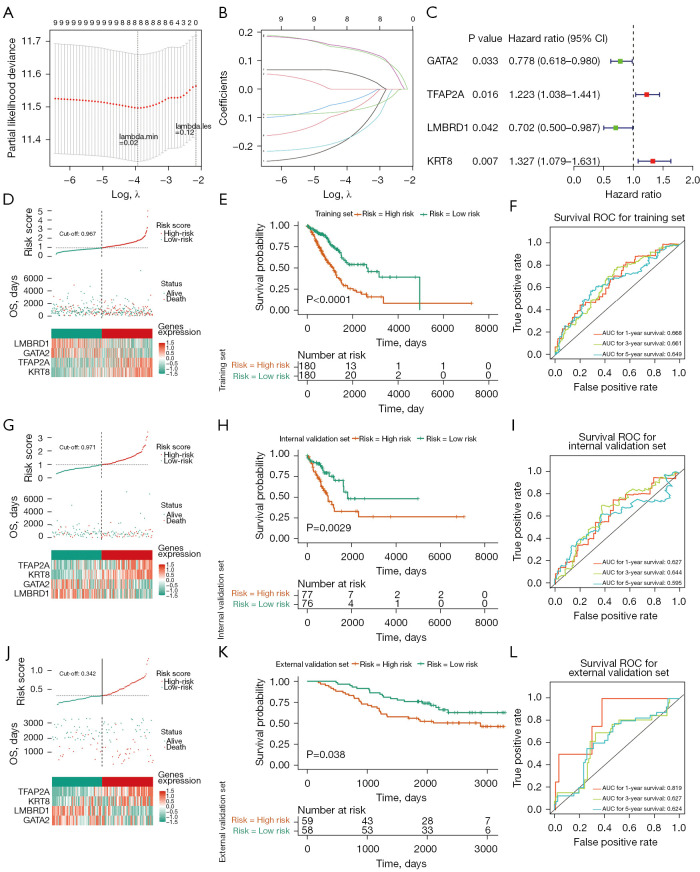
LASSO regression analysis of the nine differential prognostic LRGs yielded eight feature genes (LPL was excluded) corresponding to the lowest cross-validation error (lambda.min =0.02; Figure 3A,3B). Multivariate Cox analysis further demonstrated that the optimal risk model comprised GATA2, TFAP2A, LMBRD1, and KRT8. TFAP2A and KRT8 were used as risk factors, while GATA2 and LMBRD1 as protective factors (Figure 3C). The risk score was calculated as follows: risk score = 0.20155 × TFAP2A + (−0.25089) × GATA2 + (−0.35366) × LMBRD1 + 0.282575 × KRT8. The risk curve based on the risk score predicted a worse outcome in high-risk patients (Figure 3D). The Kaplan-Meier curve revealed that the survival probability of low-risk patients was higher (Figure 3E). Furthermore, the AUCs of the ROC curve in the training set were all greater than 0.64 at 1, 3, and 5 years, illustrating the efficiency of the risk model (Figure 3F). Finally, the results for the internal and external validation sets were consistent with those of the training set (Figure 3G-3L).
Figure 3.
Construction of the risk model. (A,B) LASSO coefficient profile plots of the nine differential prognostic LRGs. (C) Multivariate Cox analysis of eight feature genes. (D) The risk curve, scatter plot, and model gene expression heatmap of the high-risk group in the training set. (E) Survival analysis of the training set. (F) ROC curve of the training set. (G) The risk curve, scatter plot, and model gene expression heatmap of the high- and low-risk groups in the internal validation set. (H) Survival analysis of the internal validation set. (I) ROC curve of the internal validation set. (J) The risk curve, scatter plot, and model gene expression heatmap of the high- and low-risk groups in the external validation set. (K) Survival analysis of the external validation set. (L) ROC curve of the external validation set. CI, confidence interval; OS, overall survival; ROC, receiver operating characteristic; AUC, area under the curve; LASSO, least absolute shrinkage and selection operator; LRGs, lysosome-related genes.
Clinical correlation analysis
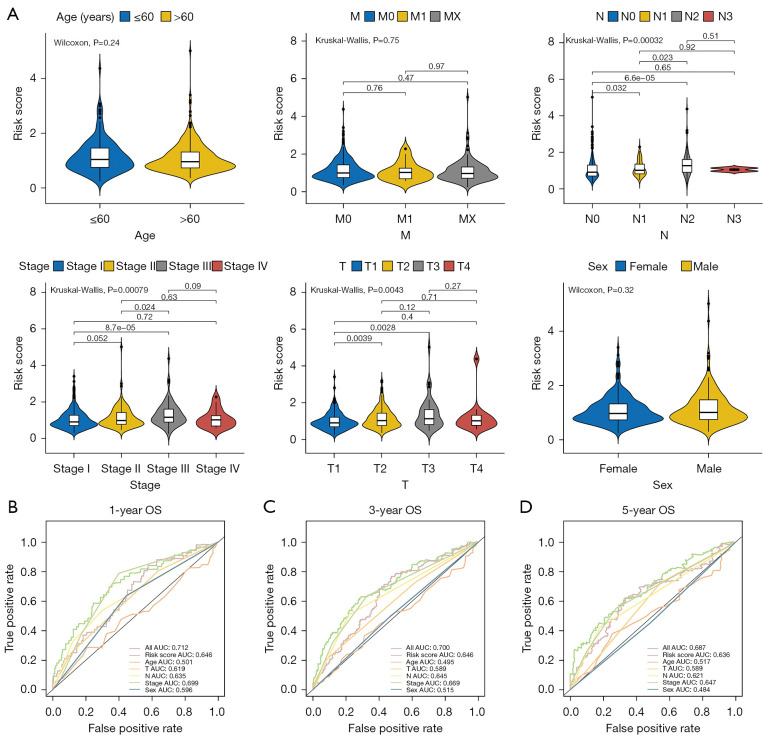
The violin plots of risk scores versus age, T, N, M, sex, and stage demonstrated significant differences among nearly all subgroups of T, N, and stage (Figure 4A). Moreover, the AUC values of the ROC curves for the combination of risk score and all the clinical factors were the best, reaching 0.712, 0.700, and 0.687 at 1, 3, and 5 years, respectively (Figure 4B-4D).
Figure 4.
Clinical correlation analysis. (A) Difference analysis between clinical shape and risk score. (B-D) ROC curve analysis of risk score and clinicopathological characteristics to predicting 1-, 3- and 5-year OS. M, metastasis; N, node; T, tumor; OS, overall survival; AUC, area under the curve; ROC, receiver operating characteristic.
Prediction of the nomogram was accurate
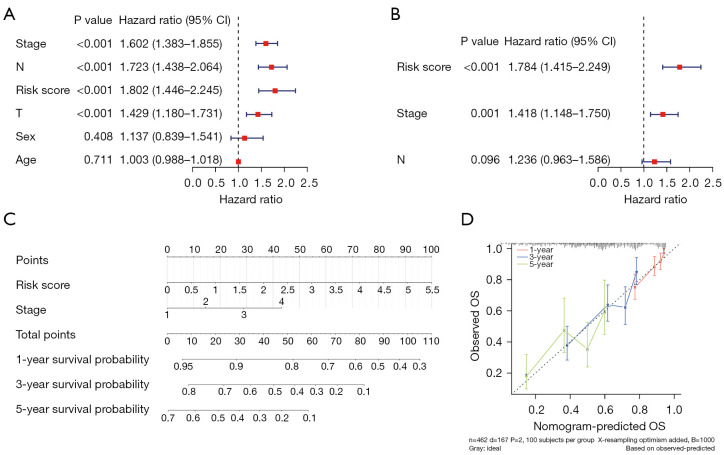
Univariate Cox independent prognostic analysis suggested T, N, stage, and risk score to be independent prognostic factors (P<0.05; Figure 5A). Multivariate Cox independent prognostic analysis further trimmed the candidates down to stage and risk score (Figure 5B). The importance of staging was most probably due to the N stage, which indicated the spread of the cancer to the lymph nodes. Moreover, the concordance index (C-index) of the nomogram was 0.6789, and the slopes of 1-, 3-, and 5-year nomogram calibration curves were 0.7034, 0.3816, and 0.1899, respectively, indicating the accuracy of this model’s prediction (Figure 5C,5D).
Figure 5.
Construction of an independent prognostic model. (A,B) Univariate and multivariate Cox regression analyses for identifying independent prognostic factors. (C) Nomogram of the independent prognostic model. (D) Calibration curve of the nomogram. CI, confidence interval; OS, overall survival.
GSVA enrichment analysis
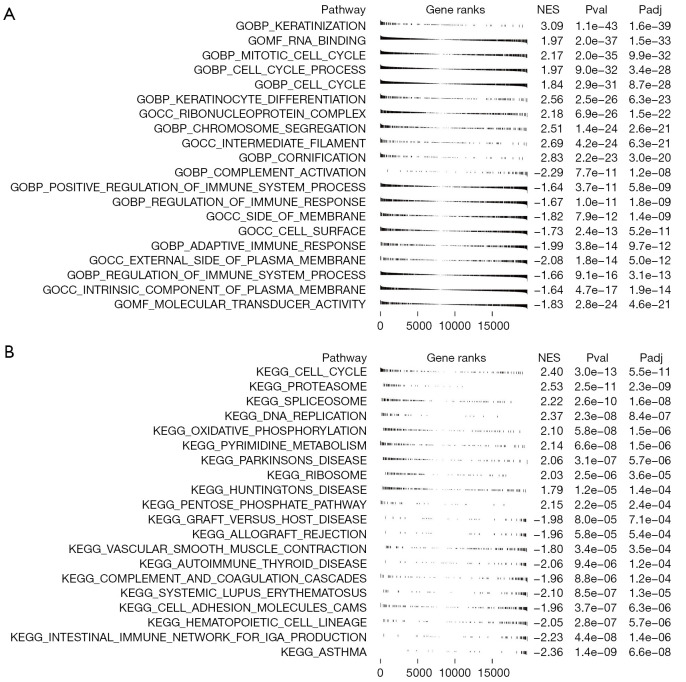
The GSVA results highlighted the effects of the risk score on tumor development. In the GO enrichment analysis, 1,276 and 2,470 pathways were significantly enriched in the high- and low-risk groups, respectively. Keratinization, RNA binding, mitotic cell cycle, keratinocyte differentiation, cell cycle process, ribonucleoprotein complex, cell cycle, chromosome segregation, intermediate filament, and cornification were significantly enriched in the high-risk group. Twenty-four terms, such as external side of plasma membrane, molecular transducer activity, regulation of immune system process, intrinsic component of plasma membrane, adaptive immune response, complement activation cell surface, side of membrane, regulation of immune response, and positive regulation of immune system process, were mainly enriched in the low-risk group (Figure 6A). KEGG enrichment analysis revealed 23 pathways to be enriched in the high-risk group, including spliceosome, cell cycle, and proteasome among others, and 55 pathways to be enriched in the low-risk group, such as asthma, hematopoietic cell lineage, and autoimmune thyroid disease among others (Figure 6B).
Figure 6.
Functional enrichment analysis of the high- and low-risk groups. (A) GO enrichment analysis of the high- and low-risk groups. (B) KEGG enrichment analysis of the high- and low-risk groups. NES, normalization enrichment score; Pval, P value; Padj, P adjust; GO, Gene Ontology; KEGG, Kyoto Encyclopedia of Genes and Genomes.
Tumor immune cells infiltration and differential ICIs
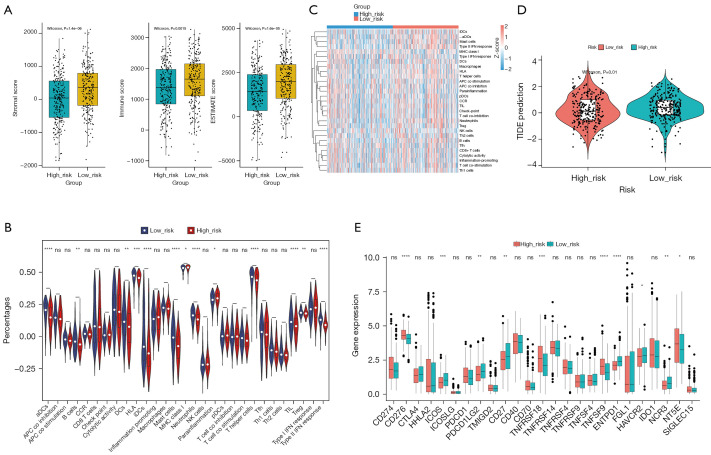
ESTIMATE and ssGSEA were employed to explore the tumor microenvironment in LUAD. The stromal scores, immune scores, and ESTIMATE combined scores of the high-risk group were significantly lower than those of the low-risk group (Figure 7A). Additionally, ssGSEA analysis illustrated that most of the immune cell scores, such as those of activated dendritic cells (aDCs), B cells, DCs, human leukocyte antigen (HLA), and mast cells, were significantly higher in the low-risk group, reflecting that immune function differed between the risk groups (Figure 7B,7C).
Figure 7.
Analysis of immune cells in the high- and low-risk groups. (A) ESTIMATE score of the high- and low-risk groups. (B) Immune score violin chart of immune cells in the high- and low-risk groups. (C) Immune score heatmap of immune cells in the high- and low-risk groups. (D) Analysis of TIDE score differences between the high- and low-risk groups. (E) Analysis of immunoassay site differences in the high- and low-risk groups. *, P<0.05; **, P<0.01; ***, P<0.001; ****, P<0.0001; ns, no significance. iDCs, immature dendritic cells; aDCs, activated dendritic cells; IFN, interferon; MHC, major histocompatibility complex; DCs, dendritic cells; HLA, human leukocyte antigen; APC, antigen-presenting cell; pDCs, plasmacytoid dendritic cells; CCR, C-C motif chemokine receptor; TIL, tumor-infiltrating lymphocytes; Treg, T cell regulatory; NK, natural killer; Th, T helper; Tfh, T follicular helper; TIDE, Tumor Immune Dysfunction and Exclusion; ESTIMATE, Estimation of Stromal and Immune cells in Malignant Tumor tissues using Expression data.
TIDE scores, which reflect the immunotherapy response, varied significantly between the risk groups (P=0.01; Figure 7D). Moreover, the expression of CD276, ICOS, PDCD1LG2, CD27, TNFRSF18, TNFSF9, ENTPD1, ENTPD1, HAVCR2, NCR3, and NT5E differed significantly between the two risk groups (Figure 7E).
Correlations between mutation and survival
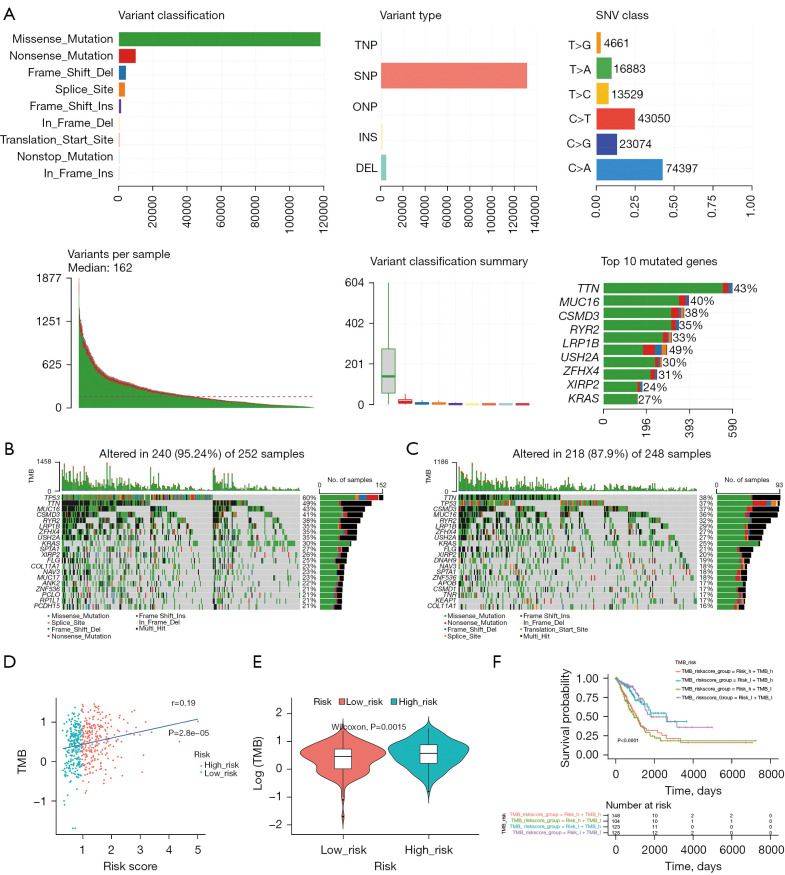
The overall presentation of the TCGA-LUAD mutation data revealed missense mutations and single nucleotide polymorphisms to be the top variant classification and variant type, respectively. Moreover, the median variant value in each sample was found to be 162, and the top 10 mutated genes were TTN, MUC16, CSMD3, RYR2, LRP1B, TP53, USH2A, ZFHX4, XIRP2, and KRAS (Figure 8A). The samples of each group were extracted after merging the mutation data with the high-risk and low-risk groups, and the top 20 genes with the highest mutation frequency were plotted on a waterfall map. In the high-risk group, 240 of 252 samples (95.24%) carried mutations, whereas in the low-risk group, 218 of 248 samples (87.9%) harbored mutations (Figure 8B,8C). Both TP53 and TTN exhibited the highest mutation frequency of all genes in both the risk groups.
Figure 8.
Analysis of mutations in the high- and low-risk groups. (A) Overall description of the mutational landscape in TCGA-LUAD patients. (B) Mutational landscape of high-risk patients. (C) Mutational landscape of low-risk patients. (D) Difference analysis of TMB between the high- and low-risk groups. (E) Correlation analysis of TMB and risk score of patients. (F) Joint survival curve of TMB and high- and low-risk groups. SNV, simple nucleotide variation; TMB, tumor mutation burden; TCGA, The Cancer Genome Atlas; LUAD, lung adenocarcinoma.
The high-risk group had a significantly higher TMB (P=0.0015; Figure 8D). The correlation between TMB and risk score was weak-to-moderate, but significant (P<0.05; Figure 8E). Kaplan-Meier survival curves illustrated that the survival probabilities of the “low-risk score + high-TMB” and “low-risk score + low-TMB” groups were significantly higher (P<0.0001; Figure 8F).
Chemotherapy drugs performed differently
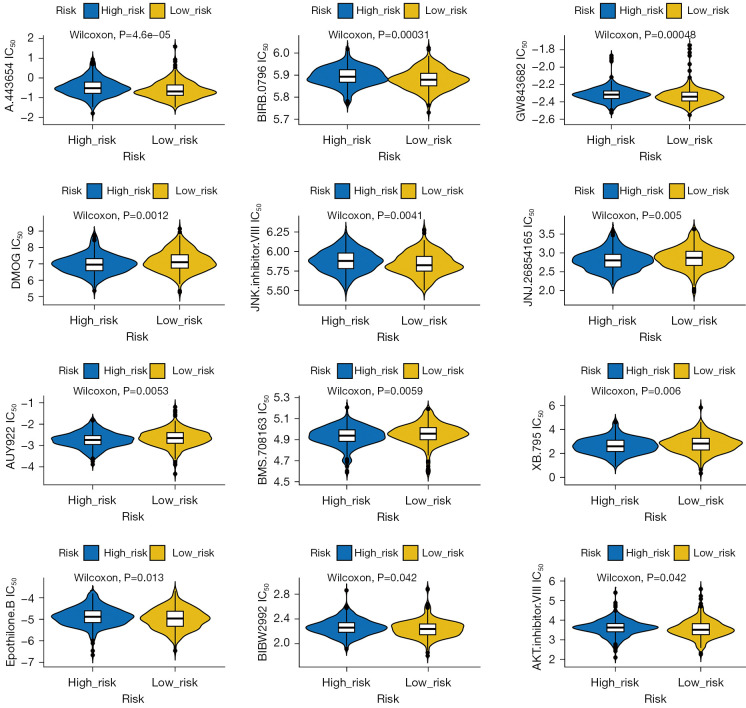
Among the 56 chemotherapeutic drugs investigated, 12, including A.443654, BIRB.0796, GW843682X, DMOG, JNK.inhibitor.VIII, JNJ.26854165, AUY922, BMS.708163, BX.795, epothilone.B, BIBW2992, and AKT.inhibitor.VIII, exhibited significantly different IC50 values between the two groups (P<0.05; Figure 9).
Figure 9.
Analysis of drug sensitivities in the high- and low-risk groups. IC50, half maximal inhibitory concentration.
Relevance of TFAP2A and GATA2 in LUAD
TFAP2A was shown to critically promote LUAD progression, while GATA2 expression was found significantly reduced in lung cancer (20,21). Therefore, we investigated the relationship between these prognostic biomarkers and LUAD. First, we identified 1,338 genes targeting TFAP2A and 5,240 genes targeting GATA2, and considered their intersection to obtain 514 common target genes, whose potential functions were mined (Figure S2A, available online: https://cdn.amegroups.cn/static/public/tlcr-23-14-3.xlsx). TFAP2A was found to be associated with pathways related to cell replication, protein modifications, and metabolic processes, such as negative regulation of the cell cycle, cell cycle checkpoint signaling, carbon metabolism, and tricarboxylic acid cycle among others (Figure S2B). GATA2 was found to be associated with RNA splicing, ribonucleoprotein complex biogenesis, mitochondrial matrix and immune-related pathways, and p53 signaling pathway among others (Figure S2C). The PPI network of TFAP2A, GATA2, and their interacting genes revealed strong interactions between TFAP2A and TFAP2D, as well as GATA2 and ZFPM1 (Figure S2D). Furthermore, the target genes of GATA2 were found to be mainly correlated with the positive regulation of transcription by RNA polymerase II, endothelial cell migration, and cell differentiation among other processes. Finally, we explored the fluctuations in TFAP2A and GATA2 expression in different sub-groups of clinical factors. TFAP2A expression significantly differed between males and females, as well as between T1 and T2, while GATA2 expression significantly differed by age, sex, and between T1 and T3 (Figure S2E). In summary, TFAP2 and GATA2 were linked with the prognosis of LUAD patients.
External experimental verification
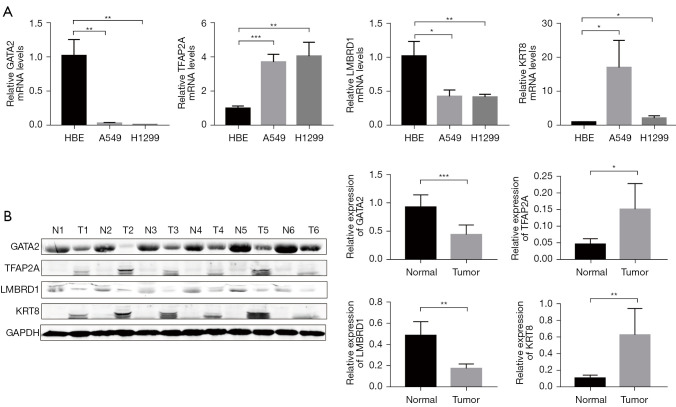
The mRNA levels of KRT8 and TFAP2A were upregulated, while those of GATA2 and LMBRD1 were downregulated in A549 and H1299 cell lines compared with human bronchial epithelial cells (Figure 10A). In addition, Western blot analysis also confirmed that the expression of KRT8 and TFAP2A proteins in six cancer tissues was higher than that in tumor-adjacent tissues, while the expression of GATA2 and LMBRD1 proteins was lower than that in tumor-adjacent tissues (Figure 10B). HPA database was used to show protein levels of four genes. Compared with the normal samples, the protein expression levels of KRT8 and TFAP2A were higher, while the expression level of GATA2 and LMBRD1 was lower in the LUAD samples (Figure S3).
Figure 10.
External experimental verification. (A) Relative mRNA expression of GATA2, TFAP2A, LMBRD1, and KRT8 in LUAD and lung bronchial epithelial cell lines. (B) Protein expression levels of GATA2, TFAP2A, LMBRD1, and KRT8 in LUAD and adjacent tissues. *, P<0.05; **, P<0.01; ***, P<0.001. mRNA, messenger RNA; N, normal tissue; T, tumor tissue; GAPDH, glyceraldehyde-3-phosphate dehydrogenase; LUAD, lung adenocarcinoma.
Discussion
The role of LRGs in LUAD has never been systematically investigated before. An important hallmark of cancer is the increased requirement for new biomass. Lysosomes can contribute to the synthesis of macromolecular precursors. The activity of lysosomal enzymes was shown to be lower in adjacent normal tissues compared with tumor tissues (22). Indeed, many cancer biomarkers result from lysosomal function and dysfunction (23). Therefore, understanding lysosomal changes that occur in cancer is critical to develop therapies targeting this organelle. Nowadays, cancer immunotherapy is becoming one of the main treatments for lung cancer (24). Previous findings in this domain sparked our interest in exploring the predictive and prognostic value of LRGs, as well as their relevance to anti-tumor immunity in LUAD.
In this study, nine genes or prognostic factors were found to be differentially expressed between LUAD and normal samples. LASSO regression and multivariate Cox analysis highlighted four of these—GATA2, TFAP2A, LMBRD1, and KRT8—to be significant, and the model constructed using these four prognostic biomarkers was found to be the optimal model.
GATA2 encodes a zinc finger transcription factor that plays a crucial role in hematopoietic cell development and maintenance (25). Studies have revealed low expression of GATA2 in lung cancer (26). However, knockdown of GATA2 in KRAS mutant tumors did not affect the survival of malignant cells (27). GATA2 regulates endothelin-1 expression in endothelial cells (28). TFAP2A, a transcription factor from the activator protein 2 (AP-2) family, plays an important role in carcinogenesis and neural crest development (29-31). AP-2 family transcription factors regulate the cell cycle, proliferation, and apoptosis during embryogenesis (32). Previously, TFAP2A was found to suppress the proliferation of lung cancer, induce apoptosis, and enhance chemosensitivity (33). Contrastingly, TFAP2A was also found to play a cancer-promoting role by upregulating telomerase to resist apoptosis, besides promoting the proliferation, invasion, and migration of lung cancer by increasing inositol-trisphosphate 3-kinase A (34,35). LMBRD1 encodes a membrane protein required for the transport and metabolism of cobalamin, and its mutations are related to the vitamin B12 metabolic disorder (36). KRT8 is a member of the type II keratin family, and is essential for the development and metastasis of LUAD (37). Wang et al. found that KRT8 was over-expressed in tumor tissues compared with normal tissues, and was associated with poorer prognosis in LUAD (38). The findings from this study are consistent with those from previous studies.
TFAP2A has been found to be a risk factor and GATA2 a protective factor. We analyzed the biological functions that are specifically regulated by each of these factors, leading to specific observations at the clinical level. The genes targeting TFAP2A were enriched in pathways related to cell replication and metabolic processes such as negative regulation of cell cycle and cell cycle checkpoint signaling among others. The target genes of GATA2 were mainly enriched in processes like the positive regulation of transcription by RNA polymerase II, endothelial cell migration, and cell differentiation among others. Although different subtypes of clinical factors did not exhibit significant differences, all these factors were shown to possess significant prognostic value.
We found that p53 and TTN showed the highest mutation frequencies in the high-risk and low-risk groups, respectively. Both these genes are related to immunotherapy (39). Abnormal P53 function in cancer can affect the recruitment and activity of T cells, leading to immune escape and tumor progression (40). The expression level of TTN is not only positively correlated with the infiltration level of CD8+ and CD4+ T cells but also closely related to TMB and immune checkpoint block (41,42).
Nowadays, immunotherapy has become a promising approach to treat LUAD. Establishing a new way of identifying patients that might benefit from immunotherapy is enormously challenging (43). The immune microenvironment was shown to be related to lysosomal activities in cells like DCs and macrophages (11). Additionally, toll-like receptors on lysosomal membranes can sense various microbial and host-derived ligands, and initiate inflammatory signaling (44). Both follicular B cells and mature DCs can play an important role in the protective immune response, and are associated with higher survival in patients of non-small cell lung carcinoma (45). HLA participates in antigen presentation and plays an important role in antitumor immunity. The downregulation of HLA-I in lung cancer was demonstrated to be closely related to tumor immune escape (46,47). In this study, most immune cell scores, such as those of antigen presenting cell co-inhibition, B cells, DCs, HLA, and mast cells, were significantly higher in the low-risk group, indicating that immune function differed between the two groups. GO enrichment analysis revealed that immune receptor activity, B cell receptor signaling, major histocompatibility complex protein, and major histocompatibility complex class II were enriched in the low-risk group, reflecting the enrichment of the immune response. In conclusion, these results suggest that patients in the low-risk group displayed better responses to immunotherapy.
This study has some limitations. First, we did not study the underlying mechanisms of the four prognostic LRGs identified in this study. In vitro and in vivo experiments can corroborate the findings of this study. Second, the prognostic model was constructed and validated based on TCGA and GEO databases. Multi-center, prospective studies should be conducted in the future.
Conclusions
This is the first study to construct a prognostic model using LRGs. The model predicted the prognosis and survival outcome of LUAD patients with high accuracy. In addition, the prognostic model was found to be related to TTN and TP53 mutations, TMB index, immune microenvironment, immunotherapy response analysis, and various anticancer drugs in LUAD patients. We believe that these findings may provide valuable insights for further research on lysosomes and lung cancer.
Supplementary
The article’s supplementary files as
Acknowledgments
The authors appreciate the academic support from the AME Lung Cancer Collaborative Group. We also acknowledge the contributions of all doctors from the Department of Thoracic Surgery, Affiliated Hospital of Nantong University to the study, who gave written permission for the publication of data and conclusions. We acknowledge TCGA and GEO databases, and contributors for uploading their meaningful datasets.
Funding: This work was supported by the National Natural Science Foundation of China (No. 81770266), Clinical Medical Research Center of Cardiothoracic Diseases in Nantong (No. HS2019001), Innovation Team of Cardiothoracic Disease in Affiliated Hospital of Nantong University (No. TECT-A04), and Nantong Key Laboratory of Translational Medicine of Cardiothoracic.
Ethical Statement: The authors are accountable for all aspects of the work in ensuring that questions related to the accuracy or integrity of any part of the work are appropriately investigated and resolved. The study was conducted in accordance with the Declaration of Helsinki (as revised in 2013). The study was approved by the Ethics Committee of the Affiliated Hospital of Nantong University (No. 2022-L165) and informed consent was taken from all the patients.
Footnotes
Reporting Checklist: The authors have completed the TRIPOD reporting checklist. Available at https://tlcr.amegroups.com/article/view/10.21037/tlcr-23-14/rc
Data Sharing Statement: Available at https://tlcr.amegroups.com/article/view/10.21037/tlcr-23-14/dss
Peer Review File: Available at https://tlcr.amegroups.com/article/view/10.21037/tlcr-23-14/prf
Conflicts of Interest: All authors have completed the ICMJE uniform disclosure form (available at https://tlcr.amegroups.com/article/view/10.21037/tlcr-23-14/coif). The authors have no conflicts of interest to declare.
References
- 1.Kalemkerian GP, Akerley W, Bogner P, et al. Small cell lung cancer. J Natl Compr Canc Netw 2013;11:78-98. 10.6004/jnccn.2013.0011 [DOI] [PMC free article] [PubMed] [Google Scholar]
- 2.Sung H, Ferlay J, Siegel RL, et al. Global Cancer Statistics 2020: GLOBOCAN Estimates of Incidence and Mortality Worldwide for 36 Cancers in 185 Countries. CA Cancer J Clin 2021;71:209-49. 10.3322/caac.21660 [DOI] [PubMed] [Google Scholar]
- 3.Barta JA, Powell CA, Wisnivesky JP. Global Epidemiology of Lung Cancer. Ann Glob Health 2019;85:8. 10.5334/aogh.2419 [DOI] [PMC free article] [PubMed] [Google Scholar]
- 4.Zappa C, Mousa SA. Non-small cell lung cancer: current treatment and future advances. Transl Lung Cancer Res 2016;5:288-300. 10.21037/tlcr.2016.06.07 [DOI] [PMC free article] [PubMed] [Google Scholar]
- 5.Dogan S, Shen R, Ang DC, et al. Molecular epidemiology of EGFR and KRAS mutations in 3,026 lung adenocarcinomas: higher susceptibility of women to smoking-related KRAS-mutant cancers. Clin Cancer Res 2012;18:6169-77. 10.1158/1078-0432.CCR-11-3265 [DOI] [PMC free article] [PubMed] [Google Scholar]
- 6.Moreira AL, Eng J. Personalized therapy for lung cancer. Chest 2014;146:1649-57. 10.1378/chest.14-0713 [DOI] [PubMed] [Google Scholar]
- 7.Lübke T, Lobel P, Sleat DE. Proteomics of the lysosome. Biochim Biophys Acta 2009;1793:625-35. 10.1016/j.bbamcr.2008.09.018 [DOI] [PMC free article] [PubMed] [Google Scholar]
- 8.Martinet W, De Meyer I, Verheye S, et al. Drug-induced macrophage autophagy in atherosclerosis: for better or worse? Basic Res Cardiol 2013;108:321. 10.1007/s00395-012-0321-1 [DOI] [PubMed] [Google Scholar]
- 9.Schneider L, Zhang J. Lysosomal function in macromolecular homeostasis and bioenergetics in Parkinson's disease. Mol Neurodegener 2010;5:14. 10.1186/1750-1326-5-14 [DOI] [PMC free article] [PubMed] [Google Scholar]
- 10.Gan-Or Z, Dion PA, Rouleau GA. Genetic perspective on the role of the autophagy-lysosome pathway in Parkinson disease. Autophagy 2015;11:1443-57. 10.1080/15548627.2015.1067364 [DOI] [PMC free article] [PubMed] [Google Scholar]
- 11.Zhang Z, Yue P, Lu T, et al. Role of lysosomes in physiological activities, diseases, and therapy. J Hematol Oncol 2021;14:79. 10.1186/s13045-021-01087-1 [DOI] [PMC free article] [PubMed] [Google Scholar]
- 12.Jechorek D, Votapek J, Meyer F, et al. Characterization of cathepsin X in colorectal cancer development and progression. Pathol Res Pract 2014;210:822-9. 10.1016/j.prp.2014.08.014 [DOI] [PubMed] [Google Scholar]
- 13.Deng L, Chen L, Zhao L, et al. Ubiquitination of Rheb governs growth factor-induced mTORC1 activation. Cell Res 2019;29:136-50. 10.1038/s41422-018-0120-9 [DOI] [PMC free article] [PubMed] [Google Scholar]
- 14.Vairo FP, Boczek NJ, Cousin MA, et al. The prevalence of diseases caused by lysosome-related genes in a cohort of undiagnosed patients. Mol Genet Metab Rep 2017;13:46-51. 10.1016/j.ymgmr.2017.08.001 [DOI] [PMC free article] [PubMed] [Google Scholar]
- 15.Ritchie ME, Phipson B, Wu D, et al. limma powers differential expression analyses for RNA-sequencing and microarray studies. Nucleic Acids Res 2015;43:e47. 10.1093/nar/gkv007 [DOI] [PMC free article] [PubMed] [Google Scholar]
- 16.Wu T, Hu E, Xu S, et al. clusterProfiler 4.0: A universal enrichment tool for interpreting omics data. Innovation (Camb) 2021;2:100141. 10.1016/j.xinn.2021.100141 [DOI] [PMC free article] [PubMed] [Google Scholar]
- 17.Lu X, Jiang L, Zhang L, et al. Immune Signature-Based Subtypes of Cervical Squamous Cell Carcinoma Tightly Associated with Human Papillomavirus Type 16 Expression, Molecular Features, and Clinical Outcome. Neoplasia 2019;21:591-601. 10.1016/j.neo.2019.04.003 [DOI] [PMC free article] [PubMed] [Google Scholar]
- 18.Kolmykov S, Yevshin I, Kulyashov M, et al. GTRD: an integrated view of transcription regulation. Nucleic Acids Res 2021;49:D104-11. 10.1093/nar/gkaa1057 [DOI] [PMC free article] [PubMed] [Google Scholar]
- 19.Franz M, Rodriguez H, Lopes C, et al. GeneMANIA update 2018. Nucleic Acids Res 2018;46:W60-4. 10.1093/nar/gky311 [DOI] [PMC free article] [PubMed] [Google Scholar]
- 20.Xiong Y, Feng Y, Zhao J, et al. TFAP2A potentiates lung adenocarcinoma metastasis by a novel miR-16 family/TFAP2A/PSG9/TGF-β signaling pathway. Cell Death Dis 2021;12:352. 10.1038/s41419-021-03606-x [DOI] [PMC free article] [PubMed] [Google Scholar]
- 21.Zhang Y, Song D, Peng Z, et al. LINC00891 regulated by miR-128-3p/GATA2 axis impedes lung cancer cell proliferation, invasion and EMT by inhibiting RhoA pathway. Acta Biochim Biophys Sin (Shanghai) 2022;54:378-87. 10.3724/abbs.2022005 [DOI] [PMC free article] [PubMed] [Google Scholar]
- 22.Kirkegaard T, Jäättelä M. Lysosomal involvement in cell death and cancer. Biochim Biophys Acta 2009;1793:746-54. 10.1016/j.bbamcr.2008.09.008 [DOI] [PubMed] [Google Scholar]
- 23.Hanahan D, Weinberg RA. Hallmarks of cancer: the next generation. Cell 2011;144:646-74. 10.1016/j.cell.2011.02.013 [DOI] [PubMed] [Google Scholar]
- 24.Burugu S, Dancsok AR, Nielsen TO. Emerging targets in cancer immunotherapy. Semin Cancer Biol 2018;52:39-52. 10.1016/j.semcancer.2017.10.001 [DOI] [PubMed] [Google Scholar]
- 25.Sperling AS, Gibson CJ, Ebert BL. The genetics of myelodysplastic syndrome: from clonal haematopoiesis to secondary leukaemia. Nat Rev Cancer 2017;17:5-19. 10.1038/nrc.2016.112 [DOI] [PMC free article] [PubMed] [Google Scholar]
- 26.Gong C, Fan Y, Zhou X, et al. Comprehensive Analysis of Expression and Prognostic Value of GATAs in Lung Cancer. J Cancer 2021;12:3862-76. 10.7150/jca.52623 [DOI] [PMC free article] [PubMed] [Google Scholar]
- 27.Tessema M, Yingling CM, Snider AM, et al. GATA2 is epigenetically repressed in human and mouse lung tumors and is not requisite for survival of KRAS mutant lung cancer. J Thorac Oncol 2014;9:784-93. 10.1097/JTO.0000000000000165 [DOI] [PMC free article] [PubMed] [Google Scholar]
- 28.Park TS, Zimmerlin L, Evans-Moses R, et al. Vascular progenitors generated from tankyrase inhibitor-regulated naïve diabetic human iPSC potentiate efficient revascularization of ischemic retina. Nat Commun 2020;11:1195. 10.1038/s41467-020-14764-5 [DOI] [PMC free article] [PubMed] [Google Scholar]
- 29.Wenke AK, Bosserhoff AK. Roles of AP-2 transcription factors in the regulation of cartilage and skeletal development. FEBS J 2010;277:894-902. 10.1111/j.1742-4658.2009.07509.x [DOI] [PubMed] [Google Scholar]
- 30.Eckert D, Buhl S, Weber S, et al. The AP-2 family of transcription factors. Genome Biol 2005;6:246. 10.1186/gb-2005-6-13-246 [DOI] [PMC free article] [PubMed] [Google Scholar]
- 31.Kołat D, Kałuzińska Ż, Bednarek AK, et al. The biological characteristics of transcription factors AP-2α and AP-2γ and their importance in various types of cancers. Biosci Rep 2019;39:BSR20181928. 10.1042/BSR20181928 [DOI] [PMC free article] [PubMed] [Google Scholar]
- 32.Hilger-Eversheim K, Moser M, Schorle H, et al. Regulatory roles of AP-2 transcription factors in vertebrate development, apoptosis and cell-cycle control. Gene 2000;260:1-12. 10.1016/S0378-1119(00)00454-6 [DOI] [PubMed] [Google Scholar]
- 33.Wajapeyee N, Somasundaram K. Cell cycle arrest and apoptosis induction by activator protein 2alpha (AP-2alpha) and the role of p53 and p21WAF1/CIP1 in AP-2alpha-mediated growth inhibition. J Biol Chem 2003;278:52093-101. 10.1074/jbc.M305624200 [DOI] [PubMed] [Google Scholar]
- 34.Wei CW, Lin CC, Yu YL, et al. n-Butylidenephthalide induced apoptosis in the A549 human lung adenocarcinoma cell line by coupled down-regulation of AP-2alpha and telomerase activity. Acta Pharmacol Sin 2009;30:1297-306. 10.1038/aps.2009.124 [DOI] [PMC free article] [PubMed] [Google Scholar]
- 35.Guoren Z, Zhaohui F, Wei Z, et al. TFAP2A Induced ITPKA Serves as an Oncogene and Interacts with DBN1 in Lung Adenocarcinoma. Int J Biol Sci 2020;16:504-14. 10.7150/ijbs.40435 [DOI] [PMC free article] [PubMed] [Google Scholar]
- 36.Coelho D, Kim JC, Miousse IR, et al. Mutations in ABCD4 cause a new inborn error of vitamin B12 metabolism. Nat Genet 2012;44:1152-5. 10.1038/ng.2386 [DOI] [PubMed] [Google Scholar]
- 37.Xie L, Dang Y, Guo J, et al. High KRT8 Expression Independently Predicts Poor Prognosis for Lung Adenocarcinoma Patients. Genes (Basel) 2019;10:36. 10.3390/genes10010036 [DOI] [PMC free article] [PubMed] [Google Scholar]
- 38.Wang W, He J, Lu H, et al. KRT8 and KRT19, associated with EMT, are hypomethylated and overexpressed in lung adenocarcinoma and link to unfavorable prognosis. Biosci Rep 2020;40:BSR20193468. 10.1042/BSR20193468 [DOI] [PMC free article] [PubMed] [Google Scholar]
- 39.Liu Z, Wang L, Guo C, et al. TTN/OBSCN 'Double-Hit' predicts favourable prognosis, 'immune-hot' subtype and potentially better immunotherapeutic efficacy in colorectal cancer. J Cell Mol Med 2021;25:3239-51. 10.1111/jcmm.16393 [DOI] [PMC free article] [PubMed] [Google Scholar]
- 40.Blagih J, Buck MD, Vousden KH. p53, cancer and the immune response. J Cell Sci 2020;133:jcs237453. 10.1242/jcs.237453 [DOI] [PubMed] [Google Scholar]
- 41.Chen J, Wen Y, Su H, et al. Deciphering Prognostic Value of TTN and Its Correlation With Immune Infiltration in Lung Adenocarcinoma. Front Oncol 2022;12:877878. 10.3389/fonc.2022.877878 [DOI] [PMC free article] [PubMed] [Google Scholar]
- 42.Jia Q, Wang J, He N, et al. Titin mutation associated with responsiveness to checkpoint blockades in solid tumors. JCI Insight 2019;4:e127901. 10.1172/jci.insight.127901 [DOI] [PMC free article] [PubMed] [Google Scholar]
- 43.Camidge DR, Doebele RC, Kerr KM. Comparing and contrasting predictive biomarkers for immunotherapy and targeted therapy of NSCLC. Nat Rev Clin Oncol 2019;16:341-55. 10.1038/s41571-019-0173-9 [DOI] [PubMed] [Google Scholar]
- 44.Balka KR, De Nardo D. Understanding early TLR signaling through the Myddosome. J Leukoc Biol 2019;105:339-51. 10.1002/JLB.MR0318-096R [DOI] [PubMed] [Google Scholar]
- 45.Germain C, Gnjatic S, Tamzalit F, et al. Presence of B cells in tertiary lymphoid structures is associated with a protective immunity in patients with lung cancer. Am J Respir Crit Care Med 2014;189:832-44. 10.1164/rccm.201309-1611OC [DOI] [PubMed] [Google Scholar]
- 46.Wang H, Wang Q. HLA and immune of lung cancer. Zhongguo Fei Ai Za Zhi 2010;13:149-53. [DOI] [PMC free article] [PubMed] [Google Scholar]
- 47.Chew GL, Campbell AE, De Neef E, et al. DUX4 Suppresses MHC Class I to Promote Cancer Immune Evasion and Resistance to Checkpoint Blockade. Dev Cell 2019;50:658-71.e7. 10.1016/j.devcel.2019.06.011 [DOI] [PMC free article] [PubMed] [Google Scholar]
Associated Data
This section collects any data citations, data availability statements, or supplementary materials included in this article.
Supplementary Materials
The article’s supplementary files as


