Abstract
Purpose
To investigate the impact of longitudinal variation in functional tumor volume (FTV) underestimation and overestimation in predicting pathologic complete response (pCR) after neoadjuvant chemotherapy (NAC).
Materials and Methods
Women with breast cancer who were enrolled in the prospective I-SPY 2 TRIAL (Investigation of Serial Studies to Predict Your Therapeutic Response with Imaging and Molecular Analysis 2) from May 2010 to November 2016 were eligible for this retrospective analysis. Participants underwent four MRI examinations during NAC treatment. FTV was calculated based on automated segmentation. Baseline FTV before treatment (FTV0) and the percentage of FTV change at early treatment and inter-regimen time points relative to baseline (∆FTV1 and ∆FTV2, respectively) were classified into high-standard or standard groups based on visual assessment of FTV under- and overestimation. Logistic regression models predicting pCR using single predictors (FTV0, ∆FTV1, and ∆FTV2) and multiple predictors (all three) were developed using bootstrap resampling with out-of-sample data evaluation with the area under the receiver operating characteristic curve (AUC) independently in each group.
Results
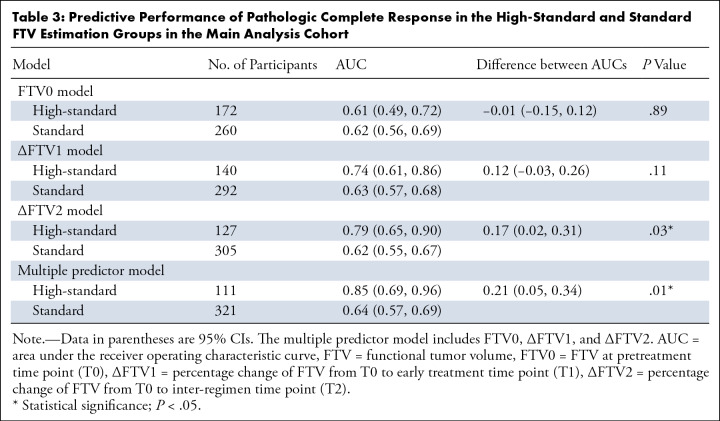
This study included 432 women (mean age, 49.0 years ± 10.6 [SD]). In the FTV0 model, the high-standard and standard groups showed similar AUCs (0.61 vs 0.62). The high-standard group had a higher estimated AUC compared with the standard group in the ∆FTV1 (0.74 vs 0.63), ∆FTV2 (0.79 vs 0.62), and multiple predictor models (0.85 vs 0.64), with a statistically significant difference for the latter two models (P = .03 and P = .01, respectively).
Conclusion
The findings in this study suggest that longitudinal variation in FTV estimation needs to be considered when using early FTV change as an MRI-based criterion for breast cancer treatment personalization.
Keywords: Breast, Cancer, Dynamic Contrast-enhanced, MRI, Tumor Response
ClinicalTrials.gov registration no. NCT01042379
Supplemental material is available for this article.
© RSNA, 2023
See also the commentary by Ram in this issue.
Keywords: Breast, Cancer, Dynamic Contrast-enhanced, MRI, Tumor Response
Summary
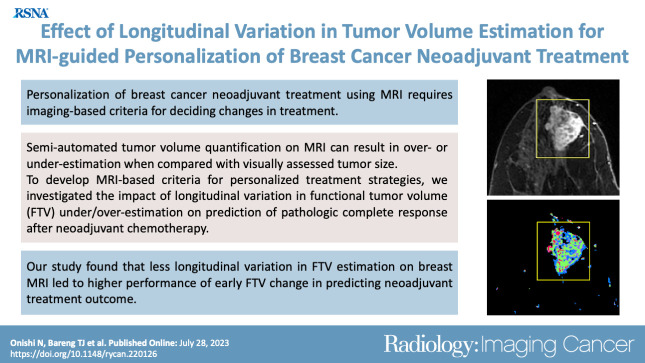
Less longitudinal variation in functional tumor volume (FTV) estimation at breast MRI led to higher performance of early FTV change in predicting pathologic complete response in women with breast cancer who were undergoing neoadjuvant chemotherapy.
Key Points
■ The estimated area under the receiver operating characteristic curve (AUC) was consistently higher for the high-standard functional tumor volume (FTV) estimation group than the standard FTV estimation group in predicting pathologic complete response based on models using early FTV change, including the early treatment model (AUC, 0.74 vs 0.63; P = .11), inter-regimen model (AUC, 0.79 vs 0.62; P = .03), and multiple predictor model (AUC, 0.85 vs 0.64; P = .01).
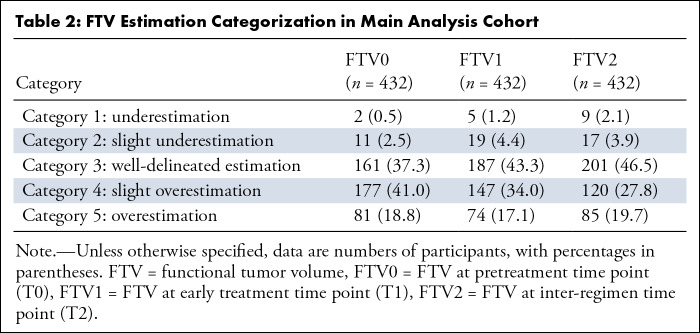
■ In 432 study participants, the number of examinations with overestimated FTV decreased (pretreatment, 258 [59.7%]; early treatment, 221 [51.2%]; inter-regimen, 205 [47.5%]) and the number of examinations with well-delineated FTV increased (pretreatment, 161 [37.3%]; early treatment, 187 [43.3%]; inter-regimen, 201 [46.5%]) over the course of neoadjuvant chemotherapy (NAC).
■ In the hormone receptor–positive, human epidermal growth factor receptor 2–negative subtype only (n = 169), the number of examinations with underestimated FTV increased (pretreatment, five [3.0%]; early treatment, nine [5.3%]; inter-regimen, 18 [10.7%]) over the course of NAC.
Introduction
Achievement of pathologic complete response (pCR) after neoadjuvant chemotherapy (NAC) is associated with long-term survival in patients with breast cancer (1–5). MRI allows assessment of disease extent and is used in monitoring tumor response to treatment (6–9). Previous studies found that functional tumor volume (FTV), a quantitative imaging marker of tumor burden derived from dynamic contrast-enhanced MRI, is strongly associated with pCR (10–12).
The I-SPY 2 TRIAL (Investigation of Serial Studies to Predict Your Therapeutic Response with Imaging and Molecular Analysis 2) is an ongoing phase 2 neoadjuvant breast cancer trial using adaptive randomization within tumor subtypes to multiple drug arms (13). As of May 2022, more than 2200 participants had been randomly assigned to treatment. In I-SPY 2, four longitudinal dynamic contrast-enhanced MRI examinations are performed before and during NAC treatment. FTV derived from dynamic contrast-enhanced MRI has been used to adjust the participant randomization ratio and estimate predictive probabilities of pCR that determine when a drug has reached criteria for graduation. Treatment personalization options based on early FTV change is being implemented in the trial (14–16). Participants with a poor response based on FTV change can escalate to different or additional treatment, and participants with a good response have the option of de-escalating to avoid overtreatment if achievement of early pCR is highly likely. To ensure that participants are safely directed to therapy escalation or de-escalation, we are continuously improving the prediction models.
A semiautomated method based on manually placed bounding box dimensions and enhancement thresholds is used to measure FTV in I-SPY 2 (11). This automated method is crucial to calculate FTV for a large number of MRI examinations in an efficient and timely manner. However, biologic factors, including heterogeneity of tumor and breast tissue characteristics, and different technical and anatomic factors may influence semiautomated FTV estimation. Thus, in the standard operation of I-SPY 2, variations in FTV estimation are observed from examination to examination and are shown as some degree of overestimation or underestimation versus visually recognized tumor volume. To maintain objectivity and consistency in FTV estimation, measurement parameters for FTV (bounding box dimensions and enhancement thresholds) defined at pretreatment MRI are kept consistent for all subsequent examinations according to the current prospective rules for measuring longitudinal FTVs. However, variations in FTV estimation caused by participant positioning and biologic factors may affect longitudinal evaluation of FTV in the series of MRI scans in a single participant.
We hypothesized that longitudinal variation (variation over time) in semiautomated FTV under- or overestimation may impact its performance in predicting pCR. To test the hypothesis and refine the FTV-based predictive model to be used as MRI-based criteria for treatment personalization, we compared the performance of early FTV change in predicting pCR between two groups with different levels of variation in FTV estimation (high-standard vs standard).
Materials and Methods
This study was compliant with the Health Insurance Portability and Accountability Act, and all participating sites in the multi-institutional I-SPY 2 TRIAL (ClinicalTrials.gov registration no. NCT01042379) received local human study institutional review board approval. All participants included in the current study provided written informed consent to participate in the I-SPY 2 TRIAL.
Data Sharing
The current study reports new results from the ongoing I-SPY 2 TRIAL, which has been open to accrual since 2010. There are more than 25 separate articles with partial overlap of cohorts (17). Data generated or analyzed during the study are available at The Cancer Imaging Archive of the National Cancer Institute (18).
Study Cohort
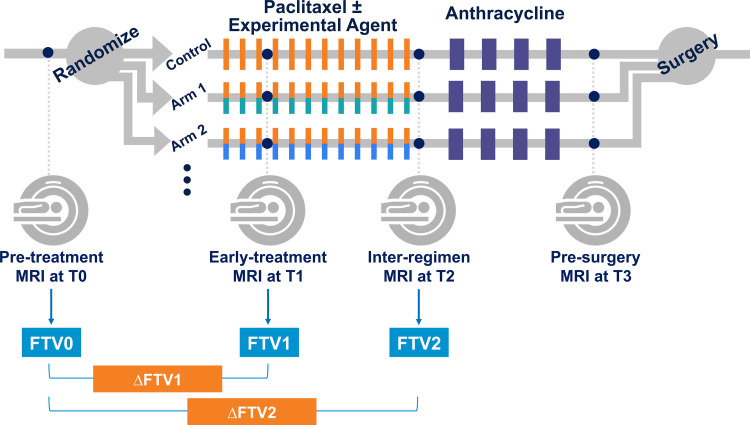
We retrospectively reviewed participants enrolled in the I-SPY 2 TRIAL from May 2010 to November 2016 to identify eligible participants for this study. Women who were 18 years and older and diagnosed with stage II or stage III breast cancer (tumor size ≥2.5 cm) without distant metastasis were eligible for the I-SPY 2 TRIAL. Participants were classified by tumor subtype based on hormone receptor (HR) and human epidermal growth factor receptor 2 (HER2) status. Participants with tumors that were assessed as HR positive/HER2 negative and low risk based on the MammaPrint 70-gene assay (Agendia) were screened out from I-SPY 2. All participants had 12 cycles of weekly doses of paclitaxel with or without experimental agents, followed by four cycles of anthracycline-cyclophosphamide. Trastuzumab was also given to participants identified with HER2-positive tumors. MRI examinations were performed at four treatment time points: pretreatment (T0), early treatment (T1, 3 weeks after start of treatment), inter-regimen (T2), and presurgery (T3). The I-SPY 2 TRIAL study schema is shown in Figure 1.
Figure 1:
Schematic shows study protocol. Participants were randomly assigned to one of 10 neoadjuvant drug arms (nine experimental drug arms and one standard-of-care control arm). Each participant underwent MRI examination at four treatment time points (T0, T1, T2, T3) during neoadjuvant chemotherapy. FTV0, FTV1, FTV2 = functional tumor volume at T0, T1, and T2, respectively; ΔFTV1, ΔFTV2 = percentage change of functional tumor volume relative to T0 at T1 and T2, respectively.
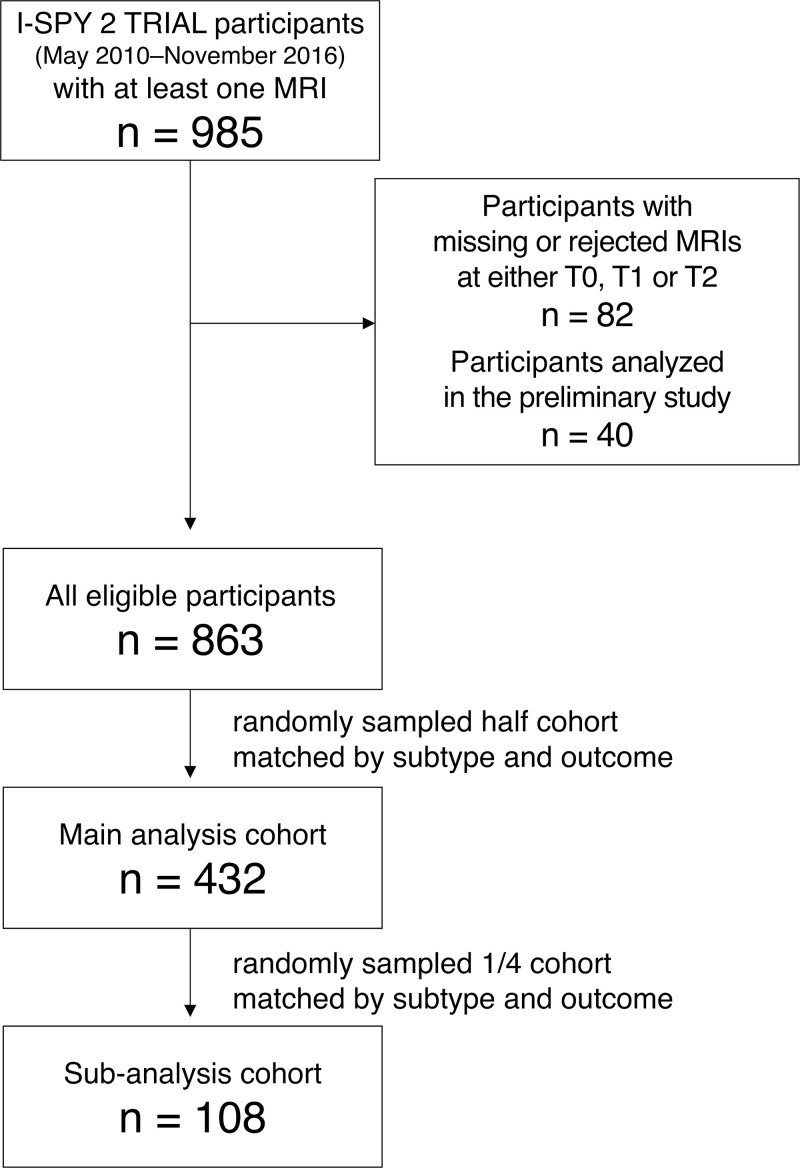
Inclusion criteria for this study were as follows: (a) women who had all MRI examinations at T0, T1, and T2 that passed I-SPY 2 MRI protocol adherence; and (b) women who were not included in a preliminary study where we discussed how to evaluate longitudinal variation in FTV under- and overestimation. Women with missing or rejected MRI examinations at T0, T1, or T2 were excluded. Given that visual assessment of variation in FTV estimation is time-consuming, a logistically feasible sample size was determined based on the preliminary study. Of the women who met these criteria, we randomly sampled half of the participants who matched according to subtype and pCR outcome for the main analysis and compared the impact of longitudinal variation in FTV under- and overestimation on the prediction of pCR (Fig 2). A quarter of the main analysis cohort was similarly sampled to perform subanalysis, where we assessed interreader agreement among three readers in the assessment of longitudinal variation in FTV under- and overestimation. We also performed an analysis similar to the main analysis based on the majority consensus among the three readers.
Figure 2:
Flowchart shows study inclusion. I-SPY 2 TRIAL = Investigation of Serial Studies to Predict Your Therapeutic Response with Imaging and Molecular Analysis 2, T0 = pretreatment time point, T1 = early treatment time point, T2 = inter-regimen time point.
MRI Quality Control and Acquisition Protocol
In I-SPY 2, MR image quality control is implemented by the I-SPY Imaging Laboratory. MRI scanners at all study sites undergo an approval process to be used in this trial. The I-SPY 2 MRI scan protocol specifies parameters of the image acquisition protocol, contrast agent administration, and image quality. All participating sites are instructed to use the same scan parameters for all sequential MRI visits for a single patient. The Imaging Laboratory reviews MRI protocol adherence for all MRI examinations and may reject nonadherent data (19). For each MRI examination, participating sites kept records of the longest diameter of the tumor that site radiologists clinically reported.
MRI examinations, including dynamic contrast-enhanced imaging, were performed using a 1.5-T or 3-T MRI scanner with a dedicated breast coil, across different vendors and institutions. Dynamic contrast-enhanced MRI scans were acquired using a bilateral three-dimensional T1-weighted sequence with fat suppression with the following parameters: repetition time, 4–10 msec with minimum echo time; flip angle, 10°–20°; field of view, 26–36 cm; acquired frequency or read matrix, 384–512; acquired phase-encoding matrix, greater than or equal to 256; in-plane resolution, less than or equal to 1.4 × 1.4 mm; thickness, less than or equal to 2.5 mm; temporal resolution, 80–100 seconds; axial orientation; and prone position. The standardized contrast agent was administered intravenously at an injection rate of 2 mL/sec with a 20-mL saline flush. Identical sequence parameters were used to acquire precontrast and multiple postcontrast series. Postcontrast scanning continued for at least 8 minutes after contrast agent injection. The early and delayed postcontrast phases were selected from the postcontrast series at the time of FTV calculation, based on temporal sampling of the center of k-space closest to 2 minutes 30 seconds and 7 minutes 30 seconds, respectively.
Semiautomated Measurement of FTV
Segmentation of FTV was performed using an in-house software developed in interactive data language (IDL, version 8.4; Exelis Visual Information Solutions). As described, a three-dimensional bounding box was manually placed to encompass a tumor, and FTV was computed by summing all voxels within the box that had enhancement greater than 70% in the early postcontrast phase and a signal enhancement ratio greater than zero (11). Enhancement thresholds and bounding box dimensions delineated at T0 were kept consistent for all examinations of the same patient, with very few exceptional situations such as tumor progression or change in tumor shape.
Variation in FTV Estimation
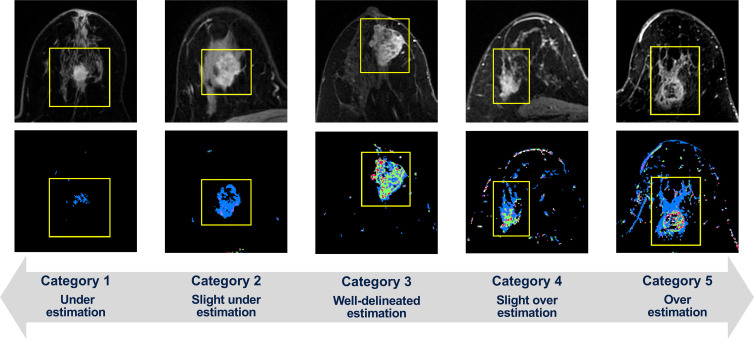
Visual assessment of variation in FTV estimation was performed for each examination at each treatment time point (T0, T1, and T2) using five categories: 1, definite underestimation; 2, slight underestimation; 3, well-delineated estimation; 4, slight overestimation; 5, definite overestimation (Fig 3). For the main analysis cohort, reader 1 (N.O., a breast radiologist with 9 years of experience) performed the assessment. For the subanalysis cohort (ie, a quarter of the main analysis cohort), reader 2 and reader 3 (J.G. and T.J.B., with 14 years and 1 year of experience, respectively, in breast MRI processing trained in the I-SPY 2 Imaging Core Laboratory), as well as reader 1, independently performed the assessment for multireader analysis. For assessing the categories, each reader used two types of portable document format reports for each patient; these were individual FTV reports for each MRI visit and a longitudinal FTV report of all visits. Individual FTV reports used an automated computer algorithm to select and show four representative MRI sections from early postcontrast phase images and the associated FTV estimations in the sagittal orientation. Similarly, longitudinal FTV reports showed one representative MRI section from the early postcontrast phase images with FTV estimation overlaid and one maximum intensity projection image of the early postcontrast phase images for each MRI visit.
Figure 3:
Within bounding boxes (yellow line), tumors on early postcontrast-phase axial MR images (top) and corresponding functional tumor volume (FTV) estimation on signal enhancement ratio (SER) maps (bottom) show the variation in FTV estimation as visually assessed using five categories, with representative cases of each category shown. The SER maps are colored as follows: red, SER >1.1 (washout); green, 0.9 ≤ SER ≤ 1.1 (plateau); blue, SER <0.9 (persistent).
Based on the FTV estimation categorization, variation in FTV estimation for each examination was binarized to either the high-standard group or standard group. Under current best practices in I-SPY 2, we observed that the majority of category 2 (slight underestimation) examinations showed weak-enhancing tumors for which true tumor margin and extent is visually ambiguous. We found very subtle differences between categories 2 and 3, and both categories were considered almost equivalent in terms of the FTV estimation. Therefore, examinations that were categorized as “2, slight underestimation” or “3, well-delineated estimation” were classified as the high-standard group. Examinations categorized as 1, 4, or 5 were classified as the standard group.
To evaluate the performance of longitudinal FTVs in predicting pCR, we performed single-predictor logistic regression modeling for three variables—FTV0 (FTV at T0), ∆FTV1 (percentage change of FTV from T0 to T1), and ∆FTV2 (percentage change of FTV from T0 to T2)—and multiple predictor logistic regression modeling using these three variables. These variables were selected considering the clinical significance of pretreatment tumor volume and volume change during NAC on the basis of previous studies (12,20). Each modeling approach was separately performed in the high-standard and standard FTV estimation groups, which were stratified based on the variation in FTV estimation as follows: FTV0 was simply stratified as high-standard or standard based on the binary classification at T0. For FTV change (∆FTV1 or ∆FTV2) to be stratified as high-standard, both binary classifications at T0 and at a given treatment time point (T1 or T2) were required to be high-standard. For the multiple predictor modeling to be stratified as high-standard, all FTV0, ∆FTV1, and ∆FTV2 values were required to be stratified as high-standard. In the main analysis, this stratification was performed based on reader 1's classification. In the subanalysis, to see the results based on the consensus among the three readers, this stratification was performed based on the majority vote among the three readers’ classifications (ie, assessment judged by at least two readers’ agreement).
Pathologic Assessment of Response
Pathologic assessment of treatment response was based on a surgical specimen obtained after completion of NAC. Thus, pCR, the primary end point of the I-SPY 2 TRIAL, is defined as the absence of residual invasive disease in the breast and lymph nodes.
Statistical Analysis
Statistical analyses were performed by N.O. and J.K. (with 20 years of experience in medical imaging statistics research) using the caret, pROC, and irrCAC packages in R (version 3.6.3; The R Foundation). In this study, nominal P values without adjustment for multiple testing were reported and P < .05 was considered indicative of a statistically significant difference. For comparison of participant characteristics (main analysis cohort vs the rest of the participants, or the subanalysis cohort vs the rest of the participants), we used the Mann-Whitney U test (continuous variables) and Fisher exact test (categorical variables). To keep the cost of calculation reasonable for tables of size larger than 2 × 2, we used the simulate.p.value option in the fisher.test function. Performance of longitudinal FTVs in predicting pCR was evaluated using areas under the receiver operating characteristic curve (AUCs) and compared between the high-standard and standard FTV estimation groups.
For the logistic regression modeling, stratified bootstrap resampling of data was separately performed in each group (sample size of 150 for the main analysis and 30 for the subanalysis) while keeping the ratio of pCR to non-pCR constant. In each bootstrap resample, the unsampled data were used as held-out test set data for AUC evaluation of the trained model. The mean and 95% CI of the AUCs for each group and the difference between the two (AUC of high-standard group minus AUC of standard group) were computed. The appropriate number of bootstrap replications to obtain stable results of CI estimation was determined based on a trial of replication sizes (10, 50, 100, 500, 1000, and so on in increments of 1000 up to 10 000). The logistic regression modeling was performed in the main analysis cohort, each subtype of the main analysis cohort separately, and the subanalysis cohort. Because of the limited number of participants in the HR-negative/HER2-positive subtype, the HR-positive/HER2-positive cohort and HR-negative/HER2-positive cohort were combined as an HER2-positive cohort in the subtype-wide analyses of the main analysis cohort.
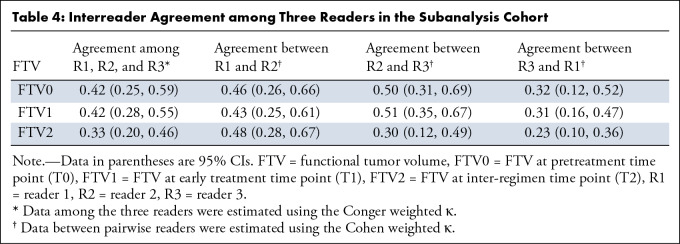
The Conger weighted κ among the three readers and Cohen weighted κ between pairwise readers were estimated to evaluate interreader agreement of FTV estimation categorization in the subanalysis cohort.
Results
Participant Characteristics
A total of 985 consecutive participants who enrolled in the I-SPY 2 TRIAL from May 2010 to November 2016 with at least one MRI study were reviewed (Fig 2). Of the 985 participants, 82 (8%) participants were excluded because of missing or rejected MRI examinations at T0, T1, or T2, and an additional 40 (4%) participants were excluded because they were included in the preliminary analysis. Of the remaining 863 participants, we randomly sampled 432 (50%) for the main analysis. Similarly, 13% (108 of 863, a quarter of the main analysis cohort) of the participants were randomly sampled.
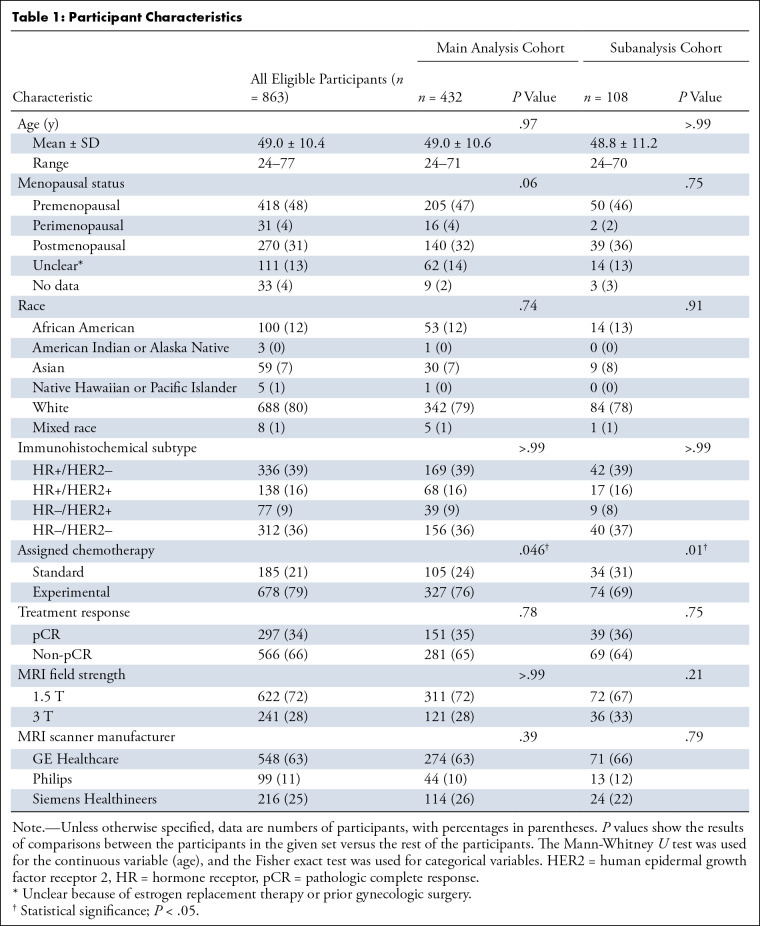
Table 1 presents participant characteristics, including age, menopausal status, race, tumor subtype, assigned chemotherapy, and treatment response. Race information is presented according to the categories with which the I-SPY 2 TRIAL collected data. The mean age was 49.0 years ± 10.6 (SD) (range, 24–71 years) for the main analysis cohort and 48.8 years ± 11.2 (range, 24–70 years) for the subanalysis cohort. No evidence of a difference was found in either cohort across all characteristics except for assigned chemotherapy. Table S1 presents the breakdown data of assigned chemotherapy.
Table 1:
Participant Characteristics
Main Analysis
Table 2 shows the assessment of FTV estimation categorization in the main analysis cohort. The combined number for categories 4 and 5 FTV estimations (ie, overestimation) decreased (FTV0, 258 of 432 [59.7%]; FTV1, 221 of 432 [51.2%]; FTV2, 205 of 432 [47.5%]) and the number of category 3 (well-delineated) estimations (FTV0, 161 of 432 [37.3%]; FTV1, 187 of 432 [43.3%]; FTV2, 201 of 432 [46.5%]) increased over the time points. For the logistic regression modeling, use of 5000 bootstrap replications was deemed adequate to provide stable results. Performance in predicting pCR in the high-standard and standard FTV estimation groups and the number of participants in each group are shown in Table 3. For the FTV0 model, high-standard and standard groups showed similar estimated AUCs of 0.61 (95% CI: 0.49, 0.72) and 0.62 (95% CI: 0.56, 0.69; P = .89), respectively. The AUC of the high-standard group was estimated to be substantially higher than that of the standard group for the ∆FTV1 (0.74 [95% CI: 0.61, 0.86] vs 0.63 [95% CI: 0.57, 0.68]; P = .11), ∆FTV2 (0.79 [95% CI: 0.65, 0.90] vs 0.62 [95% CI: 0.55, 0.67]; P = .03), and multiple predictor (0.85 [95% CI: 0.69, 0.96] vs 0.64 [95% CI: 0.57, 0.69]; P = .01) models, with the difference reaching statistical significance for the ∆FTV2 and multiple predictor models. To explore the factors characterizing the two groups, we additionally compared patient demographics between the high-standard and standard groups for the multiple predictor model (Table S2). Menopausal status was statistically significantly associated with FTV estimation variation (P = .02). The standard group had a younger age compared with the high-standard group (48.0 years ± 10.5 vs 51.7 years ± 10.5; P = .001). Also, we compared tumor size at T0 as defined by the clinically assessed longest diameter on MRI scans. The standard group had a statistically significantly larger diameter compared with the high-standard group, with median diameters (first, third quartiles) of 3.70 cm (3.00, 5.60) and 3.20 cm (2.70, 4.10) (P = .001).
Table 2:
FTV Estimation Categorization in Main Analysis Cohort
Table 3:
Predictive Performance of Pathologic Complete Response in the High-Standard and Standard FTV Estimation Groups in the Main Analysis Cohort
The same analyses were repeated for each subtype in the main analysis cohort separately (Tables S3, S4). Similar to the whole cohort, the combined number of categories 4 and 5 FTV estimations (ie, overestimation) decreased and the number of category 3 (well-delineated) estimations increased over the time points in all subtypes. In the HR-positive/HER2-negative subtype only, the number of categories 1 and 2 FTV estimations (ie, underestimation) increased (FTV0, five of 169 [3.0%]; FTV1, nine of 169 [5.3%]; FTV2, 18 of 169 [10.7%]) over the time points. The predictive performance results for the FTV0 model varied by subtype. Compared with the standard group, the AUC of the high-standard group was estimated to be significantly higher in the HR-positive/HER2-negative subtype and lower, but not significantly, for the other subtypes. For the ∆FTV1, ∆FTV2, and multiple predictor models, AUCs of the high-standard group were estimated to be higher than those of the standard group consistently across all subtypes, which agreed with the results observed in the main analysis. The difference reached statistical significance for the ∆FTV1 and ∆FTV2 models in the HR-positive/HER2-negative and HER2-positive subtypes.
Multireader Subanalysis
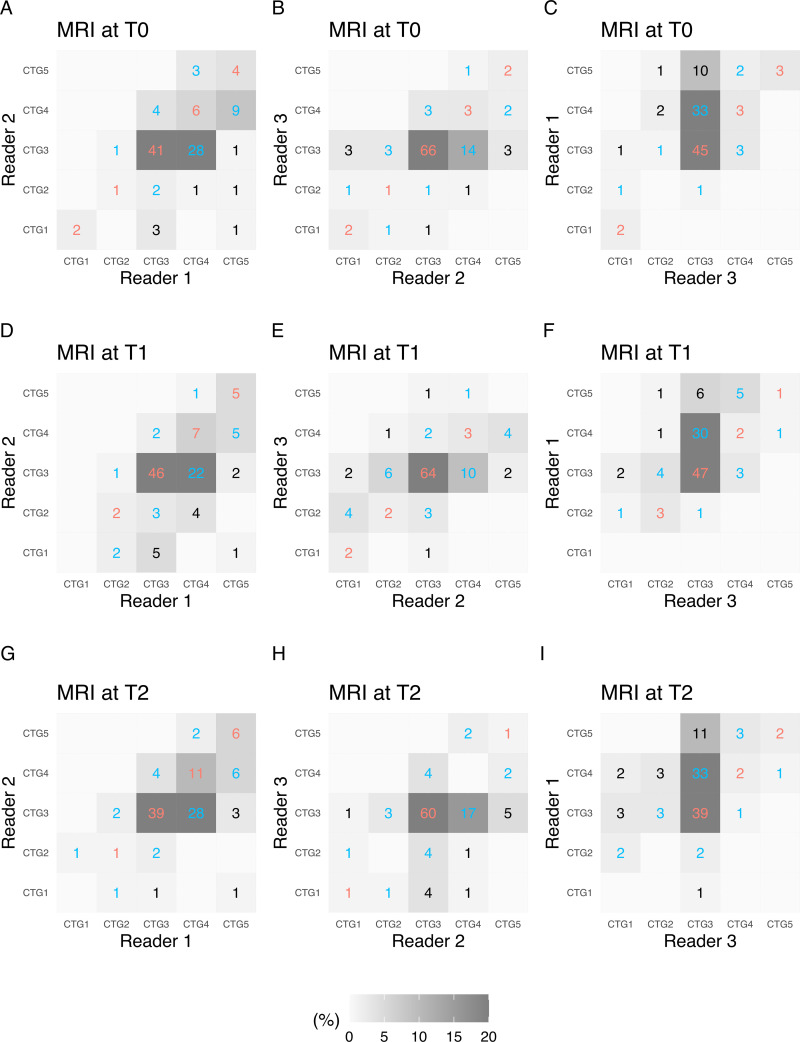
Pairwise interreader agreements in FTV estimation categorization among the three readers are shown in agreement matrices, with the number of participants in each cell, in Figure 4. Between readers 1 and 2, agreements or disagreements by one category were observed for 94% (54 + 47 of 108) of assessments at T0, 89% (60 + 36 of 108) at T1, and 95% (57 + 46 of 108) at T2. Between readers 2 and 3, agreements or disagreements by one category were observed for 93% (74 + 26 of 108) of assessments at T0, 94% (71 + 30 of 108) at T1 and 89% (62 + 34 of 108) at T2. Between readers 3 and 1, agreements or disagreements by one category were observed for 87% (53 + 41 of 108) of assessments at T0, 91% (53 + 45 of 108) at T1, and 81% (43 + 45 of 108) at T2. Among the three readers, the Conger weighted κ was 0.42 (95% CI: 0.25, 0.59) at T0, 0.42 (95% CI: 0.28, 0.55) at T1, and 0.33 (95% CI: 0.20, 0.46) at T2. The Cohen weighted κ coefficient between the pairwise readers varied, with a range of 0.23 (95% CI: 0.10, 0.36) to 0.51 (95% CI: 0.35, 0.67), depending on the pairs and time points (Table 4).
Figure 4:
Pairwise interreader agreement matrices for functional tumor volume (FTV) show estimation categorization at three MRI time points as follows: (A–C) pretreatment (T0), (D–F) early treatment (T1), and (G–I) inter-regimen (T2). Data within the matrices are numbers of participants, and the gray scale represents the proportion of participants. Agreements are indicated in red text and disagreements are indicated in blue text, per category (CTG).
Table 4:
Interreader Agreement among Three Readers in the Subanalysis Cohort
For the logistic regression modeling, 5000 bootstrap replications were deemed adequate to provide stable results. Table S5 shows the performance in predicting pCR for the high-standard and standard groups and the number of participants in each group. The estimated AUC of the high-standard group was higher than that of the standard group for the FTV0, ∆FTV1, ∆FTV2, and multiple predictor models, but there was no evidence of a significant difference (FTV0 model, 0.63 [95% CI: 0.30, 0.71] vs 0.42 [95% CI: 0.07, 0.83] [P = .38]; ∆FTV1 model, 0.68 [95% CI: 0.23, 0.77] vs 0.60 [95% CI: 0.27, 0.83] [P = .60]; ∆FTV2 model, 0.75 [95% CI: 0.65, 0.85] vs 0.55 [95% CI: 0.26, 0.73] [P = .05]; multiple predictor model, 0.76 [95% CI: 0.58, 0.88] vs 0.57 [95% CI: 0.32, 0.72] [P = .11]).
Discussion
In this study, we retrospectively investigated the effect of longitudinal variation in semiautomated FTV underestimation and overestimation on the performance of longitudinal FTVs for predicting pCR in women with breast cancer undergoing NAC treatment. Compared with the standard FTV estimation group, the high-standard FTV estimation group consistently showed increased estimated AUC values for predicting pCR based on early FTV changes at early treatment and inter-regimen MRI examinations in the main analysis, as well as the subtype-specific analyses. In the main analysis, the AUC difference reached statistical significance in the inter-regimen (∆FTV2) model (AUC, 0.79 vs 0.62; P = .03) and the multiple predictor model (AUC, 0.85 vs 0.64; P = .01).
Previous studies in the I-SPY 1 TRIAL showed an association between FTV and the prediction of pCR and long-term survival (10,12). In the ongoing I-SPY 2 TRIAL, treatment escalation and de-escalation options are being implemented to promote personalization of medicine (14–16). For this purpose, in which FTV is used to evaluate an individual participant's response versus the efficacy of the drug, the consistency of under- or overestimation relative to baseline is essential. In this study, we focused on the effect of longitudinal variation in FTV under- and overestimation on pCR prediction, and our results showed that accurate FTV estimation can improve the prediction model in identifying candidates for these options.
Through the assessment, the reviewers observed that background parenchymal enhancement within bounding box dimensions was the major cause of overestimation. Especially when the tumor was not a solitary mass but was composed of a mass and surrounding non-mass components with a larger distribution, clear separation of background parenchymal enhancement from FTV segmentation was challenging. This observation was in line with the findings that age and menopausal status were statistically significantly associated with FTV estimation variation. It is well known that increased hormonal exposure is associated with a higher level of background parenchymal enhancement. Our result showing younger age for the standard group compared with the high-standard group might illustrate the impact of background parenchymal enhancement on the FTV estimation variation. In the main analysis, the combined number of categories 4 and 5 FTV estimation (ie, overestimation) decreased, and the number of category 3 estimations increased over the time points. This tendency was observed across all subtypes. Because background parenchymal enhancement within bounding box dimensions is the major cause of overestimation, this observation may be explained by reduction of the background parenchymal enhancement level by NAC at later time points, as shown in previous articles (21–23). Still, overestimation was observed in 47% (120 + 85 of 432) of FTV at T2. This result highlights the challenge of FTV estimation based on an enhancement threshold because both tumor and background parenchyma show enhancement with different levels. Additional methods to effectively separate tumor from background parenchyma is required to further improve the FTV-based prediction of pCR.
In addition, the number of categories 1 and 2 FTV estimations (ie, underestimation) increased over the time points in the HR-positive/HER2-negative subtype. As shown in a prior article, background parenchymal enhancement and tumor enhancement are reduced to a similar extent during NAC (23). Thus, it is possible that chemotherapy can reduce the incidence of overestimation caused by background parenchymal enhancement and increase that of underestimation caused by lowered tumor enhancement. The increase in categories 1 and 2 estimations may illustrate that the enhancement threshold determined at T0 was too high for the HR-positive/HER2-negative tumors, with reduced enhancement resulting from chemotherapy. Although the rules for FTV measurement require use of the same FTV measurement parameters to maintain consistency across time points, a more subjective algorithm to identify low-enhancing tumors and modify enhancement thresholds may be helpful to improve the longitudinal variation in tumor under- and overestimation.
In this study, we defined “slight underestimation” (category 2) and “well-delineated estimation” (category 3) as the high-standard group, while “slight overestimation” (category 4) was excluded from this group. In our study examinations, weak-enhancing tumors with visually ambiguous tumor margin or extent were included. The weak tumor enhancement might be the result of chemotherapy, as discussed. Because it was difficult for our readers to judge those examinations with clear differentiation between “slight underestimation” and “well-delineated estimation” categories, they made evaluations based on individual judgment of tumor margin. Given the subtle differences between the two categories, we considered them almost equivalent in terms of the FTV estimation and included both in the high-standard group. On the other hand, the major cause of overestimation observed in category 4 was background parenchymal enhancement within the bounding box dimensions. In contrast to category 2 examinations, where tumor margin and extent were ambiguous, category 4 tumor margins were relatively easier to identify. With the FTV estimation noticeably extending past the tumor margin and including background parenchymal enhancement within the calculation, category 4 estimations were considered part of the standard group.
We performed the multireader subanalysis to test the reproducibility of our approach to assess longitudinal variation in FTV under- and overestimation. As shown in the pairwise interreader agreement matrices, all reader pairs had agreements or disagreements by one category for the majority of examinations at all time points. Because the readers used a five-category scaling (definite underestimation, slight underestimation, well-delineated, slight overestimation, definite overestimation), where the decision to select “definite” or “slight” was left to each reader, the number of disagreements that were one category apart should be interpreted accordingly. From the weighted κ results, agreements were lower for FTV at T2 compared with T0 or T1. This might be explained by the difficulty to perform FTV estimation categorization for lesions reduced in size by NAC treatment, especially when tumor enhancement is additionally lowered by NAC and the extent of the residual tumor is uncertain (23).
In the subanalysis cohort, results comparing AUCs between the high-standard and standard FTV estimation groups showed all models had an estimated increase in AUC in the high-standard group, but the differences in AUC did not reach statistical significance in any model and, therefore, are not conclusive.
This retrospective study had limitations. First, longitudinal variation in FTV under- and overestimation was categorized for each participant using individual and longitudinal FTV reports showing only representative MRI sections, which could have biased the results. To minimize the possible bias, we used an algorithm that automatically chose the representative sections to be shown on the reports. Second, the analyses were performed using a partial cohort sampled from all eligible participants. To avoid bias, sampling was performed matched by subtype and pCR outcome. These two approaches were used to reduce the time required for the visual assessment of variation in FTV estimation. Third, for a small number of examinations at T2, we found complete or near-complete imaging response with no visible residual enhancement. Readers assessed those examinations as either category 3 (well-delineated estimation) or category 4 (slight overestimation), with a majority of examinations assessed as category 3. Fourth, participants were randomized to one of 10 drug arms. The impact of each drug arm on the longitudinal variation in FTV under- or overestimation and the predictive performance of FTV for pCR is uncertain.
In conclusion, the high-standard FTV estimation group showed increased performance in predicting pCR compared with the standard group. Differences were apparent for FTV change in the inter-regimen MRI model and the multiple predictor model when using pretreatment FTV and FTV changes at early treatment and inter-regimen time periods. For safe and reliable selection of candidates for treatment escalation and de-escalation strategies using MRI-based criteria, we will continue to refine the FTV-based prediction of pCR in the I-SPY 2 TRIAL.
Acknowledgments
Acknowledgments
The authors acknowledge those individuals who have contributed substantially to the work reported in the manuscript, including the I-SPY 2 Imaging Working Group, the I-SPY 2 Investigator Network, the patients who participated in the study, and the staff members who contributed to the study at the University of California San Francisco; University of Pennsylvania; University of Washington; University of Alabama, Birmingham; University of California San Diego; University of Texas MD Anderson Cancer Center; Oregon Health Sciences University; University of Chicago; University of Minnesota; University of Colorado; The Mayo Clinic, Rochester Methodist Hospital; The Mayo Clinic, Scottsdale; Georgetown University; University of Southern California; Swedish Health Services; Inova Health System; University of Kansas; University of Texas, Southwestern Medical Center; Emory University; Loyola University Chicago; Columbia University; H. Lee Moffitt Cancer Center and Research Institute; Johns Hopkins Medicine; Genentech; and Avera Cancer Institute. The authors would like to thank all patients who participated in the I-SPY 2 Trial, working group chairs, investigators, and study coordinators from all participant sites for their contributions to the project.
N.O. and T.J.B. contributed equally to this work.
Members of the I-SPY 2 Imaging Working group are listed at the end of this article.
Members of the I-SPY 2 Investigator Network are listed at the end of this article.
This research was supported by the National Institutes of Health (grant numbers U01 CA225427, R01 CA132870, and P01 CA210961). The I-SPY 2 TRIAL is supported by Quantum Leap Healthcare Collaborative (2013 to present).
Data sharing: Data generated by the authors or analyzed during the study are available at The Cancer Imaging Archive of the National Cancer Institute.
I-SPY 2 Imaging Working Group: Bonnie N. Joe, MD, PhD; Haydee Ojeda-Fournier, MD; Mohammad Eghtedari, MD, PhD; Kathryn W. Zamora, MD, MPH; Stefanie Woodard, DO; Heidi Umphrey, MD; Michael Nelson, MD; An Church, MD; Patrick Bolan, PhD; Theresa Kuritza, DO, FAOCR, MBA; Kathleen Ward, MD; Kevin Morley, MD; Dulcy Wolverton, MD; Kelly Fountain, MD; Dan Lopez Paniagua, PhD; Lara Hardesty, MD; Kathleen R. Brandt, MD; Elizabeth S. McDonald, MD, PhD; Mark Rosen, MD, PhD; Despina Kontos, PhD; Hiroyuki Abe, MD, PhD; Deepa Sheth, MD; Erin Crane, MD; Charlotte Dillis, MD; Pulin Sheth, MD; Linda Hovanessian-Larsen, MD; Dae Hee Bang, MD; Bruce Porter, MD; Karen Y. Oh, MD; Neda Jafarian, MD; Luminita A. Tudorica, PhD; Bethany Niell, MD, PhD; Jennifer Drukteinis, MD; Mary S. Newell, MD; Marina Giurescu, MD; Elise Berman, MD; Constance Lehman, MD, PhD; Savannah Partridge, PhD; Kimberly A. Fitzpatrick, MD; Marisa H. Borders, MD; Wei T. Yang, MD; Basak Dogan, MD; Sally Goudreau, MD; Thomas Chenevert, PhD; Barbara LeStage; Lisa Cimino, RT; Milica Medved, PhD; Laura Shepardson, MD; Alice Rim, MD; Richard Ha, MD; Mary Newell, MD; Puneet Sharma, PhD; January Lopez, MD; Nicole Winkler, MD; Bhabika Patel, MD; Dana Ataya, MD; Jeff Hawley, MD; Chelsea Pyle, MD; Sadia Choudhery, MD; Kim Byko; Lina Paster, MD, FACR; David Chelak; Ellen Lee, MD, FACR; Melinda Talley, MD; Nicole Siemonsma, MD; Linda Sanders, MD; Eghosa A. Olomu, MD; Andrew MacKersie, MD; Shadi Shakeri, MD; Rebecca Rakow-Penner, MD, PhD; Laura Sit, MS; Lisa Wilmes, PhD; Mina Musthafa; Sam Valencerina; Avice O'Connell, MD, MA; Nebojsa Duric, PhD; Radha Iyer, MD; Sara Harvey, MD; Megan Lee, MD; Michael Spektor, MD; Judith Zimmermann, PhD; Anum Kazerouni, PhD; Debosmita Biswas, MS; Dariya Malyarenko, PhD; Julia Carmona-Bozo, MD, PhD.
I-SPY 2 Investigator Network: A. Jo Chien, MD; Anne M. Wallace, MD; Erica Stringer-Reasor, MD; Andres Forero-Torres, MD; Douglas Yee, MD; Kathy S. Albain, MD, FACP; Anthony Elias, MD; Judy C. Boughey, MD; Amy S. Clark, MD, MSCE; Rita J. Nanda, MD; Claudine J. Isaacs, MD; Julie E. Lang, MD; Erin D. Ellis, MD; Kathleen A. Kemmer, MD; Zaha Mitri, MD; Heather S. Han, MD; Kevin Kalinsky, MD, MS; Tara Sanft, MD; Lajos Pusztai, MD; Jane L. Meisel, MD; William C. Wood, MD; Donald W. Northfelt, MD; Kirsten K. Edmiston, MD, FACS; Rachel Yung, MD; Rebecca K. Viscusi, MD; Debasish Tripathy, MD; Qamar J. Khan, MD; David M. Euhus, MD; Stephen Y. Chui, MD; Janice Lu, MD; John W. Park, MD; Minetta C. Liu, MD; Olufunmilayo Olopade, MD; Brian Leyland-Jones, MD; Stacy L. Moulder, MD; Barbara Haley, MD; Angela DeMichele, MD; Michelle E. Melisko, MD; Hope S. Rugo, MD; Richard Schwab, MD; W. Fraser Symmans, MD; Laura J. van't Veer, PhD; Jane Perlmutter; Donald A. Berry, PhD; Christina Yau, PhD.
Disclosures of conflicts of interest: N.O. No relevant relationships. T.J.B. No relevant relationships. J.G. No relevant relationships. W.L. No relevant relationships. E.R.P. No relevant relationships. B.N.J. Institutional research grant from Kheiron Medical Technologies; author royalties from UpToDate; lecture honoraria and travel expense payment from World Class CME and Medscape; member, RSNA R&E Foundation Board of Trustees; deputy editor for Radiology: Imaging Cancer and Radiology In Training. J.K. No relevant relationships. L.J.E. Leads an investigator-initiated vaccine trial for high-risk ductal carcinoma in situ funded by Merck via the University of California San Francisco; author royalties from UpToDate; participation with and honorarium from Blue Cross Medical Advisory Panel; board member, Quantum Leap Healthcare Collaborative. D.C.N. No relevant relationships. N.M.H. Member, RSNA Science Council.
Abbreviations:
- AUC
- area under the receiver operating characteristic curve
- FTV
- functional tumor volume
- HER2
- human epidermal growth factor receptor 2
- HR
- hormone receptor
- I-SPY 2 TRIAL
- Investigation of Serial Studies to Predict Your Therapeutic Response with Imaging and Molecular Analysis 2
- NAC
- neoadjuvant chemotherapy
- pCR
- pathologic complete response
- T0
- pretreatment time point
- T1
- early treatment time point
- T2
- inter-regimen time point
Contributor Information
Natsuko Onishi, Email: Natsuko.Onishi@ucsf.edu.
Collaborators: Bonnie N. Joe, Haydee Ojeda-Fournier, Mohammad Eghtedari, Kathryn W. Zamora, Stefanie Woodard, Heidi Umphrey, Michael Nelson, An Church, Patrick Bolan, Theresa Kuritza, Kathleen Ward, Kevin Morley, Dulcy Wolverton, Kelly Fountain, Dan Lopez Paniagua, Lara Hardesty, Kathleen R. Brandt, Elizabeth S. McDonald, Mark Rosen, Despina Kontos, Hiroyuki Abe, Deepa Sheth, Erin Crane, Charlotte Dillis, Pulin Sheth, Linda Hovanessian-Larsen, Dae Hee Bang, Bruce Porter, Karen Y. Oh, Neda Jafarian, Luminita A. Tudorica, Bethany Niell, Jennifer Drukteinis, Mary S. Newell, Marina Giurescu, Elise Berman, Constance Lehman, Savannah Partridge, Kimberly A. Fitzpatrick, Marisa H. Borders, Wei T. Yang, Basak Dogan, Sally Goudreau, Thomas Chenevert, Barbara LeStage, Lisa Cimino, Milica Medved, Laura Shepardson, Alice Rim, Richard Ha, Mary Newell, Puneet Sharma, January Lopez, Nicole Winkler, Bhabika Patel, Dana Ataya, Jeff Hawley, Chelsea Pyle, Sadia Choudhery, Kim Byko, Lina Paster, David Chelak, Ellen Lee, Melinda Talley, Nicole Siemonsma, Linda Sanders, Eghosa A. Olomu, Andrew MacKersie, Shadi Shakeri, Rebecca Rakow-Penner, Laura Sit, Lisa Wilmes, Mina Musthafa, Sam Valencerina, Avice O'Connell, Nebojsa Duric, Radha Iyer, Sara Harvey, Megan Lee, Michael Spektor, Judith Zimmermann, Anum Kazerouni, Debosmita Biswas, Dariya Malyarenko, Julia Carmona-Bozo, A. Jo Chien, Anne M. Wallace, Erica Stringer-Reasor, Andres Forero-Torres, Douglas Yee, Kathy S. Albain, Anthony Elias, Judy C. Boughey, Amy S. Clark, Rita J. Nanda, Claudine J. Isaacs, Julie E. Lang, Erin D. Ellis, Kathleen A. Kemmer, Zaha Mitri, Heather S. Han, Kevin Kalinsky, Tara Sanft, Lajos Pusztai, Jane L. Meisel, William C. Wood, Donald W. Northfelt, Kirsten K. Edmiston, Rachel Yung, Rebecca K. Viscusi, Debasish Tripathy, Qamar J. Khan, David M. Euhus, Stephen Y. Chui, Janice Lu, John W. Park, Minetta C. Liu, Olufunmilayo Olopade, Brian Leyland-Jones, Stacy L. Moulder, Barbara Haley, Angela DeMichele, Michelle E. Melisko, Hope S. Rugo, Richard Schwab, W. Fraser Symmans, Laura J. van't Veer, Jane Perlmutter, Donald A. Berry, and Christina Yau
References
- 1. Fisher B , Bryant J , Wolmark N , et al . Effect of preoperative chemotherapy on the outcome of women with operable breast cancer . J Clin Oncol 1998. ; 16 ( 8 ): 2672 – 2685 . [Published correction appears in J Clin Oncol 2023;41(10):1795-1808.] [DOI] [PubMed] [Google Scholar]
- 2. Kaufmann M , von Minckwitz G , Bear HD , et al . Recommendations from an international expert panel on the use of neoadjuvant (primary) systemic treatment of operable breast cancer: new perspectives 2006 . Ann Oncol 2007. ; 18 ( 12 ): 1927 – 1934 . [DOI] [PubMed] [Google Scholar]
- 3. Honkoop AH , Pinedo HM , De Jong JS , et al . Effects of chemotherapy on pathologic and biologic characteristics of locally advanced breast cancer . Am J Clin Pathol 1997. ; 107 ( 2 ): 211 – 218 . [DOI] [PubMed] [Google Scholar]
- 4. Ogston KN , Miller ID , Payne S , et al . A new histological grading system to assess response of breast cancers to primary chemotherapy: prognostic significance and survival . Breast 2003. ; 12 ( 5 ): 320 – 327 . [DOI] [PubMed] [Google Scholar]
- 5. Bonadonna G , Valagussa P , Brambilla C , et al . Primary chemotherapy in operable breast cancer: eight-year experience at the Milan Cancer Institute . J Clin Oncol 1998. ; 16 ( 1 ): 93 – 100 . [DOI] [PubMed] [Google Scholar]
- 6. Lobbes MBI , Prevos R , Smidt M , et al . The role of magnetic resonance imaging in assessing residual disease and pathologic complete response in breast cancer patients receiving neoadjuvant chemotherapy: a systematic review . Insights Imaging 2013. ; 4 ( 2 ): 163 – 175 . [DOI] [PMC free article] [PubMed] [Google Scholar]
- 7. Londero V , Bazzocchi M , Del Frate C , et al . Locally advanced breast cancer: comparison of mammography, sonography and MR imaging in evaluation of residual disease in women receiving neoadjuvant chemotherapy . Eur Radiol 2004. ; 14 ( 8 ): 1371 – 1379 . [DOI] [PubMed] [Google Scholar]
- 8. Scheel JR , Kim E , Partridge SC , et al . MRI, clinical examination, and mammography for preoperative assessment of residual disease and pathologic complete response after neoadjuvant chemotherapy for breast cancer: ACRIN 6657 trial . AJR Am J Roentgenol 2018. ; 210 ( 6 ): 1376 – 1385 . [DOI] [PMC free article] [PubMed] [Google Scholar]
- 9. Reig B , Lewin AA , Du L , et al . Breast MRI for evaluation of response to neoadjuvant therapy . RadioGraphics 2021. ; 41 ( 3 ): 665 – 679 . [DOI] [PubMed] [Google Scholar]
- 10. Hylton NM , Blume JD , Bernreuter WK , et al . Locally advanced breast cancer: MR imaging for prediction of response to neoadjuvant chemotherapy—results from ACRIN 6657/I-SPY TRIAL . Radiology 2012. ; 263 ( 3 ): 663 – 672 . [DOI] [PMC free article] [PubMed] [Google Scholar]
- 11. Hylton NM . Vascularity assessment of breast lesions with gadolinium-enhanced MR imaging . Magn eason Imaging Clin N Am 1999. ; 7 ( 2 ): 411 – 420 , x . [PubMed] [Google Scholar]
- 12. Hylton NM , Gatsonis CA , Rosen MA , et al . Neoadjuvant chemotherapy for breast cancer: functional tumor volume by MR imaging predicts recurrence-free survival—results from the ACRIN 6657/CALGB 150007 I-SPY 1 TRIAL . Radiology 2016. ; 279 ( 1 ): 44 – 55 . [DOI] [PMC free article] [PubMed] [Google Scholar]
- 13. Barker AD , Sigman CC , Kelloff GJ , Hylton NM , Berry DA , Esserman LJ . I-SPY 2: an adaptive breast cancer trial design in the setting of neoadjuvant chemotherapy . Clin Pharmacol Ther 2009. ; 86 ( 1 ): 97 – 100 . [DOI] [PubMed] [Google Scholar]
- 14. Esserman LJ . Personalization of treatment is the way forward in care and trials . Clin Cancer Res 2020. ; 26 ( 12 ): 2771 – 2773 . [DOI] [PubMed] [Google Scholar]
- 15. Li W , Newitt DC , Gibbs J , et al . Abstract PD6-05: subtype-specific MRI models to guide selection of candidates for de-escalation of neoadjuvant therapy . Cancer Res 2021. ; 81 ( 4_Supplement ): PD6 – 05 . [Google Scholar]
- 16. Onishi N , Li W , Venters SJ , et al . Abstract PS3-02: Radiologic review to refine selection of candidates for de-escalation of neoadjuvant therapy . Cancer Res 2021. ; 81 ( 4_Supplement ): PS3 – 02 . [Google Scholar]
- 17. Quantum Leap Healthcare Collaborative . The I-SPY2 Trial . https://www.ispytrials.org/results/manuscripts. Accessed January 27, 2023 . [Google Scholar]
- 18. The Cancer Imaging Archive, National Cancer Institute . I-SPY 2 Breast Dynamic Contrast Enhanced MRI . https://wiki.cancerimagingarchive.net/pages/viewpage.action?pageId=70230072. Accessed January 26, 2023. [Google Scholar]
- 19. Onishi N , Li W , Gibbs J , et al . Impact of MRI protocol adherence on prediction of pathological complete response in the I-SPY 2 neoadjuvant breast cancer trial . Tomography 2020. ; 6 ( 2 ): 77 – 85 . [DOI] [PMC free article] [PubMed] [Google Scholar]
- 20. Li W , Newitt DC , Gibbs J , et al . Predicting breast cancer response to neoadjuvant treatment using multi-feature MRI: results from the I-SPY 2 TRIAL . NPJ Breast Cancer 2020. ; 6 ( 1 ): 63 . [DOI] [PMC free article] [PubMed] [Google Scholar]
- 21. Onishi N , Li W , Newitt DC , et al . Breast MRI during neoadjuvant chemotherapy: lack of background parenchymal enhancement suppression and inferior treatment response . Radiology 2021. ; 301 ( 2 ): 295 – 308 . [DOI] [PMC free article] [PubMed] [Google Scholar]
- 22. Liao GJ , Henze Bancroft LC , Strigel RM , et al . Background parenchymal enhancement on breast MRI: a comprehensive review . J Magn eason Imaging 2020. ; 51 ( 1 ): 43 – 61 . [DOI] [PMC free article] [PubMed] [Google Scholar]
- 23. Schrading S , Kuhl CK . Breast cancer: influence of taxanes on response assessment with dynamic contrast-enhanced MR imaging . Radiology 2015. ; 277 ( 3 ): 687 – 696 . [DOI] [PubMed] [Google Scholar]


