

Abstract

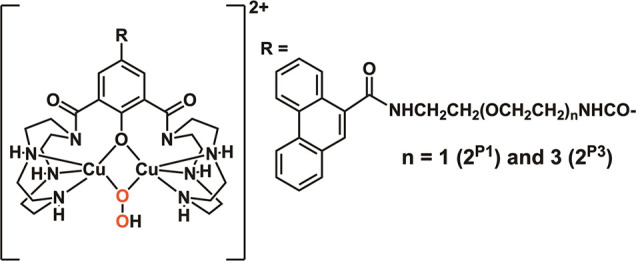
The DNA target/ligand conjugates (HLX, X = Pn and Mn, n = 1–3) were synthesized where various lengths of −CONH(CH2CH2O)nCH2CH2NHCO– linkers with a 9-phenanthrenyl (P) or methyl (M) terminal as DNA targets replace the methyl group of 2,6-di(amide-tether cyclen)-p-cresol ligand (HL). DNA binding, DNA cleavage, cellular uptake, and cytotoxicity of [Cu2(μ-OH)(LX)](ClO4)2 (1X) are examined and compared with those of [Cu2(μ-OH)(L)](ClO4)2 (1) to clarify roles of DNA targets. Upon reaction of 1X with H2O2, μ-1,1-O2H complexes are formed for DNA cleavage. 1P1, 1P2, and 1P3 are 22-, 11-, 3-fold more active for conversion of Form II to III in the cleavage of supercoiled plasmid DNA with H2O2 than 1, where the short P-linker may fix a dicopper moiety within a small number of base pairs to facilitate DNA double-strand breaks (dsb). This enhances the proapoptotic activity of 1P1, 1P2, and 1P3, which are 30-, 12-, and 9.9-fold cytotoxic against HeLa cells than 1. DNA dsb and cytotoxicity are 44% correlated in 1P1–3 but 5% in 1M1–3, suggesting specific DNA binding of P-linkers and nonspecific binding of M-linkers in biological cells. 1P1–3 exert cancer cell-selective cytotoxicity against lung and pancreas cancer and normal cells where the short P-linker enhances the selectivity, but 1M1–3 do not. Intracellular visualization, apoptosis assay, and caspase activity assay clarify mitochondrial apoptosis caused by 1P1–3. The highest cancer cell selectivity of 1P1 may be enabled by the short P-linker promoting dsb of mitochondrial DNA with H2O2 increased by mitochondrial dysfunction in cancer cells.
Introduction
Cancer is the most malignant disease, and the death rate due to cancer greatly increases to date. Cisplatin and related platinum complexes1,2 and iron bleomycin (Fe-BLM)3,4 are clinically used as anticancer agents. BLM forms an iron complex (Fe-BLM) after being dosed. These metal complexes induce apoptosis by binding and cutting DNA. These cytotoxic anticancer agents show high efficacy to a wide range of cancer disease, but there are problems of side effects by equally acting on cancer and normal cells.2,5,6 Therefore, the development of anticancer metal complexes to exert cancer cell-selective cytotoxicity is important to suppress the side effects.
DNA- and organelle-targeting metal complexes have attracted interests of chemists and medical scientists to develop anticancer reagents that are able to exert cancer cell-selective cytotoxicity.7−10 Mitochondrial dysfunction and high metabolic activity increase H2O2 concentration in cancer cells as the specific microenvironments.11,12 So far, a variety of metal complexes that are able to target mitochondria for cancer therapy have been developed to induce mitochondrial apoptosis.9,13 For example, mitochondria-targeting metal complexes using Cu,7e Ru,7f Ir,7g,7h and Au7i were reported. The Cu complex induced mitochondrial apoptosis by DNA cleavage.7e The Ru and Ir complexes were effective as a photosensitizer for photodynamic therapy.7f,7g The phosphorescent cyclometalated Ir compounds caused reactive oxygen species (ROS) elevation, cellular ATP depletion, caspase-dependent apoptosis through mitochondrial damage, and mitochondrial respiration inhibition.7h The Au porphyrin complex that is highly stable in a biological environment directly targeted mitochondrial chaperone to inhibit the activity.7i Besides these complexes, DNA- and mitochondria-targeting metal complexes having a H2O2 activation site are promising candidates capable of enhancing cancer cell-selective cytotoxicity by inducing mitochondrial apoptosis by cleaving mitochondrial DNA.14
Moreover, a variety of copper complexes have been well investigated to make anticancer agents with low cytotoxicity.15,16 Copper complexes may be effective to exert cancer cell-selective cytotoxicity because copper is an endogenous metal and has antineoplastic characters. Moreover, copper complexes having DNA-targeting moieties have been developed to enhance the anticancer activity.16 However, the DNA-targeting dinuclear copper complexes have been less developed so far, and roles of DNA targets in the cancer cell-selective cytotoxicity have not been clarified yet.
Recently, we found that a μ-1,1-hydroperoxodicopper(II) complex is formed from the dicopper(II) complex of 2,6-bis(amide-tether cyclen)-p-cresol (HL) [Cu2(μ-OH)(L)](ClO4)2 (1) upon reaction with H2O2 and largely accelerates oxidative DNA cleavage.17 However, the cytotoxicity of 1 is too low to be used as an anticancer agent. To enhance the cytotoxicity, a phenanthrene/HL conjugate HLP2 was synthesized where a 9-phenanthrenyl terminal −CONH(CH2CH2O)2CH2CH2NHCO– linker (P-linker) is introduced into HL because phenanthrene can bind DNA as an intercalator.18 The P-linker drastically improved the DNA cleavage activity and cytotoxicity of the dicopper(II) complex of HLP2 [Cu2(μ-OH)(L1P2)](ClO4)2 (1P2). Moreover, 1P2 exerted relatively high cancer cell-selective cytotoxicity. The caspase activity assay and intracellular visualization of 1P2 by the phenathrenyl group as a fluorescent probe revealed that mitochondrial apoptosis plays a key role in cancer cell-selective cytotoxicity by 1P2.18 In this stage, however, the systematic design of DNA target/ligand conjugates has not been addressed to optimize cancer cell-selective cytotoxicity.
In this study, a series of DNA target/ligand conjugates (HLX, X = Pn and Mn, n = 1–3) were synthesized to clarify and optimize roles of the DNA target in cancer cell-selective cytotoxicity where 4-methyl of the original ligand HL is replaced by −CONH(CH2CH2O)nCH2CH2NHCO– linkers having a 9-phenanthrenyl (P) or methyl (M) terminal as DNA targets, P-linkers, and M-linkers, respectively. HLX form dicopper(II) complexes [Cu2(μ-OH)(LX)](ClO4)2 (1X). The ligands and dicopper complexes used in this study are drawn in Scheme 1. DNA binding, DNA double-strand break (dsb) activity of plasmid DNA with H2O2, cellular uptake, and cytotoxicity against various normal and cancer cells of 1X are examined and compared with 1 to clarify roles of the P- and M-linkers as DNA targets. The localization of 1P1–3 in mitochondria is visualized by means of the confocal microscopy. The apoptotic cell death by 1P1–3 is shown by fluorescence-activated cell sorting (FACS). Caspase activity assays clarified the intrinsic pathway of apoptosis by 1X. These results clarify roles of the DNA targets in cancer-cell-selective cytotoxicity of 1X.
Scheme 1. Chemical Structures of HL, HLX, 1, and 1X (X = P1–3 and M1–3).

DNA targets are highlighted by red frames.
Experimental Section
Materials
Unless otherwise noted, solvents and reagents were purchased and used as received. Calf thymus DNA (Type I, fibers) and supercoiled plasmid pUC19 DNA were purchased from Nippon Gene CO., Ltd., and Sigma-Aldrich, respectively. 3,5-Diformyl-4-hydroxybenzoic acid 3, 1-amino-6-azido-3-oxaoctane 4 (n = 1), 1-amino-11-azido-3,6,9-trioxaundecane 4 (n = 3), N,N′,N″-4,7,10-triBOC-cyclen 5, phenanthrene-9-carbonyl chloride 6, acetyl chloride 7, 11 (n = 2), and dicopper complexes 1 and 1P2 were prepared as previously reported.17−20
Measurements
A PerkinElmer Elemental Analyzer 2400 II was used for elemental analyses (C, H, and N). An Agilent 8454 UV spectroscopy system was used to measure the UV–vis spectra. A HORIBA LAQUA electrode was used to measure pH, and a standard buffer solution was used. A SHIMADZU Single Reflection HATR IRAffinity-1 MIRacle 10 was used to obtain the infrared (IR) spectra. The 1H NMR spectra were recorded on a JEOL ECA-500RX spectrometer using Me4Si as an internal standard. A HITACHI Spectral fluorometer F-7000 was used to measure the fluorescence spectra. A JEOL JMS-T100CS spectrometer was used to measure cold spray ionization mass (CSI MS) and electrospray ionization mass (ESI MS). A SHIMADZU Inductively Coupled Plasma Mass Spectrometer ICP MS-2030 was used to determine copper content in cells. Confocal microscopic pictures were recorded on a confocal laser microscope A1 by Nikon Instech Co., Ltd. A Thermo Scientific Multiskan FC was used to carry out MTT assay. Flow cytometry studies were conducted on an Attune NxT Focusing Cytometer (Invitrogen).
Preparations
N-(5-Azido-3-oxaoctyl)-3,5-diformyl-4-hydroxybenzamide (8 (n = 1))
A solution of 3 (2.95 g, 15.2 mmol), 4 (n= 1) (6.60 g, 50.7 mmol), EDC·HCl (9.75 g, 50.8 mmol), and Et3N (7.2 mL, 51.6 mmol) in CHCl3 (200 mL) was stirred at 0 °C for 15 h under N2. To the resultant solution was added 1 M aqueous HCl (300 mL) and stirred at 30 °C for 15 h. After the H2O layer was separated using a separation funnel, the organic layer was washed with H2O (3 × 30 mL) and dried over Na2SO4. After removal of Na2SO4 by filtration, the filtrate was concentrated by evaporation. The product was obtained as a brown solid. Yield: 3.37 g (11.0 mmol, 72%). 500 MHz 1H NMR (CDCl3): δ/ppm = 11.9 (s, H, OH), 10.3 (brs, 2H, CHO), 3.68–3.74 (m, 6H, CH2), 3.42 (t, J = 5.1 Hz, 2H, CH2).
N-(11-Azido-3,6,9-trioxaoctyl)-3,5-diformyl-4-hydroxybenzamide (8 (n = 3))
8 (n = 3) was prepared from 3 and 4 (n = 3) in a similar method described for 8 (n = 1). Yield: 67%.500 MHz 1H NMR (CDCl3): δ/ppm = 11.9 (s, H, OH), 10.3 (brs, 2H, CHO), 8.52 (s, 2H, Ph), 3.62–3.75 (m, 14H, CH2), 3.37 (t, J = 5.0 Hz, 2H, CH2).
5-((5-Azido-3-oxaoctyl)carbamoyl)-2-hydroxyisophthalic Acid (9 (n = 1))
In a 200 mL round-bottom flask, 8 (n= 1) (3.37 g, 11.0 mmol) and Ag2O (7.89 g, 34.1 mmol) were placed and suspended in aqueous NaOH (3.64 g, 90.9 mmol, 70 mL). The mixture was stirred for 15 h at 60 °C. The insoluble materials were filtered and washed with a small amount of hot H2O. The filtrate was adjusted to pH 1 using 12 M aqueous HCl. The product precipitated as a white solid and was collected by filtration. Yield: 3.23 g (9.56 mmol, 87%). 500 MHz 1H NMR (DMSO-d6): δ/ppm = 8.56 (t, J = 5.2 Hz, H, NH), 8.48 (s, 2H, CH), 3.62 (t, J = 4.6, 5.2 Hz, 2H, CH2), 3.56 (t, J = 6.3 Hz, 2H, CH2), 3.40 (t, J = 4.6, 5.2 Hz, 4H, CH2).
5-((11-Azido-3,6,9-trioxaoctyl)carbamoyl)-2-hydroxyisophthalic Acid (9 (n = 3))
9 (n = 3) was obtained from 8 (n = 3) similarly to the preparation of 9 (n = 1). Yield: 69%. 500 MHz 1H NMR (DMSO-d6): δ/ppm = 8.53 (t, J = 5.2 Hz, H, NH), 8.47 (s, 2H, CH), 3.60 (t, J = 5.2 Hz, 2H, CH2), 3.54–3.58 (m, 4H, CH2), 3.52 (t, J = 6.3 Hz, 2H, CH2), 3.39 (t, J = 6.3 Hz, 2H, CH2), 3.37 (t, J = 6.3 Hz, 2H, CH2).
Compound 10 (n = 1)
To a DMF (20 mL) solution of DIPEA (1.7 mL, 9.90 mmol) and 9 (n= 1) (2.40 g, 5.08 mmol) was added a DMF (10 mL) solution of 5 (530 mg, 1.57 mol) and TBTU (1.50 g, 4.67 mmol) and stirred under N2 for 15 h. The reaction mixture was concentrated in vacuo. To the residue was added H2O (60 mL). The product was extracted with CHCl3 (4 × 60 mL), purified by silica gel column chromatography (gradient from EtOAc to EtOAc/MeOH, 10/1), and obtained as a brown solid. Yield: 1.39 g (1.11 mmol, 71%). 500 MHz 1H NMR (CDCl3): δ/ppm = 7.86 (s, 2H, Ph), 3.33–3.70 (m, 38H, CH2), 3.36 (t, J = 5.2, 4.6 Hz, 2H, CH2), 1.28–1.52 (m, 54H, CH3). ESI MS (positive mode) (MeOH): m/z = 646.1 (646.4: calcd for [10 (n= 1) + 2Na]2+) and 1269.1 (1269.7: calcd for [10 (n= 1) + Na]+).
Compound 10 (n = 3)
10 (n = 3) was prepared from 9 (n = 3) and 5 by a similar method described for 10 (n = 1). Yield: 49%. 500 MHz 1H NMR (CDCl3): δ/ppm = 7.87 (s, 2H, Ph), 3.21–3.83 (m, 48H, CH2), 1.26–1.53 (m, 54H, CH3). ESI MS (positive mode) (MeOH): m/z = 690.2 (690.4: calcd for [10 (n = 3) + 2Na]2+) and 1357.4 (1357.8: calcd for [10 (n = 3) + Na]+).
Compound 11 (n = 1)
To a solution of 10 (n= 1) (301 mg, 0.241 mmol) in MeOH (15 mL) was added 10% Pd-C (275 mg) under N2. The gas phase was replaced by evacuation and refilling with H2. The mixture was stirred at room temperature for 15 h. Pd-C was removed by filtration. After the concentration of the filtrate, the product was obtained as a pale yellow solid. Yield: 266 mg (0.217 mmol, 90%). ESI MS (positive mode) (MeOH): m/z = 1221.1 (1221.7: calcd for [11 (n= 1) + H]+).
Compound 11 (n = 3)
11 (n = 3) was prepared from 10 (n = 3) by a similar method described for 11 (n = 1). Yield: 93%. ESI MS (positive mode) (MeOH): m/z = 1309.8 (1309.8: calcd for [11 (n = 3) + H]+).
Compound 12 (n = 1)
To a THF (10 mL) solution of 6 (34.0 mg, 0.141 mmol) was added a THF (10 mL) solution of 11 (n= 1) (169 mg, 0.138 mmol) and Et3N (0.086 mL, 0.617 mol). The mixture was stirred at 0 °C for 1 h and at room temperature for 15 h under N2 and then concentrated to dryness. The product was extracted with H2O (15 mL) and CHCl3 (3 × 30 mL). The organic layers were combined and dried over Na2SO4. After Na2SO4 was filtered off, the filtrate was concentrated to dryness. The crude product was purified by silica gel column chromatography (gradient from CHCl3 to CHCl3/MeOH, 10/1). After the concentration of the fractions, the product was obtained as a pale-yellow solid. Yield: 115 mg (0.0805 mmol, 58%). 500 MHz 1H NMR (CDCl3): δ/ppm = 8.71 (d, J = 8.0 Hz, 1H, Phen5), 8.67 (d, J = 8.4 Hz, 1H, Phen4), 8.35 (d, J = 8.4 Hz, 1H, Phen1), 7.90 (s, 1H, Phen10), 7.89 (d, J = 7.3 Hz, 1H, Phen8), 7.82 (s, 2H, Ph), 7.60–7.72 (m, 4H, Phen2, Phen3, Phen6, Phen7), 3.30–3.81 (m, 40H, CH2), 1.26–1.52 (m, 54H, CH3). ESI MS (positive mode) (MeOH): m/z = 735.1 (735.4: calcd for [12 (n= 1) + 2Na]2+) and 1447.2 (1447.8: calcd for [12 (n= 1) + Na]+).
Compound 12 (n = 3)
12 (n = 3) was prepared using 11 (n = 3) and 6 by a similar procedure to that described for 12 (n = 1). Yield: 81%. 500 MHz 1H NMR (CDCl3): δ/ppm = 8.71 (d, J = 8.6 Hz, 1H, Phen4), 8.68 (d, J = 8.0 Hz, 1H, Phen5), 8.36 (d, J = 8.0 Hz, 1H, Phen8), 7.92 (s, 1H, Phen10), 7.90 (d, J = 8.0 Hz, 1H, Phen1), 7.83 (s, 2H, Ph), 7.58–7.74 (m, 4H, Phen2, Phen3, Phen6, Phen7), 3.06–3.87 (m, 48H, CH2), 1.26–1.53 (m, 54H, CH3). ESI MS (positive mode) (MeOH): m/z = 779.0 (779.4: calcd for [12 (n = 3) + 2Na]2+), 1535.5 (1535.8: calcd for [12 (n = 3) + Na]+).
Compound 13 (n = 1)
To a CH2Cl2 (5 mL) suspension of 11 (n= 1) (200 mg, 0.164 mmol) and K2CO3 (70.0 mg, 0.506 mol) was added a CH2Cl2 (5 mL) solution of acetyl chloride (35.0 μL, 0.493 mmol). The mixture was stirred at 0 °C for 1 h and at room temperature for 15 h under N2. The solid generated was filtered off. The filtrate was placed on a separation funnel and washed with H2O (3 × 10 mL). The organic layer was separated and dried over Na2SO4. The crude product was purified by silica gel column chromatography (gradient from EtOAc to EtOAc/MeOH, 10/1). The product was obtained after the concentration of fractions as a pale yellow solid. Yield: 103 mg (0.0819 mmol, 50%). 500 MHz 1H NMR (CDCl3): δ/ppm = 7.86 (s, 2H, Ph), 3.41–3.56 (m, 40H, CH2), 2.01 (s, 3H, CH3), 1.26–1.67 (m, 54H, CH3). ESI MS (positive mode) (MeOH): m/z = 654.0 (654.3: calcd for [13 (n= 1) + 2Na]2+), 1285.5 (1285.7: calcd for [13 (n= 1) + Na]+).
Compound 13 (n = 2)
13 (n = 2) was prepared from 11 (n = 2) and acetyl chloride by a similar method described for 13 (n = 1). Yield: 45%. 500 MHz 1H NMR (CDCl3): δ/ppm = 7.88 (s, 2H, Ph), 3.35–3.66 (m, 44H, CH2), 1.95 (s, 3H, CH3), 1.30–1.54 (m, 54H, CH3). ESI MS (positive mode) (MeOH): m/z = 676.0 (676.4: calcd for [13 (n = 2) + 2Na]2+), 1329.5 (1329.7: calcd for [13 (n = 2) + Na]+).
Compound 13 (n = 3)
13 (n = 3) was prepared using 11 (n = 3) and acetyl chloride by a similar procedure to that described for 13 (n = 1). Yield: 48%. 500 MHz 1H NMR (CDCl3): δ/ppm = 7.86 (s, 2H, Ph), 3.36–3.63 (m, 48H, CH2), 1.95 (s, 3H, CH3), 1.25–1.49 (m, 54H, CH3). ESI MS (positive mode) (MeOH): m/z = 698.0 (698.4: calcd for [13 (n = 3) + 2Na]2+), 1373.5 (1373.8: calcd for [13 (n = 3) + Na]+).
HLP1·6HCl
To a EtOH (6 mL) solution of 12 (n= 1) (699 mg, 0.490 mmol) was added 12 M HCl (2 mL) dropwise at 0 °C. After being stirred at room temperature for 15 h, the mixture was concentrated to dryness. The white solid obtained was washed by a small amount of dry EtOH. Yield: 449 mg (0.430 mmol, 88%). 500 MHz 1H NMR (D2O): δ/ppm = 8.88 (d, J = 8.0 Hz, 1H, Phen4), 8.84 (d, J = 8.0 Hz, 1H, Phen5), 8.11 (d, J = 8.0 Hz, 1H, Phen8), 8.08 (d, J = 8.0 Hz, 1H, Phen1), 7.93 (s, 1H, Phen10), 7.90 (s, 2H, Ph), 7.64–7.86 (m, 4H, Phen2, Phen3, Phen6, Phen7), 2.65–3.93 (m, 40H, CH2). ESI MS (positive mode) (H2O): m/z = 413.0 (413.2: calcd for [HLP1 + 2H]2+), 825.1 (825.5: calcd for [HLP1 + H]+).
HLP3·6HCl
HLP3·6HCl was prepared from 12 (n = 3) by a similar method described for HLP1·6HCl. Yield: 85%. 500 MHz 1H NMR (D2O): δ/ppm = 8.87 (d, J = 8.0 Hz, 1H, Phen4), 8.82 (d, J = 8.0 Hz, 1H, Phen5), 8.17 (d, J = 8.0 Hz, 1H, Phen8), 8.05 (d, J = 8.0 Hz, 1H, Phen1), 8.02 (s, 1H, Phen10), 7.75 (s, 2H, Ph), 7.69–7.83 (m, 4H, Phen2, Phen3, Phen6, Phen7), 2.90–3.90 (m, 48H, CH2). ESI MS (positive mode) (H2O): m/z = 457.3 (457.3: calcd for [HLP3 + 2H]2+), 913.5 (913.5: calcd for [HLP3 + H]+).
HLM1·6HCl
HLM1·6HCl was prepared from 13 (n = 1) by a similar method described for HLP1·6HCl. Yield: 90%. 500 MHz 1H NMR (D2O): δ/ppm = 7.86 (s, 2H, Ph), 3.07–3.90 (m, 40H, CH2), 1.96 (s, 3H, CH3). ESI MS (positive mode) (H2O): m/z = 332.0 (332.2: calcd for [HLM1 + 2H]2+), 663.2 (663.4: calcd for [HLM1 + H]+).
HLM2·6HCl
HLM2·6HCl was prepared from 13 (n = 2) by a similar method described for HLP1·6HCl. Yield: 95%. 500 MHz 1H NMR (D2O): δ/ppm = 7.96 (s, 2H, Ph), 3.04–3.94 (m, 44H, CH2), 1.99 (s, 3H, CH3). ESI MS (positive mode) (H2O): m/z = 354.0 (354.2: calcd for [HLM2 + 2H]2+), 707.3 (707.5: calcd for [HLM2 + H]+).
HLM3·6HCl
HLM3·6HCl was prepared from 13 (n = 3) by a similar method described for HLP1·6HCl. Yield: 98%. 500 MHz 1H NMR (D2O): δ/ppm = 7.90 (s, 2H, Ph), 3.09–3.95 (m, 48H, CH2), 1.99 (s, 3H, CH3). ESI MS (positive mode) (H2O): m/z = 376.0 (376.2: calcd for [HLM3 + 2H]2+), 751.3 (751.5: calcd for [HLM3 + H]+).
Dicopper(II) Complex 1P1
The HCl salt HLP1·6HCl (103 mg, 0.0990 mmol) was treated with aqueous NaOH (1 M, 600 μL). After the mixture was concentrated and dried in vacuo, to the residue was added CH2Cl2, and HLP1 was extracted. After concentration, HLP1 was obtained as a pale-yellow solid (57.2 mg, 0.0693 mmol; yield: 70%). To a H2O (200 μL) solution of HLP1 (57.2 mg, 0.0693 mmol) was added a H2O (200 μL) solution of Cu(ClO4)2·6H2O (36.4 mg, 0.139 mmol) under N2. The mixture was adjusted to pH 8 with aqueous NaOH (1 M). The mixture was concentrated in vacuo. [Cu2(μ-OH)(LP1)](ClO4)2 (1P1) was obtained as a green solid and recrystallized from MeOH/Et2O. Yield: 65.5 mg (0.0561 mmol, 81%). Anal. calcd for [Cu2(μ-OH)(LP1)](ClO4)2·NaClO4·4H2O: C, 38.82; H, 5.03; N, 10.29. Found: C, 38.96; H, 4.96; N, 9.81. ESI MS (positive mode) (H2O): m/z = 474.0 (474.2: calcd for [1P1 – OH – 2ClO4 – H]2+), 483.1 (483.2: calcd for [1P1 – 2ClO4]2+), and 1065.0 (1065.3: calcd for [1P1 – ClO4]+). IR (KBr): ṽ/cm–1 = 2870, 1628, 1533, 1443, 1362, 1300, 1273, 1090, 953, 932, 837, 810, 781, 756, 729, 691, 654, 623. Other dicopper(II) complexes 1P3 and 1M1-M3 were synthesized by the almost same method as 1P1 where HLP3 and HLM1–M3 were used instead of HLP1. Data of each complex are shown below.
Dicopper(II) Complex 1P3
1P3 was prepared from HLP3·6HCl by a similar method described for 1P1. Yield: 75%. Anal. calcd for [Cu2(μ-OH)(LP3)](ClO4)2·8H2O: C, 41.20; H, 6.05; N, 10.01. Found: C, 41.39; H, 5.59; N, 10.2. ESI MS (positive mode) (H2O): m/z = 527.1 (527.2: calcd for [1P3 – 2ClO4]2+), 1153.32 (1153.31: [1P3 – ClO4]+). IR (KBr): ṽ/cm–1 = 3744–3134, 2928, 2878, 2020, 1726, 1632, 1537, 1443, 1360, 1300, 1273, 1246, 1076, 1001, 988, 953, 930, 839, 812, 786, 756, 731, 700, 656, 623.
Dicopper(II) Complex 1M1
1M1 was prepared from HLM1·6HCl by a similar method described for 1P1. Yield: 90%. Anal. calcd for [Cu2(μ-OH)(LM1)](ClO4)2·6H2O: C, 33.46; H, 5.98; N, 12.59. Found: C, 33.70; H, 6.23; N, 12.85. ESI MS (positive mode) (H2O): m/z = 402.0 (402.1: calcd for [1M1 – 2ClO4]2+), 903.0 (903.2: calcd for [1M1 – ClO4]+). IR (KBr): ṽ/cm–1 = 2908, 2029, 1624, 1539, 1437, 1364, 1302, 1271, 1082, 988, 930, 880, 850, 837, 812, 790, 766, 692, 667, 648, 625.
Dicopper(II) Complex 1M2
1M2 was prepared from HLM2·6HCl by a similar method described for 1P1. Yield: 73%. Anal. calcd for [Cu2(μ-OH)(LM2)](ClO4)2·4H2O: C, 35.36; H, 5.93; N, 12.50. Found: C, 35.08; H, 6.00; N, 12.25. ESI MS (positive mode) (H2O): m/z = 414.9 (415.1: calcd for [1M2 – OH – 2ClO4 – H]2+), 424.0 (424.2: calcd for [1M2 – 2ClO4]2+), 947.0 (947.3: calcd for [1M2 – ClO4]+). IR (KBr): ṽ/cm–1 = 2875, 2054, 1628, 1547, 1445, 1368, 1302, 1275, 1083, 950, 932, 840, 810, 785, 772, 690, 654, 620.
Dicopper(II) Complex 1M3
1M3 was prepared from HLM3·6HCl by a similar method described for 1P1. Yield: 80%. Anal. calcd for [Cu2(μ-OH)(LM3)](ClO4)2·3H2O: C, 36.65; H, 5.98; N, 12.21. Found: C, 36.55; H, 6.02; N, 12.30. ESI MS (positive mode) (H2O): m/z = 437.0 (437.2: calcd for [1M3 – OH – 2ClO4 – H]2+), 446.0 (446.2: calcd for [1M3 – 2ClO4]2+), 991.0 (991.3: calcd for [1M3 – ClO4]+). IR (KBr): ṽ/cm–1 = 2905, 2054, 1628, 1553, 1445, 1360, 1275, 1085, 935, 885, 850, 805, 700, 654, 613.
Ethidium Bromide Method21
To a buffer (pH 6.0 (MES, 10 mM)) solution of ct-DNA (20 μM bp) and EtBr (3.3 μM) containing NaCl (10 mM) was added a buffer (pH 6.0 (MES, 10 mM)) solution of 1X containing NaCl (10 mM) in 2 μM intervals until it reached 400 μM. The fluorescence spectra with excitation at 510 nm were measured in 520–800 nm at 37 °C. The apparent binding constants Kapp (M–1) were obtained using eq 1 where [complex] = (the concentrations of 1P1,3and 1M1–3 at a 50% reduction of the fluorescence intensity of EtBr), KEtBr = 1.1 × 10⁷ M–1, and [EtBr] = 1.65 μM were used.
| 1 |
Measurements of DNA Cleavage
To evaluate the DNA cleavage activity of 1X, pUC19 DNA was used as a substrate. 1X (0–50 μM) was dissolved in an aqueous solution containing pUC19 DNA (50 μM bp), buffer (10 mM, pH 6.0 (MES)), and NaCl (10 mM). To the mixture was added H2O2 (0–500 μM) at 37 °C in the dark. The reaction was followed by taking an aliquot at 0, 10, 20, 30, 40, 60, 120, 180, and 300 min and quenched by addition of a loading dye (0.025% bromophenol blue, 0.025% xylene cyanol FF, 1.0 mM EDTA, and 30% glycerol). Each sample was subjected to electrophoresis on a 1% agarose gel in a TAE (tris/acetate/EDTA) buffer for 1 h at 100 V. The gels were stained with EtBr (0.5 μg μL–1) for 1 h. The DNA bands were visualized on a UV transilluminator, photographed by a Vilber Lourmat ECX-20-M. For the reduced stain uptake of Form I, a correction factor of 1.06 was used to quantify.
Spectroscopic Identification of μ-1,1-Hydroperoxodicopper(II) Complexes
To a MeCN solution of 1P1 or 1P3 (0.25 mM, 2 mL) in a quartz cell at −30 ± 0.2 °C (or rt) was added a MeCN solution of H2O2 (10 equiv). The formation of μ-1,1-hydroperoxodicopper(II) complexes was monitored by the electronic absorption spectral change in the range of 290–850 nm and also observed by the CSI MS spectra in H2O using not only H216O2 but also H218O2.
Cell Culture
Prof. Kitagishi provided HeLa (human cervical cancer) cells used in this study (Doshisha University, Kyoto, Japan). The RIKEN Bioresource Center provided WI-38 (human lung fibroblast normal), A549 (human lung cancer), PK-59 (human cancer), and 2C6 (human embryonic pancreas normal) cells used in this study (Ibaraki, Japan). HeLa, A549, WI-38, and PK-59 cells were maintained in Dulbecco’s modified Eagle’s medium (D-MEM, high glucose) (FUJIFILM Wako Pure Chemical Corporation, Osaka, Japan), Dulbecco’s modified Eagle’s medium (DMEM, low glucose) (Thermo Fisher Scientific, Tokyo, Japan), minimum essential medium Eagle (MEM) (Sigma-Aldrich Japan, Tokyo, Japan), or Roswell Park Memorial Institute 1640 Medium (RPMI 1640) (Thermo Fisher Scientific, Tokyo, Japan), respectively. These cell culture media were supplemented with fetal bovine serum (10%) (Biowest, Nuaillé, France) and penicillin (100 units mL–1) and streptomycin (100 μg mL–1) (FUJIFILM Wako Pure Chemical Corporation, Osaka, Japan) at 37 °C in a humidified atmosphere of 5% CO2. 2C6 cells were maintained in Mixture F-10 Ham (HamF10) (Sigma-Aldrich Japan, Tokyo, Japan) supplemented with newborn calf serum (10%) (Sigma-Aldrich Japan, Tokyo, Japan), fetal bovine serum (5%) (Biowest, Nuaillé, France), horse serum (2.5%) (Sigma-Aldrich Japan, Tokyo, Japan), and penicillin (100 units mL–1) and streptomycin (100 μg mL–1) (FUJIFILM Wako Pure Chemical Corporation, Osaka, Japan) at 37 °C in a humidified atmosphere of 5% CO2.
Cellular Uptake Measurements
HeLa cells were seeded onto dishes (φ60 mm) in a culture medium (2.5 × 10⁵ cells per mL, 4 mL) and grown at 37 °C in a 5% CO2 incubator for 24 h. After rinsing twice with PBS(−), 4 mL of 1X (25 μM) was added to each dish containing a complete medium and incubated for 48 h. In the control experiment, 1X was not added. Cellular uptake was measured one time for each of 1X. The cells were peeled off with trypsin (0.25%) after rinsing twice with PBS(−) and suspended in PBS(−) (500 μL) after being centrifuged and washed with PBS(−) (1 mL). The cell suspension (1 × 10⁶ cells) was lyophilized and treated with 70% HNO3 (250 μL) for 3 h at 60 °C. The solution diluted with H2O (250 μL) was used for ICP MS.
Lipophilicity Measurements22
The lipophilicity of 1X was estimated from distribution coefficients in an octanol/water system determined by the standard shake-flask method. Each measurement was repeated three times. Concentrations of 1X in organic and aqueous layers were determined separately by measuring the absorbance on a UV–vis spectrophotometer after proper dilution where their respective molar extinction coefficients were used. The distribution coefficients were calculated from the equation of log Pow = log[1X]o/[1X]w.
Cytotoxicity Measurements23−25
MTT Cell Proliferation Assay Kit (Cayman Chemical Company, Michigan, USA) was used to assess the cytotoxicity of 1X and cisplatin by a standard 3-(4,5-dimethylthiazole)-2,5-diphenyl-tetrazolium bromide (MTT) assay. In 96-well microassay culture plates (1 × 10⁴ cells per well), the cells were placed and grown in a humidified atmosphere of a 5% CO2 incubator for 24 or 48 h at 37 °C. To each well was added 1Pn at 1 to 400 μM, 1Mn at 1 to 1000 μM, or cisplatin at 0.1 to 20 μM. Only a culture medium was added to the blank and control well. Each well was rinsed twice with PBS(−) after incubation. A MTT dye solution (100 μL, 0.5 mg mL–1) was added, and after 3 h, DMSO (100 μL) was added to solubilize MTT Formazan. The half maximal inhibitory concentrations (IC50) were determined as previously reported.18 All experiments were repeated at least three times and expressed as the mean ± standard deviation.
Fluorescence Imaging26
Onto observation dishes (φ14 mm), HeLa cells in a culture medium (600 μL) were seeded and grown in a humidified atmosphere of 5% CO2 at 37 °C for 24 h. The dishes were rinsed twice with PBS(−). A solution of 1P1, 1P2, or 1P3 (200 μM, 600 μL) in the culture medium was added to the dishes and incubated at 37 °C for 1 h. After rinsing twice with PBS(−), to the dishes was added a solution of Mito Tracker Deep Red FM (Thermo Fisher) (50 nM, 600 μL) in a complete culture medium for mitochondrial staining. The dishes were incubated at 37 °C for 10 min and observed on the confocal fluorescence microscope to obtain pictures. A Nikon NIS-Elements Ar was used for image analysis. The cellular uptake of 1P1–3 to HeLa cells was examined at 4 and 37 °C as follows. Onto observation dishes (φ14 mm) were seeded HeLa cells in a culture medium (600 μL) and grown at 37 °C for 24 h. A 600 μL solution of 1P1 (200 μM), 1P2 (500 μM), or 1P3 (800 μM) in the culture medium was added to the dishes after rinsing twice with PBS(−). The dishes were incubated at 37 or 4 °C for 1 h and observed on the confocal fluorescence microscope.
Apoptosis Assay27
Onto six-well microassay culture plates (3 × 10⁵ cells per well) were seeded HeLa cells in a culture medium (2 mL) and grown in a humidified atmosphere of a 5% CO2 incubator at 37 °C for 24 h. A solution (2 mL) of 1P1, 1P3, or 1M1–3 (each IC50 value at 24 h) was added to each well and incubated for 1 or 12 h. The cells were peeled off with trypsin (0.25%) after rinsing twice with PBS(−), washed with PBS(−) (2 mL), and collected by centrifugation. A solution (100 μL) of 1 × 10⁶ cells per mL was prepared with 1× BB. To the solution was added Annexin V-FITC solution (5 μL) and incubated at rt for 10 min. The solution was centrifuged and aspirated. To the cells was added 1× BB (500 μL), suspended, and collected by centrifugation. To the cells was added 1 × BB (200 μL). To the solution was added PI (5 μL) and suspended. The cell suspension (10,000 cells) was observed using channel BL1 (filter, 530/30; filter range, 515/545) and channel BL2 (filter, 574/26; filter range, 561–587) of blue (488 nm) under an Attune NxT Acoustic Focusing Cytometer.
Caspase-9 Activity Assay28,29
CaspGLOW Fluorescein Active Caspase-9 Kit (Thermo Fisher Scientific, Tokyo, Japan) was used for the measurement. HeLa cells were grown with the six-well micro assay culture plates as described above. To each well, 1 or 1X (2 mL) was added to the final concentration of 97.3 μM (IC50 of 1P1 at 24 h) and incubated at 37 °C for 1 or 12 h. The cells were peeled off with trypsin (0.25%) after rinsing twice with PBS(−). The cells were collected by centrifugation. The cell suspension (1 × 10⁶ cells per mL, 300 μL) was prepared with a culture medium. To the suspension was added a solution of FITC-LEHD-FMK (FITC-Leu-Glu-His-Asp-fluoromethyl ketone) (1 μL) and incubated for 60 min. After being collected by centrifugation, the cells were washed with buffer (500 μL). The cell suspension (10,000 cells) was observed using channel BL1 (filter, 530/30; filter range, 515/ 545) of blue (488 nm) under an Attune NxT Acoustic Focusing Cytometer. The cells were gated to FSC and SSC.
Caspase-3/7 Activity Assay30
The measurements were carried out using CellEvent Caspase-3/7 Green Flow Cytometry Assay Kit (Thermo Fisher Scientific, Tokyo, Japan). HeLa cells were prepared as described in Caspase-9 Activity Assay. 1 or 1X (2 mL) was added to each well to the final concentration of 97.3 μM (IC50 of 1P1 at 24 h). The cell suspension (1 × 10⁶ cells per mL, 1 mL) was prepared with PBS(−). To the suspension was added CellEvent Caspase-3/7 Green Detection Reagent (1 μL) and incubated at 37 °C for 25 min. After being washed and collected by centrifugation, the cells were suspended with PBS(−) (1 mL). The cell suspension (10,000 cells) was observed using channel BL1 (filter, 530/30; filter range, 515/545) and channel BL3 (filter, 595/40; filter range, 675–715) of blue (488 nm) under an Attune NxT Acoustic Focusing Cytometer.
Results and Discussion
Preparations of DNA Target/Ligand Conjugates HLX and Their Copper(II) Complexes 1X
The synthetic routes of the DNA target/ligand conjugates [HLX (X = Pn and Mn, n = 1–3)] are shown in Scheme 2. In the beginning, three different lengths of PEG-linkers (n = 1–3) were attached to 2,6-diformyl-4-caroboxyphenol through the amide bond. In the next steps, tri-Boc cyclen and terminal phenanthrenyl (P) or methyl (M) groups were introduced stepwise. Boc groups were removed by acidic solvolysis in the final stage. The resultant DNA target/ligand conjugates HLX form dicopper(II) complexes [Cu2(μ-OH)(LX)](ClO4)2 [1X, X = P1 (1P1), P2 (1P2), P3 (1P3), M1 (1M1), M2 (1M2), and M3 (1M3)] upon reaction with Cu(ClO4)2 at pH 8.0 adjusted by aqueous NaOH (1 M). The isolated solid was purified by recrystallization from MeOH/Et2O. The synthetic details, elemental analysis, electronic absorption, IR, and ESI MS data of HLX and 1X are shown in Experimental Section and the Supporting Information, except for HLP2 and 1P2 reported previously.17,18
Scheme 2. Synthetic Route of HLX (X = P1–3 and M1–3).

Structures of Dicopper Complexes 1X
Structures of [Cu2(μ-OH)(LX)](ClO4)2 (1X) were examined by the electronic absorption spectra in Figure S1, and the ESI MS spectra are shown in Figures S2–S6. Structures of 1 and 1P2 were previously reported.15,16 In the electronic spectra of 1X, two bands appeared at 380 and 640 nm assignable to PhO– to Cu(II) LMCT and d–d transition bands (see Experimental Section), close to those of 1 and 1P2 previously reported.17,18 The PhO– to Cu(II) LMCT bands are similar to the bands at 340–400 nm reported for the μ-OH-μ-OPh dicopper(II) complexes.17,18,31,32 The moleculer ion peaks of 1P1, 1P3, 1M1, 1M2, and 1M3 in the ESI MS spectra appear at m/z 1065.17, 1153.32, 903.28, 947.32, and 991.38 corresponding to [LX + 2Cu(II) + OH + ClO4]+, respectively. All spectral data demonstrate that a common μ-OH-μ-OPh dicopper(II) core structure of 1X is kept in MeCN and aqueous solutions.
DNA Binding Constants of 1X
Apparent binding constants Kapp (M–1) of 1X with calf thymus DNA (ct-DNA) were estimated by an ethidium bromide method.21,22 The fluorescence emission intensity decreases upon addition of 1X as shown in Figure S7. Figure 1 shows plots of intensity at 610 nm vs concentrations of 1P1–3 and DNA binding constants Kapp (M–1) of 1X in comparison with 1. The DNA binding constants of 1P1–3 and 1M1–3 are 6.5–9.1 and 3.5–4.6 times larger than that of 1, respectively, showing that the P-linkers are two-fold more effective as DNA targets than the M-linkers. The DNA binding ability of 1X is enhanced by a phenanthrenyl group that may serve as an intercalator and slightly by PEG-linkers. The DNA binding abilities of 1P2 and 1M2 having the PEG-linker (n = 2) may be slightly enhanced by anti-orientation of the dicopper moiety and phenathrenyl or methyl group in the transoid conformation of the PEG-linker.
Figure 1.

(A) Plots of fluorescence emission intensity at 601 nm vs concentrations of 1 (red), 1P1 (light green), 1P2 (light blue), and 1P3 (purple). (B) DNA binding constants Kapp (×106 M–1) estimated from these data. Conditions: [complex] = 0–400 μM, [ct-DNA] = 20 μM bp, [EtBr] = 3.3 μM, [NaCl] = 10 mM, [buffer] = 10 mM (pH 6.0, MES), λex = 510 nm at 37°C.
Spectroscopic Identification of μ-1,1-Hydroperoxo Complexes
Previously, we reported that μ-1,1-hydroperoxo complexes [Cu2(μ-O2H)(L)]2+ (2) and [Cu2(μ-O2H)(LP2)]2+ (2P2) are formed from 1 and 1P2 upon reaction with H2O2 to accelerate the DNA cleavage and identified by the resonance Raman, cold-spray ionization (CSI) MS, and electronic absorption spectra.17,18
In this study, μ-1,1-hydroperoxo complexes [Cu2(μ-O2H)(LX)]2+ (2X, X = P1 and P3) (Scheme 3) are identified by the electronic absorption (Figure S8) and CSI MS spectra (Figures S9–S12). The electronic absorption spectra of 2P1 and 2P3 in MeCN at −30 °C show two bands at 340 (ε = 5800) and 400 (ε = 3100) nm and at 340 (ε = 5600) and 400 (ε = 3200 M–1 cm–1) nm, respectively. These are almost the same as 340 (ε = 5600) and 398 (ε = 4800 M–1 cm–1) nm of 2. The CSI MS spectra of 2P1 and 2P3 in H2O at 0 °C show two major peaks at m/z 491 and 1081 corresponding to [LP1 + 2Cu(II) + O2H]2+ and [LP1 + 2Cu(II) + O2H + ClO4]+ and at m/z 535 and 1169 corresponding to [LP3 + 2Cu(II) + O2H]2+ and [LP3 + 2Cu(II) + O2H + ClO4]+, respectively. When 18O-labeled H218O2 was used instead of H216O2, these peaks shifted by four mass units (Figures S10 and S12), showing that two O-atoms of 2P1 and 2P3 come from H2O2. These show that the common μ-1,1-hydroperoxo species are formed from 1X upon reaction with H2O2 for the DNA cleavage.
Scheme 3. Chemical Structures of 2X (X = P1 and P3).
DNA Cleavage by 1X
Using supercoiled plasmid pUC19 DNA (Form I) as a substrate, the DNA cleavage activity of 1X with H2O2 was examined at pH 6.0 at 37 °C under the reaction conditions shown in Experimental Section and compared with that of a dicopper complex 1 to clarify roles of the DNA targets. Forms II and III, nicked circular and linear double-strand DNA, respectively, were produced from Form I.33 These are analyzed by agarose gel electrophoresis. The time courses for the decrease of Form I, gel patterns, and rates (%) of Forms I, II, and III are shown in Figures S13, S14, and S19 and Table S1, respectively. Time courses for the increase of Form III (%) in the DNA cleavage by 1P1–3 and 1M1–3 are shown in comparison with 1 in Figure 2A,B, respectively.
Figure 2.

Time courses for the increase of Form III (%) in the reaction of pUC19 DNA (50 μM bp) with the complex (50 μM) and H2O2 (0.5 mM) at pH 6.0 (MES, 10 mM) at 37°C. (A) 1P1 (right green), 1P2 (right blue), 1P3 (purple), and 1 (red) and (B) 1M1 (right green), 1M2 (right blue), 1M3 (purple), and 1 (red). Experiments were repeated at least three times.
The Form I decay rates obey the first-order kinetics as shown in Figure S15. The pseudo-first-order rate constants of 3.2, 7.1, 3.5, and 2.5 × 10⁻² min–1 for 1P1, 1P2, 1M1, and 1M2, respectively, are slightly larger than 2.3 × 10⁻² min–1 of 1, but 2.3 and 1.5 × 10⁻² min–1 of 1P3 and 1M3 are smaller. These data show that conversion of Form I to II is only slightly accelerated by short linkers but not by long ones. Meanwhile, as shown in Figure 2, Form III production is greatly accelerated by 1X and by shortening the linker. It accompanies a large induction decay because conversion of Form I to II is much faster due to the distorted supercoiled structure of Form I than that of Form II to III. Therefore, short linkers specifically accelerate the slow conversion of Form II to III.
Form III is produced via DNA double-strand breaks (dsb) of opposed strands within the 16 base pairs.34 Thus, to clarify roles of DNA targets in the DNA dsb by 1X, the yield of Form III (%) in the 3 h reaction by 1X or 1 and enhancement rates (1X/1) in the DNA dsb are shown in Table 1. P-linkers two-fold enhance DNA dsb than M-linkers in the same linker size. This is consistent with the fact that DNA binding constants of 1P1–3 are two-fold larger than those of 1M1–3, showing that DNA dsb by 1X is accelerated by DNA binding. Moreover, 1P1 gives the highest yield 47% of Form III in the 3 h reaction in 1X, and enhancement rates (1X/1) in the DNA dsb increase with shortening of the linkers. Thus, the short P-linker of 1P1 is the optimized DNA target for the DNA dsb. These results suggest that the short P-linker of 1P1 fixes the dicopper moiety within a small number of base pairs via intercalation of the phenanthrenyl group to facilitate the second break of a closely opposed strand to the first break in the DNA dsb.
Table 1. Yield of Form III (%) in the 3 h Reaction by 1X or 1 and Enhancement Rates (1X/1) in the DNA dsb.
| complex | Form III (%) in 3 h | enhancement rate (1X/1) in DNA dsb | complex | Form III (%) in 3 h | enhancement rate (1X/1) in DNA dsb |
|---|---|---|---|---|---|
| 1P1 | 47 ± 1 | 22 | 1M1 | 23 ± 3 | 11 |
| 1P2 | 23 ± 4 | 11 | 1M2 | 9 ± 2 | 4 |
| 1P3 | 7 ± 1 | 3 | 1M3 | 4 ± 1 | 2 |
| 1 | 2 ± 1 | 1 | 1 | 2 ± 1 | 1 |
To gain some insights into the active species, we carried out inhibition experiments for the DNA cleavage by 1P1 using KI (H2O2 scavenger) and DMSO (HO• scavenger). The results are shown in Figure S21. Either the decrease in Form I or the increase in Form III was not inhibited in the presence of DMSO (1.0, 5.0, 10 mM). Thus, a diffusible HO• is not involved in the DNA cleavage. Meanwhile, KI (1.0, 5.0, and 10 mM) retarded both the decrease in Form I and the increase in Form III. This is caused by reduction of H2O2 by KI. Thus, HO• and H2O2 are not direct oxidants for the DNA cleavage. Therefore, a Cu-bound peroxide species may directly attack DNA.
Cellular Uptake and Lipophilicity of 1X
The intracellular toxic ability of 1X depends on the cellular uptake. Thus, the cellular uptake of 1X (25 μM) to HeLa cells (2.5 × 10⁵ cells/mL) after 48 h incubation was determined by measuring Cu contents in cells and the culture medium with ICP MS35 and compared with that of 1 to clarify roles of the DNA targets in the cytotoxicity of 1X. Rates of [Cu in cells]/[Cu in culture medium] for 1, 1P1, 1P2, 1P3, 1M1, 1M2, and 1M3 are 2.04, 4.92, 4.38, 3.70, 3.55, 1.72, and 1.25%, showing that enhancement rates (1X/1) in the cellular uptake of 1P1, 1P2, 1P3, 1M1, 1M2, and 1M3 are 2.41, 2.15, 1.81, 1.74, 0.84, and 0.61, respectively. The cellular uptake of 1P1–3 is higher than that of 1M1–3. The former decreases only to 75% by elongating linkers where the phenanthrenyl group is dominant but the latter to 35% where the linker size is dominant. Since lipophilicity may influence cellular uptake, the lipophilicity of 1X was estimated from the distribution coefficients (log Pow)22 in an octanol/water system. The log Pow values of 1, 1P1, 1P2, 1P3, 1M1, 1M2, and 1M3 are −2.38, −1.22, −1.14, −0.98, −1.39, −1.22, and −1.11, respectively, showing that the lipophilicity of 1X is enhanced by the P- and M-linkers and slightly by elongating the linker. These suggest that the cellular uptake of 1P1–3 is enhanced by the membrane permeability of the phenanthrenyl group but not by the lipophilicity.
Cytotoxicity of 1X
The cytotoxicity of 1X against various cells was examined by MTT assay.23−25 IC50 values of 1X determined by plots of cell viability vs log[1X] after 24 and 48 h incubations are shown in Table S2 and Table 2, respectively. The IC50 data show that cytotoxicity is kept intact after 48 h. Moreover, the stability of the dicopper complexes 1P1 and 1M1 under the incubation conditions used in this study was monitored by the electronic absorption spectra in 72 h as shown in Figure S20. The spectra of 1P1 and 1M1 did not change significantly, showing that these complexes are kept intact during the incubation. IC50 data (24 h) of HLX against all cell lines used in this study are larger than 1000 μM as shown in Table S2, showing that HLX are much less cytotoxic than the dicopper complexes. Moreover, we carried out MTT assay in the presence of HLP1 and Cu(ClO4)2. The IC50 data (24 h) against all cell lines used in this study are larger than 1000 μM as shown in Table S2. Therefore, HLP1 plus Cu(II) ion are much less cytotoxic than the dicopper complexes. IC50 data (48 h) of 1P1, 1P2, 1P3, and 1 against HeLa cells are 21.8, 56.6, 66.4, and 660 μM, respectively, showing that enhancement rates (1X/1) in the cytotoxicity of 1P1, 1P2, 1P3 are 30, 12, and 9.9, respectively. These are much larger than enhancement rates in cellular uptake. Thus, the cytotoxicity of 1X is greatly enhanced by the P-linkers and by shortening the linker. This may be correlated to enhancement rates (1X/1) in DNA dsb enhanced by shortening the linker. However, IC50 data (48 h) of 199, 257, and 283 μM of 1M1, 1M2, and 1M3, respectively, show that the cytotoxicity of 1M1–3 against HeLa cells is only 2- to 3-fold enhanced than that of 1 and almost independent of the linker size.
Table 2. In Vitro Cytotoxicity of 1, 1X, and Cisplatin against Various Cells in MTT Assay (48 h) (Mean ± SD).
| IC50 (μM) (mean ± SD) |
|||||||
|---|---|---|---|---|---|---|---|
| cervical | lung |
pancreas |
|||||
| complex | HeLa (cancer) | A549 (cancer) | WI-38 (normal) | SF | PK-59 (cancer) | 2C6 (normal) | SF |
| 1 | 660 ± 28 | 284 ± 16 | 838 ± 82 | 3.0 | 241 ± 4 | 1140 ± 50 | 4.7 |
| 1P1 | 21.8 ± 6.5 | 20.9 ± 0.6 | 215 ± 20 | 10.3 | 11.8 ± 2.5 | 90.4 ± 2.8 | 7.7 |
| 1P2 | 56.6 ± 1.8 | 23.8 ± 2.4 | 218 ± 3 | 9.2 | 18.4 ± 1.6 | 104 ± 8 | 5.7 |
| 1P3 | 66.4 ± 2.7 | 71.7 ± 1.4 | 268 ± 3 | 3.8 | 57.4 ± 2.0 | 128 ± 1 | 2.2 |
| 1M1 | 199 ± 11 | 206 ± 7 | 431 ± 32 | 2.1 | 147 ± 1 | 552 ± 5 | 3.8 |
| 1M2 | 257 ± 1 | 247 ± 18 | 527 ± 9 | 2.1 | 152 ± 9 | 657 ± 12 | 4.3 |
| 1M3 | 283 ± 22 | 279 ± 8 | 636 ± 16 | 2.3 | 161 ± 4 | 675 ± 5 | 4.2 |
| cisplatin | 0.93 ± 0.01 | 1.83 ± 0.03 | 4.55 ± 0.03 | 2.5 | 2.01 ± 0.02 | 1.15 ± 0.08 | 0.6 |
To clarify roles of P- and M-linkers in DNA dsb by 1X in HeLa cells, expected enhancement rates (1X/1) in DNA dsb in HeLa cells (A) × (C) are estimated from enhancement rates (1X/1) in DNA dsb (A) and enhancement rates (1X/1) in cellular uptake to HeLa cells (C) as shown in Table 3. Plots of the expected enhancement rates (1X/1) in DNA dsb in HeLa cells (A) × (C) vs enhancement rates in cytotoxicity against HeLa cells (B) are made for 1P1–3 and 1M1–3 in Figure 3. The plots for 1P1–3 and 1M1–3 give straight lines with slopes 0.44 and 0.053, respectively. These values show that cytotoxicity and DNA dsb are 44% correlated for 1P1–3 but only 5% for 1M1–3. Thus, P-linkers proportionally enhance DNA dsb and cytotoxicity whereas M-linkers only DNA dsb but not cytotoxicity, suggesting that P-linkers promote DNA dsb via specific DNA binding by intercalation of the phenanthrenyl group in the cells to enhance cytotoxicity, but M-linkers do not due to nonspecific binding.
Table 3. Data for the Plot of Expected Enhancement Rates (1X/1) in DNA dsb in HeLa Cells (A) × (C) vs Enhancement Rates (1X/1) in Cytotoxicity against HeLa Cells (B)a.
| complex | (A) enhancement rate (1X/1) in DNA dsb | (B) enhancement rate (1X/1) in cytotoxicity against HeLa cells | (C) enhancement rate (1X/1) in cellular uptake | (A) × (C) |
|---|---|---|---|---|
| 1 | 1 | 1 | 1 | 1 |
| 1P1 | 22 | 30 | 2.4 | 52.8 |
| 1P2 | 11 | 12 | 2.1 | 23.1 |
| 1P3 | 3 | 9.9 | 1.8 | 5.4 |
| 1M1 | 11 | 3.3 | 1.7 | 18.7 |
| 1M2 | 4 | 2.6 | 0.84 | 3.36 |
| 1M3 | 2 | 2.3 | 0.61 | 1.22 |
Enhancement rates (1X/1) in DNA dsb (A) and enhancement rates (1X/1) in cellular uptake (C) are used to estimate (A) × (C).
Figure 3.

Plots of expected enhancement rates in DNA dsb in HeLa cells (A) × (C) shown in Table 3 vs enhancement rates in cytotoxicity against HeLa cells (B) for 1P1–3 (red line) and 1M1–3 (purple line). The slopes of the red and blue lines are 0.44 and 0.053, respectively.
The cytotoxicity of 1X against A549 (lung cancer), WI-38 (lung normal), PK-59 (pancreas cancer), and 2C6 (pancreas normal) is shown by the IC50 data (48 h) in Table 2. IC50 data (48 h) of 1, 1P1, 1P2, and 1P3 against A549 lung cancer cells are 284, 20.9, 23.8, and 71.7 μM, respectively, showing that the cytotoxicity of 1P1–3 against the cancer cells is largely enhanced by P-linkers and by shortening the linker. However, based on IC50 data (48 h) of 215, 218, and 268 μM for 1P1, 1P2, and 1P3 against WI-38 lung normal cells, respectively, the cytotoxicity of 1P1–3 against normal cells is not so greatly enhanced by P-linkers and independent of the linker size. These results show that 1P1–3 exert cancer cell-selective cytotoxicity. Moreover, cancer cell-selective cytotoxicity is evaluated by selectivity factor (SF) = (IC50 of normal cells)/(IC50 of cancer cells) shown in Table 2. SF values of 1P1, 1P2, and 1P3 for A549 lung cancer and WI-38 lung normal cells are 10.3, 9.2, and 3.8, respectively, which are much higher than 2.3–2.1 of 1M1–3 and 2.5 of cisplatin. Thus, 1P1–3 exert cancer cell-selective cytotoxicity, but either 1M1–3 or cisplatin do not. The short P-linker enhances cancer cell-selective cytotoxicity in 1P1–3, but there is no linker size effect in 1M1–3. Similarly, 1P1–3 are cancer cell-selective in cytotoxicity against PK-59 pancreas cancer and 2C6 pancreas normal cells, but 1M1–3 are not (see Table 2). SF values of 1P1 for lung and pancreas cancer and normal cells are 10.3 and 7.7, respectively, showing that 1P1 exerts the highest cancer cell-selective cytotoxicity in 1X. Thus, the short P-linker is the DNA target optimized for cancer cell-selective cytotoxicity.
Cytoplasmic Localization of 1P1–3
To gain some insight into the mechanism of the cancer cell-selective cytotoxicity of 1P1–3, their cytoplasmic localization was examined by means of confocal microscopy. After 1P1–3 (200 μM) were added to HeLa cells in a culture medium and incubated for 1 h, and the cells were treated with Mito Tracker Deep Red (50 nM) as the mitochondrial staining dye, the cytoplasmic localization was observed from the merged image. The confocal microscopic images are shown in Figure 4. The red and blue colors show stained mitochondria and the presence of 1P1–3 in the cell, respectively. The merged image clearly shows that 1P1–3 are localized at mitochondria as shown by the purple color. The image processing using ImageJ shows that 17% of area in mitochondria is occupied by 1P1–3 as shown in Table S6. Moreover, the measurements on confocal microscopy were carried out at 4 and 37 °C as shown in Figure S16. The blue color of 1P1–3 was observed in mitochondria at 4 °C similarly to the fluorescence imaging observed at 37 °C. This suggests that the cellular uptake of 1P1–3 occurs mainly via direct membrane permeation but not via endocytosis. This is consistent with the fact that the cellular uptake of 1P1–3 is promoted by the membrane permeability of the P-linkers as described above. For the intracellular toxicity, direct membrane permeation is more favorable than endocytosis.
Figure 4.

Confocal microscopic images of 1P1–3 (200 μM) in HeLa cells in the dark on 1 h incubation. Bright-field images (A, E, I). Blue fluorescence indicates the fluorescence of 1P1 (B), 1P2 (F), and 1P3 (J) (λex = 405 nm). Red fluorescence is mitochondrial staining by Mito Tracker Deep Red FM (50 nM) (Thermo Fisher) (C, G, K) (λex = 640 nm). (D, H, L) Overlay images of panels (A)–(C), (E)–(G), and (I)–(K), respectively. The scale bar is 20 μm.
Apoptosis Assay
Fluorescence-activated cell sorting was carried out using Annexin V-FITC/PI27 by flow cytometry to determine the mode of cell death. To quantify the apoptotic cells by flow cytometry, 1P1, 1P3, or 1M1–3 (each IC50 value at 24 h) were added to HeLa cells and incubated for 1 and 12 h. Assay was performed using staining solutions of Annexin V-FITC and PI. Dot plots and rates of Q1–Q4 obtained are shown in Figure S17 and Tables S3–S5. As previously reported, in the presence of 1P2, 15.8% of cells were dead in 1 to 12 h incubation, and 85% were early apoptosis.36 In the case of 1P1 and 1P3, 27.1 and 18.8% of cells were dead in 1 to 12 h incubation, where nearly 100 and 89% were early apoptosis. Thus, 1P1–3 cause cell death with high apoptosis induction rates, in which 1P1 exerts the highest cytotoxicity induced by 100% apoptosis. 1M1–3, however, show lower cytotoxicity than 1P1–3 based on the Q1–Q4 rates shown in Table S5.
Caspase Activity Assay
Since 1P1–3 localize at mitochondria to induce apoptotic cell death as described above, caspase activity assays of 1X were carried out for the initiator caspase-937,38 and effector caspase-3/737,38 to clarify whether the apoptosis proceeds via an intrinsic pathway. A Leu-Glu-His-Asp (LEHD) sequence is recognized by the activated caspase-928 as a cleavage site of proteins, and thus, a nontoxic and cell-permeable FITC-LEHD-FMK (FITC-Leu-Glu-His-Asp-fluoromethyl ketone) can be used to evaluate the activity of caspase-9.29 HeLa cells were incubated with 1 or 1X (97.3 μM, IC50 of 1P1 at 24 h) for 1 and 12 h. After that, the cells were separated and washed and incubated with FITC-LEHD-FMK for 30 min. As described in Experimental Section, the caspase-9 activity was measured. Moreover, the CellEvent Caspase-3/7 Green Detection Reagent30 of a peptide sequence Asp-Glu-Val-Asp was used to examine caspase-3/7 activity.39 It emits a strong fluorescence via DNA binding when the sequence is cleaved. Thus, the caspase-3/7 activity is estimated from the fluorescence intensity. The activities of caspase-9 and caspase-3/7 are shown in Figure S18. In incubation for 12 h, 1P1–3 showed higher activity for caspase-9 and caspase-3/7 than 1M1–3, and the activity 1P1 is the highest. Thus, 1P1 efficiently induces mitochondrial apoptosis by the intrinsic pathway.37,40,41 As shown above, 1P1 exerts the highest activity in the DNA dsb with H2O2 and the highest cancer cell-selective cytotoxicity. Therefore, it is proposed that the short P-linker of 1P1 enhances cancer cell-selective cytotoxicity by promoting the dsb of mitochondrial DNA with H2O2 increased by mitochondrial dysfunction in cancer cells. This means that 1P1 induces mitochondrial apoptosis by the dsb of mitochondrial DNA in cancer cells but not in normal cells because of relatively low concentration of H2O2 in normal cells, leading to the cancer cell-selective cytotoxicity.
Comparison in Cancer Cell-Selective Cytotoxicity between 1Pn and a Related Mitochondria-Targeting Copper Complex
A mononuclear copper complex with a terpyridine (ttpy) ligand attaching a tetraphenyl phosphonium (tpp) group as a mitochondrial target [Cu(ttpy-tpp)Br2]Br (14) was reported to exert high cytotoxicity against cancer cells via mitochondrial apoptosis.7e14 exerted cytotoxicity to cancer cells by the oxidative DNA cleavage via ROS generation. The cancer cell-selective cytotoxicity of 14 is attained by high cellular uptake and mitochondrial localization. On the other hand, 1Pn exerted the cancer cell-selective cytotoxicity by activating H2O2 because the H2O2 concentration is slightly higher in cancer cells due to the mitochondrial dysfunction than in normal cells. In fact, 1P1 exerted 10.3-fold higher cytotoxicity against lung cancer cells (A549) than lung normal cells (WI-38). Thus, 1Pn showed promising cancer cell-selectivity, although 1Pn was lower in cytotoxicity than 14. Moreover, the DNA cleavage activity and cytotoxicity of 1Pn are proportionally enhanced by shortening the PEG tether, where the cancer cell-selective cytotoxicity of 1Pn is also enhanced. This clearly shows that the cancer cell-selective cytotoxicity of 1Pn can be controlled by the tether length. Therefore, the cancer cell-selective cytotoxicity of our dicopper complex has a chance to be further enhanced by optimizing the tether length and DNA target in future works.
Conclusions
A series of DNA target/ligand conjugates (HLX, X = Pn and Mn, n = 1–3) and their dicopper complexes [Cu2(μ-OH)(LX)](ClO4)2 (1X) were synthesized. Roles of DNA targets in DNA binding, DNA cleavage, cellular uptake, and cytotoxicity were assessed. Conversion of Form II to III in DNA double-strand breaks (dsb) of 1X was greatly promoted by short linkers fixing a dicopper moiety within a small number of base pairs. The cytotoxicity of 1X was enhanced by P-linkers and by shortening the linker but not by M-linkers. DNA dsb and cytotoxicity are 44% correlated in 1P1–3 but only 5% in 1M1–3. This suggested that P-linkers promote DNA dsb via specific DNA binding in the cells to enhance cytotoxicity, but M-linkers do not due to nonspecific binding. 1P1 exerted the highest cancer cell-selective cytotoxicity in 1X for lung and pancreas cancer and normal cells. Intracellular visualization, apoptosis assay, and caspase activity assay revealed that 1P1–3 induced mitochondrial apoptosis. It is concluded that the short P-linker of 1P1 enhances cancer cell-selective cytotoxicity via mitochondrial apoptosis. This is probably because the short P-linker promotes the dsb of mitochondrial DNA with H2O2 increased by mitochondrial dysfunction in cancer cells. The clarification of roles of the DNA target may shed light on the development of new anticancer agents to reduce the heavy side effects.
Supporting Information Available
The Supporting Information is available free of charge at https://pubs.acs.org/doi/10.1021/acsomega.3c03387.
Detailed experimental procedures, Figures S1–S21, and Tables S1–S6 (PDF)
Author Contributions
M.H. mainly conducted experimental work and contributed to make Schemes and Figures. J.U. worked on measuring conformal microscopic images. Y.H. contributed discussion. The manuscript was written through contributions of all authors. All authors have given approval to the final version of the manuscript.
This work was supported by JSPS KAKENHI grant nos. 22H02097 and 22J10765.
The authors declare no competing financial interest.
Supplementary Material
References
- Boulikas T.; Pantos A.; Bellis E.; Christofis P. Designing platinum compounds in cancer: structures and mechanisms. Cancer Ther. 2007, 5, 537–583. [Google Scholar]
- Ghosh S. Cisplatin: The first metal based anticancer drug. Bioorg. Chem. 2019, 88, 102925 10.1016/j.bioorg.2019.102925. [DOI] [PubMed] [Google Scholar]
- Umezawa H.; Maeda K.; Takeuchi T.; Okami Y. New antibiotics, bleomycin A and B. J. Antibiot. 1966, 19, 200–209. 10.11263/jsotp1982.17.52. [DOI] [PubMed] [Google Scholar]
- Liu L. V.; Bell C. B. III; Wong S. D.; Wilson S. A.; Kwak Y.; Chow M. S.; Zhao J.; Hodgson K. O.; Hedman B.; Solomon E. I. Definition of the intermediates and mechanism of the anticancer drug bleomycin using nuclear resonance vibrational spectroscopy and related methods. Proc. Natl. Acad. Sci. U. S. A. 2010, 107, 22419–22424. 10.1073/pnas.1016323107. [DOI] [PMC free article] [PubMed] [Google Scholar]
- Florea A.-M.; Büsselberg D. Cisplatin as an Anti-Tumor Drug: Cellular Mechanisms of Activity, Drug Resistance and Induces Side Effects. Cancers 2011, 3, 1351–1371. 10.3390/cancers3011351. [DOI] [PMC free article] [PubMed] [Google Scholar]
- Oun R.; Moussa Y. E.; Wheate N. J. The side effects of platinum-based chemotherapy drugs: a review for chemists. Dalton Trans. 2018, 47, 6645–6653. 10.1039/C8DT00838H. [DOI] [PubMed] [Google Scholar]
- a Erkkila K. E.; Odom D. T.; Barton J. K. Recognition and Reaction of Metallointercalators with DNA. Chem. Rev. 1999, 99, 2777–2796. 10.1021/cr9804341. [DOI] [PubMed] [Google Scholar]; b Qiu K.; Chen Y.; Rees T. W.; Ji L.; Chao H. Organelle-targeting metal complexes: From molecular design to bio-applications. Coord. Chem. Rev. 2019, 378, 66–86. 10.1016/j.ccr.2017.10.022. [DOI] [Google Scholar]; c Huang C.; Li T.; Liang J.; Huang H.; Zhang P.; Banerjee S. Recent advances in endoplasmic reticulum targeting metal complexes. Coord. Chem. Rev. 2020, 408, 213178–213192. 10.1016/j.ccr.2020.213178. [DOI] [Google Scholar]; d King A. P.; Wilson J. J. Endoplasmic reticulum stress: an arising target for metal-based anticancer agents. Chem. Soc. Rev. 2020, 49, 8113–8136. 10.1039/D0CS00259C. [DOI] [PubMed] [Google Scholar]; e Zhou W.; Wang X.; Hu M.; Zhua C.; Guo Z. A mitochondrion-targeting copper complex exhibits potent cytotoxicity against cisplatinresistant tumor cells through multiple mechanisms of action. Chem. Sci. 2014, 5, 2761–2770. 10.1039/C4SC00384E. [DOI] [Google Scholar]; f Liu J.; Chen Y.; Li G.; Zhang P.; Jin C.; Zeng L.; Ji L.; Chao H. Ruthenium(II) polypyridyl complexes as mitochondria-targeted two-photon photodynamic anticancer agents. Biomaterials 2015, 56, 140–153. 10.1016/j.biomaterials.2015.04.002. [DOI] [PubMed] [Google Scholar]; g Lv W.; Zhang Z.; Zhang K. Y.; Yang H.; Liu S.; Xu A.; Guo S.; Zhao Q.; Huang W. A Mitochondria-Targeted Photosensitizer Showing Improved Photodynamic Therapy Effects Under Hypoxia. Angew. Chem., Int. Ed. 2016, 55, 9947–9951. 10.1002/anie.201604130. [DOI] [PubMed] [Google Scholar]; h Cao J.-J.; Tan C.-P.; Chen M.-H.; Wu N.; Yao D.-Y.; Liu X.-G.; Liang-Nian Jia L.-N.; Mao Z.-W. Targeting cancer cell metabolism with mitochondria-immobilized phosphorescent cyclometalated iridium(III) complexes. Chem. Sci. 2017, 8, 631–640. 10.1039/C6SC02901A. [DOI] [PMC free article] [PubMed] [Google Scholar]; i Hu D.; Liu Y.; Lai Y.-T.; Tong K.-C.; Fung Y.-M.; Lok C.-N.; Che C.-M. Anticancer Gold(III) Porphyrins Target Mitochondrial Chaperone Hsp60. Angew. Chem., Int. Ed. 2016, 55, 1387–1391. 10.1002/anie.201509612. [DOI] [PubMed] [Google Scholar]
- Deka B.; Sarkar T.; Banerjee S.; Kumar A.; Mukherjee S.; Deka S.; Saikia K. K.; Hussain A. Novel mitochondria targeted copper(II) complexes of ferrocenyl terpyridine and anticancer active 8-hydroxyquinolines showing remarkable cytotoxicity, DNA and protein binding affinity. Dalton Trans. 2017, 46, 396–409. 10.1039/C6DT03660K. [DOI] [PubMed] [Google Scholar]
- Jeena M. T.; Kim S.; Jin S.; Ryu J. H. Recent Progress in Mitochondria-Targeted Drug and Drug-Free Agents for Cancer Therapy. Cancers 2020, 12, 4. 10.3390/cancers12010004. [DOI] [PMC free article] [PubMed] [Google Scholar]
- Fantoni N. Z.; Molphy Z.; O’Carroll S.; Menounou G.; Mitrikas G.; Krokidis M. G.; Chatgilialoglu C.; Colleran J.; Banasiak A.; Clynes M.; Roche S.; Kelly S.; McKee V.; Kellett A. Polypyridyl-Based Copper Phenanthrene Complexes: Combining Stability with Enhanced DNA Recognition. Chem.- Euro. J. 2021, 27, 971–983. 10.1002/chem.202001996. [DOI] [PubMed] [Google Scholar]
- Aykin-Burns N.; Ahmad I. M.; Zhu Y.; Oberley L. W.; Spitz D. R. Increased levels of superoxide and H2O2 mediate the differential susceptibility of cancer cells versus normal cells to glucose deprivation. Biochem. J. 2009, 418, 29–37. 10.1042/BJ20081258. [DOI] [PMC free article] [PubMed] [Google Scholar]
- Nogueira V.; Hay N. Molecular Pathways: Reactive Oxygen Species Homeostasis in Cancer Cells and Implications for Cancer Therapy. Clin. Cancer Res. 2013, 19, 4309–4314. 10.1158/1078-0432.CCR-12-1424. [DOI] [PMC free article] [PubMed] [Google Scholar]
- Lopez J.; Tait S. W. G. Mitochondrial apoptosis: killing cancer using the enemy within. Br. J. Cancer 2015, 112, 957–962. 10.1038/bjc.2015.85. [DOI] [PMC free article] [PubMed] [Google Scholar]
- Burke C. S.; Byrne A.; Keyes T. E. Highly Selective Mitochondrial Targeting by a Ruthenium(II) Peptide Conjugate: Imaging and Photoinduced Damage of Mitochondrial DNA. Angew. Chem., Int. Ed. 2018, 57, 12420–12424. 10.1002/anie.201806002. [DOI] [PubMed] [Google Scholar]
- Santini C.; Pellei M.; Gandin V.; Porchia M.; Tisato F.; Marzano C. Advances in Copper Complexes as Anticancer Agents. Chem. Rev. 2014, 114, 815–862. 10.1021/cr400135x. [DOI] [PubMed] [Google Scholar]
- Rani J. J.; Roy S. Recent Development of Copper (II) Complexes of Polypyridyl Ligands in Chemotherapy and Photodynamic Therapy. ChemMedChem 2023, 18, e202200652 10.1002/cmdc.202200652. [DOI] [PubMed] [Google Scholar]
- Kadoya Y.; Fukui K.; Hata M.; Miyano R.; Hitomi Y.; Yanagisawa S.; Kubo M.; Kodera M. Oxidative DNA Cleavage, Formation of μ-1,1-Hydroperoxo Species, and Cytotoxicity of Dicopper(II) Complex Supported by a p-Cresol-Derived Amide-Tether Ligand. Inorg. Chem. 2019, 58, 14294–14298. 10.1021/acs.inorgchem.9b02093. [DOI] [PubMed] [Google Scholar]
- Hata M.; Saito I.; Kadoya Y.; Tanaka Y.; Hitomi A.; Kodera M. Enhancement of cancer-cell-selective cytotoxicity by a dicopper complex with a phenanthrene amide-tether ligand conjugate via mitochondrial apoptosis. Dalton Trans. 2022, 51, 4720–4727. 10.1039/D1DT02868E. [DOI] [PubMed] [Google Scholar]
- Kadoya Y.; Hata M.; Tanaka Y.; Hirohata A.; Hitomi A.; Kodera M. Dicopper(II) Complexes of p-Cresol-2,6-Bis(dpa) Amide-Tether Ligands: Large Enhancement of Oxidative DNA Cleavage, Cytotoxicity, and Mechanistic Insight by Intracellular Visualization. Inorg. Chem. 2021, 60, 5474–5482. 10.1021/acs.inorgchem.0c02954. [DOI] [PubMed] [Google Scholar]
- Tran F.; Odell A. V.; Ward G. E.; Westwood N. J. A Modular Approach to Triazole-Containing Chemical Inducers of Dimerisation for Yeast Three-Hybrid Screening. Molecules 2013, 18, 11639–11657. 10.3390/molecules180911639. [DOI] [PMC free article] [PubMed] [Google Scholar]
- a Baguley B. C.; Falkenhaug E. M. The interaction of ethidium with synthetic double-stranded polynucleotides at low ionic strength. Nucleic Acids Res. 1978, 5, 161–171. 10.1093/nar/5.1.161. [DOI] [PMC free article] [PubMed] [Google Scholar]; b Morgan A. R.; Lee J. S.; Pulleyblank D. E.; Murray N. L.; Evans D. H. Review: Ethidium fluorescence assays. Part1. Physicochemical studies. Nucleic Acids Res. 1979, 7, 547–565. 10.1093/nar/7.3.547. [DOI] [PMC free article] [PubMed] [Google Scholar]
- Ropel L.; Belvèze L. S.; Aki S. N. V. K.; Stadtherr M. A.; Brennecke J. F. Octanol–water partition coefficients of imidazolium-based ionic liquids. Green Chem. 2005, 7, 83–90. 10.1039/B410891D. [DOI] [Google Scholar]
- Scherließ R. The MTT assay as tool to evaluate and compare excipient toxicity in vitro on respiratory epithelial cells. Int. J. Pharm. 2011, 411, 98–105. 10.1016/j.ijpharm.2011.03.053. [DOI] [PubMed] [Google Scholar]
- van Meerloo J.; Kaspers G. J. L.; Cloos J. Cell Sensitivity Assays: The MTT Assay. Cancer Cells Cult. 2011, 411, 237–245. 10.1007/978-1-61779-080-5_20. [DOI] [PubMed] [Google Scholar]
- Bahuguna A.; Khan I.; Bajpai V. K.; Kang S. C. MTT assay to evaluate the cytotoxic potential of a drug. Bangladesh J Pharmacol. 2017, 12, 115–118. [Google Scholar]
- Miao W.; Guo X.; Yan X.; Shang Y.; Yu C.; Dai E.; Jiang T.; Hao E.; Jiao L. Red-to-Near-Infrared Emitting Pyrrolyl BODIPY Dyes: Synthesis, Photophysical Properties and Bioimaging Application. Chem. – Eur. J. 2023, 29, e202203832 10.1002/chem.202203832. [DOI] [PubMed] [Google Scholar]
- Vermes I.; Haanenand C.; Reutelingsperger C. P. M. A novel assay for apoptosis: Flow cytometric detection of phosphatidylserine expression on early apoptotic ceIls using fluorescein labelled annexin V. J. Immunol. Methods 1995, 180, 39–51. 10.1016/0022-1759(95)00072-I. [DOI] [PubMed] [Google Scholar]
- Ozoren N.; Kim K.; Burns T. F.; Dicker D. T.; Moscioni A. D.; El-Deiry W. S. The Caspase 9 Inhibitor Z-LEHD-FMK Protects Human Liver Cells while Permitting Death of Cancer Cells Exposed to Tumor Necrosis Factor-related Apoptosis-inducing Ligand. Cancer Res. 2000, 60, 6259–6265. [PubMed] [Google Scholar]
- Yu T.; Dohl J.; Elenberg F.; Chen Y.; Deuster P. Curcumin induces concentration-dependent alterations in mitochondrial function through ROS in C2C12 mouse myoblasts. J. Cell. Physiol. 2019, 234, 6371–6381. 10.1002/jcp.27370. [DOI] [PubMed] [Google Scholar]
- Tan W. S. D.; Liao W.; Peh H. Y.; Vila M.; Dong J.; Shen H. M.; Wong W. S. F. Andrographolide simultaneously augments Nrf2 antioxidant defense and facilitates autophagic flux blockade in cigarette smoke-exposed human bronchial epithelial cells. Toxicol. Appl. Pharmacol. 2018, 360, 120–130. 10.1016/j.taap.2018.10.005. [DOI] [PubMed] [Google Scholar]
- Kodera M.; Kadoya Y.; Aso K.; Fukui K.; Nomura A.; Hitomi Y.; Kitagishi H. Acceleration of Hydrolytic DNA Cleavage by Dicopper(II) Complexes with p-Cresol-Derived Dinucleating Ligands at Slightly Acidic pH and Mechanistic Insights. Bull. Chem. Soc. Jpn. 2019, 92, 739–747. 10.1246/bcsj.20180353. [DOI] [Google Scholar]
- a Rey N. A.; Neves A.; Bortoluzzi A. J.; Pich C. T.; Terenzi H. Catalytic Promiscuity in Biomimetic Systems: Catecholase-like Activity, Phosphatase-like Activity, and Hydrolytic DNA Cleavage Promoted by a New Dicopper(II) Hydroxo-Bridged Complex. Inorg. Chem. 2007, 46, 348–350. 10.1021/ic0613107. [DOI] [PubMed] [Google Scholar]; b Amudha P.; Kandaswamy M.; Govindasamy L.; Velmurugan D. Synthesis and Characterization of New Symmetrical Binucleating Ligands and Their μ-Phenoxo-Bridged Bicopper(II) Complexes: Structural, Electrochemical, and Magnetic Studies. Inorg. Chem. 1998, 37, 4486–4492. 10.1021/ic9714955. [DOI] [PubMed] [Google Scholar]
- Tjioe L.; Joshi T.; Forsyth C. M.; Moubaraki B.; Murray K. S.; Brugger J.; Graham B.; Spiccia L. Phosphodiester Cleavage Properties of Copper(II) Complexes of 1,4,7-Triazacy-clononane Ligands Bearing Single Alkyl Guanidine Pendants. Inorg. Chem. 2012, 51, 939–953. 10.1021/ic2019814. [DOI] [PubMed] [Google Scholar]
- Freifelder D.; Trumbo B. Matching of single-strand breaks to form double-strand breaks in DNA. Biopolymers 1969, 7, 681. 10.1002/bip.1969.360070506. [DOI] [Google Scholar]
- Wang H.; Wang B.; Wang M.; Zheng L.; Chen H.; Chai Z.; Zhao Y.; Feng W. Time-resolved ICP-MS Analysis of Mineral Element Contents and Distribution Patterns in Single Cells. Analyst 2015, 140, 523–531. 10.1039/C4AN01610F. [DOI] [PubMed] [Google Scholar]
- Martin S. J.; Reutelingsperger C. P.; McGahon A. J.; Rader J. A.; van Schie R. C.; LaFace D. M.; Green D. R. Early redistribution of plasma membrane phosphatidylserine is a general feature of apoptosis regardless of the initiating stimulus. Inhibition by overexpression of Bcl-2 and Abl. J. Exp. Med. 1995, 182, 1545–1556. 10.1084/jem.182.5.1545. [DOI] [PMC free article] [PubMed] [Google Scholar]
- Bratton S. B.; Salvesen G. S. Regulation of the Apaf-1–caspase-9 apoptosome. J. Cell Sci. 2010, 123, 3209–3214. 10.1242/jcs.073643. [DOI] [PMC free article] [PubMed] [Google Scholar]
- Harrington H. A.; Ho K. L.; Ghosh S.; Tung K. C. Construction and analysis of a modular model of caspase activation in apoptosis. Theor. Biol. Med. Modell. 2008, 5, 26–40. 10.1186/1742-4682-5-26. [DOI] [PMC free article] [PubMed] [Google Scholar]
- Barut S.; Unlu Y. A.; Karaoglan A.; Tuncdemir M.; Dagistanli F. K.; Oztqrk M.; Colak A. The neuroprotective effects of z-DEVD.fmk, a caspase-3 inhibitor,on traumatic spinal cord injury in rats. Surg. Neurol. 2005, 64, 213–220. 10.1016/j.surneu.2005.03.042. [DOI] [PubMed] [Google Scholar]
- Mayer B.; Oberbauer R. Mitochondrial Regulation of Apoptosis. Physiol. 2003, 18, 89–94. 10.1152/nips.01433.2002. [DOI] [PubMed] [Google Scholar]
- Galluzzi L.; Kepp O.; Kroemer G. Mitochondria: master regulators of danger signalling. Nat. Rev. Mol. Cell Biol. 2012, 13, 780–788. 10.1038/nrm3479. [DOI] [PubMed] [Google Scholar]
Associated Data
This section collects any data citations, data availability statements, or supplementary materials included in this article.