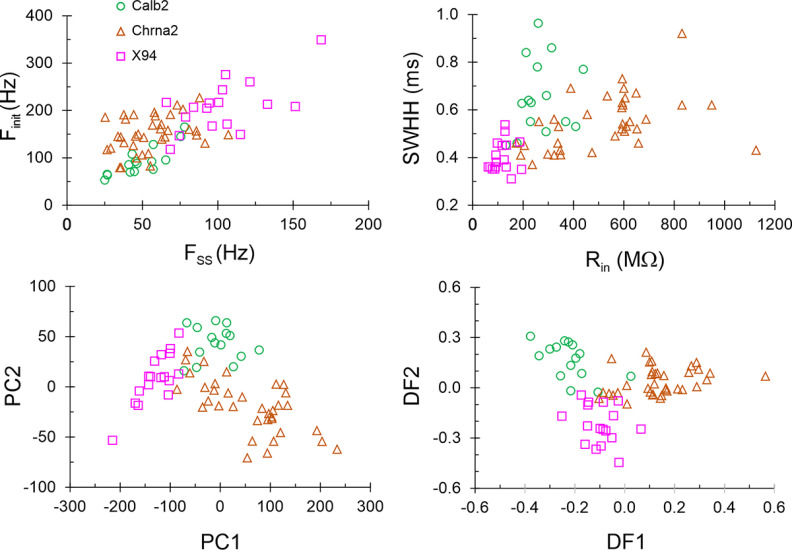
Figure 9.
Multivariate analysis of electrophysiological properties in 3 genetically defined SOM subtypes. Top left, Plot of initial firing frequency versus steady-state frequency; top right, spike width at half-height versus input resistance; bottom left, the second principal component versus the first; bottom right, the second discriminant function versus the first. The full dataset of electrophysiological parameters is provided in Extended Data Figure 9-1.

