Abstract
Sleep is not homogenous but contains a highly diverse microstructural composition influenced by neuromodulators. Prior methods used to measure neuromodulator levels in vivo have been limited by low time resolution or technical difficulties in achieving recordings in a freely moving setting, which is essential for natural sleep. In this protocol, we demonstrate the combination of electroencephalographic (EEG)/electromyographic (EMG) recordings with fiber photometric measurements of fluorescent biosensors for neuromodulators in freely moving mice. This allows for real-time assessment of extracellular neuromodulator levels during distinct phases of sleep with a high temporal resolution.
Keywords: Fluorescence, Biosensors, Fiber photometry, EEG, Sleep, Noradrenaline, Locus coeruleus
Background
In comparison to neurotransmitters such as glutamate and GABA, neuromodulators—norepinephrine, dopamine, serotonin, etc.—exhibit a slower and longer-ranging diffuse form of transmission, typically propagated by the activation of metabotropic G protein–coupled receptors (GPCRs). Until recently, electrochemical and microdialysis-based approaches (Shouse et al., 2000; Léna et al., 2005; Park et al., 2011) were the golden standard in the measurement of neuromodulator levels. However, technical and temporal constraints associated with these techniques prohibited the estimation of faster neuromodulator dynamics in freely moving mice. These constraints were recently eliminated by the development of novel fluorescent biosensors, which allow for specific and sensitive measurements of diverse neuromodulators with a high temporal resolution by employing the corresponding GPCRs as the sensing module. This permits inference about causal relationships between neuromodulators and behavioral and biological phenomena.
More specifically, the biosensors are based on the insertion of a perturbed fluorescent protein on the neuromodulator-specific GPCR, which, upon binding of the corresponding neuromodulator, generates an increase in fluorescence (Patriarchi et al., 2018; Sun et al., 2018; Feng et al., 2019). Fiber photometry utilizes this increase in fluorescence to detect neuromodulator levels in freely moving mice. Chronic implantation of an optical fiber in the brain region where the biosensor is expressed allows for the simultaneous delivery of excitation light and collection of fluorescence emission, thus enabling the real-time imaging of neuromodulator levels. This creates the unprecedented opportunity to study fast neuromodulator responses across natural stress-free behaviors such as sleep–wake transitions.
In addition, the combination of biosensor measurements with the use of fluorescent calcium indicators allows for the correlation of the calcium activity of the neuronal population releasing the neuromodulator of interest with the extracellular neuromodulator levels, a method that we and others recently implemented for the study of the locus coeruleus-norepinephrine (LC-NE) system during sleep (Osorio-Forero et al., 2021; Antila et al., 2022; Kjaerby et al., 2022). Furthermore, by combining electroencephalographic (EEG)/electromyographic (EMG) recording measurements with fiber photometric measurements, we were able to assess LC-NE dynamics during sleep and uncover the underlying intrinsic relationship of the LC-NE system, sleep micro-architecture, and memory performance. Finally, apart from their biological significance, these distinct features of norepinephrine signaling during sleep show unique potential as new sleep scoring markers for the refined classification of sleep into wake, micro-arousals, NREM, and REM sleep.
Biosensors not only allow us to assess the relative changes in neuromodulator dynamics during sleep and wake behaviors but also to compare upregulating or downregulating treatment effects. However, to assess the absolute levels of neuromodulators, microdialysis still constitutes the most precise technique, since the delivery and expression of biosensor constructs as well as the placement of the fibers greatly impact the measurement of raw fluorescence levels. For this reason, the raw fluorescence signal is normalized according to a control isosbestic channel, thus allowing for measurements of only relative fluctuations. Importantly, it should also be noted that fluorescent indicators can be subject to tissue artifacts such as pH changes (Bizzarri et al., 2009; Remington, 2011) and hemoglobin levels (Zhang et al., 2022) that affect fluorescence levels. This observation is particularly relevant in the study of sleep and especially during REM sleep (Kjaerby et al., 2022), when marked vasodilation occurs (Turner et al., 2020 and 2023; Bojarskaite et al., 2022) alongside predicted quenching of fluorescence. Therefore, measurement of Ca2+ independent fluorescence by the use of the isosbestic point of the fluorescent indicator or simultaneous imaging of an inert red fluorescent marker (Zhang et al., 2022) is necessary for the removal of these artifacts.
Materials and reagents
-
Electrode preparation for EEG and EMG
Breakaway female header pins (SWISS MACHINE PIN, Let Elektronik, Sparkfun electronics, catalog number: PRT-00743)
EEG screw electrodes (prefabricated low-impedance EEG screw electrodes from NeuroTek, ~0.8 mm OD, with a length of 2–3 mm)
EMG wire on roll, Teflon-coated stainless-steel wire (W3 Wire International, catalog number: W3 632)
Lead-free soldering tin wire (Goobay, catalog number: 40844)
Super glue (e.g., Loctite Super Glue Power Flex)
Glue accelerator, Insta-Set Super Glue Accelerator (Bob Smith Industrie, catalog number: BSI-152)
6-channel cable with open-ended connection (PlasticsOne, catalog number: 363-000)
Metal braided cable sleeving, tinned copper, 6 mm diameter (CableOrganizer, catalog number: MBN0.25-10FT)
Surgical tape, 2.5 cm (3M, Micropore tape, catalog number: B10428996)
-
Surgery
Adult mouse (C57BL/6J, 7–9 weeks old)
Preoperative analgesia (e.g., buprenorphine; working concentration: 0.01 mg/mL)
Local anesthetic (e.g., lidocaine; working concentration: 0.2 mg/mL)
Post operative analgesia (e.g., carprofen; working concentration: 1 mg/mL)
Isoflurane (Attane vet®, Piramal, 1,000 mg/g)
Shaver, Aesculap Isis rodent shaver (Agnthos, catalog number: GT421)
70% ethanol (EtOH)
Distilled water
10% iodine solution
1 ml syringes (Chirana T. InjectaM, catalog number: CHINS01)
30 G × 12 mm needles (Sterican®, B Braun, catalog number: 4656300)
Cotton swabs (Th. Geyer, catalog number: 6085021)
Disposable wipes KIMTECH® (VWR, catalog number: 115-2221)
Eye drops (e.g., Ophtha Neutral eye gel)
Surgical marker pen (e.g., Universal Surgical Skin Marking Pen Fine, Premier HH Ltd., catalog number: PEN002)
Biosensor virus (e.g., BrainVTA, WZ Biosciences, Addgene, titer 1012 gc/mL)
Parafilm (Sigma-Aldrich, catalog number: P7793-1EA)
EEG/EMG electrodes (see section A)
Mono optic fiber implant (400 μm core, NA = 0.48, receptacle: MF2.5, Doric Lenses)
Super-Bond C&B Dental cement (Generique International, catalog numbers: 7110, 7111-100, T060E)
Super-Bond C&B Green Activator (Prestige Dental, catalog number: 7115-100)
-
Recording
White bedding, ALPHA-dri Dust free (LBS Biotechnology, catalog number: 1032003)
White nesting, soft paper wool (LBS Biotechnology, catalog number: 1034007)
Wooden stick, food pellets, water bottle
Plastic cylinder, Plexiglas, H 40 cm × Ø 30 cm
Fiber-optic patch cord (400 μm core, NA = 0.48, 1.5 m, Doric Lenses)
Zirconia sleeves (Ø 2.5 mm)
EEG/EMG patch cords (see section A)
Equipment
The list below describes equipment that we use but that can be replaced with equivalent models.
-
Electrode preparation for EEG and EMG
Forceps (e.g., Agnthos, Fine Graefe Titanium, catalog number: 11650-10)
Side-cutting pliers (e.g., Stanley, catalog number: 84-079)
End-cutting pliers (e.g., Stanley, catalog number: 84-079)
Soldering clamp stand
Soldering iron (Weller, WE1010 Soldering station, 70 W, 100–450 °C, LCD, ESD, catalog number: H42077)
Multimeter (e.g., XL830L Digital Multimeter)
Scalpel
Microscope (e.g., Olympus, SZ61)
Fine scissors (e.g., Agnthos, catalog number: 14184-09)
-
Surgery
Flow table
Surgery microscope (e.g., Nikon SMZ745T)
Isoflurane high-flow vaporizer with induction chamber (Kent Scientific, catalog numbers: VetFlo-1205S and VetFlo-0530SM)
Stereotactic frame with nose cone (RWD, catalog number: 68025)
Gooseneck lights (VWR, catalog number: 631-1755)
Heating pads: small surgical pad, big recovery pad (Stoelting, catalog numbers: 53850, 53850M, and 53850C)
Surgery tools: blunt forceps (Fine Science Tools, catalog number: 11002-12), fine scissors (Fine Science Tools, catalog number: 14084-08), fine angled forceps (Fine Science Tools, catalog number: 11251-35)
Screwdriver for EEG screws
Electric drill with drill tip, size 005 (Kopf Instruments, model: 1474)
Stereotaxic drill holder (Kopf Instruments, holder included with the drill model: 1474)
Hamilton 10 μL syringe (World Precision Instruments, catalog number: NANOFIL)
NanoFil 35 G bevel needle tip (World Precision Instruments, catalog number: NF35BV-2)
Microinjection syringe pump (World Precision Instruments, catalog number: UMP3T-1)
Pipette 2 μL (Rainin, catalog number: 17014393) and tips (Gilson, catalog number: F171100)
Holder for the optic fiber implant (RWD, catalog number: 68210)
Timer
Recovery cage
-
Recording
Insulated recording chambers (ViewPoint Behavior Technology)
16-channel AC amplifier (National Instruments, model: 3500)
Multifunction I/O DAQ device (National Instruments, model: USB-6343)
Fiber photometry system: RZ10-X Lux-I/O Processor (Tucker Davis Technologies) with integrated LED drivers, integrated excitation LEDs (405, 465, and 560 nm, LUX LEDs, Tucker Davis Technologies, Lx405, Lx465, and Lx560 respectively) and integrated LUX photosensors (Tucker Davis Technologies, LxPS1)
Digital handheld optical power meter (Thorlabs, model: PM100D)
Four-port Minicubes [Doric, Ordering code: ilFMC4-G2_IE(400-410)_E(460-490)_F(500-550)_S] per animal
Software
Synapse (Tucker-Davis Technologies)
Sleepscore (ViewPoint Behavior Technology)
MATLAB (Mathworks)
Procedure
The procedures below describe how we perform the experiments, but researchers should feel free to adjust these according to their needs and local guidelines.
-
Electrode and patch cord preparation for EEG and EMG
Turn on the soldering iron and heat it up to 450 °C.
Clean the tip of the soldering iron with a brass sponge from the soldering station.
Break off the breakaway female header pins in the amount and size you need. Here, we use two pins per electrode (Figure 1A).
Use the end cutting pliers to cut the tips off the female header pins to allow for a wider contact surface for soldering (Figure 1B).
-
Prepare EEG electrode:
Take out the number of prefabricated EEG screws you need for EEG electrodes and check that the wire is properly attached to each screw by pulling lightly on it before using them.
Cut the wire approximately 1 cm from the screw (Figure 1D).
Uncoat the tip (~1 mm) of the cut wire using a scalpel or a side-cutting plier to remove the insulation and check that the tip is properly exposed under the microscope.
Use a clamp to fixate an unused row of female headers. This will create a holder for the newly cut female header pins (Figure 2).
Stick your cut pins onto the holder.
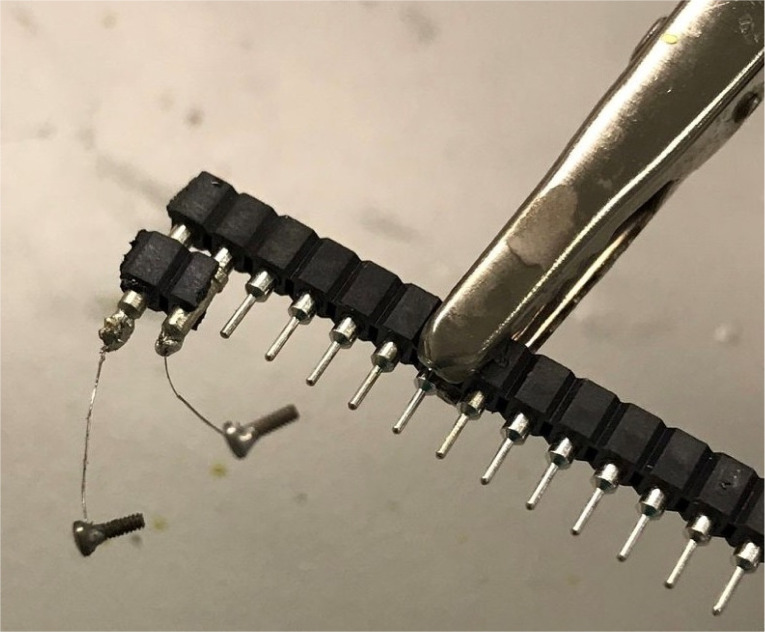
Using forceps, hold the uncoated wire tip against the male pin and, with the other hand, use the heated soldering iron tip to transfer a small droplet of solder tin to the male pin, to solder the EEG wire to the pin.
Let the solder material harden before you let go of the wire. You can blow lightly on the solder material to make it harden faster and check that soldering was successful by pulling gently on the wire.
Repeat steps A1f–A1g for the other screw and be careful such that the soldering material does not connect to the first pin.
When both pins have EEG screws attached, remove the electrode from the holder.
-
Check the conductance from each screw to their respective female plug using a multimeter. The multimeter can also be used to check if the two pins have been short-circuited.
Note: If there is no conductance, redo the soldering and test it again.
When the electrode is working, use the super glue to insulate the electrode. Cover all metal parts with a thin layer of glue as shown in Figure 3.
Apply the glue accelerator to dry the glue. The accelerator can be applied with a cotton swab or a plastic one-time-use pipette. Let electrodes dry before packing them away.
-
Prepare EMG electrode:
Cut EMG wire into approximately 1 cm long pieces (Figure 1C). You will need two pieces per electrode.
Uncoat ~1 mm in both ends of each EMG wire as described in step A5c to remove insulation.
Attach the two EMG wires to each pair of female header pins as described in steps A5d–A5i.
Check the conductance from each EMG wire tip to their respective female plugs using the multimeter, and redo if there is no connection.
When the electrode is working, cover the soldered area with glue as described in steps A5k–A5l (Figure 3).
-
Prepare EEG/EMG patch cord:
Shorten the 6-channel cable to a length appropriate for your EEG setup by cutting the end with no connector. The wire should be just long enough to reach all corners of the chamber.
Cut a ~15 cm piece of the metal braided sleeve and pull it over the 6-channel cable. Secure the ends of the cut sleeve with surgical tape to prevent it from unwinding.
Remove ~30 cm of outer insulation (the thick clear plastic sleeve) from the 6-channel cable at the end with no connector using a fine scissor. This will expose the six colored cords within. Be careful not to cut the colored cords in the process.
Untwine the colored cords and cut away the strengthening yarn.
Check that all the cords are of equal length, trim them if necessary, and uncoat ~2 mm of each colored cord.
Break off two pairs of breakaway female headers and leave the male pins intact, since these will serve as connectors to the electrodes.
Work out which channels will be used for EMG, EEG, and reference, and pair the cords accordingly. This will depend on the EEG setup and software settings.
Solder the pair of EMG cords to the female ends of a breakaway female header pair and do the same for the pair of EEG cords. The two unused channels can either be left open ended or soldered to another pair of breakaway female headers.
Check the conductance from each breakaway female header pin to their respective pin on the 6-channel cable connector. If there is no conductance, redo the soldering and test it again.
Cover the soldered connections with glue as described in steps A5k–A5l.
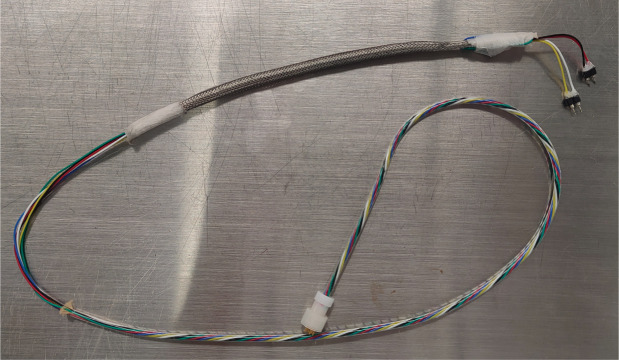
Slide the metal braided sleeve down to the electrode connectors and secure it with surgical tape ~2 cm from the electrode connectors. The unused cords can be taped against the outside of the sleeve (Figure 4).
-
Surgery
-
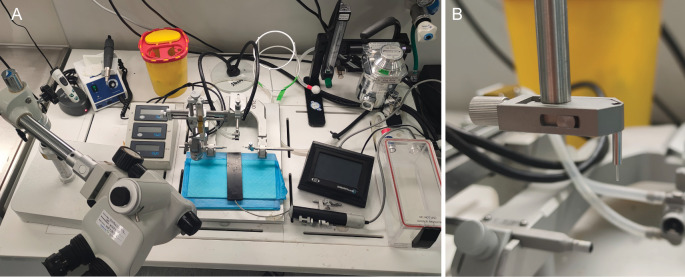
Turn on all equipment (Figure 5A). Set both heating pads to 37.2 °C. Disinfect surgical table and tools with ethanol. Prepare analgesic and local anesthetic solutions (buprenorphine, lidocaine, and carprofen). Wrap the small heating pad with KIMTECH® wipes in a single layer to make sure heat can travel from the pad to the mouse.
Note: If proposed analgesic and local anesthetic solutions do not comply with your laboratory and state regulations, use the compliant ones.
-
Place the mouse in the isoflurane induction chamber and anesthetize the mouse with 5% isoflurane.
Note: The mouse should be deeply anesthetized, as apparent by a deep breathing pattern.
Once the mouse is anesthetized, apply clean air to the induction chamber to remove isoflurane before opening the chamber. Transfer the mouse to the stereotactic frame and secure its head with a nose cone. Ensure the tongue is sticking out of the mouth before fastening the nose cone.
-
Lower the isoflurane to support anesthesia and administer preoperative analgesia subcutaneously (e.g., buprenorphine dose: 0.05 mg/kg). Make sure the stereotactic frame is placed on a surface with appropriate ventilation to reduce any risk of exposure to isoflurane for the experimenter.
Note: Monitor the breathing pattern of the mouse (~55–65 breaths per minute, no gasping) every 15th min during surgery and adjust isoflurane accordingly.
Apply eye drops and re-apply whenever necessary to keep eyes moist at all times during surgery.
-
Prepare surgical field.
Shave the mouse’s head (pay attention not to cut whiskers) and secure the ear bars.
Disinfect the shaved skin three times, alternating between iodine and 70% EtOH using cotton swabs. Be careful to go from the center and out.
Inject local anesthetic (e.g., lidocaine) subcutaneously at incision site and check reflexes using toe pinch.
Using blunt forceps, touch the scalp to make sure that it is properly fixed.
Remove a small piece of skin from the scalp using forceps and scissors so the scalp is exposed and ensure both bregma and lambda can be seen (Figure 6).
Soak the cotton swab in ethanol and wipe the skull to move the skin to the sides and dry up the skull.
Apply Green Activator to the skull with a cotton tip for better adherence of the subsequently used dental cement.
-
Align the skull for precise injection and implantation.
Mark up bregma and lambda with a surgical marker pen according to guidelines in your reference atlas (Paxinos and Franklin, 2001) (Figure 6).
Roughly align the head by eyesight.
-
Fix the electric drill and use the drill tip to guide the precise alignment of the skull. Bregma and lambda should display no more than 0.05 mm differences in height (dorsoventral, D/V coordinates). Mediolateral coordinates ± 2 mm from bregma should be aligned to display no more than 0.05 mm height differences (Figure 6).
Note: Always loosen the nose cone before adjusting the head and remember to fasten again when done.
-
Proceed with drilling holes for the optic fiber implant and EEG electrode.
Optic fiber implant hole: using a drill holder, move the drill tip to bregma and zero before moving to the coordinate of interest and make a hole with the drill. After drilling, carefully probe the hole with a needle to ensure the hole was made, to avoid bending the NanoFil needle upon injection.
EEG electrode hole: plan where in the skull EEG electrodes should be inserted. As a minimum, you need two screws: one for signal recording and one as reference. The reference screw is usually placed over cerebellum, which is electrically neutral. Make sure to place screws so you have room for other implants, e.g., optic fiber implants. Drill one hole for each EEG screw using a drill tip to match the diameter of the EEG screws.
-
Implant EEG and EMG electrodes.
Clean the EEG and EMG electrodes in ethanol and dry them off. If needed, straighten and trim the wire tips of the EMG electrode and remember to leave the tip uncoated. This will ease insertion into the muscle fascia.
-
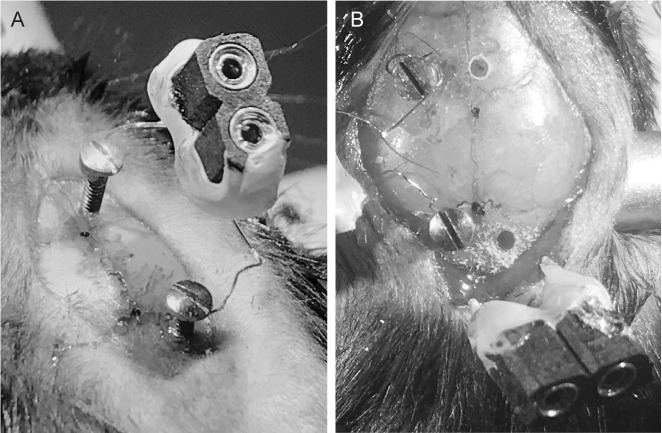
Place the EEG electrode screws in designated holes (Figure 7A).
i. Hold the screw in place using sterilized forceps and screw it in with a small screwdriver without using too much force. Grip the screwdriver closer to its tip for better control. Do the same for all screws and, if necessary, untwine the wire once in a while. The screws are appropriately placed if they cannot be easily moved from their designated holes; at the same time, they should not enter the brain tissue.
ii. Place the EEG electrode connector to the side.
-
Place the EMG electrode in the trapezius muscle (Figure 7B).
i. Hold fine forceps in your dominant hand and blunt forceps in the other hand with the electrode within reach.
ii. Pull out the cut skin at the base of the skull using the blunt forceps, poke a hole in the muscle fascia with the fine forceps, and keep it in place as a guide for the EMG electrode.
iii. Grab one of the wires of the EMG electrode with the blunt forceps and guide it along the fine forceps through the hole in the fascia and into the muscle.
iv. Repeat this with the other wire of the EMG electrode.
-
Inject viral probe using Hamilton micro syringe.
Test if the micro syringe is not clogged by withdrawing/ejecting distilled water from it.
Mount the micro syringe on the holder, place the needle tip at bregma, and zero the coordinates. Place the needle tip over the target coordinate and test if the needle can go through the pre-drilled hole.
Set the infusion rate of the infusion pump to 100 nL/s.
Place a small rectangle of parafilm on top of the skull and put a drop (~1.2 μL) of virus on the parafilm using a pipette (assuming that 300–500 nL of virus will be injected per region).
Replace the default needle on the 10 μL syringe with a 35 G bevel needle tip.
Place the needle above the drop and withdraw 200 nL of air. Check if the plunger is moving.
-
Then, place the needle tip in the drop and withdraw virus (withdraw ~300 nL more than needed for the infusion itself). Using the microscope, ensure the drop on the parafilm is getting smaller during withdrawal. There should be a small volume of virus left on the parafilm after withdrawal is finalized to make sure no air was withdrawn in the end.
Note: If the withdrawal was not successful, infuse everything back onto the parafilm and try again. The needle should be replaced if problems persist.
-
If the withdrawal was successful, remove the parafilm and place the needle above the site of injection. Make a test drop by infusing 50 nL and look at the needle through the microscope to see whether a drop forms at the tip. Keep track of how much virus should be left in the needle.
Note: If there is still no drop formed after the volume of virus needed for injection is reached, infuse everything back onto the parafilm and start over from step B10a.
-
When the test infusion drop is successful, adjust the infusion rate to 100 nL/min and lower the needle to the D/V coordinate. Inject the virus.
Note: Depending on the depth of the target D/V coordinate, you can perform 1–4× injections at different depths (150–200 nL per depth location) to ensure appropriate viral expression. E.g., if you perform three injections, firstly lower the needle to 0.2 mm above the target D/V coordinate and inject one third of the total volume of virus. Repeat this at the target D/V coordinate and 0.2 mm below the target D/V coordinate.
When the last injection is finished, leave the needle in for at least 7 min to allow for diffusion of the virus. Use the timer to keep track of time.
Slowly, pull out the needle and clean the Hamilton at least 10 times with distilled water.
If several optic fiber implants are implanted, make sure all holes (step B8a) and virus injections (step B10) are done before starting any optical implant inserts. In addition, plan out the order of implantations to ensure that bregma is not covered until the last implant is in place.
-
Place an optic fiber implant at the target coordinate.
Replace the micro syringe holder on the stereotax with the holder for the optic fiber implant.
Place an optic fiber in the holder (Figure 5B). Be careful not to touch the fiber tip.
Make sure the skull is completely clean and dry for better adherence to dental cement.
Place the fiber tip at bregma very carefully not to scratch the tip, and zero the coordinates.
-
Go to the target coordinates and insert the fiber slowly into the hole at the desired depth. Make sure that it fits the hole and that no bleeding occurs at insertion.
Note: If bleeding occurs, pause insertion and clean off the blood using a KIMTECH® wipe before continuing.
-
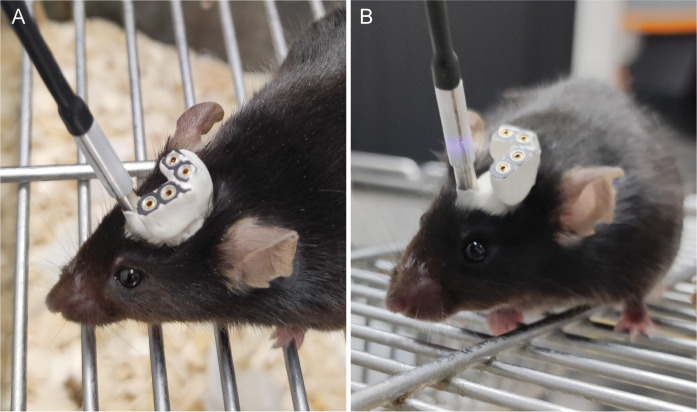
Arrange EEG and EMG connectors before using dental cement for fixation. Ensure optic fiber implant and EEG/EMG connectors are appropriately distanced. See Figure 8 for final result.
Note: It is important to place optic fiber implant and EEG/EMG electrodes in a way that will ensure all of them can be easily plugged in during subsequent behavioral experiments.
-
Mix dental cement as instructed on the package and apply it on the skull starting from the optic fiber implant.
Note: Ensure that approximately 5 mm of the ferrule top of the optic fiber implant is free of cement as this will be used to connect the fiber-optic patch cord.
-
Wait for the cement to harden for approximately 10 min or until it is completely solid before loosening and removing the fiber holder from the stereotax.
Note: If several optic fiber implants are implanted, make sure not to cover bregma with dental cement if needed for zeroing of subsequent implants.
Apply more layers of dental cement as needed to cover the entire skull and EEG and EMG wires and to stabilize all connectors (Figure 8). This requires several rounds of dental cement fabrication. Avoid covering the skin with dental cement and avoid sharp edges.
Administer postoperative analgesia subcutaneously (e.g., carprofen dose: 5 mg/kg) and saline to prevent dehydration and lower the isoflurane to speed up recovery.
When the cement is completely hardened, gently pull the incised skin to cover the edge of the dental cement and turn off isoflurane.
Place the mouse on a heating pad in the recovery cage until the mouse is up and moving around.
After recovery, place the mouse in its home cage. It should be group-housed to avoid stress.
Wet some food pellets and place them in the home cage of the mouse. Remove the grid permanently from the home cage to ensure implants do not get bumped or stuck in the grid. Use the filter top as lid and place food pellets on the bottom of the cage.
Administer postoperative analgesia according to local guidelines in the following days after the surgery.
-
-
Recording
-
Before recordings (three weeks)
Allow 2–3 weeks between surgery and fiber photometry experiments to ensure recovery and adequate virus expression.
Recommended: habituate the mouse to the experimenter. To minimize stress during the experiment, gently handle the mouse for five days before the experiment and practice light scruffing. Avoid tail-lifting mice; instead, scoop them up using hands or a plastic cylinder.
-
One day before recordings
-
Prepare fiber photometry protocol:
i. In the fiber photometry recording software, add channels for the excitation wavelength and the isosbestic point of the fluorescent biosensor of interest. The isosbestic point of the biosensor serves as an autofluorescence detection control and may differ between biosensors. Information on excitation wavelength and isosbestic control can usually be found in the original publication characterizing the biosensor. For the norepinephrine biosensor, we use the 465 nm excitation wavelength and the 405 nm isosbestic point, which are also commonly used for GCaMP constructs.
ii. Modulate each LED at different frequencies that are not multiple of each other or the power line hum (i.e., electrical noise, typically at 50 or 60 Hz). We usually use 211, 330, and 531 Hz.
iii. Using a power meter, measure the wavelength output at the tip of the patch cord and adjust the LED power to get an output within 10–30 μW.
iv. In the fiber photometry recording software, create a channel that generates TTL pulses for alignment of the fiber photometry and EEG/EMG recordings and connect the two setups accordingly.
Note: This may require a custom-made channel in the EEG setup, which the vendor can help you achieve.
Prepare EEG chambers: turn on EEG equipment and add white bedding and nesting material on chamber floor for C57Bl6 mice to increase contrast in video recording. Avoid using excessive nesting material and cut it to approximately 5 cm long strings so that the animal is not entangled or hidden while sleeping. Add food pellets to the floor of the EEG chamber and supply a water bottle through a hole in the cylinder.
-
Test that the virus expression is adequate:
i. Place the mouse on the metal grid of a cage and scruff it very lightly. Attach a zirconia sleeve to the fiber-optic patch cord and connect it to the metal ferrule of the optical implant by sliding the sleeve over the ferrule. Do not push the fiber-optic patch cord on the optical probe but gently place it on by using a screw-on motion instead (Video 1). Check through the slid on the sleeve that the two ferrule ends meet.
ii. Preview the signal in the fiber photometry recording software and make sure that no light is escaping the connection between the fiber-optic patch cord and the optical probe (Figure 9).
iii. Subsequently, place the animal in its home cage and allow it to rest for 5 min.
iv. Following this, perform a swift tail lift or another type of startle: most biosensor signal rises due to the acute stress of the tail lift. If no signal occurs, the animal likely has poor expression of sensor and might not be worth running.
v. Remove the optic fiber (see step C3e below).
Habituate the mouse to EEG chambers and EEG/EMG patch cords over one active phase to ensure natural sleep in the following inactive phase. Connect EEG and EMG patch cords to the corresponding implants, while scruffing the animal lightly. Ensure that the EEG reference patch cord is connected to the screw that was placed over cerebellum.
Check EEG and EMG signals and test that the custom-made TTL channel receives input from the fiber photometry setup.
Bleach the fiber-optic patch cord by turning on the excitation LEDs at maximum power for 2 h. Make sure the animal is disconnected from the patch cord during bleaching.
-
-
On the day of the recordings:
Turn on fiber photometry recording equipment, select protocol, and test light responsivity by holding the tip of the patch cord to a white material to ensure that fluorescence is detected. When testing on white material, all channels should respond. If no signal appears, check that your equipment is appropriately connected and turned on.
Turn on EEG setups and, on the amplifier, select filtering of 0.3HP and 100LP.
Connect the fiber-optic patch cords to corresponding implants as described above (step C2ci) and check that EEG and EMG patch cords are still properly connected after habituation.
Start recording in both EEG/EMG and fiber photometry setups. Remember to start the TTL pulse for the synchronization of the systems (this should be done after recordings are started for both EEG/EMG and fiber photometry). Record during the light phase to ensure natural sleep and consider circadian timing when planning experiments. If no combined EEG/EMG/fiber optic rotary joint is added to the setup, the recording should not exceed 5–6 h as the animal will have limited capacity for rotation.
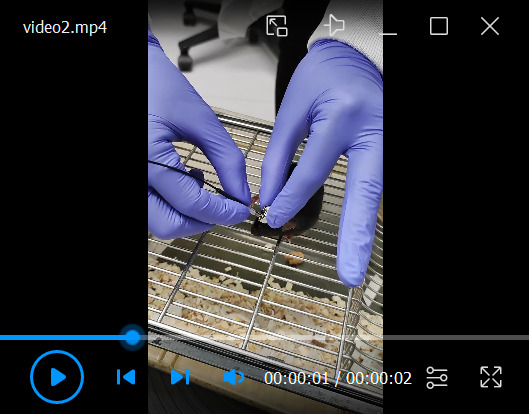
After the recordings are finished, disconnect the patch cords from the animal. Place the animal on the metal grid and remove EEG and EMG patch cords first, followed by the fiber-optic patch cords. There is no need to scruff the animal for this procedure; gently remove patch cords by lightly holding on to the rest of the implants and applying minimal resistance. The fiber-optic patch cord can be removed with a screw-off motion (Video 2).
Place the animal in the home cage and turn off the equipment if no other recordings ensue.
-
Figure 1. Parts for electroencephalographic (EEG) and electromyographic (EMG) fabrication.
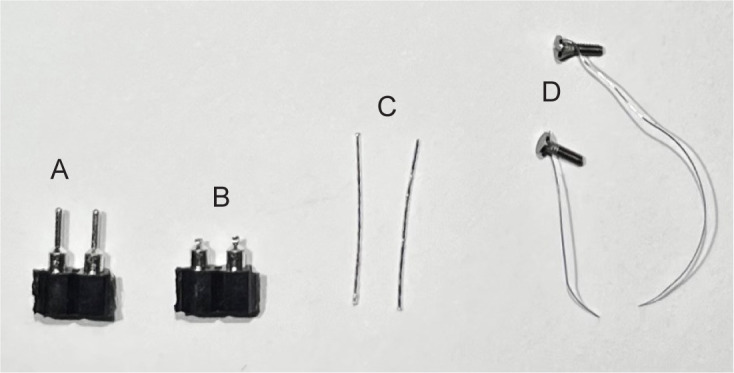
Breakaway female header pins before (A) and after (B) male pins are shortened. C. Two pieces of EMG wire cut to approximately 1 cm. D. Prefabricated EEG screws with attached wire.
Figure 2. Electrode holder.
A row of breakaway female header pins can serve as a holder for the electrode during soldering.
Figure 3. Finished electroencephalographic (EEG) (left) and electromyographic (EMG) (right) electrodes.
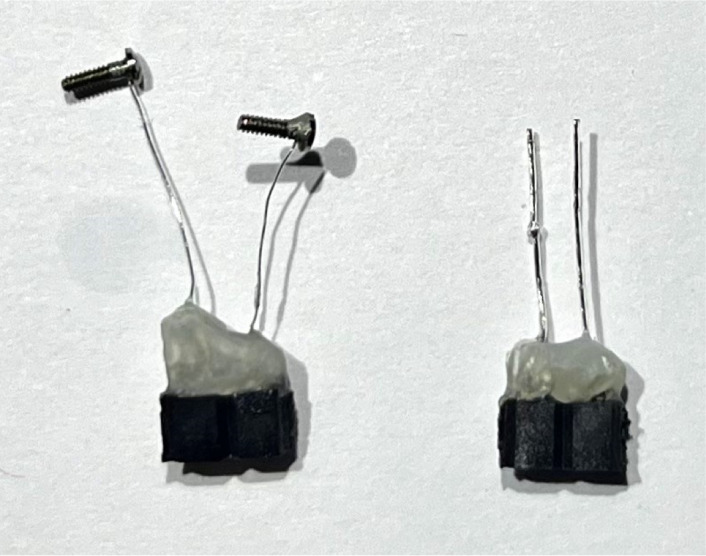
Figure 4. Electroencephalographic (EEG) patch cord.
Patch cord with two connectors for EEG and electromyographic (EMG). The excess wires (here, blue and green) are taped against the metal braided sleeve.
Figure 5. Surgery setup.
A. Equipment placed on the surgery table. Surgery microscope and gooseneck lights are positioned for optimal visibility and flexibility. B. Close-up of implant holder with optical implant clasped.
Figure 6. Skull reference points.
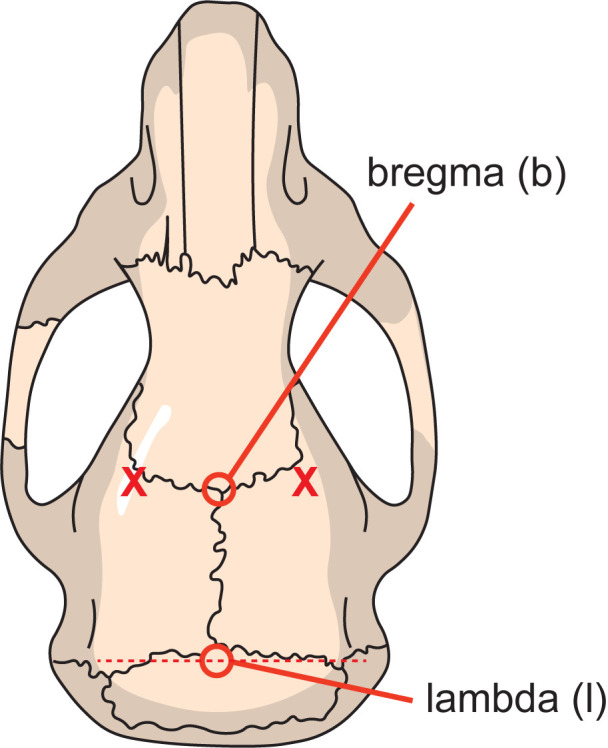
Bregma (b) is located where the sagittal suture meets the coronal suture, and lambda (l) is defined as the point of intersection of tangent lines through the sagittal and lambdoid sutures. 2 mm on either side of bregma (indicated by the two X) is used for sideways alignment of the skull.
Figure 7. Electrode insertion.
Image showing how the surgical field looks after insertion of electroencephalographic (EEG) (A) and electromyographic (EMG) (B) electrodes.
Figure 8. Completed implant.
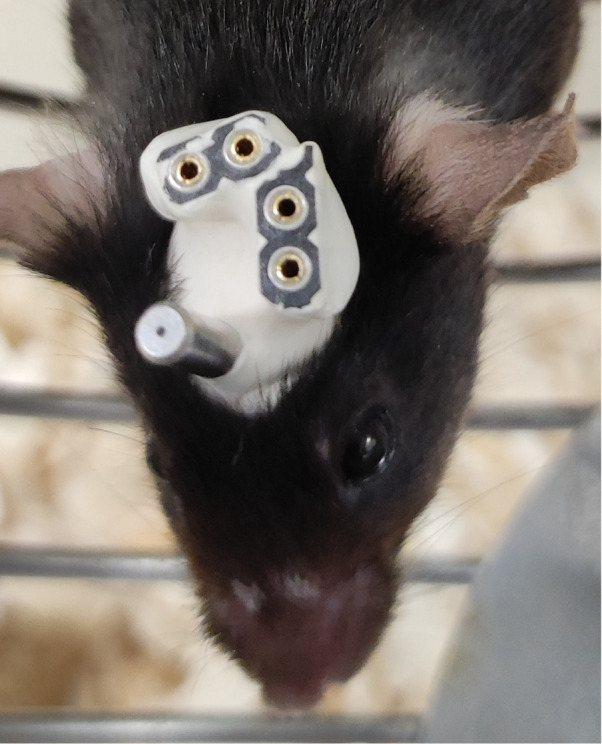
Image shows an example of how the implant looks upon completion.
Video 1. Connecting fiber-optic patch cord.
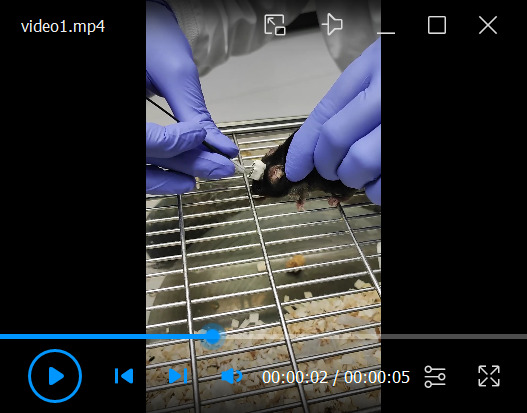
Figure 9. Connecting fiber-optic patch cord.
A. Example of patch cord connected properly with the two metal ferrule ends touching one another. B. Example showing inadequate connection of patch cord revealed by light escaping from the side.
Video 2. Disconnecting fiber-optic patch cord.
Data analysis
-
Sleep scoring
-
Open the EEG and EMG raw data in a scoring software. We use Sleepscore (ViewPoint Behavior Technology), but any equivalent software can be used; preferably a software that allows for:
1-s scoring windows for higher temporal resolution around transitions.
Monitoring simultaneous video recording.
Fast-Fourier Transform (FFT) of the EEG scoring window as an extra visual aid to determine frequency band power.
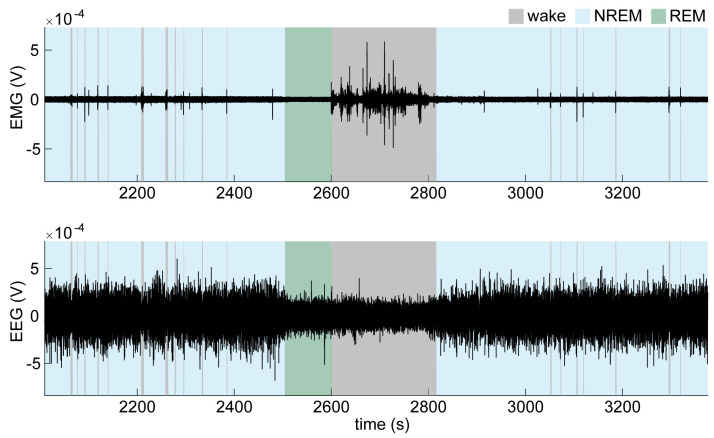
Do an initial quick scoring of the entire recording using a 5 s window. Wakefulness is characterized by high EMG activity and low EEG amplitude (Figure 10). Non-rapid eye movement (NREM) sleep is characterized by low EMG activity and high EEG amplitude, especially dominated by high delta (0.5–4 Hz) power. Rapid eye movement (REM) sleep is characterized by low EMG activity and low EEG amplitude with a relative increase in theta (4–8 Hz) and a decrease in delta activity compared to NREM sleep.
Change the scoring window to 1 s and go through your scoring once more, paying special attention to transitions to score them more precisely. Use the video to help distinguish EMG noise from actual movement to help score short awakenings, which will later be classified as micro-arousals.
Extract the onsets and durations for each state from the scored hypnogram data in a format that can be loaded into MATLAB.
-
-
Fiber photometry analysis and EEG analysis
Extract the fiber photometry data (465 nm channel, 405 nm channel, sampling frequency, and the TTL timestamps), load them into MATLAB, and open the script provided on GitHub (https://github.com/MieAndersen/Bio-Protocol_FibPho_NE) to perform the analysis steps below.
-
Cut fiber photometry traces before the first TTL timestamp for alignment with EEG recording.
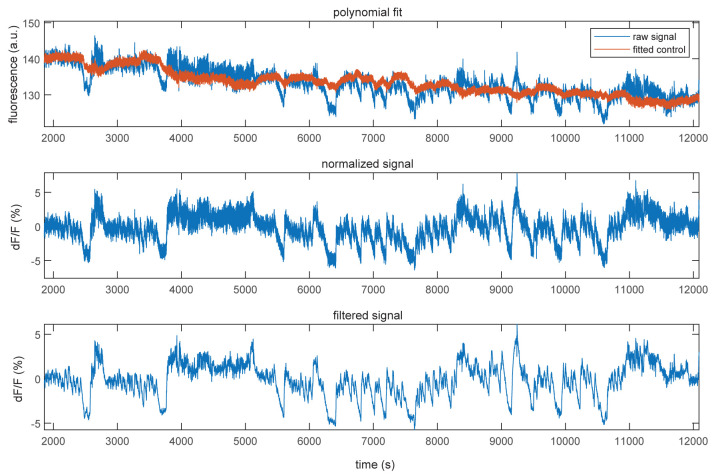
Calculate dF/F of the 465 nm channel: in short, fit the 405 nm signal to the 465 nm signal using a first-degree polynomial fit to remove signal drift present in both signals due to bleaching (Figure 11, top). Calculate dF/F by subtracting the fitted 405 signal from the 465 signal and divide it by the fitted 405 signal (Figure 11, middle). Lastly, filter the dF/F signal using a zero-phase digital filter to remove noise (Figure 11, bottom).
Load the EEG data (EEG channel, EMG channel, sampling frequency, and TTL time stamps) into MATLAB.
Load scored onsets and durations into MATLAB and create binary vectors for each state that will be used for plotting and subsequent alignment with fiber photometry data.
Divide wake bouts into micro-arousals < 15 s and awakening excluding micro-arousals (≥ 15 s).
To align with fiber photometry data, cut the EEG data and scoring before the first TTL pulse sent from the fiber photometry setup and plot scoring and traces to check alignment.
Next, you can extract event-related epoch traces if you are interested in certain events such as state transitions.
Figure 10. Electroencephalographic (EEG) and electromyographic (EMG) traces across brain states.
Example of an EMG trace (top) and EMG trace (bottom) during wake and NREM and REM sleep.
Figure 11. Normalization of fluorescent traces.
Example showing the 405 nm control signal (red) fitted to the raw 465 nm signal (blue, top), the normalized dF/F signal (middle), and the filtered dF/F signal (bottom).
Acknowledgments
The protocol described in this paper was developed in the making of Kjaerby et al. (2022).
Funding: Lundbeck Foundation, R386–2021–165; Independent Research Council Denmark, 7016–00324A; Augustinus Foundation, 16–3735.; Novo Nordisk Foundation, NNF20OC0066419.
We thank Myles Billard and Palle Koch for technical support.
Competing interests
We declare no competing interests.
Citation
Readers should cite both the Bio-protocol article and the original research article where this protocol was used.
Q&A
Post your question about this protocol in Q&A and get help from the authors of the protocol and some of its users.
Ethics considerations
All experiments were approved by the Danish Animal Experiments Inspectorate and were overseen by the University of Copenhagen Institutional Animal Care and Use Committee, in compliance with the European Communities Council Directive of 22 September 2010 (2010/63/EU) legislation governing the protection of animals used for scientific purposes.
References
- 1.Antila H., Kwak I., Choi A., Pisciotti A., Covarrubias I., Baik J., Eisch A., Beier K., Thomas S., Weber F. and Chung S.(2022). A noradrenergic-hypothalamic neural substrate for stress-induced sleep disturbances. Proc Natl Acad Sci U S A 119(45): e2123528119. [DOI] [PMC free article] [PubMed] [Google Scholar]
- 2.Bizzarri R., Serresi M., Luin S. and Beltram F.(2009). Green fluorescent protein based pH indicators for in vivo use: a review. Anal Bioanal Chem 393(4): 1107-1122. [DOI] [PubMed] [Google Scholar]
- 3.Bojarskaite L., Vallet A., Bjørnstad D. M., Binder K. M. G., Cunen C., Heuser K., Kuchta M., Mardal K.-A. and Enger R.(2022). Sleep cycle-dependent vascular dynamics enhance perivascular cerebrospinal fluid flow and solute transport. Nat Commun 14: 953. [DOI] [PMC free article] [PubMed] [Google Scholar]
- 4.Feng J., Zhang C., Lischinsky J. E., Jing M., Zhou J., Wang H., Zhang Y., Dong A., Wu Z., Wu H., et al.(2019). A Genetically Encoded Fluorescent Sensor for Rapid and Specific In Vivo Detection of Norepinephrine. Neuron 102(4): 745-761 e748. [DOI] [PMC free article] [PubMed] [Google Scholar]
- 5.Kjaerby C., Andersen M., Hauglund N., Untiet V., Dall C., Sigurdsson B., Ding F., Feng J., Li Y., Weikop P., Hirase H. and Nedergaard M.(2022). Memory-enhancing properties of sleep depend on the oscillatory amplitude of norepinephrine. Nat Neurosci 25(8): 1059-1070. [DOI] [PMC free article] [PubMed] [Google Scholar]
- 6.Léna I., Parrot S., Deschaux O., Muffat-Joly S., Sauvinet V., Renaud B., Suaud-Chagny M. F. and Gottesmann C.(2005). Variations in extracellular levels of dopamine, noradrenaline, glutamate, and aspartate across the sleep--wake cycle in the medial prefrontal cortex and nucleus accumbens of freely moving rats. J Neurosci Res 81(6): 891-899. [DOI] [PubMed] [Google Scholar]
- 7.Osorio-Forero A., Cardis R., Vantomme G., Guillaume-Gentil A., Katsioudi G., Devenoges C., Fernandez L. M. J. and Lüthi A.(2021). Noradrenergic circuit control of non-REM sleep substates. Curr Biol 31(22): 5009-5023 e5007. [DOI] [PubMed] [Google Scholar]
- 8.Park J., Takmakov P. and Wightman R. M.(2011). In vivo comparison of norepinephrine and dopamine release in rat brain by simultaneous measurements with fast-scan cyclic voltammetry. J Neurochem 119(5): 932-944. [DOI] [PMC free article] [PubMed] [Google Scholar]
- 9.Patriarchi T., Cho J. R., Merten K., Howe M. W., Marley A., Xiong W. H., Folk R. W., Broussard G. J., Liang R., Jang M. J., et al.(2018). Ultrafast neuronal imaging of dopamine dynamics with designed genetically encoded sensors. Science 360(6396): eaat4422. [DOI] [PMC free article] [PubMed] [Google Scholar]
- 10.Paxinos G. and Franklin K. B. J.(2001). The mouse brain in stereotaxic coordinates: hard cover edition.(2nd Edition). Academic Press. [Google Scholar]
- 11.Remington S. J.(2011). Green fluorescent protein: a perspective. Protein Sci 20(9): 1509-1519. [DOI] [PMC free article] [PubMed] [Google Scholar]
- 12.Shouse M. N., Staba R. J., Saquib S. F. and Farber P. R.(2000). Monoamines and sleep: microdialysis findings in pons and amygdala. Brain Res 860(1-2): 181-189. [DOI] [PubMed] [Google Scholar]
- 13.Sun F., Zeng J., Jing M., Zhou J., Feng J., Owen S. F., Luo Y., Li F., Wang H., Yamaguchi T., et al.(2018). A Genetically Encoded Fluorescent Sensor Enables Rapid and Specific Detection of Dopamine in Flies, Fish, and Mice. Cell 174(2): 481-496 e419. [DOI] [PMC free article] [PubMed] [Google Scholar]
- 14.Turner K. L., Gheres K. W. and Drew P. J.(2023). Relating Pupil Diameter and Blinking to Cortical Activity and Hemodynamics across Arousal States. J Neurosci 43(6):949-964. [DOI] [PMC free article] [PubMed] [Google Scholar]
- 15.Turner K. L., Gheres K. W., Proctor E. A. and Drew P. J.(2020). Neurovascular coupling and bilateral connectivity during NREM and REM sleep. Elife 9: e62071. [DOI] [PMC free article] [PubMed] [Google Scholar]
- 16.Zhang W. T., Chao T. H., Yang Y., Wang T. W., Lee S. H., Oyarzabal E. A., Zhou J., Nonneman R., Pegard N. C., Zhu H., et al.(2022). Spectral fiber photometry derives hemoglobin concentration changes for accurate measurement of fluorescent sensor activity. Cell Rep Methods 2(7): 100243. [DOI] [PMC free article] [PubMed] [Google Scholar]


