Abstract
Objectives
To investigate associations between apparent diffusion coefficient (ADC) and cell count, Ki 67, tumor-stroma ratio (TSR), and tumoral lymphocytes in different hepatic malignancies.
Methods
We identified 149 cases with performed liver biopsies: hepatocellular cancer (HCC, n = 53), intrahepatic cholangiocarcinoma (iCC, n = 29), metastases of colorectal cancer (CRC, n = 24), metastases of breast cancer (BC, n = 28), and metastases of pancreatic cancer (PC, n = 15). MRI was performed on a 1.5-T scanner with an axial echo-planar sequence. MRI was done before biopsy. Biopsy images of target lesions were selected. The cylindrical region of interest was placed on the ADC map of target lesions in accordance with the needle position on the biopsy images. Mean ADC values were estimated. TSR, cell counts, proliferation index Ki 67, and number of tumor-infiltrating lymphocytes were estimated. Spearman’s rank correlation coefficients and intraclass correlation coefficients were calculated.
Results
Inter-reader agreement was excellent regarding the ADC measurements. In HCC, ADC correlated with cell count (r = − 0.68, p < 0.001) and with TSR (r = 0.31, p = 0.024). In iCC, ADC correlated with TSR (r = 0.60, p < 0.001) and with cell count (r = − 0.54, p = 0.002). In CRC metastases, ADC correlated with cell count (r = − 0.54 p = 0.006) and with Ki 67 (r = − 0.46, p = 0.024). In BC liver metastases, ADC correlated with TSR (r = 0.55, p < 0.002) and with Ki 67 (r = − 0.51, p = 0.006). In PC metastases, no significant correlations were found.
Conclusions
ADC correlated with tumor cellularity in HCC, iCC, and CRC liver metastases. ADC reflects TSR in BC liver metastases, HCC, and iCC. ADC cannot reflect intratumoral lymphocytes.
Clinical relevance statement
The present study shows that the apparent diffusion coefficient can be used as a surrogate imaging marker for different histopathological features in several malignant hepatic lesions.
Key Points
• ADC reflects different histopathological features in several hepatic tumors.
• ADC correlates with tumor cellularity in HCC, iCC, and CRC metastases.
• ADC strongly correlates with tumor-stroma ratio in BC metastases and iCC.
Keywords: Liver, Neoplasms, Pathology, Tomography
Introduction
Magnetic resonance imaging (MRI) plays an essential role in the diagnosis and local staging of liver tumors including hepatocellular cancer (HCC), cholangiocarcinoma, and liver metastases (LM) from non-hepatic malignancies.
Besides the great diagnostic potential, MRI can also provide information regarding tumor histopathology. So far, diffusion-weighted imaging (DWI) reflects tissue microstructure [1]. DWI is related to the free movement of water molecules (Brownian molecular movement) and is quantified by means of the apparent diffusion coefficient (ADC) [1]. In tissues, free water movement is hindered predominantly by cells. According to the literature, there are inverse correlations between ADC and cellularity in several lesions [2–4]. For instance, ADC correlates well with cell count in lung cancer and neck cancer [3, 4]. Also, ADC is associated with the proliferation index Ki 67. So far, ADC correlates strongly with Ki 67 in breast cancer, lung cancer, and ovarian carcinoma [5, 6].
Finally, ADC reflects tumor grade in different cancers. For example, ADC can discriminate high and low-grade ovarian cancers [6].
In hepatic malignancies, such as hepatocellular cancer (HCC) or intrahepatic cholangiocarcinoma (iCC), DWI can also predict tumor differentiation. It was shown that DWI can predict tumor grade and microvascular invasion in HCC and iCC [7, 8]. However, in contrast to other tumors, only a few studies investigated associations between DWI/ADC and the expression of histopathological markers like Ki 67 in liver lesions [9–11]. Moreover, the reported results are mixed. In addition, there are no reports about relationships between DWI and histopathology in liver metastases.
Besides proliferation and differentiation, DWI can also differentiate tumors with high and low stromal ratios as well as tumors with high and low epithelial-mesenchymal transition [12, 13]. So far, in eosophageal cancer, ADC correlated strongly the amount of stromal collagen (r = − 0.729, p = 0.001) [12]. Furthermore, ADC correlated with tumor stroma ratio (TSR) (r = 0.47, p = 0.007) in a murine model of rhabdomyosarcoma [13]. In liver tumors, no previous studies analyzed this question.
Recently, some reports indicated that DWI can also reflect the number of intratumoral immune cells [14, 15]. For example, ADC correlated well with tumor-infiltrating lymphocytes in breast cancer [15].
Therefore, the aim of the present study was to investigate possible associations between ADC and expression of Ki 67, cell count, TSR, and tumoral immune cells in different hepatic malignancies.
Materials and methods
This retrospective study was approved by the institutional review board (Medical Faculty, Otto-von-Guericke-University Magdeburg, number 43/20).
Data acquisition and patients
We retrospectively reviewed the radiological database for liver biopsies performed in our department in the time period from 2012 to 2021 (computerized search for key codes of the reports). Overall, 1256 cases were identified. In the next step, the imaging and histopathological findings of the identified cases were analyzed. The inclusion criteria for the study were as follows:
Documented position of biopsy needle on CT/MR images
Available MRI with ADC images before biopsy
Lesion size > 5 mm
Available pathologic specimens
The exclusion criteria were as follows:
Cases, which did not meet inclusion criteria
Significant artifacts of ADC images
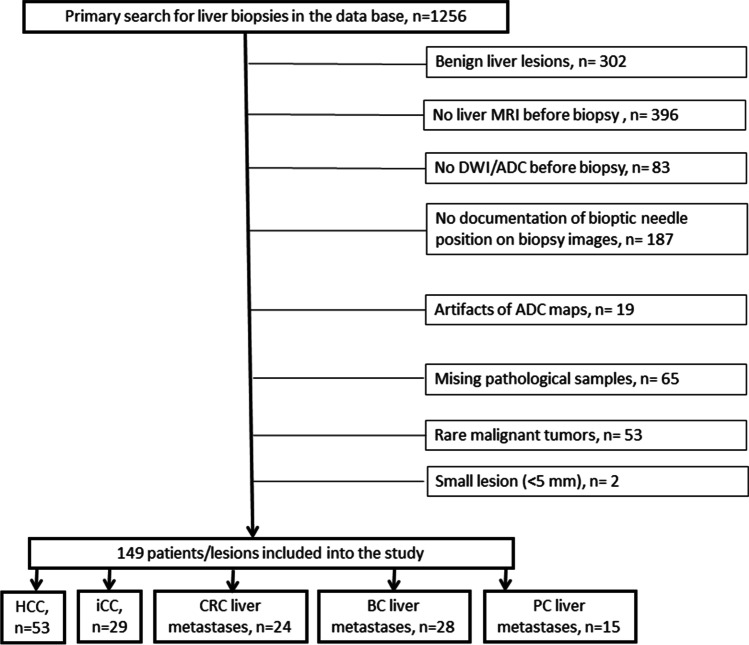
Overall, 1107 cases were excluded (Fig. 1). The remaining 149 patients met the inclusion criteria. There were 68 (45.6%) women and 81 men (54.4%) with a mean age of 65.3 ± 12.3 years and a median age of 64.5 years.
Fig. 1.
Flow chart of data acquisition. HCC, hepatocellular cancer; iCC, intrahepatic cholangiocarcinoma; BC, breast cancer; CRC, colorectal cancer, PC, pancreatic cancer
The included patients had different malignant intrahepatic tumors. In 53 patients (35.6%), hepatocellular cancer (HCC) was diagnosed, in 29 patients (19.5%), intrahepatic cholangiocarcinoma (iCC), in 24 patients (16.1%), liver metastases of colorectal cancer (CRC) were identified, in 28 patients (18.8%), liver metastases of breast cancer, and in 15 patient liver metastases of pancreatic adenocarcinoma (PC) (10.0%) were found.
Imaging
In all patients, MRI was performed on a 1.5-T clinical scanner (Achieva, Philips Healthcare). The imaging protocol included T2-weighted single-shot and turbo-spin echo sequences with and without fat suppression (TR/TE: 1600:100). Dynamic contrast-enhanced scans were obtained after administration of Gd-EOB-DTPA (0.1 mmol/kg body weight, Primovist®, Bayer HealthCare): T1 weighted gradient echo sequences in the arterial, portal-venous and late venous phase as well as hepatobiliary imaging about 20 min after contrast application (TR/TE: 4:2). Axial diffusion-weighted echo-planar imaging sequence with respiratory triggering (TR/TE: 1959/59, FoV: 360 × 360, matrix 144 × 142, b values of 0 and 600 s/mm2, one repetition per b value for b0 and 4 repetitions per b value for b600, flip angle 90) was obtained. ADC maps were automatically generated by the software.
Biopsies were performed under sterile conditions by using 18-G coaxial needles. In every case, two to three cylindrical specimens were sampled.
Imaging analysis
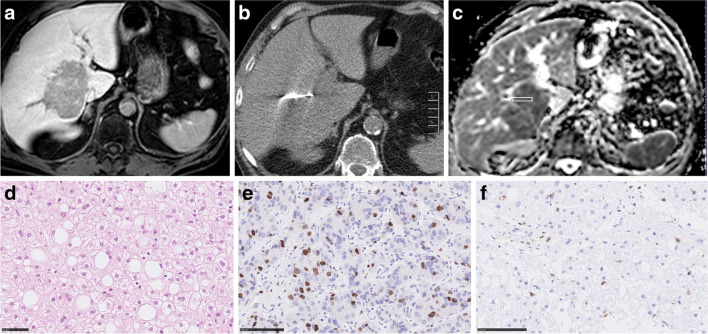
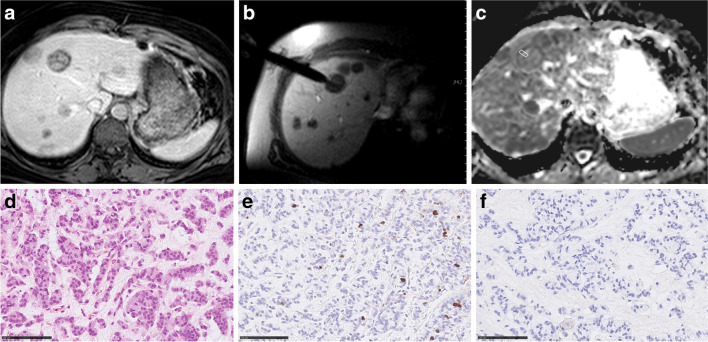
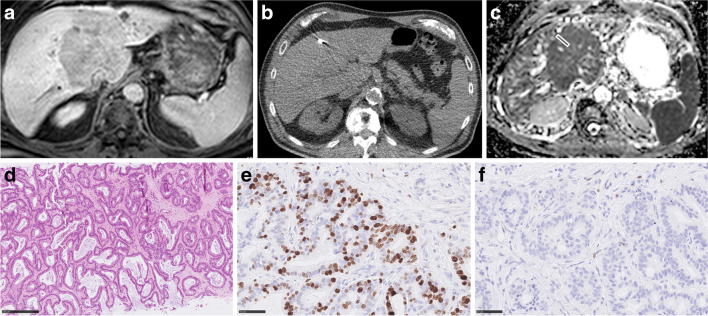
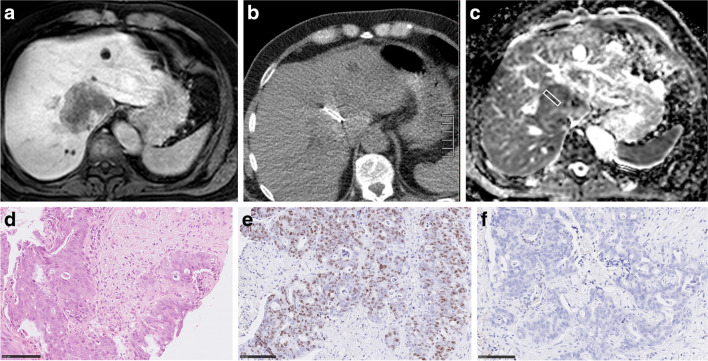
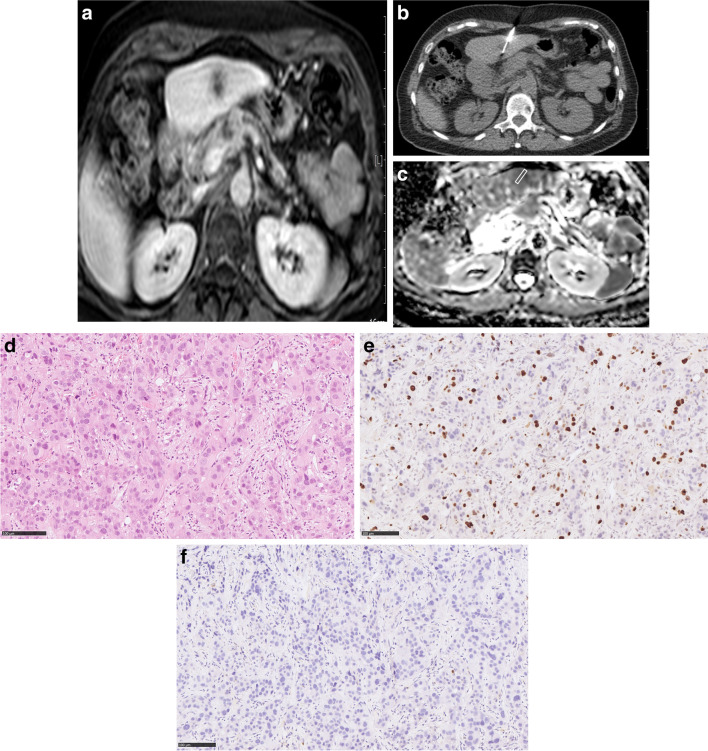
Only the MR images before the biopsy were considered for the study. Measurements were performed on a Picture Archiving and Communication System (PACS) workstation (Infinitt, Version 3.0, Infinitt Healthcare). In the first step, in every case, biopsy images with documentation of needle position were analyzed and the target lesion was determined. In the second step, a cylindrical region of interest (ROI) was placed on the ADC map of every target lesion exactly in accordance with the needle position on the biopsy images. ADC maps were co-registered with the post-contrast T1-weighted 3D-gradient echo sequence to improve visualization and correlation. Analysis of images was performed by two experienced radiologists (S.G. with 2 years of experience in hepatobiliary MRI and A.S., board-certified radiologist, with 16 years of experience in hepatobiliary MRI), independent of each other and blinded to the histopathological findings of the lesions. For all lesions mean ADC values were estimated. Figures 2, 3, 4, 5, and 6 show examples of the analyzed tumor entities in the present investigations.
Fig. 2.
Imaging and histopathological features of a hepatocellular cancer lesion. a MR image of the lesion (venous phase). b CT-guided biopsy image with documentation of needle position within the target lesion. c ADC image of the biopsied lesion with the cylindrical region of interest corresponding with the needle position on CT biopsy images. The estimated mean ADC value is 0.68 × 10⁻³ mm.2/s. d H&E-stained image. Cell count is 151. The mean stromal ratio is 8%. e MIB-stained image. Ki 67 index is 40%. f CD 45 stained image. The mean number of CD 45 positive cells is 5
Fig. 3.
Imaging and histopathological features of breast cancer liver metastases. a MR image documenting lesion (venous phase). b MR-guided biopsy image with documentation of needle position within the target lesion. c ADC image of the target lesion with the cylindrical region of interest corresponding with the needle position on MR biopsy images. The estimated mean ADC value is 1.1 × 10⁻³ mm.2/s. d H&E-stained image. Cell count is 197. The mean stromal ratio is 22%. e MIB-stained image. Ki 67 index is 6%. f CD 45 stained image. The mean number of CD 45 positive cells is 1
Fig. 4.
Imaging and histopathological features of intrahepatic cholangiocarcinoma. a Target lesion on T1w image (venous phase). b CT-guided biopsy image with documentation of needle position within the target lesion. c ADC image of the target lesion with the cylindrical region of interest corresponding with the needle position on CT biopsy images. The estimated mean ADC value is 0.84 × 10⁻³ mm.2/s. d H&E-stained image. Cell count is 272. TSR is 54%. e MIB-stained image. Ki 67 index is 35%. f CD 45 stained image. The mean number of CD 45 positive cells is 3
Fig. 5.
Associations between ADC and histopathological features in colorectal cancer liver metastases. a Target lesion on T1w image (venous phase). b CT-guided biopsy image with documentation of needle position within the target lesion. c ADC image of the target lesion with cylindrical region of interest corresponding with the needle position on CT biopsy images. The estimated mean ADC value is 0.90 × 10⁻³ mm.2/s. d H&E-stained image. Cell count is 308. TSR is 30%. e MIB-stained image. Ki 67 index is 90%. f CD 45 stained image. The mean number of CD 45 positive cells is 2
Fig. 6.
Relationships between ADC and histopathological features in pancreatic cancer liver metastases. a Target lesion on T1w image (venous phase). b Documentation of needle position within the target lesion on CT-guided biopsy image. c ADC image of the target lesion with the cylindrical region of interest according to the needle position on CT biopsy images. The estimated mean ADC value is 1.05 × 10⁻³ mm2/s. d H&E-stained image. Cell count is 113. TSR is 5.5%. e MIB-stained image. Ki 67 index is 20%. f CD 45 stained image. The mean number of CD 45 positive cells is 1.5
Histopathological analysis
The biopsies of the tumors were obtained before any form of treatment. Histopathology was evaluated by two experienced investigators (D.J., K.E.) in consensus without knowledge of the patients or imaging data.
Formalin-fixed, paraffin-embedded tissue serial Sects. (2 µm) were dewaxed in xylol and rehydrated by descending concentrations of ethanol. For each specimen, standard hematoxylin and eosin (HE) staining and immunohistochemistry were performed. For antigen detection, we used the automated immunohistochemistry slide staining system VENTANA BenchMark ULTRA (Roche Diagnostics GmbH), the VENTANA iVIEW DAB Detection Kit (Roche Diagnostics GmbH), and the indirect biotin-streptavidin method before counterstaining with Haemalaun solution. Antigen retrieval was performed with CC1mild, followed by incubation with specific primary antibodies recognizing CD45/leucocyte common antigen (polyclonal mouse antibody, clone 2B11 + PD7/26; DAKO/Agilent #M0701) or Ki67 (polyclonal mouse antibody, clone Mib1; DAKO/Agilent #M7240), at 36 °C for 32 min, dilution 1:500 or 1:100, respectively.
Every histopathological parameter was evaluated in five power fields (× 40; 0.23 mm2 per field). For each specimen, the mean values of the quantified parameter were calculated. Tumor-stroma ratio (TSR) was evaluated on the HE-stained specimen and percentages were given per tumor and stroma content separately. Cell density or density of tumor-infiltrating immune cells were estimated as a mean of overall cell counts or CD45 + leucocytes per high power field, respectively. The rate of proliferation was indicated by the percentage of Ki 67-positive cells from all tumor cells (Ki 67-index). Histopathological evaluation was done with the Nikon ECLIPSE Ni-E microscope. Pictures were digitalized with the camera Nikon DS-Ri2 and saved as uncompressed Tagged Image File Format (TIFF).
Statistical analysis
Statistical analysis was performed using the SPSS package (IBM SPSS Statistics for Windows, version 28: IBM corporation, 2021). The collected data were evaluated by means of descriptive statistics (absolute and relative frequencies). A comparison of ADC values and histopathological parameters in groups was performed by ANOVA tests. The correlation between ADC and histopathological features was calculated by Spearman’s rank correlation coefficient. Intraclass correlation coefficients (ICC) were used for the calculation of interreader variability. p values were interpreted in an exploratory manner.
Results
Comparison of ADC values and histopathological findings in the analyzed tumors
The measured ADC values showed a good interreader variability both for the overall sample and for the subgroups, ranging from ICC = 0.815 to ICC = 0.981 (Table 1).
Table 1.
Interobserver agreement of ADC values
| Interobserver agreement | |
|---|---|
| Total sample | 0.946 p < 0.001 |
| HCC | 0.976 p < 0.001 |
| iCC | 0.959 p < 0.001 |
| BC liver metastases | 0.981 p < 0.001 |
| CRC liver metastases | 0.913 p < 0.001 |
| PC liver metastases | 0.815 p = 0.001 |
HCC, hepatocellular cancer; iCC, intrahepatic cholangiocarcinoma; BC, breast cancer; CRC, colorectal cancer, PC, pancreatic cancer
In the overall sample, the mean ADC value (× 10–3 mm2/s) was 0.93 ± 0.30, median value, of 0.86, range, 0.45–2.00. ADC values in the subgroups are shown in Table 2. ADC values were lowest in PC metastases. The highest ADC values were identified in iCC.
Table 2.
Comparison of ADC values and histopathological features in the analyzed tumors
| HCC | CC | CRC liver metastases | BC liver metastases | PC liver metastases | p values* | |
|---|---|---|---|---|---|---|
|
ADC, × 10–3 mm2/s |
0.96 ± 0.28 | 1.03 ± 0.38 | 0.94 ± 0.33 | 0.86 ± 0.19 | 0.75 ± 0.22 | 0.023 |
HCC, hepatocellular cancer; CC, cholangiocarcinoma; BC, breast cancer; CRC, colorectal cancer; PC, pancreatic cancer
* ANOVA
A comparison of histopathological parameters in the subgroups is shown in Table 3. TSR was lowest in HCC and highest in iCC. There was no significant difference in regard to cell count between the investigated tumors. HCC showed the highest number of CD 45 positive cells. The lowest number of CD 45 positive cells was identified in CRC liver metastases. Finally, the highest proliferation index Ki 67 was found in CRC liver metastases followed by PC liver metastases.
Table 3.
Histopathological parameters
| Histopathological features | HCC n = 53 |
CC n = 29 |
CRC liver metastases n = 24 |
BC liver metastases n = 28 |
PC liver metastases n = 15 |
p values* |
|---|---|---|---|---|---|---|
| Tumor-stroma ratio, % | 17.1 ± 20.0 | 46.5 ± 20.8 | 44.9 ± 24.6 | 38.4 ± 24.2 | 27.1 ± 20.8 | < 0.001 |
| Cell count, n | 148.8 ± 59.8 | 158.7 ± 50.1 | 180.5 ± 74.6 | 181.9 ± 77.2 | 162.8 ± 54.2 | 0.142 |
| CD 45, n | 7.42 ± 7.97 | 4.04 ± 10.25 | 1.69 ± 3.00 | 2.80 ± 5.76 | 3.14 ± 4.58 | 0.009 |
| Ki 67, % | 17.4 ± 16.3 | 26.6 ± 18.6 | 49.2 ± 26.6 | 26.5 ± 15.9 | 38.8 ± 16.8 | < 0.001 |
* ANOVA
Correlation between ADC values and histopathology
In the overall sample, ADC correlated moderately with cell count and slightly with Ki 67 and TSR (Table 4).
Table 4.
Correlations between ADC values and histopathological findings in liver tumors. Total sample
| Tumor-stroma ratio | Cell count | CD 45 | Ki 67 | |
|---|---|---|---|---|
| ADC | 0.293 (< 0.001) | − 0.518 (< 0.001) | − 0.043 (0.602) | − 0.293 (< 0.001) |
Significant correlations are given in boldface
In the subgroups, different correlations were found. In HCC, ADC correlated well with cell count (r = − 0.68, p < 0.001) and slightly with TSR (r = 0.31, p = 0.024) (Table 5). In iCC, ADC correlated with TSR (r = 0.60, p < 0.001) and with cell count (r = − 0.54, p = 0.002) (Table 6). In CRC metastases, ADC correlated with cell count (r = − 0.54 p = 0.006) and with Ki 67 (r = − 0.46, p = 0.024) (Table 7). In BC liver metastases, ADC correlated with TSR (r = 0.55, p < 0.002) and with Ki 67 (r = − 0.51, p = 0.006) (Table 8). In PC metastases, no significant correlations were found (Table 9).
Table 5.
Correlations between ADC values and histopathological findings in liver tumors. HCC
| Tumor-stroma ratio | Cell count | CD 45 | Ki 67 | |
|---|---|---|---|---|
| ADC | 0.310 (0.024) | − 0.683 (< 0.001) | − 0.154 (0.271) | − 0.267 (0.053) |
Significant correlations are given in boldface
Table 6.
Correlations between ADC values and histopathological findings in liver tumors. iCC
| Tumor-stroma ratio | Cell count | CD 45 | Ki 67 | |
|---|---|---|---|---|
| ADC | 0.600 (< 0.001) | − 0.541 (0.002) | − 0.171 (0.374) | − 0.183 (0.342) |
Significant correlations are given in boldface
Table 7.
Correlations between ADC values and histopathological findings in liver tumors. CRC liver metastases
| Tumor-stroma ratio | Cell count | CD 45 | Ki 67 | |
|---|---|---|---|---|
| ADC | 0.038 (0.859) | − 0.540 (0.006) | 0.247 (0.245) | − 0.458 (0.024) |
Significant correlations are given in boldface
Table 8.
Correlations between ADC values and histopathological findings in liver tumors. BC liver metastases
| Tumor-stroma ratio | Cell count | CD 45 | Ki 67 | |
|---|---|---|---|---|
| ADC | 0.551 (0.002) | − 0.369 (0.053) | 0.050 (0.802) | − 0.510 (0.006) |
Significant correlations are given in boldface
Table 9.
Correlations between ADC values and histopathological findings in liver tumors. PC liver metastases
| Tumor-stroma ratio | Cell count | CD 45 | Ki 67 | |
|---|---|---|---|---|
| ADC | 0.045 (0.873) | − 0.422 (0.117) | 0.401 (0.155) | − 0.095 (0.746) |
Significant correlations are given in boldface
Discussion
To the best of our knowledge, this is the first study regarding associations between ADC and different histopathological features in several liver tumors. Based on the present results, it can be postulated that MR imaging, namely DWI can characterize different hepatic lesions. Furthermore, DWI is a valid and robust instrument. As shown, all ADC values had an excellent inter-observer agreement. This finding supports previous investigations. In fact, Kakite et al found a good inter-observer agreement of ADC values in hepatocellular cancer [16]. Similar results were found in cholagiocarcinoma [17] and CRC liver metastases [18].
Some previous reports indicated that ADC can predict tumor behavior in several liver malignancies. So far, in HCC, pretreatment low ADC, namely values under 1.32 × 10⁻³ mm2/s, independently predicted poorer prognosis in patients with solitary large HCCs who have undergone transcatheter arterial chemoembolization (TACE) immediately combined with radiofrequency ablation [19]. Furthermore, low minimum ADC has been reported as a risk factor for HCC recurrence following liver transplantation (20). In iCC, an increase in ADC values (< 25%) during treatment has been reported as a sign of good prognosis [21]. Also in colorectal liver metastases, ADC can predict response to systemic chemotherapy [22].
These associations may be explained by possible links between histopathology and DWI findings. Hypothetically, ADC is associated with relevant histopathological features in several liver tumors. Our results confirmed this hypothesis. Furthermore, associations between ADC values and histopathological features are different in several malignant liver lesions. In HCC, ADC correlated strongly with cell count and tended to correlate with Ki 67. Therefore, in HCC, ADC can be used as a surrogate marker for tumor cellularity. Therefore, ADC can well document the effects of cytoreductive treatments like transarterial chemotherapy, and systemic chemotherapy. This finding support also previous clinical observations. For example, according to Kostek et al, advanced HCC with a favorable response to sorafenib had a significant increase in ADC values at the first radiological evaluation after treatment [24]. In fact, an increase in ADC values suggests a decrease in cellularity and, therefore, can be used in clinical practice as a marker of treatment response. Previously, only two studies analyzed relationships between ADC and the expression of Ki 67 in HCC [9, 10]. In the study of Hu et al, ADC correlated slightly with Ki 67 (r = − 0.40, p = 0.02) [10]. Similar results were reported by Huang et al [9]. We observed only a correlation trend between ADC and the expression of Ki 67. Previously, no studies analyzed associations between ADC and TSR as well as intratumoral lymphocytes in HCC.
Furthermore, ADC reflects cell count in iCC. Therefore, ADC can also be used for monitoring cytoreductive treatment in this tumor entity. More importantly, the present study identified that in iCC, ADC can predict TSR. According to the literature, in iCC, TSR plays an important prognostic role. So far, high TSR is inversely correlated with vascular invasion (62.5% vs 95.7%, p = 0.006) [25]. Furthermore, rich tumor stroma is associated with poor overall survival in patients with iCC [26]. Therefore, ADC can also be used as a prognostic marker in iCC. Our study confirms previous results of Yamada et al [27]. According to the authors, tumoral ADC correlates with TSR, and, more importantly, tumoral ADC values < 1.5 × 10⁻³ mm2/s can be used as an independent biomarker of worse overall survival [27].
In CRC liver metastases, ADC correlates with tumor cellularity and proliferation potential but not with TSR. This is in agreement with the published data [26, 27]. This finding indicates that in CRC liver metastases ADC can quantitatively reflect treatment response to chemotherapy.
In BC liver metastases, ADC correlated with Ki 67. This finding is not unusual. Previously, some reports observed significant correlations between ADC and the expression of Ki 67 in primary breast cancer [28]. Furthermore, ADC can also reflect TSR. This finding is very important. According to the literature, stroma plays an important prognostic role in breast cancer [29]. Also, Ki 67 is an essential prognostic factor in BC [28]. Therefore, ADC can also predict the prognosis of BC liver metastases.
Interestingly, in PC liver metastases, ADC did not predict relevant histopathological features. Previously, only two studies analyzed associations between ADC and histopathology in pancreatic adenocarcinomas [32, 33]. Xie et al did not find statistically significant correlations between ADC and grades of differentiation, fibrosis grade, Ki 67 expression, and expression microvessel density [32]. However, in the study of Peerboccus et al, ADC correlated significantly with tumor fibrosis and nuclear density [33]. Our finding suggests that ADC cannot be used as an imaging biomarker in liver metastases of pancreatic adenocarcinoma. Furthermore, ADC also cannot be used for monitoring cytoreductive treatment.
We could not find significant correlations between the number of intratumoral immune cells and ADC values in the investigated intrahepatic malignancies. This fact suggests that ADC cannot be used for the prediction of tumoral immune reactions. To the best of my knowledge, this is the first study analyzing relationships between DWI and intratumoral immune cells in different liver tumors.
There are several limitations of the present study. First, it is retrospective. Second, small patient samples were investigated. Clearly, further prospective studies should be performed to prove our preliminary results.
Importantly, in contrast to previous investigations, in the present study, for the first time, a measure of ADC was performed exactly on the biopsied tumor area. In other studies, a whole lesion measure of ADC values was performed, whereas histopathological analysis was made based on bioptic specimens. This results in spatial incongruences between histopathological and radiological tumor architecture. Furthermore, for the first time, associations between ADC values and complex histopathological features including tumor cell count, proliferation index, number of intratumoral lymphocytes, and tumoral stromal compartment were performed. These facts improve the significance of the present study.
In conclusion, associations between DWI and histopathology are complex and different in several hepatic malignancies. In HCC, iCC, and CRC liver metastases, ADC can be used as a surrogate marker for cell count. In BC liver metastases and iCC, ADC correlates with TSR. In BC and CRC liver metastases, ADC correlates with tumoral proliferation activity. In PC liver metastases, ADC does not reflect the analyzed histopathological features.
Abbreviations
- ADC
Apparent diffusion coefficient
- BC
Breast cancer
- CRC
Colorectal cancer
- DWI
Diffusion-weighted imaging
- HCC
Hepatocellular cancer
- iCC
Intrahepatic cholangiocarcinoma
- MRI
Magnetic resonance imaging
- PC
Pancreatic cancer
Funding
Open Access funding enabled and organized by Projekt DEAL. This work has received no funding.
Declarations
Guarantor
The scientific guarantor of this study is Alexey Surov.
Conflict of interest
The authors of this manuscript declare no relationships with any companies, whose products or services may be related to the subject matter of the article.
Statistics and biometry
One author has significant statistical expertise (Andreas Wienke).
Informed consent
Written informed consent was waived by the Institutional Review Board.
Ethical approval
Institutional Review Board approval was obtained.
Study subjects or cohorts overlap
No study subjects or cohorts have been previously reported.
Methodology
retrospective
observational
performed at one institution
Footnotes
This article has a companion Commentary (article 10.1007/s00330-023-09791-x
Publisher's note
Springer Nature remains neutral with regard to jurisdictional claims in published maps and institutional affiliations.
References
- 1.Le Bihan D. Apparent diffusion coefficient and beyond: what diffusion MR imaging can tell us about tissue structure. Radiology. 2013;268(2):318–322. doi: 10.1148/radiol.13130420. [DOI] [PubMed] [Google Scholar]
- 2.Woodhams R, Kakita S, Hata H, et al. Diffusion-weighted imaging of mucinous carcinoma of the breast: evaluation of apparent diffusion coefficient and signal intensity in correlation with histologic findings. AJR Am J Roentgenol. 2009;193(1):260–266. doi: 10.2214/AJR.08.1670. [DOI] [PubMed] [Google Scholar]
- 3.Driessen JP, Caldas-Magalhaes J, Janssen LM, et al. Diffusion-weighted MR imaging in laryngeal and hypopharyngeal carcinoma: association between apparent diffusion coefficient and histologic findings. Radiology. 2014;272(2):456–463. doi: 10.1148/radiol.14131173. [DOI] [PubMed] [Google Scholar]
- 4.Matoba M, Tonami H, Kondou T, et al. Lung carcinoma: diffusion-weighted mr imaging–preliminary evaluation with apparent diffusion coefficient. Radiology. 2007;243(2):570–577. doi: 10.1148/radiol.2432060131. [DOI] [PubMed] [Google Scholar]
- 5.Zhang J, Cui LB, Tang X, et al. DW MRI at 3.0 T versus FDG PET/CT for detection of malignant pulmonary tumors. Int J Cancer. 2014;134(3):606–611. doi: 10.1002/ijc.28394. [DOI] [PubMed] [Google Scholar]
- 6.Li HM, Zhao SH, Qiang JW, et al. Diffusion kurtosis imaging for differentiating borderline from malignant epithelial ovarian tumors: a correlation with Ki-67 expression. J Magn Reson Imaging. 2017;46(5):1499–1506. doi: 10.1002/jmri.25696. [DOI] [PubMed] [Google Scholar]
- 7.Surov A, Pech M, Omari J, et al. Diffusion-weighted imaging reflects tumor grading and microvascular invasion in hepatocellular carcinoma. Liver Cancer. 2021;10(1):10–24. doi: 10.1159/000511384. [DOI] [PMC free article] [PubMed] [Google Scholar]
- 8.Zhou Y, Wang X, Xu C, et al. Mass-forming intrahepatic cholangiocarcinoma: can diffusion-weighted imaging predict microvascular invasion? J Magn Reson Imaging. 2019;50(1):315–324. doi: 10.1002/jmri.26566. [DOI] [PubMed] [Google Scholar]
- 9.Huang Z, Xu X, Meng X, et al. Correlations between ADC values and molecular markers of Ki-67 and HIF-1α in hepatocellular carcinoma. Eur J Radiol. 2015;84(12):2464–2469. doi: 10.1016/j.ejrad.2015.09.013. [DOI] [PubMed] [Google Scholar]
- 10.Hu XX, Yang ZX, Liang HY, et al. Whole-tumor MRI histogram analyses of hepatocellular carcinoma: correlations with Ki-67 labeling index. J Magn Reson Imaging. 2017;46(2):383–392. doi: 10.1002/jmri.25555. [DOI] [PubMed] [Google Scholar]
- 11.Heijmen L, Ter Voert EE, Nagtegaal ID, et al. Diffusion-weighted MR imaging in liver metastases of colorectal cancer: reproducibility and biological validation. Eur Radiol. 2013;23(3):748–756. doi: 10.1007/s00330-012-2654-4. [DOI] [PubMed] [Google Scholar]
- 12.Aoyagi T, Shuto K, Okazumi S, et al. Apparent diffusion coefficient correlation with oesophageal tumour stroma and angiogenesis. Eur Radiol. 2012;22(6):1172–1177. doi: 10.1007/s00330-011-2359-0. [DOI] [PubMed] [Google Scholar]
- 13.Fang S, Yang Y, Chen B, et al. DWI and IVIM imaging in a murine model of rhabdomyosarcoma: correlations with quantitative histopathologic features. J Magn Reson Imaging. 2022;55(1):225–233. doi: 10.1002/jmri.27828. [DOI] [PubMed] [Google Scholar]
- 14.Swartz JE, Driessen JP, van Kempen PMW, et al. Influence of tumor and microenvironment characteristics on diffusion-weighted imaging in oropharyngeal carcinoma: A pilot study. Oral Oncol. 2018;77:9–15. doi: 10.1016/j.oraloncology.2017.12.001. [DOI] [PubMed] [Google Scholar]
- 15.Fogante M, Tagliati C, De Lisa M, et al. Correlation between apparent diffusion coefficient of magnetic resonance imaging and tumor-infiltrating lymphocytes in breast cancer. Radiol Med. 2019;124(7):581–587. doi: 10.1007/s11547-019-01008-w. [DOI] [PubMed] [Google Scholar]
- 16.Kakite S, Dyvorne H, Besa C, et al. Hepatocellular carcinoma: short-term reproducibility of apparent diffusion coefficient and intravoxel incoherent motion parameters at 3.0T. J Magn Reson Imaging. 2015;41(1):149–156. doi: 10.1002/jmri.24538. [DOI] [PubMed] [Google Scholar]
- 17.Kovač JD, Daković M, Janković A, et al. The role of quantitative diffusion-weighted imaging in characterization of hypovascular liver lesions: a prospective comparison of intravoxel incoherent motion derived parameters and apparent diffusion coefficient. PLoS One. 2021;16(2):e0247301. doi: 10.1371/journal.pone.0247301. [DOI] [PMC free article] [PubMed] [Google Scholar]
- 18.Anzidei M, Napoli A, Zaccagna F, et al. Liver metastases from colorectal cancer treated with conventional and antiangiogenetic chemotherapy: evaluation with liver computed tomography perfusion and magnetic resonance diffusion-weighted imaging. J Comput Assist Tomogr. 2011;35(6):690–696. doi: 10.1097/RCT.0b013e318230d905. [DOI] [PubMed] [Google Scholar]
- 19.Tang J, Liu F, Yuan H, et al. Pretreatment apparent diffusion coefficient as a predictor of response to transcatheter arterial chemoembolization immediately combined with radiofrequency ablation for treatment of solitary large hepatocellular carcinoma. Cancer Manag Res. 2020;12:10127–10138. doi: 10.2147/CMAR.S270470. [DOI] [PMC free article] [PubMed] [Google Scholar]
- 20.Chuang YH, Ou HY, Yu CY, et al. Diffusion-weighted imaging for identifying patients at high risk of tumor recurrence following liver transplantation. Cancer Imaging. 2019;19(1):74. doi: 10.1186/s40644-019-0264-y. [DOI] [PMC free article] [PubMed] [Google Scholar]
- 21.Pandey A, Pandey P, Aliyari Ghasabeh M, et al. Unresectable intrahepatic cholangiocarcinoma: multiparametric mr imaging to predict patient survival. Radiology. 2018;288(1):109–117. doi: 10.1148/radiol.2018171593. [DOI] [PubMed] [Google Scholar]
- 22.Drewes R, Pech M, Powerski M, et al. Apparent diffusion coefficient can predict response to chemotherapy of liver metastases in colorectal cancer. Acad Radiol Suppl. 2021;1:S73–S80. doi: 10.1016/j.acra.2020.09.006. [DOI] [PubMed] [Google Scholar]
- 23.Surov A, Caysa H, Wienke A, et al. Correlation between different ADC fractions, cell count, Ki-67, total nucleic areas and average nucleic areas in meningothelial meningiomas. Anticancer Res. 2015;35(12):6841–6846. [PubMed] [Google Scholar]
- 24.Kostek O, Yilmaz E, Bekir Hacıoglu M, et al. Value of MRI apparent diffusion coefficient for assessment of response to sorafenib in hepatocellular carcinoma. J BUON. 2018;23(4):979–984. [PubMed] [Google Scholar]
- 25.Guedj N, Blaise L, Cauchy F, et al. Prognostic value of desmoplastic stroma in intrahepatic cholangiocarcinoma. Mod Pathol. 2021;34(2):408–416. doi: 10.1038/s41379-020-00656-y. [DOI] [PubMed] [Google Scholar]
- 26.Jing CY, Fu YP, Huang JL, et al. Prognostic nomogram based on histological characteristics of fibrotic tumor stroma in patients who underwent curative resection for intrahepatic cholangiocarcinoma. Oncologist. 2018;23(12):1482–1493. doi: 10.1634/theoncologist.2017-0439. [DOI] [PMC free article] [PubMed] [Google Scholar]
- 27.Yamada S, Morine Y, Imura S, et al. Prognostic prediction of apparent diffusion coefficient obtained by diffusion-weighted MRI in mass-forming intrahepatic cholangiocarcinoma. J Hepatobiliary Pancreat Sci. 2020;27(7):388–395. doi: 10.1002/jhbp.732. [DOI] [PubMed] [Google Scholar]
- 28.Ao W, Bao X, Mao G, et al. Value of apparent diffusion coefficient for assessing preoperative T staging of low rectal cancer and whether this is correlated with Ki-67 expression. Can Assoc Radiol J. 2020;71(1):5–11. doi: 10.1177/0846537119885666. [DOI] [PubMed] [Google Scholar]
- 29.Meng X, Li H, Kong L, et al. MRI In rectal cancer: correlations between MRI features and molecular markers Ki-67, HIF-1α, and VEGF. J Magn Reson Imaging. 2016;44(3):594–600. doi: 10.1002/jmri.25195. [DOI] [PubMed] [Google Scholar]
- 30.Mori N, Ota H, Mugikura S, et al. Luminal-type breast cancer: correlation of apparent diffusion coefficients with the Ki-67 labeling index. Radiology. 2015;274(1):66–73. doi: 10.1148/radiol.14140283. [DOI] [PubMed] [Google Scholar]
- 31.Qian X, Xiao F, Chen YY, et al. Computerized assessment of the tumor-stromal ratio and proposal of a novel nomogram for predicting survival in invasive breast cancer. J Cancer. 2021;12(12):3427–3438. doi: 10.7150/jca.55750. [DOI] [PMC free article] [PubMed] [Google Scholar]
- 32.Xie P, Liu K, Peng W, et al. The correlation between diffusion-weighted imaging at 3.0-T magnetic resonance imaging and histopathology for pancreatic ductal adenocarcinoma. J Comput Assist Tomogr. 2015;39(5):697–701. doi: 10.1097/RCT.0000000000000274. [DOI] [PubMed] [Google Scholar]
- 33.Peerboccus M, Van Eycke YR, Gyssels E, et al. Volumetric-based analysis of in-vivo and ex-vivo quantitative mr diffusion parameters in pancreatic adenocarcinoma: correlation with pathologic findings. Jpn J Gastroenterol Hepatol. 2019;4:1–8. [Google Scholar]


