Abstract
In this study the metric of detective quantum efficiency (DQE) was applied to Cherenkov imaging systems for the first time, and results were compared for different detector hardware, gain levels and with imaging processing for noise suppression. Intensified complementary metal oxide semiconductor (CMOS) cameras using different image intensifier designs (Gen3 and Gen2+) were used to image Cherenkov emission from a tissue phantom in order to measure the modulation transfer function (MTF) and noise power spectrum (NPS) of the systems. These parameters were used to calculate the DQE for varying acquisition settings and image processing steps. MTF curves indicated that the Gen3 system had superior contrast transfer and spatial resolution than the Gen2+ system, with values of 0.52 mm−1 and 0.31 mm−1, respectively. With median filtering for noise suppression, these values decreased to 0.50 mm−1 and 0.26 mm−1. The maximum NPS values for the Gen3 and Gen2+ systems at high gain were 1.3 × 106 mm2 and 9.1 × 104 mm2 respectively, representing a 14x decrease in noise power for the Gen2+ system. Both systems exhibited increased NPS intensity with increasin1–3g gain, while median filtering lowered the NPS. The DQE of each system increased with increasing gain, and at the maximum gain levels the Gen3 system had a low-frequency DQE of 0.31%, while the Gen2+ system had a value of 1.44%. However, at a higher frequency of 0.4 mm−1, these values became 0.54% and 0.03%. Filtering improved DQE for the Gen3 system and reduced DQE for the Gen2+ system and had a mix of detrimental and beneficial qualitative effects by decreasing the spatial resolution and sharpness but also substantially lowering noise. This methodology for DQE measurement allowed for quantitative comparison between Cherenkov imaging cameras and improvements to their sensitivity and yielded the first formal assessment of Cherenkov image formation efficiency.
Keywords: Cherenkov, Radiotherapy, DQE
1. INTRODUCTION
Cherenkov imaging systems have been developing as a unique method to visualize radiation beams interacting with patient tissue during external beam radiotherapy, with potential applications in field verification and surface dosimetry.1–3 Additionally, these systems can be used to image radioluminescence signals from a variety of scintillating phantoms and dosimeters, for accurate real-time surface dosimetry or quality assurance purposes4–9. These optical signals are of interest in a clinical context as they provide surrogate information about deposited radiation dose10,11. Due to the low-intensity nature of these signals, most published studies have utilized intensified charge coupled device (CCD) or complementary metal oxide semiconductor (CMOS) cameras in order to capture individual optical photons produced in irradiated material, with adequate signal to noise ratio, at the typical frame rates needed in external beam radiotherapy. In addition, for real-time in vivo optical dosimetry, time-gating and online background subtraction is necessarily employed to suppress ambient room lighting. The resulting image frames are commonly composed of just a few or tens of photons per pixel and so the signal to noise and spatial resolution achievable are intertwined. This study focuses on developing a methodology to evaluate the images achievable with each camera, in an objective manner which would allow comparisons between possible camera systems and different gain settings.
In the realm of digital x-ray imaging devices, the detective quantum efficiency (DQE) has become an important measurement in reporting the imaging performance, and standards have been developed to allow for comparison between devices and modalities12–15. It is of interest to be able to measure imaging performance of optical imaging systems used in radiotherapy dosimetry in a similar manner, in order to understand the spatial frequency dependence of the signal-to-noise transfer during data acquisition.
In this work a method is demonstrated measuring: 1) the incident quanta, 2) the modulation transfer function (MTF), 3) the noise power spectrum (NPS), and subsequently using these to calculate the DQE for an intensified CMOS camera using Cherenkov light generated in a tissue phantom during irradiation by a linear accelerator. Methods for measuring these parameters follow existing protocols for x-ray devices when appropriate, and parallels are drawn for the appropriate measurement of parameters when needed. Comparisons are made between intensifiers with different quantum efficiency spectra and noise response, and DQE curves were measured at varying intensifier and analog CMOS gain levels to observe the effect upon image performance and inform the selection of image acquisition settings to optimize signal to noise.
2. MATERIALS AND METHODS
2.A. Description of the Imaging System
This study was performed using two red-sensitive intensified CMOS cameras (C-Dose Research, DoseOptics LLC, Lebanon NH) using Sb-K-Na-Cs (Gen2+) and GaAs-O-Cs (Gen3) intensifiers with a 19 mm photocathode sensitive region diameter, as described by Bruza et al16. The square pixel spacing on the CMOS chips used in these cameras was 5.86 μm. While Cherenkov emission is blue-weighted, red-sensitive cameras were used because in tissue, shorter wavelengths are attenuated leaving a red-weighted signal emitted from the surface11. Other than the intensifiers, which consist of a photocathode, microchannel plate (MCP) and phosphor screen, all other components of the two cameras were identical, including the lens. Parameters considered in the process of calculating the DQE, such as gain, spatial resolution, field of view, and photon sensitivity are in general composite factors influenced by different components of the imaging system including the lens, intensifier and CMOS chip. These factors have been investigated in more detail in LaRochelle et al17 in considering a photon budget for Cherenkov emission imaging signal intensity optimization.
For a practical approach of measuring DQE in a clinical imaging context, the cameras were each fixed with a 50 mm lens (Nikon Inc, Tokyo, Japan) and placed on the linac couch with a distance of 2.25 m to the imaging plane at isocenter, and the lens was set at an aperture of f/2.8, in order to closely replicate the distances used in patient imaging with ceiling mounted cameras used in previous studies2,3. During image acquisition, the wall sconce lights were set to typical levels used during patient treatment at our center. The cameras imaged at frame rate of 17 Hz and standard imaging settings in the C-Dose software (51 ms exposure time of Cherenkov frame, 8 ms exposure time of background frame), and the intensifiers were time-gated synchronously to the 4 μs linac pulses at 600 MU min−1 (360 Hz) in order to reject the majority of the ambient room light. The temporal response of the detector was not considered to influence imaging, as the common decay times of ~1 ms for P43 phosphors, which were the limiting factor in the system, were less than the inter-pulse intensifier off-time of ~2.7 ms at a 360 Hz repetition rate18. Time-delayed background frames were also acquired to perform online background subtraction as discussed below. In post-acquisition analysis, all images were flat-field corrected using a normalized, uniformly flood-illuminated image from a bright, diffuse light source. Figure 1(a) provides a schematic of the imaging setup, and Figure 1(b) shows spectral sensitivity and quantum efficiency (QE) curves for each intensifier.
Figure 1.
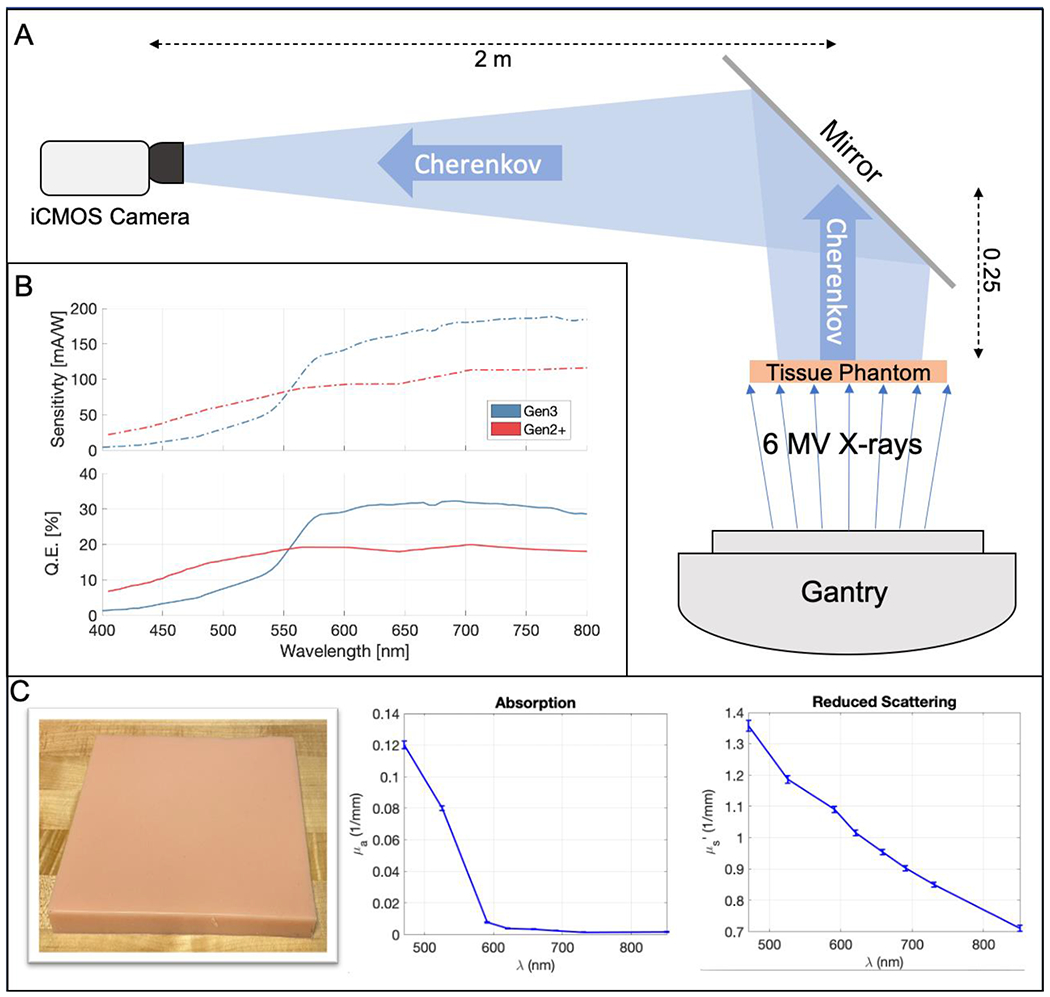
(A) Schematic of imaging geometry. (B) Spectral sensitivity and quantum efficiency curves for both the Sb-K-Na-Cs Gen2+ and GaAs-O-Cs Gen3 intensifiers. (C) Color image of the tissue phantom, as well as absorption and reduced scattering coefficients as a function of wavelength.
2.B. Online Background Subtraction
During Cherenkov image acquisition, the ambient room lights were left on at normal treatment levels, as is typical when performing Cherenkov imaging during patient treatment. Prior to each acquisition, a darkfield image was acquired using the corresponding gain settings. Online background subtraction was performed during the acquisition by acquiring time-delayed dedicated background frames in between the time-synchronized Cherenkov frames. The background frames were acquired with a shorter exposure time in order maximize the captured Cherenkov signal, with only 3 linac pulses falling within a given background frame as opposed to 18 pulses within a Cherenkov frame. Therefore, to capture adequate background light, the pulse duration setting was prolonged compared to the Cherenkov frames, where for the latter this setting matched the width of the linac pulse (~ 4 μs).
First, the darkfield was subtracted from both the Cherenkov and background frames immediately after they are acquired, and then the background frame was scaled to account for the difference in exposure times between the two. This was achieved by taking a ratio of the average pixel values in identical ROIs on the fringe of each corresponding set of Cherenkov and background frames and using that ratio as a scaling factor for the background frame prior to subtraction from the Cherenkov frame. Each resulting background-subtracted frame in the processed image stack is then given by
| (1) |
where and are the corresponding Cherenkov and background frames and is the pixel scaling factor.
This method was a built-in feature of the image acquisition software (C-Dose Research, DoseOptics LLC, Lebanon NH) and was performed in real-time as the images were acquired, with no measurable impact on the performance or frame rate of the camera.
2.C. Cherenkov Emission Signal
Cherenkov emission from a square silicon tissue phantom was used as an optical signal to calculate DQE under imaging conditions similar to those used during patient treatment. The phantom was created using 1260 cc of platinum cure silicon rubber (Dragon Skin 10 NV, Smooth-On, Macungie PA) mixed with 0.4 cc of tissue-colored pigment (Silc Pig Flesh Tone, Smooth-On, Macungie PA) poured into a 21.5 × 21.5 × 2.5 cm3 mold. A color image of the phantom is shown in Figure 1(c). The optical properties of this phantom were measured using a spatial frequency domain imaging (SFDI) system (Reflect RS, Modulim Inc., Irvine, CA), and the absorption and reduced scattering coefficients and are shown in Figure 1(c) as a function of wavelength. A Clinac 2100CD accelerator (Varian Medical Systems, Palo Alto CA) was used to irradiate the phantom from below with 6 MV x-rays using a 15 × 15 cm2 field and the gantry at 180°. A mirror was placed 25 cm above the phantom at a 45° angle to direct the Cherenkov light towards the camera, which was placed at a distance of 2 m from the mirror, for a total phantom-to-camera distance of 2.25 m. This corresponded to a projected square pixel size of 0.375 mm as measured using an image of a ruler; this was the physical distance in the image plane represented by one pixel. Data was taken with online background subtraction and darkfield correction, and a flat-field correction was applied in post processing.
2.D. Chest Phantom Cherenkov Imaging
An anthropomorphic chest phantom was created using the same ingredients as the square tissue phantom above and irradiated to simulate a breast treatment. The right breast of the phantom was placed at isocenter, and the linac gantry was rotated to 215° while a 10 × 10 cm2 field of 6 MV x-rays was used to irradiate the phantom. A total of 100 frames were acquired by both cameras, which were placed at a distance of 2.25 m from isocenter, the same distance used to measure the NPS. The same 50 mm f/2.8 lens was used on each camera. The CMOS and intensifier gain settings used were the same as the highest settings used for each camera in the DQE calculations. Data was taken with online background subtraction and darkfield correction, both with and without 5-frame temporal median filtering and 5 × 5-pixel spatial median filtering in order to compare subjective image quality between the two cameras.
2.E. Measurement of Detective Quantum Efficiency
The equation used to calculate DQE in this study is given by19
| (2) |
where is the average pixel count per frame in the Cherenkov image and is the incident photon fluence on the detector measured behind the lens, at the photocathode. The following sections describe the experimental procedures used to measure the parameters in this equation.
2.E.1. Linearity of System Response
In order to justify the use of the above DQE formalism, the pixel response of the system was tested for linearity with incident fluence. For simplicity, this was achieved by placing a variable output LED panel behind a diffuse plastic layer, above which a power meter (S120C, Thorlabs, Newton NJ) was fixed facing the panel. The camera was placed in a completely dark room at a fixed distance of 1 meter from the panel and focused to the emission plane. After the acquisition of a darkfield image, the output of the LED board was varied, and optical power was measured at a fixed location by the power meter. At each of nine different output levels, an image stack of 50 frames was acquired using both the Gen3 and Gen2+ cameras and the average illuminated pixel value within a large ROI corresponding to the LED panel in each frame was computed. These values are plotted against the optical power measured by the power meter in Figure 2. R2 values for linear fits to both datasets were found to be > 0.99.
Figure 2.
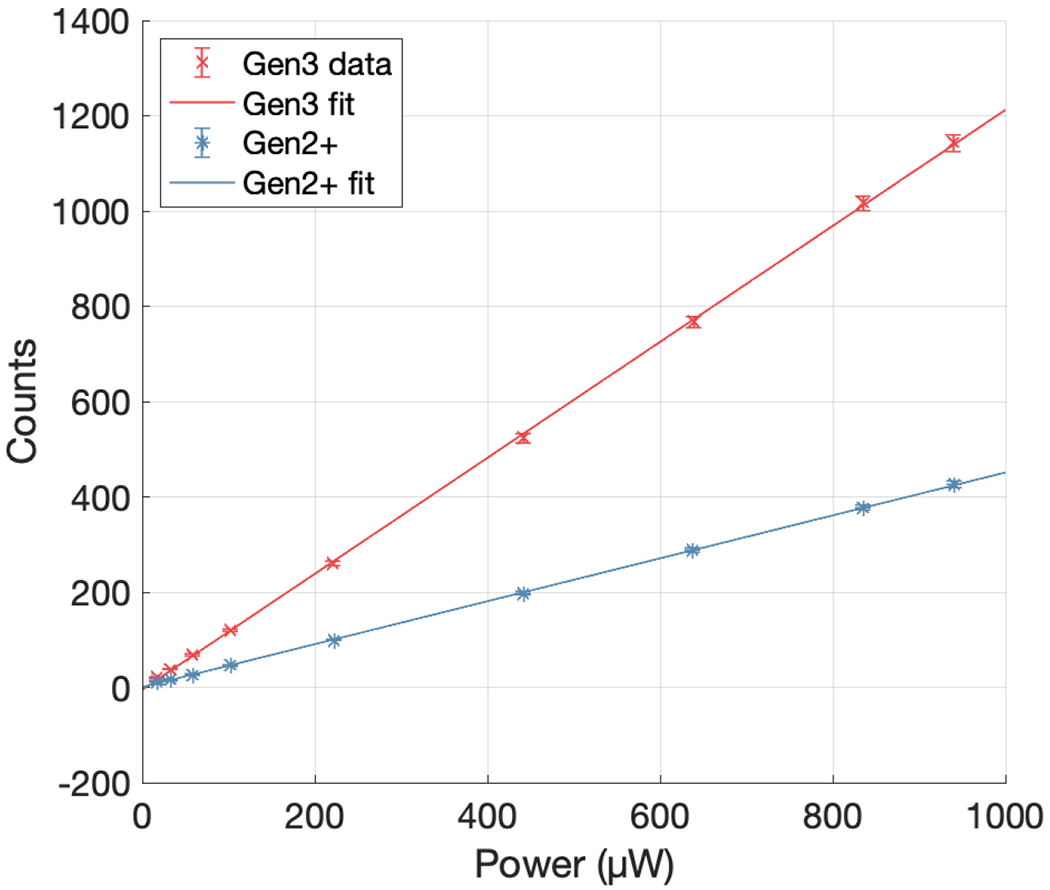
Pixel response of both the Gen3 and Gen2+ cameras to variation in incident light with power measured in the emission plane.
2.E.2. Incident Photon Fluence Calibration
Since Cherenkov radiation is emitted as a broadband spectrum further attenuated by tissue optical properties, estimating spectral photon fluence can become difficult and patient dependent. However, owing to the relatively flat spectral response of both intensifiers in red spectral range (see inset of Fig. 1), the number of Cherenkov photons was estimated by calibrating the camera response to a monochromatic source, and then applying this response (photons per count) to the Cherenkov images. The pixel intensity of acquired single-frame, darkfield-subtracted images was then scaled by a factor k yielding number of photons per pixel, :
| (3) |
The scaling factor was determined during a reference measurement by relating the measured image intensity to corresponding radiant energy per pixel, , divided by photon energy . Using a radiant power reading of an independently calibrated power meter with sensitive area , the radiant energy per pixel area per one frame was calculated by the formula
| (4) |
where is the total duration of light collection period of one frame. In this case, does not correspond to a CMOS sensor exposure time , but it rather represents a total intensifier gate-on time within one frame. Assuming gate frequency and gate pulse duration was determined using
| (5) |
This calibration procedure assumed that the photosensitive area of camera is illuminated by a constant wave (CW), monochromatic diffuse light.
In our calibration experiment, a CW, 635 nm ( = 3.10×10⁻¹⁹ J) laser beam (COMPACT, World Star Tech, Canada) was diffused by an integrating sphere (SSL 1000, Labsphere, NH), generating irradiance of 45 μW/cm2 at distance of 1 m, as measured by an optical power meter (S120C, Thorlabs, Newton NJ) ( = 3.20 ×10⁻⁷ W, = 70.9 mm2). The camera without the imaging lens was placed at the same 1 m distance from integrating sphere window to photocathode surface, and the intensifier was triggered at f = 360 Hz repetition rate of = 1 μs pulses. The exposure time was set to = 51 ms.
2.E.3. Modulation Transfer Function
The MTF was measured with the slanted edge method using the ImageJ Slanted Edge MTF plugin20,21. In accordance with current methods for measurement of MTF for camera systems, the slanted edge was imaged from a distant target21. Image stacks were acquired of a high contrast edge at 10° from vertical, created using a stripe of blackout tape placed over a portion of the tissue phantom during irradiation in order to absorb the Cherenkov light generated beneath it. Two image stacks with a total of 100 frames each were acquired for each of the two intensifiers used; one raw stack, and one stack with online 5-frame temporal median filtering and 5 × 5-pixel spatial median filtering enabled to reflect the common clinical use case. The frames in the stacks were averaged, and the MTF was calculated for both cameras. The dimension of the frequency axis was calibrated using the projected pixel size on the imaging plane.
2.E.4. Noise Power Spectrum
The calculation of NPS used in this study generally followed the protocol outlined in the IEC 62220-1 standard13, with some adjustments. A total of 100 frames were acquired in each image stack, and the region of the image containing the uniformly irradiated phantom was isolated by cropping each frame to a size of 400 × 400 pixels. This cropped region, consisting of the entire tissue phantom shown in Figure 1(c), was separated into 100 × 100 pixel ROIs with an overlap of 50 pixels in each direction, for a total of 49 ROIs. In each of these ROIs, the two-dimensional NPS was calculated using
| (6) |
Where is the projected pixel size in the imaging plane, is the dimension of each ROI (100 pixels), is the number of overlapping ROIs, is the cropped image frame containing the intensity data from the uniformly irradiated phantom, and is a two-dimensional second-order polynomial fit to to remove low-frequency trends, as described in the IEC 62220-1 standard. After this two-dimensional NPS was calculated, it was radially averaged to produce a one-dimensional NPS22. The curves produced from each frame were then averaged together to produce the final one-dimensional NPS for each image stack.
Datasets were acquired at five separate intensifier gain settings, along with eight different analog CMOS gain settings, for a total of 40 separate datasets for each camera. Each of these 40 datasets were acquired with online 5-frame temporal median filtering and 5 × 5-pixel spatial median filtering enabled in addition to the raw data, meaning each dataset had two separate image stacks. The NPS was calculated using the protocol outlined above for each of these image stacks, and the average pixel count per frame, in each acquisition was calculated and stored for each corresponding NPS curve.
3. RESULTS
3.A. Chest Phantom Imaging Comparison
Figure 3 shows six images of the same chest phantom being irradiated, with different cameras and acquisition settings. All images are shown on the same color bar, which illustrates the higher number of counts from the Gen3 system at its maximum gain setting. The unfiltered and filtered single-frame images represent frame 50 of 100 of the acquisition for each camera, while the frame-averaged image is the mean of all 100 frames acquired.
Figure 3.
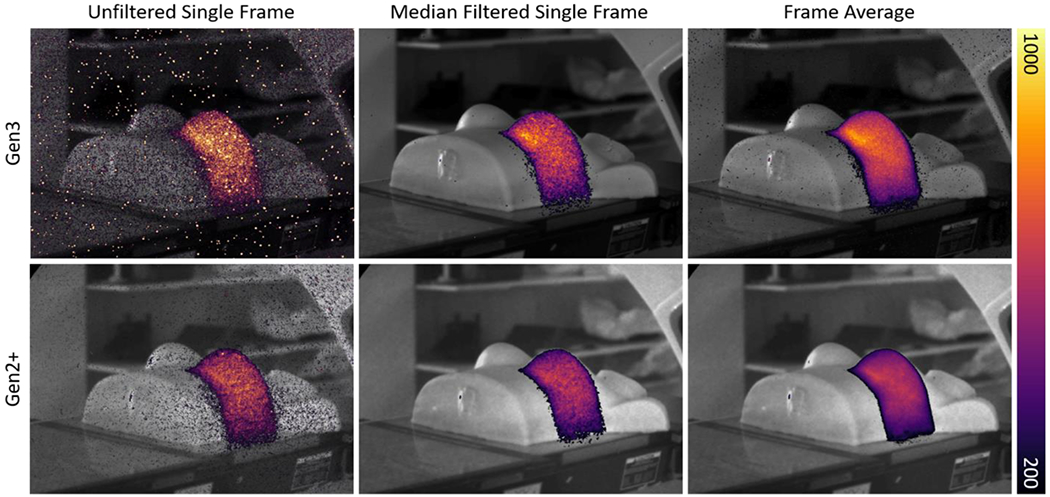
Cherenkov images of a chest phantom taken with both Gen2+ and Gen3 systems with three different levels of processing showing an unfiltered single frame, spatial and temporal median filtered single frame image, and an average image from all the 100 frames.
3.B. Incident Photon Fluence Calibration
Measuring an average of = 700 counts per pixel in images captured by the Gen3 system during calibration experiment, Eqs. 3 – 5 were used to estimate the scaling factor = 2.78 × 10⁻² photons per count, corresponding to approximately 36 counts per photon. This factor was then used to scale the Cherenkov emission images captured by the same system, yielding an average Cherenkov photon fluence of 138 photons/mm2, taking into account the square pixel dimension of 0.375 mm. As mentioned before, the area here is related to the imaging plane.
3.C. Modulation Transfer Function
Figure 4 shows the MTF curves calculated from the phantom edge during irradiation for both camera types, with and without median filtering applied as described in section 2.E.2. Defined at 10% of the MTF, the limiting spatial frequencies of the Gen3 and Gen2+ system without filtering were 0.52 mm−1 and 0.31 mm−1, respectively. With filtering, these values decreased to 0.50 mm−1 and 0.26 mm−1.
Figure 4.
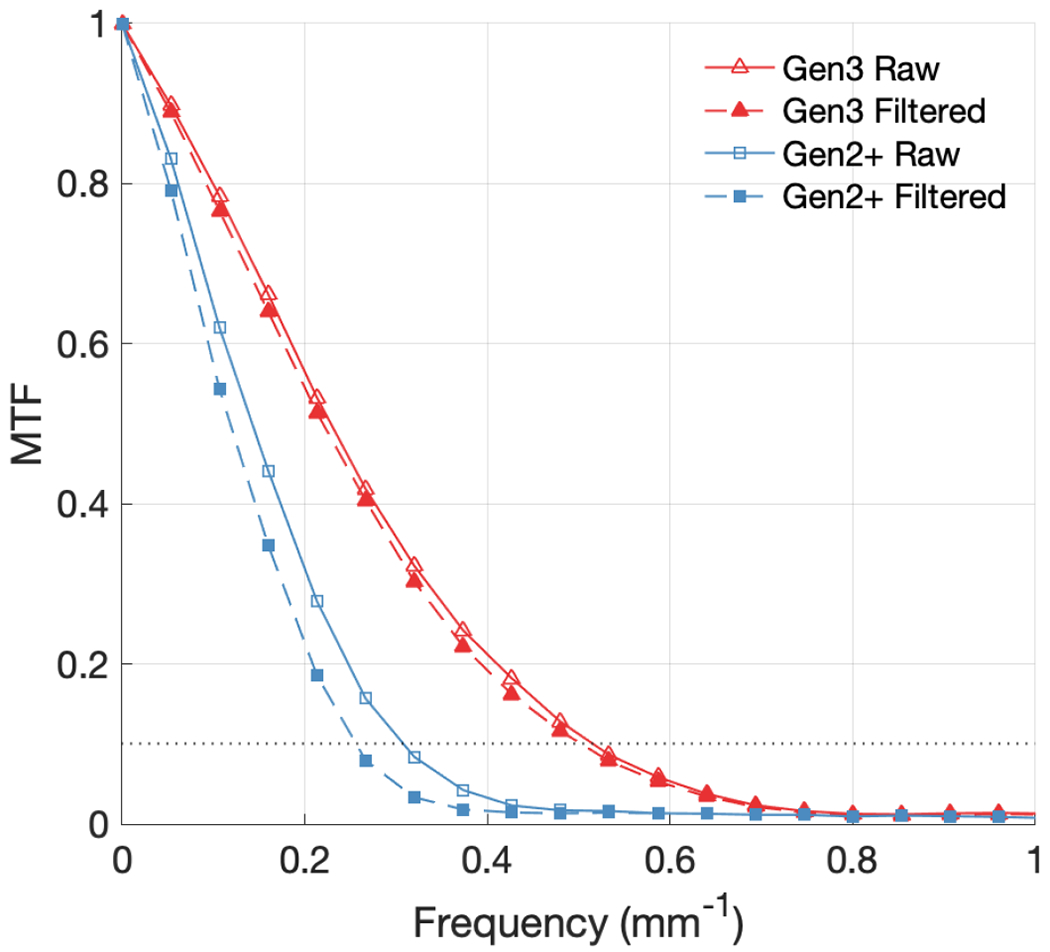
MTF curves compared for Gen3 and Gen2+ systems, with and without median filtering. The dotted line represents 10% of the MTF.
3.D. Noise Power Spectrum
Figure 5 shows the two-dimensional darkfield NPS for both systems. For the Gen3 system, NPSmax was 2.5 × 104 mm2 occurring at = ± 0.3 mm−1 [Figure 5(a)], while for the Gen2+ system, NPSmax was 1.6 × 104 mm2 occurring at = ± 0.07 mm−1 [Figure 5(b)]. The increased NPS along the y-axis corresponded to the electronic readout noise of the CMOS chip. Figure 6 shows the corresponding uniform signal two-dimensional NPS at maximum gain settings for both systems. Both NPS values peaked at low spatial frequencies close to zero, and exhibited a radial symmetry, with the exception that the Gen2+ system showed increased NPS intensity along the y-axis. This was likely due to the fact that electronic noise was a larger portion of the NPS in the Gen2+ system, since there is far less susceptibility to x-ray noise.
Figure 5.
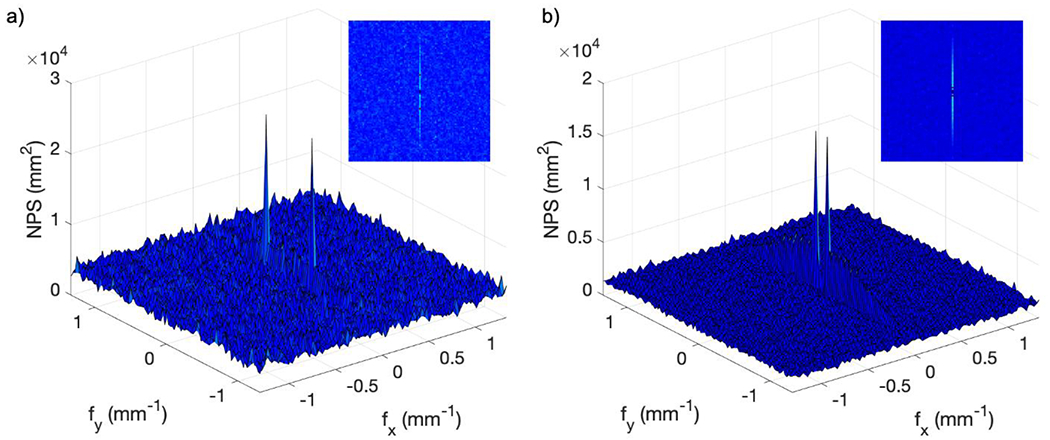
Two dimensional darkfield NPS from raw data: (a) Gen3 system; (b) Gen2+ system.
Figure 6.
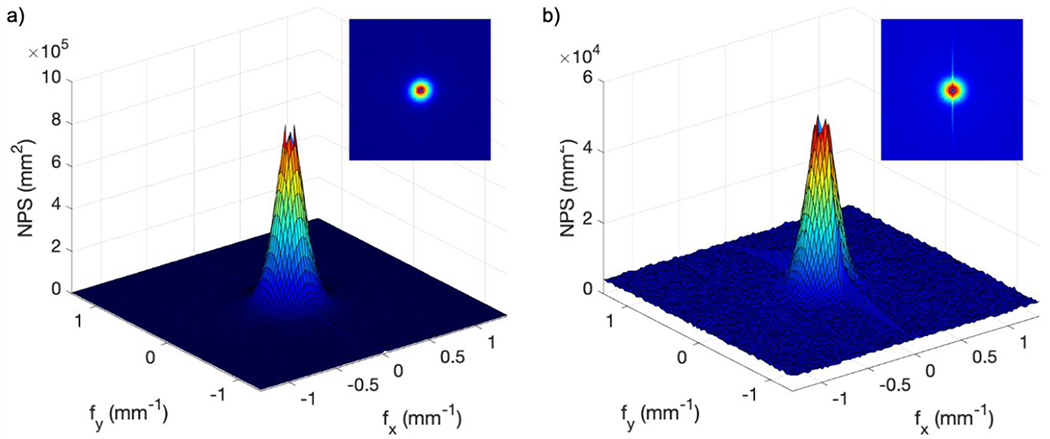
Two dimensional flat illumination NPS from raw data: (a) Gen3 system; (b) Gen2+ system.
Figure 7 shows the 1-D noise power spectrum for both cameras at different CMOS gain settings with each camera held at the maximum intensifier setting, while Figure 8 makes the same comparison at different intensifier gain settings with each camera at the maximum CMOS gain setting. Both figures contain noise information from the raw, unfiltered data, and error bars represent one standard deviation from the temporal mean. The gain values have been remapped from voltages to arbitrary proportional units to average pixel counts in the images, normalized to the image with the highest gain setting, for both the CMOS and intensifier gains. As expected, the NPS increased in intensity across the range of spatial frequencies with both increasing CMOS gain and increasing intensifier gain for both cameras. Additionally, the intensity of the NPS from the Gen2+ system was much lower compared to that from the Gen3 system, with NPSmax values at the highest gain settings of 9.1 × 104 mm2 [Figures 6(b) and 7(b)] and 1.3 × 106 mm2 [Figures 7(a) and 8(a)] respectively, representing a factor of 14 decrease in noise for the Gen2+ system.
Figure 7.
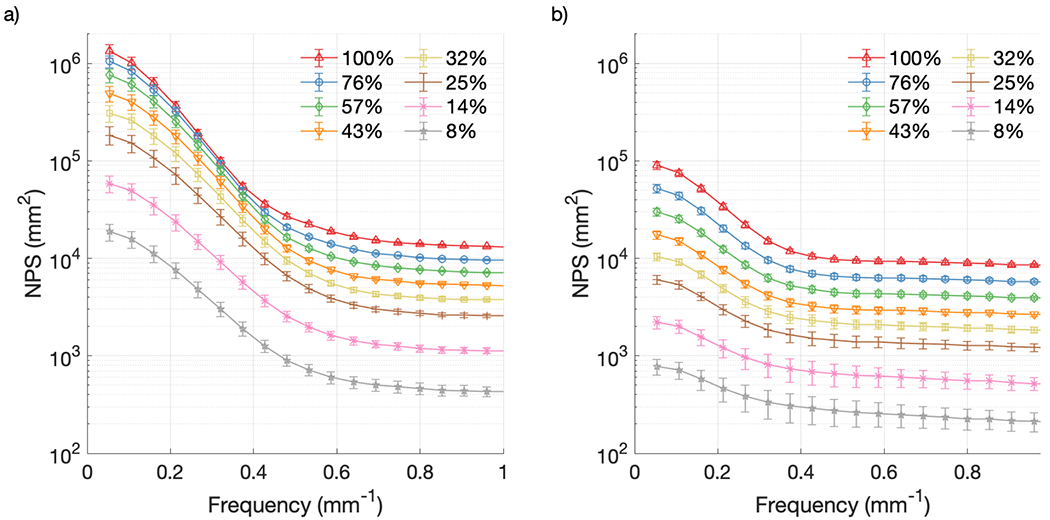
NPS from raw data at various CMOS gain settings: (a) Gen3 system; (b) Gen2+ system.
Figure 8.
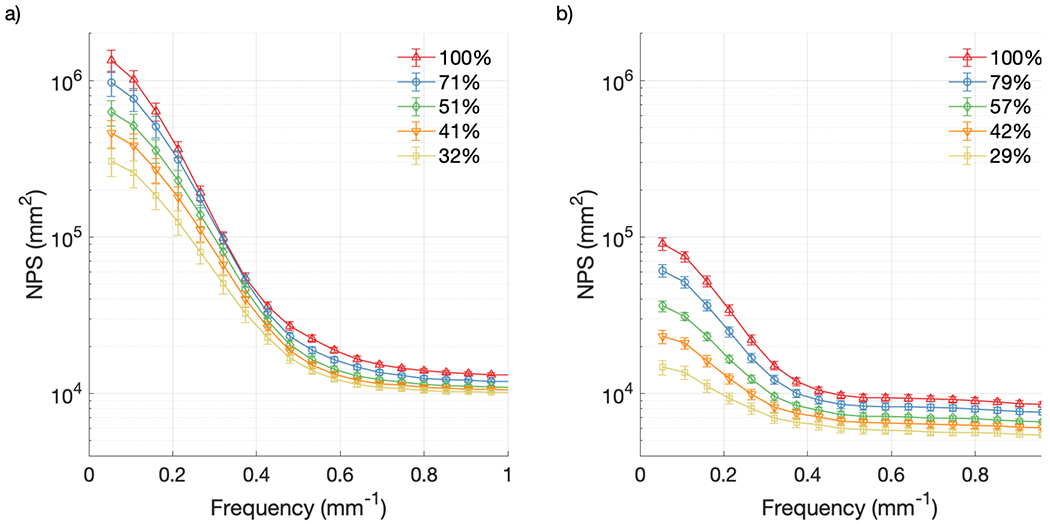
NPS from raw data at various intensifier gain settings: (a) Gen3 system; (b) Gen2+ system.
Figure 9 compares the NPS curves for both cameras for the two different levels of image processing performed on the data, at the highest CMOS and intensifier gain settings again with error bars representing one standard deviation from the temporal mean. One noticeable characteristic of the NPS curves calculated from the filtered data is the significant removal of white noise, present in the raw NPS curves as a constant noise floor out to high spatial frequencies. The median filtering procedures previously described also yielded an expectedly large decrease in the maximum value of the NPS for both cameras, from 1.3 × 106 mm2 to 1.6 × 105 mm2 for the Gen3 intensifier, and from 9.1 × 104 mm2 to 3.1 × 104 mm2 for the Gen2+ intensifier [Figure 9].
Figure 9.
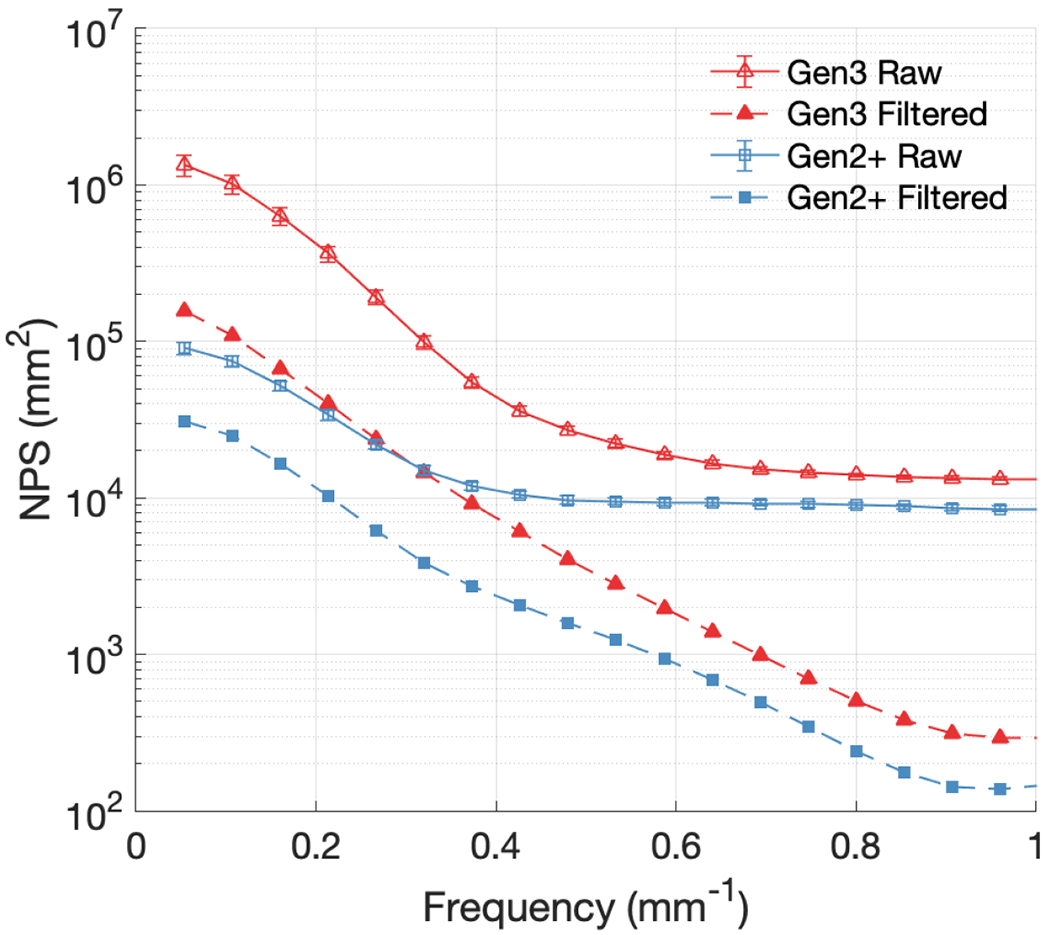
NPS curves compared for Gen3 and Gen2+ systems, with and without median filtering, for the maximum intensifier and CMOS gain settings used.
Tables 1 and 2 display the average pixel count value over all the acquired frames for each CMOS and intensifier gain setting for the Gen 3 and Gen 2+ cameras, respectively, along with one standard deviation from the mean.
Table 1.
Variation of d value with increasing CMOS and intensifier gain settings for the Gen3 camera
| Gain Setting | Mean Counts | Standard Deviation | |
|---|---|---|---|
| CMOS Gain | 100% | 838.96 | 69.45 |
| 76% | 648.65 | 31.08 | |
| 57% | 493.95 | 22.94 | |
| 43% | 370.70 | 18.98 | |
| 32% | 279.40 | 14.05 | |
| 25% | 210.07 | 11.05 | |
| 14% | 118.52 | 6.34 | |
| 8% | 66.42 | 3.67 | |
|
| |||
| Intensifier Gain | 100% | 838.96 | 69.45 |
| 71% | 597.28 | 48.95 | |
| 51% | 427.18 | 37.30 | |
| 41% | 341.16 | 29.32 | |
| 32% | 264.47 | 20.20 | |
Table 2.
Variation of d value with increasing CMOS and intensifier gain settings for the Gen2+ camera
| Gain Setting | Mean Counts | Standard Deviation | |
|---|---|---|---|
| CMOS Gain | 100% | 510.57 | 40.29 |
| 76% | 393.96 | 33.83 | |
| 57% | 296.48 | 22.46 | |
| 43% | 223.39 | 18.71 | |
| 32% | 169.16 | 8.39 | |
| 25% | 126.94 | 6.40 | |
| 14% | 71.72 | 3.61 | |
| 8% | 40.59 | 2.07 | |
|
| |||
| Intensifier Gain | 100% | 510.57 | 40.29 |
| 79% | 405.05 | 35.64 | |
| 57% | 289.87 | 15.39 | |
| 42% | 213.55 | 15.98 | |
| 29% | 146.90 | 11.39 | |
3.E. Detective Quantum Efficiency
As shown in Figures 10 and 11, DQE increased with increasing CMOS and intensifier gain for both cameras. Error bars in the figures are the result of propagating the corresponding uncertainty from Figures 7 and 8. At the lowest spatial frequency, the DQE values at the highest CMOS and intensifier gain settings were 0.31% [Figures 10(a) and 11(a)] and 1.44% [Figures 10(b) and 11(b)], for the Gen3 and Gen2+ intensifiers, respectively. However, at 0.4 mm−1, the DQE values became 0.54% [Figures 10(a) and 11(a)] and 0.03% [Figures 10(b) and 11(b)], respectively. While the Gen2+ system had a monotonically decreasing DQE, the Gen3 system showed a mid-frequency bump around 0.35 mm−1. This was attributed to the more rounded off NPS curves for the Gen3 system [Figures 7(a) and 8(a)], due to the increased noise response from the detector compared to the Gen2+ system [Figures 7(b) and 8(b)], which is also visible in Figure 3.
Figure 10.
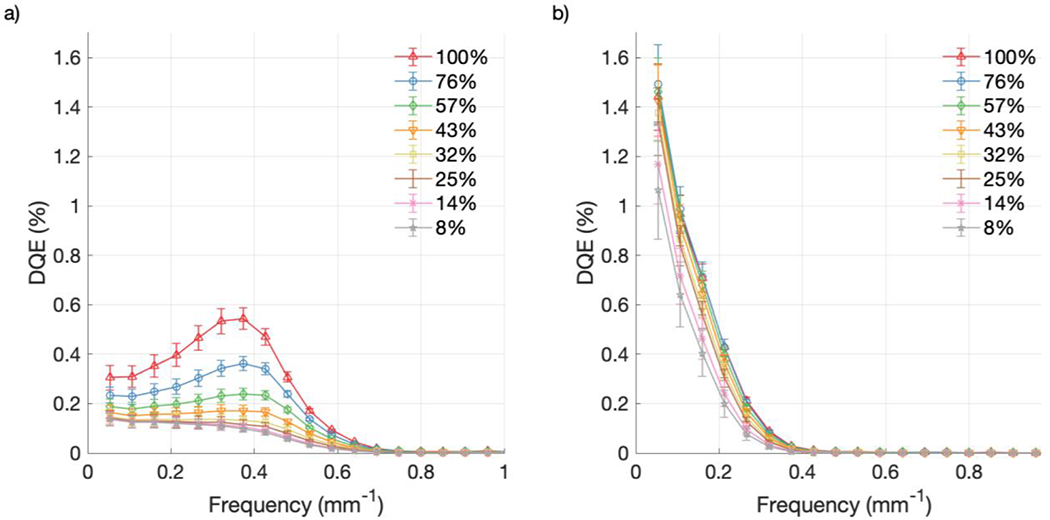
DQE from raw data at various CMOS gain settings: (a) Gen3 system; (b) Gen2+ system.
Figure 11.
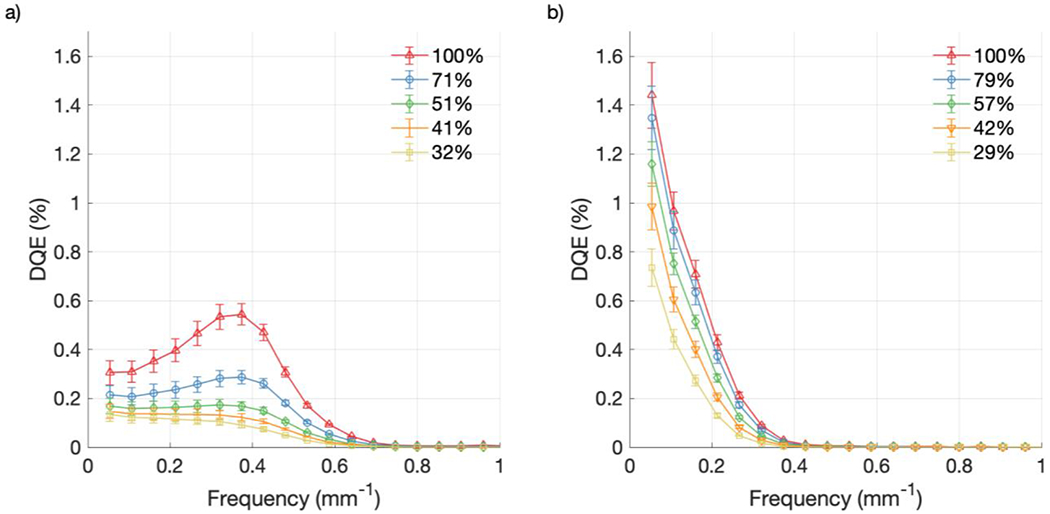
DQE from raw data at various intensifier gain settings: (a) Gen3 system; (b) Gen2+ system.
Figure 12 shows the DQE curves for both raw and median filtered images, from both systems, corresponding to the NPS curves in Figure 9 and shown again with propagated uncertainty. In order to account for the increased fluence contributing to the filtered images from the 5-frame window, the value of was scaled up by a factor of 5 for the filtered datasets. For the Gen3 system, applying the spatial and temporal median filter improved the DQE at low-frequency from 0.31% to 0.47% [Figure 12], despite the factor five increase in the denominator, as it helped to remove the spot noise generated from MV x-rays impinging on the detector. The Gen3 filtered curve also had the mid-frequency bump shifted from around 0.35 mm−1 to around 0.25 mm−1 [Figure 12], as the 5-pixel spatial filter blurred out higher frequency details, also indicated by the decreased MTF [Figure 4]. However, the Gen2+ system behaved oppositely, with filtering decreasing the low-frequency DQE from 1.44% to 0.75% [Figure 12]. This was attributed to the Gen2+ system having less susceptibility to incident noise, leading the increased fluence from filtering to outweigh the benefit of noise removal, thereby lowering DQE at all spatial frequencies.
Figure 12.
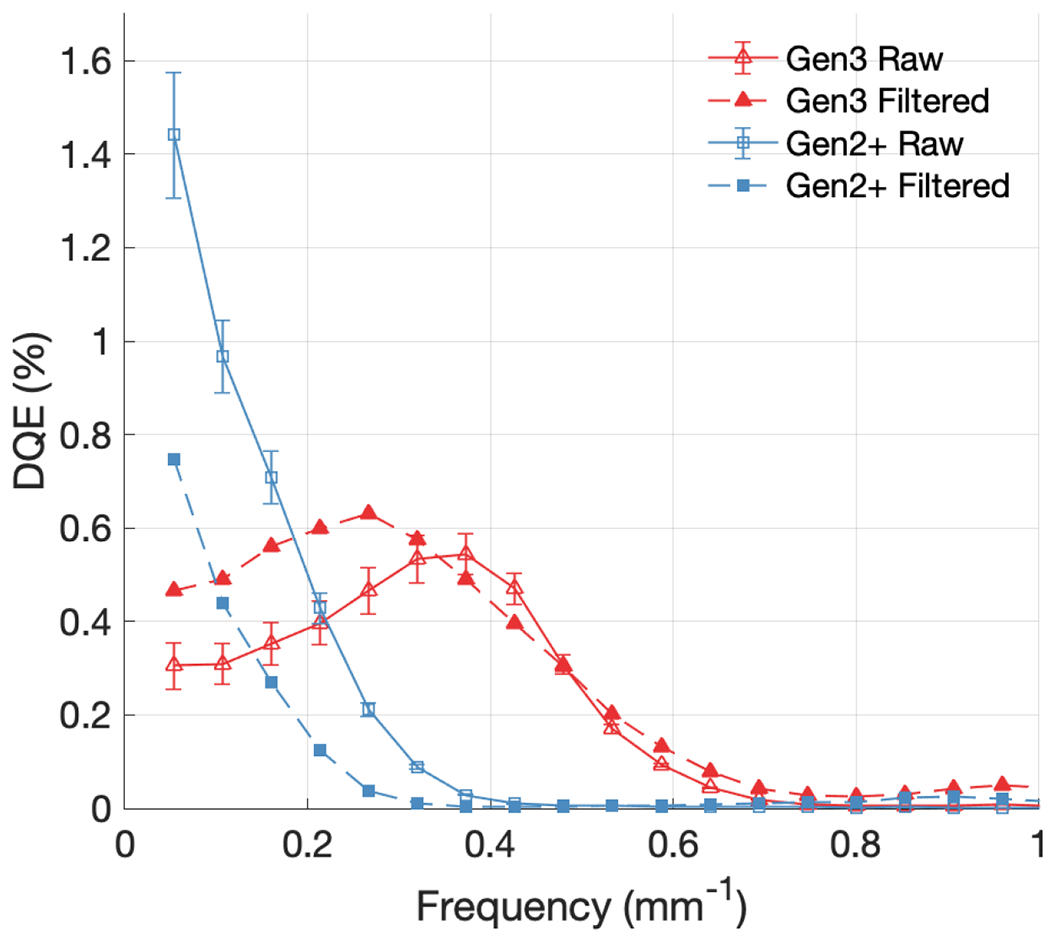
DQE curves compared for Gen3 and Gen2+ systems, with and without median filtering.
4. DISCUSSION
Intensified CMOS cameras time-gated to linac pulses provide an affordable and efficient way to image Cherenkov emission from tissue and phantoms down to the single photon level, without altering clinical workflow. This study demonstrates the first formal assessment of the imaging performance of these systems by adapting existing protocols to measure DQE for an optical imaging system detecting Cherenkov emission.
Figure 3 illustrates the visual differences in image quality based on camera selection and processing. Background images did appear slightly sharper from the Gen3 system, especially at the edges of objects, which agreed with the higher MTF [Figure 4]. The unfiltered single frame image from the Gen3 system had very high spot noise, while the Gen2+ system was able to mitigate x-ray noise to a point where the unfiltered image is quite clear. Important to note is that even though median filtering could achieve this result as well, it came at the cost of inevitable decrease in sharpness and spatial resolution, as well as decreased DQE for the Gen2+ system [Figure 12]. The frame averaged image from the Gen3 system still had noticeable background noise outside the beam, while the image from the Gen2+ system was free of almost all background noise, despite the lack of any filtering applied. While cumulative summed or averaged images are often used for analysis in Cherenkov imaging studies, this work aimed to quantify imaging performance for a single frame’s worth of exposure time, for wider application to time-dependent acquisitions.
As the measurement of incident photon fluence was based on a calibration to a monochromatic source, there was an inherent source of uncertainty in the DQE scaling due to the approximation of the power from the broadband Cherenkov emission spectrum. The challenge of directly measuring the wavelength-dependent spectral fluence, and subsequently the energy-averaged fluence, lay in the inherent variability of Cherenkov sources due to tissue or phantom optical properties. However, as the wavelength chosen for calibration of 635 nm was in the bright part of the Cherenkov emission spectrum from tissue, and the quantum efficiency of each photocathode was relatively flat in this portion of the spectrum [Figure 1(b)], this monochromatic estimate should not have had a large effect on the absolute value of the DQE, and had no effect on the shape of the curve as a function of spatial frequency.
The spatial resolution of the two cameras tested was an important parameter to quantify in the context of the scene being imaged. The setup used in this study was designed to simulate the common use case of ceiling mounted cameras imaging patients from a few meters away, with a wide field of view. As such, the 50 mm lens and aperture setting of f/2.8 provided a good balance of depth of field and field of view, as well as amount of light detected. With these settings, the limiting spatial resolutions achieved ranged from 0.52 mm−1 and 0.26 mm−1, with the Gen2+ system having worse contrast transfer at higher frequencies. However, this result could be greatly improved when optimizing lens and aperture for the use case, such as scintillation imaging for water tank QA.9
Across the board, noise performance was substantially improved with the use of the Gen2+ intensifier as compared to the Gen3 intensifier. The difference in noise levels between the intensifiers shown in Figures 7 – 9 agrees with results published by Bruza et al. showing an order of magnitude reduction in stray x-ray noise with the Gen2+ system relative to the Gen3 system16. Additionally, increases in the temporal deviation of pixel count values as a function of both gain settings were consistent with the increase in for both cameras. Meanwhile, the average percent deviations for the Gen 3 and Gen 2+ cameras were 6.57% and 6.91% respectively, indicating similar temporal response between the two. In a future study, it would be beneficial to isolate and characterize the electronic noise components of the system in order to better understand the different contributions of noise types to the cumulative NPS.
Comparing the NPS and DQE curves for each camera at different CMOS and intensifier gains gives a good view of how quickly noise increases when increasing the signal [Figures 7 and 8], and thus how much is gained by increasing these settings [Figures 10 and 11]. Figures 10 and 11 show that DQE increases with both gain settings for both cameras, indicating that higher noise due to increased gain did not seem to outpace the corresponding increased signal strength. The difference in the shape of the DQE curves for the two systems seemed to be a direct result of the difference in the two squared MTF curves combined with sharp decrease in NPS of Gen3 system [Figure 9], with the inflection point in the curve at around 0.3 mm−1 corresponding to the maximum DQE value at the same frequency [Figure 12].
Compared to x-ray imaging systems, these DQE values were quite low. While in many systems low DQE contributes to signal loss at different detector stages, for these Cherenkov imaging systems additional sources of noise were believed to have a major negative impact on the measured DQE values. Intensified optical imaging systems exhibit pixel saturation when struck by stray x-rays, negatively impacting the NPS. As these x-rays contribute no image information, the DQE decreased in this study as a result. Additionally, there is noise added by the intensifier in the amplification process which allows variation in intensifier gain to impact the measured DQE values23. Care was also taken to use this system as it is used in clinical imaging, with the room lights on and online background subtraction enabled, as it mirrored the real use case of the system and reflected the worst-case scenario regarding background noise; likely the measured DQE could be improved when imaging in total darkness.
It is also important to realize the limitation of the way DQE is defined in the context of imaging visible Cherenkov signals, and that optical photons were used as input quanta rather than high energy x-ray quanta as in radiography DQE studies. Finally, it is worth noting that the DQE presented here did not reflect only the standard quantum efficiency of detector, but more so it reflected the different noise contributions from the intensifier and CMOS sensor. While it was difficult to separate the different sources of noise contributing to the final NPS, the computed DQE curves have provided valuable information about image formation efficiency and quality in each system.
Another noteworthy point is that the use of the median filter, which is a nonlinear filter, impacts the interpretation of the MTF and DQE calculations for acquisitions where it is applied, since these formalisms are derived from linear systems theory. However, it was included in this study as a comparison to the results from the raw data acquired in order to characterize the application of this formalism as an imaging performance metric in the context of Cherenkov imaging systems.
While this work demonstrated this technique applied to images of Cherenkov emission from a phantom surface, the methodology developed here could be extended to other applications of time-gated or intensified imaging in radiotherapy, such as scintillation imaging or Cherenkov-excited luminescence imaging. This would allow for development of imaging systems guided by noise and spatial frequency response characteristics in order to optimize signal to noise for a variety of feature scales.
CONCLUSIONS
This study provided valuable insights about the imaging performance of intensified Cherenkov imaging cameras, including spatial resolution, noise signature, and DQE. This formal analysis comparing both systems demonstrated that DQE can become a universal metric for future optimization and inter-system comparison of Cherenkov and other single-photon sensitive cameras.
ACKNOWLEDGEMENTS
The work completed in this project has been sponsored by National Institutes of Health research grants R01EB023909 and R44CA199681. The authors acknowledge the Irradiation Shared Resource at the Norris Cotton Cancer Center at Dartmouth with NCI Cancer Center Support Grant 5P30 CA023108-41.
CONFLICTS OF INTEREST / DISCLOSURES
J. C. Farwell and V. Krishnaswamy are employees and B. Pogue is the president and co-founder of DoseOptics LLC, manufacturing the C-Dose cameras provided for this research. P. Bruza is the principal investigator in SBIR subaward B02463 (prime award NCI R44CA199681, DoseOptics LLC). D. Alexander reports receiving consulting fees from DoseOptics LLC outside of this work.
REFERENCES
- 1.Jarvis LA, Zhang R, Gladstone DJ, et al. Cherenkov video imaging allows for the first visualization of radiation therapy in real time. Int J Radiat Oncol Biol Phys. 2014;89(3):615–622. doi: 10.1016/j.ijrobp.2014.01.046 [DOI] [PubMed] [Google Scholar]
- 2.Hachadorian R, Bruza P, Jermyn M, et al. Correcting Cherenkov light attenuation in tissue using spatial frequency domain imaging for quantitative surface dosimetry during whole breast radiation therapy. J Biomed Opt. 2018;24(07):1. doi: 10.1117/1.jbo.24.7.071609 [DOI] [PMC free article] [PubMed] [Google Scholar]
- 3.Alexander DA, Tendler II, Bruza P, et al. Assessment of imaging Cherenkov and scintillation signals in head and neck radiotherapy. Phys Med Biol. Published online 2019. doi: 10.1088/1361-6560/ab25a3 [DOI] [PMC free article] [PubMed] [Google Scholar]
- 4.Beddar S, Archambault L, Sahoo N, et al. Exploration of the potential of liquid scintillators for real-time 3D dosimetry of intensity modulated proton beams. Med Phys. 2009;36(5):1736–1743. doi: 10.1118/1.3117583 [DOI] [PMC free article] [PubMed] [Google Scholar]
- 5.Pönisch F, Archambault L, Briere TM, et al. Liquid scintillator for 2D dosimetry for high-energy photon beams. Med Phys. 2009;36(5):1478–1485. doi: 10.1118/1.3106390 [DOI] [PMC free article] [PubMed] [Google Scholar]
- 6.Robertson D, Hui C, Archambault L, Mohan R, Beddar S. Optical artefact characterization and correction in volumetric scintillation dosimetry. Phys Med Biol. 2013;59(1):23–42. doi: 10.1088/0031-9155/59/1/23 [DOI] [PMC free article] [PubMed] [Google Scholar]
- 7.Andreozzi JM, Mooney KE, Brůža P, et al. Remote Cherenkov imaging-based quality assurance of a magnetic resonance image-guided radiotherapy system. Med Phys. 2018;45(6):2647–2659. doi: 10.1002/mp.12919 [DOI] [PubMed] [Google Scholar]
- 8.Tendler I, Brůža P, Andreozzi J, et al. Rapid Multisite Remote Surface Dosimetry for Total Skin Electron Therapy: Scintillator Target Imaging. Int J Radiat Oncol Biol Phys. 2019;103(3):767–774. doi: 10.1016/j.ijrobp.2018.10.030 [DOI] [PMC free article] [PubMed] [Google Scholar]
- 9.Ashraf MR, Bruza P, Pogue BW, et al. Optical Imaging Provides Rapid Verification of Static Small Beams, Radiosurgery and VMAT Plans with millimeter resolution. Med Phys. 2019;0(ja). doi: 10.1002/mp.13797 [DOI] [PMC free article] [PubMed] [Google Scholar]
- 10.Brannen E, Olde GL. The Response of Organic Scintillators to Electron Energy Deposited in Them. Radiat Res. 1962;16(1):1–6. doi: 10.2307/3571123 [DOI] [PubMed] [Google Scholar]
- 11.Zhang R, Glaser AK, Gladstone DJ, Fox CJ, Pogue BW. Superficial dosimetry imaging based on Čerenkov emission for external beam radiotherapy with megavoltage x-ray beam. Med Phys. 2013;40(10). doi: 10.1118/1.4821543 [DOI] [PMC free article] [PubMed] [Google Scholar]
- 12.Ranger NT, Samei E, Dobbins JT, Ravin CE. Assessment of Detective Quantum Efficiency: Intercomparison of a Recently Introduced International Standard with Prior Methods. Radiology. 2007;243(3):785–795. doi: 10.1148/radiol.2433060485 [DOI] [PMC free article] [PubMed] [Google Scholar]
- 13.International Electrotechnical Commission. IEC 62220-1: Medical Electrical Equipment – Characteristics of Digital X-Ray Imaging Devices – Part 1: Determination of the Detective Quantum Efficiency. 1.0.; 2003. [Google Scholar]
- 14.Cunningham IA, Shaw R. Signal-to-noise optimization of medical imaging systems. In: ; 1999. doi: 10.1364/JOSAA.16.000621 [DOI] [Google Scholar]
- 15.Sharp P, Barber DC, Brown DG, et al. Report 54: Medical Imaging - The Assessment of Image Quality. J Int Comm Radiat Units Meas. 2016;os28(1):NP–NP. doi: 10.1093/jicru/os28.1.Report54 [DOI] [Google Scholar]
- 16.Brůža P, Pétusseau A, Tisa S, et al. Imaging Cherenkov photon emissions in radiotherapy with a Geiger-mode gated quanta image sensor. Opt Lett. 2019;44(18):4546. doi: 10.1364/OL.44.004546 [DOI] [PMC free article] [PubMed] [Google Scholar]
- 17.LaRochelle EPM, Shell JR, Gunn JR, Davis SC, Pogue BW. Signal intensity analysis and optimization for in vivo imaging of Cherenkov and excited luminescence. Phys Med Biol. 2018;63(8):085019. doi: 10.1088/1361-6560/aab83b [DOI] [PMC free article] [PubMed] [Google Scholar]
- 18.Hoess P, Fleder K. Time-integrated phosphor behavior in gated image intensifier tubes. In: Image Intensifiers and Applications II. Vol 4128. International Society for Optics and Photonics; 2000:23–28. doi: 10.1117/12.405878 [DOI] [Google Scholar]
- 19.Bushberg JT, ed. The Essential Physics of Medical Imaging. 3rd ed. Wolters Kluwer Health/Lippincott Williams & Wilkins; 2012. [Google Scholar]
- 20.Mitja Carles. Slanted Edge MTF. Published 2011. Accessed September 18, 2019. https://imagej.nih.gov/ij/plugins/se-mtf/index.html
- 21.Estribeau M, Magnan P. Fast MTF measurement of CMOS imagers using ISO 12333 slanted-edge methodology. In: Chatard J-P, Dennis PNJ, eds. ; 2004:243. doi: 10.1117/12.513320 [DOI] [Google Scholar]
- 22.Aufrichtig Richard, Su Yu, Cheng Yu, Granfors Paul R.. Measurement of the noise power spectrum in digital x-ray detectors. In: Proc. SPIE 4320. doi:doi: 10.1117/12.430934 [DOI] [Google Scholar]
- 23.Bell RL. Noise figure of the MCP image intensifier tube. IEEE Trans Electron Devices. 1975;22(10):821–829. doi: 10.1109/T-ED.1975.18229 [DOI] [Google Scholar]


