Abstract
The temperate bacteriophage A2 forms stable lysogens in Lactobacillus casei. The A2-encoded cI product (CI), which is responsible for maintaining the A2 prophage in the lysogenic state, has been purified. The CI protein, which is a monomer of 25.3 kDa in solution, specifically binds to a 153-bp DNA fragment that contains two divergent promoters, PL and PR. These promoters mediate transcription from cI and a putative cro, respectively. Three similar, although not identical, 20-bp inverted repeated DNA segments (operator sites O1, O2, and O3) were found in this segment. CI selectively interacts with O1, which is placed downstream from the transcription start point of the cro gene, and with O2 and O3, which overlap with the −35 region of the two promoters. Using a heterologous RNA polymerase, we have determined the transcription start points of PL and PR. CI exerts a negative effect on the in vitro transcription of PR by repositioning the RNA polymerase in a concentration-dependent manner. CI, when bound to O1 and O2, enhances the positioning of the RNA polymerase with the PL promoter. Our data indicate that the CI protein regulates the lytic and lysogenic pathways of the A2 phage.
Lysogenic phages regulate their developmental fate by encoding a product (termed CI in the case of phage λ) that acts as a transcriptional regulator. CI binds to two operator regions on the phage genome, designated OR and OL, which are each further divided into three closely spaced binding sites (16 to 18 bp) termed operators OR1/L1 to OR3/L3 (reviewed in reference 27). Interspersed with the operators are two major promoters, PR and PL. In the PR region, the binding of a CI dimer to its highest-affinity binding site (ORI) turns off the PR promoter, repressing the genes that mediate the lytic development of the phage. Furthermore, this interaction stabilizes the association of a second CI dimer to the OR2 site. This activates the PRM promoter, which is divergent from PR, thereby activating the transcription of genes responsible for the maintenance of lysogeny (13, 17, 19, 21, 27). When the repressor concentration becomes high enough to cause occupancy of the OR3 site, the transcription of cI is prevented. This leads to a reduction of repressor concentration which, in turn, provokes its unwinding from OR3 and the resumption of cI expression. The repressor behaves then as an autogenous regulator of its own synthesis that functions positively at low concentrations and negatively at high concentrations (reviewed in reference 27). In other words, the commitment between lytic and lysogenic development is thus critically dependent on the ability of the repressor to discriminate between these different operators.
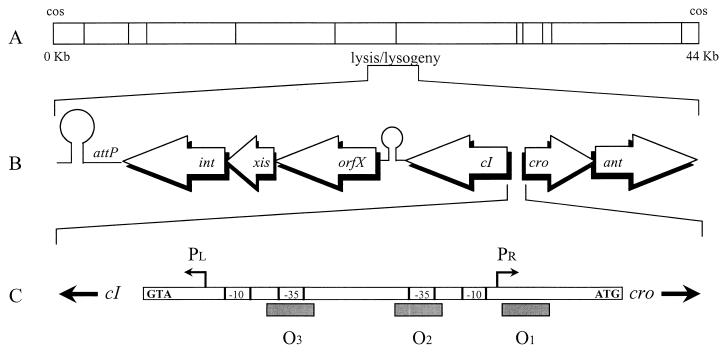
Very little is known about the commitment between lytic and lysogenic development from bacteriophages from gram-positive bacteria. Analysis of the genomes of different lactococcal phages reveals that rlt (24), BK5-T (4), and Tuc2009 (32) code for a product that shows significant homology with the CI repressor of lambdoid phages. Unlike them, the lactococcal phages seem to have only one early region. In the case of phage rlt, this may be subdivided into two regions (O1 and O2) with dyad symmetry (21 bp) separated by a 2-bp spacer, into which the −35 consensus regions of the two divergent promoters are embedded (24). In the case of phage BK5-T, there are three regions (O1 to O3) of dyad symmetry (18 bp) separated by 10- and 24-bp spacers. The putative O1 and O3 sites lie within the −35 and −10 consensus regions, whereas O2 is placed between the two divergent promoters (4). In the case of the temperate bacteriophage A2, which infects Lactobacillus casei and Lactobacillus paracasei strains (16), the CI protein shows significant identity with the CI protein of lambdoid phages. The A2 cI gene encodes a 224-amino-acid polypeptide with a predicted molecular mass of 25,277 Da. It appears to be the central player in the maintenance of the lysogenic state because (i) it is synthesized in lysogenic cultures, presumably blocking the lytic development of superinfecting A2, and (ii) L. casei derivatives containing a chromosomal copy of cI are completely resistant to phage infection. In front of cI there are three regions (O1 to O3) of 20 bp, displaying partial symmetry, that are separated by 26- and 32-bp spacer stretches, respectively (20) (Fig. 1).
FIG. 1.
Schematic representation of the A2 genome showing the location and organization of the development control region. (A) EcoRI physical map of the A2 genome. (B) Organization of its central region. The arrows refer to sequences functionally identified or similar to cI (repressor), orfX (unknown function), xis (putative excisionase), int (integrase), cro (putative homologue of λ cro), ant (putative antirepressor), and attP (site of attachment to the bacterial chromosome). (C) Scheme of the genetic switch region, located in the intergenic stretch between cI and cro. The transcription start sites of the PL and PR promoters and the relative positions of the −10 and −35 hexamers with respect to the three operator sequences (O1 to O3) are indicated.
This paper deals with the molecular characterization of the CI repressor protein of bacteriophage A2 and how it acts to control gene expression.
MATERIALS AND METHODS
Bacterial strains, plasmids, and media.
Escherichia coli XL-1 Blue (5) and DH10B (GIBCO BRL) were used as recipients for plasmid constructions. E. coli BL21(DE3)/pLys was used in expression studies of the genes cloned into plasmid pET11a (31). Plasmids pLys (31) and pUC18 (35) have been previously described.
E. coli was grown and maintained on Luria medium (29). Antibiotic resistance transformants were selected with 100 μg of ampicillin per ml and/or 25 μg of chloramphenicol per ml as appropriate.
DNA manipulations.
Plasmid DNA was obtained by the alkaline lysis method (3) and purified through a CsCl gradient (29). Analytical and preparative gel electrophoresis of plasmid DNA and restriction fragments was carried out in 0.8% (wt/vol) agarose–Tris-borate horizontal slab gels or 8% (wt/vol) polyacrylamide–Tris-borate gels. The purification of DNA fragments was carried out by electroelution (29).
The 153-bp DNA segment containing the intergenic region between cI and putative cro genes was obtained by PCR amplification with the primers 5′-TGGATTGCCTCCTTTCGTTTC-3′ and 5′-ACCTCAAGAATGATTTTAACAC CG-3′. The amplified DNA fragment was purified and then cloned into HincII-cleaved pUC18 to generate pUO183. A 183-bp BamHI-HindIII segment containing the 153-bp intergenic region was purified by electroelution and end labeled by filling in the staggered ends with T7 DNA polymerase in the presence of [α-32P]dCTP (3,000 Ci/mmol; Amersham) and cold dTTP, dATP, and dGTP.
Plasmid pET11a-cI was constructed as follows: primers 5′-GAGGTGAGACATATGAAAAC-3′, which includes the starting point for the translation of cI, and 5′-CAGCTTTTAACGTGGATCCGGG-3′, which corresponds to a sequence located downstream of it, were used to amplify the encompassing region. The primers were designed to introduce NdeI and BamHI restriction sites (underlined). The amplified DNA segment was purified, digested with the above enzymes, and ligated to NdeI-BamHI-cleaved pET11a, and the ligation mixture was transferred into E. coli BL21(DE3)/pLys.
Protein purification.
The overexpression of CI was achieved by the addition of 1 mM IPTG (isopropyl-β-d-thiogalactopyranoside) (Boehringer Mannheim) to exponentially growing cultures of E. coli BL21(DE3)/pLys carrying pET11a-cI. After 30 min, rifampin was added (to a final concentration of 200 μg/ml), and the cells were further incubated for 90 min. The cells were harvested, resuspended in 25 ml of buffer A (50 mM Tris-HCl [pH 7.5], 10 mM MgCl2, 1 mM dithiothreitol [DTT], 0.1% Tween 20) per liter of culture containing 1 M NaCl, and broken by passage through a French press. During the purification procedure all steps were performed at 4°C. Crude extracts (total protein concentration of about 20 mg/ml) were centrifuged (12,000 × g for 30 min), the supernatant was discarded, and the pellet was washed twice with 25 ml of buffer A. The resulting pellet was thoroughly resuspended in the same volume of buffer A containing 1 M NaCl, until complete dissolution was obtained, and was then diluted four times in buffer A to achieve a final concentration of 250 mM NaCl. This sample was loaded onto a Q-Sepharose column (Pharmacia) equilibrated with the same buffer without DTT. The column was washed with 10 column volumes of buffer and eluted with a gradient of increasing salt concentrations (250 mM to 1 M NaCl). The fractions containing pure CI (as judged by sodium dodecyl sulfate-polyacrylamide gel electrophoresis [SDS-PAGE]) were pooled, diluted in glycerol (50% final concentration), and stored at −20°C. The protein was measured by using the Bio-Rad protein assay.
The CI protein was analyzed by matrix-assisted laser desorption–ionization–time of flight (MALDI/TOF) mass spectrometry with dihydroxybenzoic acid as the matrix on the HP G2025A MALDI/TOF system (Hewlett-Packard). The residual fractions were analyzed by peptide sequence analysis with the HP G1005A protein sequencing system (Hewlett-Packard).
Filter binding assays.
The formation of DNA-protein complexes was measured as described previously (11). In short, the standard reaction was performed for 30 min at 30°C, and the mixture contained 475 pg (81 pM) of the 32P-labeled 183-bp DNA segment (see above) and 126 ng (100 nM) of CI in a total volume of 50 μl of buffer B (50 mM Tris-HCl [pH 7.5], 10 mM MgCl2, 0.01% Tween 20, 100 mM NaCl, 5% glycerol), unless stated otherwise. Buffer B (1 ml) was added to stop the reaction, and the mixture was filtered and extensively washed with buffer B. Filters were dried, and the radioactivity bound to them was determined by scintillation counting. The DNA retained on the filter was corrected for the retention of radioactively labeled DNA in the absence of protein (1 to 3%). The specific activity of the labeled DNA was measured as trichloroacetic acid-precipitable material. All reactions were performed in duplicate.
Electrophoretic mobility shift assay (EMSA).
The end-labeled 183-bp DNA fragment (240 pg or 81 pM) was incubated with increasing amounts of CI protein in 25 μl of buffer B at 30°C for 30 min, in the presence of poly(dI)-poly(dC) as an unspecific competitor (at a final concentration of 4 ng/μl). The reaction mixture was loaded onto a 5% (wt/vol) nondenaturing polyacrylamide gel. Similar reaction conditions were used with the Bacillus subtilis vegetative RNA polymerase (ςA-RNAP) and in the competition experiments between ςA-RNAP and CI, except that the reaction mixture was loaded onto a 4.5% (wt/vol) nondenaturing polyacrylamide gel. Gels were run at 100 V in TAE buffer (40 mM Tris-acetate, 1 mM EDTA [pH 8]) at room temperature. Gels were vacuum dried and analyzed by autoradiography. Quantification of the repressor-operator complexes separated in these gels was performed by using an Instant Imager (Packard). The degree of DNA-protein hybrid formation was quantified by dividing the amount of complex formed by the amount of residual free DNA.
DNase I footprinting.
The EcoRI-SphI or HindIII-KpnI DNA fragments obtained from pUO183 were end labeled at the EcoRI or HindIII sites with Klenow DNA polymerase and [α-32P]dATP (3,000 Ci/mmol; Amersham). End-labeled DNA (81 pM) was incubated for 30 min at 30°C in the absence or presence of CI and/or B. subtilis ςA-RNAP in 20 μl of buffer B plus poly(dI)-poly(dC) as an unspecific competitor (at a final concentration of 50 ng/μl), followed by the addition of freshly diluted DNase I (Boehringer Mannheim) (at a concentration to obtain, on average, one cut per molecule). The mixture was incubated at 30°C for 3 min, and the digestion was stopped by the addition of 1 μl of 0.5 M EDTA, pH 8. The DNA was precipitated, redissolved in a loading buffer, electrophoresed on a 6% denaturing polyacrylamide gel, and autoradiographed. Chemical sequencing reactions (22) for purines, obtained by an express protocol (2), were run in parallel to determine the sizes of the DNA fragments generated.
In vitro runoff transcription assays.
Plasmid pUO183 digested with XmnI was used as a template for in vitro transcription assays. The reaction mixtures contained, in 25 μl of a solution consisting of 3 nM DNA, 0.2 mM each ATP, CTP, GTP, and UTP, 25 mM Tris-HCl (pH 7.5), 10 mM MgCl2, 90 mM ammonium sulfate, 2 mM DTT, 7.5 U of RNasin (Promega), 30 nM B. subtilis ςA-RNAP, and different amounts of CI. After 30 min of incubation at 30°C, the reactions were stopped with 1 μl of 0.5 M EDTA, pH 8. The RNAs were precipitated and then analyzed by primer extension as follows. The pellet was dissolved in 10 μl of a solution containing 50 mM Tris-HCl (pH 7.5), 40 mM KCl, 7 mM magnesium acetate, 2 mM DTT, 200 μM each dCTP, dGTP, and dTTP, 100 μM [α-32P]dATP (3,000 Ci/mmol), 4 U of avian myeloblastosis virus reverse transcriptase (Promega), 10 U of RNasin, and 0.5 pmol of primers 5′-CGCCAGGGTTTTCCCAGTCACGA-3′, for the PR promoter, and 5′-GCGGATAACAATTTCACACAGG-3′, for the PL promoter. The reaction mixture was incubated at 42°C for 60 min, and the reaction was stopped by the addition of 0.5 μl of 0.5 M EDTA, pH 8, and 100 μl of TE buffer (10 mM Tris, 1 mM EDTA, pH 8). Unincorporated nucleotides were removed by passing the sample through a Sephadex G-50 column. The resulting cDNAs obtained were precipitated, analyzed by denaturing PAGE (6%), and autoradiographed. Chemical sequencing reactions of purines (2, 22) were run in parallel to determine the sizes of the cDNAs obtained.
RESULTS
Purification of the bacteriophage A2 CI repressor.
The CI protein was overexpressed as described in Materials and Methods. Under those conditions most of the CI, which accounted for about 2% of the total cell protein, was in the pellet of the crude extract centrifugations. This allowed the removal of soluble proteins and washing of the protein aggregates, resulting in the solubilization of most proteins coprecipitated with CI. The resulting pellet was solubilized in buffer A containing 1 M NaCl, and the solution was then diluted to lower the salt concentration to 0.25 M. The solubilized CI protein was further purified by a conventional chromatographic step (Q-Sepharose), rendering a product that was more than 95% pure, as judged by SDS-PAGE (data not shown).
Purified CI migrated as a 28,000-Da polypeptide under denaturing conditions, which is slightly more than expected from its size as deduced from the nucleotide sequence of cI (25,277 Da). The native molecular mass of the CI protein was obtained by MALDI/TOF mass spectrometry and turned out to be 25,235 ± 13 Da at nanomolar concentrations, which indicates that CI is a monomer in solution.
CI specifically binds to the A2 cI-cro intergenic DNA segment.
Analysis of the genomic organization of the early region of phage A2 (1, 20) (Fig. 1) revealed that the putative rightward promoter (PR) would transcribe the cro and ant open reading frames, while the leftward promoter (PL) would govern the expression of the genes coding for CI and the site-specific recombination machinery. This organization allowed us to postulate that the decision between lytic and lysogenic development would be critically dependent on the ability of CI to act as the A2 repressor, probably by discriminating among possible operators located between PL and PR. In support of this hypothesis was the finding of a putative helix-turn-helix domain in the NH2-terminal half of CI that might mediate its DNA binding. To test whether the purified CI protein specifically binds to the early control region of the A2 genome, the 153-bp intergenic cI-cro region (obtained as a 183-bp DNA segment) was incubated with the CI protein and the mixture was subjected to filter binding assays.
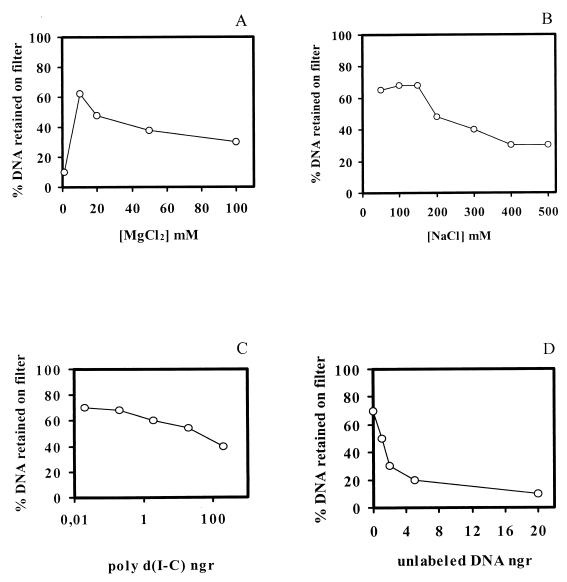
The CI protein-DNA complex could be trapped on nitrocellulose filters, which allowed quantification of the affinity between its components. CI-DNA complex formation was strictly dependent on the presence of Mg2+, with an optimum concentration at 10 mM (Fig. 2A). The extent of the reaction was partially reduced by concentrations of NaCl above 150 mM (Fig. 2B), while the presence of Tween 20 (0.1 to 1%) in the reaction mixture had no significant effect on complex formation (data not shown). The binding of CI to the DNA segment was completed in 20 min (at least 80% of the radioactivity applied was retained by the filters).
FIG. 2.
Parameters involved in CI-DNA complex formation as detected with a filter binding assay. The CI binding parameter measured is indicated under each panel. Analytical binding reactions were performed in a 50-μl volume with 81 pM 183-bp [32P]DNA segment (475 pg) that comprises the cI-cro intergenic region and 100 nM CI (126 ng). The DNA retained on the filter was corrected for the retention of radiolabeled DNA in the absence of CI (about 2% of total DNA input).
The specificity of the binding between the cI-cro intergenic segment and CI was tested by determining the ability of unlabeled DNA molecules to act as competitors. Nonspecific DNA [poly(dI)-poly(dC) ranging from 10 pg to 200 ng] only partially abolished the binding, even at concentrations 400-fold in excess (Fig. 2C). On the contrary, when the competitor DNA was specific (i.e., a nonlabeled 183-bp segment), competition was readily observed (Fig. 2D). A 10-fold excess of specific competitor DNA reduced CI-DNA complex formation to background levels.
Cooperative binding of CI to the cI-cro intergenic region.
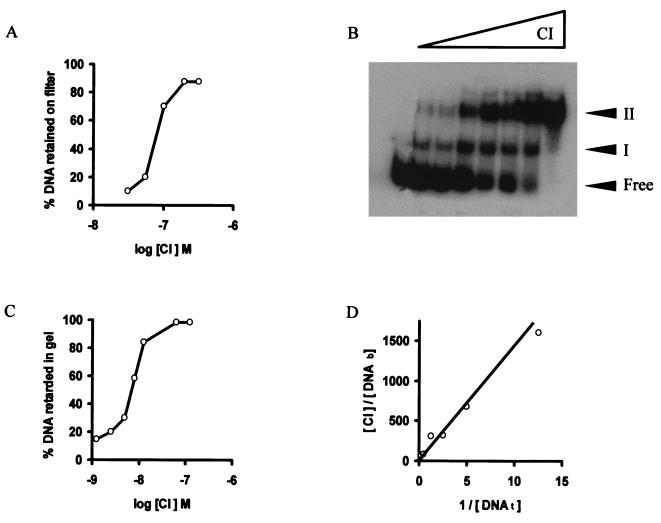
The rate of CI-DNA complex formation was determined as a function of CI concentration (Fig. 3A). The dependence of the DNA retention on protein concentration appeared to follow a sigmoidal curve. The apparent equilibrium constant (Kapp) of the CI-cI-cro-DNA complex is estimated to be 80 nM at pH 7.5 and 30°C, whereas the Kapp for nonspecific DNA is about 100 μM. The sigmoidal form of the curve suggested that the CI protein binds cooperatively to the cI-cro intergenic DNA segment.
FIG. 3.
Determination of the affinity between CI and the cI-cro intergenic DNA segment. The reaction mixtures were incubated for 30 min at 30°C. (A) Trapping of the 32P-labeled 183-bp DNA segment (81 pM) on membrane filters in the presence of increasing concentrations of CI. (B) Gel shift assay of the complexes formed by increasing concentrations of CI (0, 1, 2, 4, 6, 8, 10, and 50 nM) and the DNA in the presence of a 400-fold excess of nonspecific [poly(dI)-poly(dC)] competitor DNA. The unbound probe (Free) and the protein-DNA complexes (I and II) are indicated. (C) Fraction of DNA bound by increasing concentrations of CI obtained from quantification of the phosphorimage of the autoradiograph shown in panel B. (D) Binding of CI (7 nM) to increasing concentrations of DNA. [CI] is the total protein concentration, [DNAb] is the concentration of substrate bound to CI, and [DNAt] is the total substrate concentration.
To measure the affinity of CI for its cognate site by a different method and to learn about the type of complexes formed, an EMSA was used. Pure CI became specifically bound to the DNA segment, originating two bands (Fig. 3B) with retarded electrophoretic mobilities. Complex I was preferentially formed at low protein concentrations, whereas at high protein concentrations only complex II was detected. The rate of CI-DNA complex formation was determined as a function of CI concentration (Fig. 3C). The dependence of the DNA retardation on the concentration of the protein followed a sigmoidal curve, from which a Kapp of 7 nM at pH 7.5 and 30°C was deduced. The slope of the curve was similar to the one observed from the filter binding experiments (Fig. 3A), indicating again a cooperative binding of CI, although its Kapp is about 10 times higher than when the EMSA was used. As a means to determine which of the Kapp values is closer to reality, we measured CI-DNA complex formation under conditions in which the amount of substrate DNA was varied in the presence of a constant concentration of CI. As shown in Fig. 3D, the data were plotted as the total protein concentration divided by the concentration of bound substrate versus the inverse of the total DNA concentration. The slope of the line provided the disassociation constant (KD = 10 nM) for CI binding, assuming that each CI monomer had one functional DNA binding site. This value is very similar to the one obtained by EMSA at different concentrations of CI.
A quantitative measurement of the cooperative binding of CI to the DNA was obtained by calculating the cooperativity factor, τ, according to the following equation: τ = 4(F)(2R)/(1R)2 (34). The advantage of this method is that it allows for internal controls, because all the necessary data are obtained from within a single lane. Therefore, τ can be calculated for each of the lanes, simply by quantifying the amount of DNA: unbound (F), bound to one molecule of CI (1R), and bound to two or more molecules of CI (2R). The cooperativity factor is defined as the extent to which the formation of the doubly bound complex exceeds the formation of the singly bound complex. Theoretically, a value of τ greater or less than 1 indicates, respectively, positive or negative cooperativity, whereas a value equal to 1 indicates a lack of cooperativity. The value calculated from the data presented in Fig. 3B (τ = 9.97 ± 0.59) indicates that CI probably is a protein that binds cooperatively to its cognate sites.
CI binds to three discrete sites.
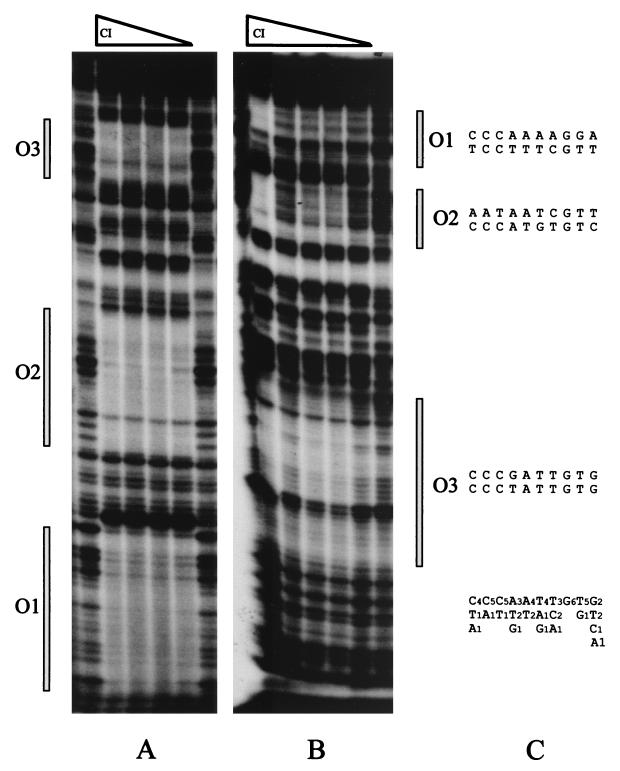
For determination of the precise location of the sequences recognized by CI, the CI-DNA complexes formed with the cI-cro intergenic region were analyzed by DNase I footprints. The top strand contained three domains of CI protection of 22, 34, and 38 bp. These were separated from each other by 12- and 38-bp intervals (Fig. 4A; also see Fig. 8). Within this interspaced region, phosphodiester bonds hypersensitive to DNase I cleavage were identified. One of them was located between O1 and O2. The several hypersensitive sites between O2 and O3 are separated from each other by 10 ± 1 nucleotides, which is about one helical turn (assuming 10.5 bp per turn) in double-stranded DNA.
FIG. 4.
DNase I footprinting analysis of CI-DNA complexes. (A) The 172-bp EcoRI-SphI DNA fragment (top strand) from plasmid pUO183 containing the 153-bp cro-cI intergenic region from A2 was incubated with 3.5, 7, 14, and 28 nM CI. (B) The 166-bp HindIII-KpnI segment (bottom strand) was incubated with 3.5, 7, 14, 28, and 56 nM CI. The DNA fragments were end labeled at the HindIII or EcoRI restriction sites and partially digested with DNase I. The operator sites are indicated. A DNA sequencing ladder was used to determine the DNA fragment lengths. (C) The DNA half-sites of the inverted repeated sequences of the CI proposed operators are aligned. Conserved bases and their frequencies are indicated below the sequences.
FIG. 8.
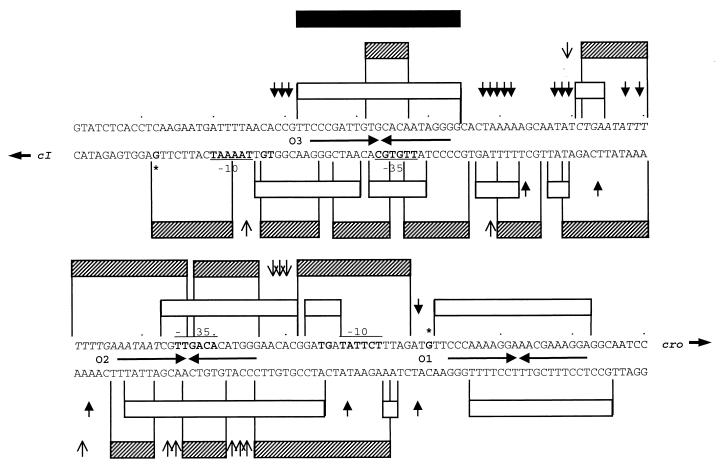
Scheme of the stretches protected by CI (white bars) and ςA-RNAP (cross-hatched bars) in the cI-cro intergenic region of phage A2, based on the data shown in Fig. 4 and 7. In addition, the start points of transcription (∗), the −10 and −35 regions of the PR and PL promoters (from the primer extension data shown in Fig. 5), and the UP-like sequence of PR (nucleotides in italics) are indicated. The inverted repeated sequences of the operators are shown by converging arrows, and hypersensitive sites are indicated by pointing arrows (filled for CI and open for ςA-RNAP). The black bar indicates the ςA-RNAP protected region in the presence of low CI concentrations.
The bottom strand also exhibited three protected stretches (Fig. 4B). Here again, the protected domains are interspaced by sites hypersensitive to DNase I cleavage. These periodic anomalies in the DNase I cleavage pattern imply that the DNA is deformed by CI binding (reviewed in reference 30).
The amount of CI required to protect the three cognate sites is at least threefold smaller than when EMSA experiments were performed (3.5 nM, versus 10 nM in EMSA). Under these conditions about 40 CI monomers per DNA molecule (81 pM) were present in the footprint reaction.
To identify the peculiar characteristics in the DNA sequences that determine CI binding, these three protected regions were examined for common sequence elements. Three sets of inverted repeated regions that are not perfectly symmetric were identified. Regardless of whether we split each arm of the repeat into two half-sites (as done in the case of the lambdoid operator sites; see reference 27) and align them as shown in Fig. 4C, a recognition pattern emerges: C4C5C5A3A4T4T3G6T5G2. We call these unique inverted repeated sequences O1, O2, and O3, and the intergenic region between cI and cro is termed the genetic switch region, in accordance with the λ nomenclature (reviewed in reference 27).
Localization and characterization of the promoters of the genetic switch region.
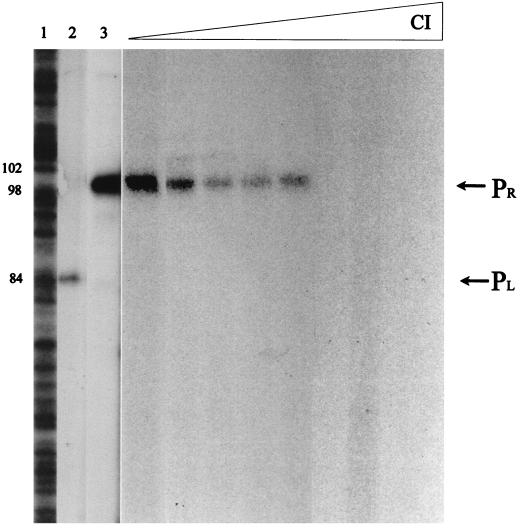
Northern blot hybridization analysis of the mRNAs produced from the genetic switch region, together with a visual inspection of its nucleotide sequence, suggested that the promoters of cI and cro were located in this intergenic region and were divergently orientated (20) (Fig. 1). To map the transcription start points of the two promoters, in vitro transcription runoff experiments were performed with ςA-RNAP and linearized pUO183, which contains the 153-bp segment of the genetic switch region, as a template DNA. After primer extension of the in vitro-transcribed products with the oligonucleotides described in Materials and Methods, we obtained two cDNA bands corresponding to segments of 84 and 100 nucleotides from the left- and right-oriented promoters, respectively (Fig. 5). These promoters were consequently named PL and PR. The cDNA bands seemed to indicate that the transcript from PR would be about 10 times more abundant than the one from PL. The 5′ ends of transcription of these mRNA species map at guanosine nucleotides located at positions 12 and 130 (see Fig. 8). In both cases, 7 bp upstream from the transcription start sites, extended −10 consensus sequences (with TG dinucleotides at positions −14 and −15) were observed. These were separated by canonical 14-bp stretches from −35 consensus hexamers. Stretches of about 20 bp rich in A+T nucleotides could be predicted immediately upstream of the −35 hexamers (12). Consequently, all the crucial elements for RNAP promoter recognition in gram-positive bacteria, located near positions −59 to −38, −35, −14, −15, and −10 relative to the transcription start sites, were identified at both PL and PR (12, 15, 23, 33) (see Fig. 8). It is likely, therefore, that the data obtained from this work with the B. subtilis ςA-RNAP would correspond to those that might be obtained if RNAP from Lactobacillus was used.
FIG. 5.
Location of the transcription start sites in the cro-cI intergenic segment of phage A2 and role of CI in regulation of the PR promoter. B. subtilis ςA-RNAP (30 nM) and linearized pUO183 DNA (3 nM) were used for the in vitro generation of cI (lane 2) and cro (lane 3) runoff transcripts, and the resulting mRNAs were subjected to primer extension with reverse transcriptase in the presence of [α-32P]dATP. Maxam and Gilbert (G+A) sequencing reactions were used as size standards (lane 1). The sizes of the cDNAs obtained are indicated. Successive lanes show the effects of increasing concentrations of CI (3.7, 7.4, 29.6, 59.2, 118.5, 177, 237, and 474 nM, respectively) on cro-specific transcript generation.
As shown in Fig. 1, PR would transcribe the early lytic operon, including cro and ant, while PL would be responsible for cI expression.
CI represses transcription from the PR promoter.
The CI repressor of lambdoid phages is known to repress the transcription of early lytic genes and stimulate its own transcription by binding to its operator sites (reviewed in reference 27). Consequently, a likely role for the A2 CI protein would be to repress the transcription of the PR promoter. To address this question, we used B. subtilis ςA-RNAP and linearized pUO183 DNA (3 nM) to follow, by in vitro transcription assays, the expression of PR in the presence of increasing amounts of CI. As shown in Fig. 5, CI reduced PR utilization, in a concentration-dependent process, until no expression was detected. We estimated that 2.5 CI monomers (7.4 nM) per DNA molecule were enough to detect some repression from PR, while about 60 polypeptides (180 nM) were needed to block it completely.
CI concentrations in excess of those that repress PR (up to 480 nM) did not affect the expression of an unrelated promoter (data not shown), therefore ruling out the possibility that the repression effect on PR was be due to a nonspecific binding of CI to DNA or to the presence of contaminating RNases in the CI protein preparation.
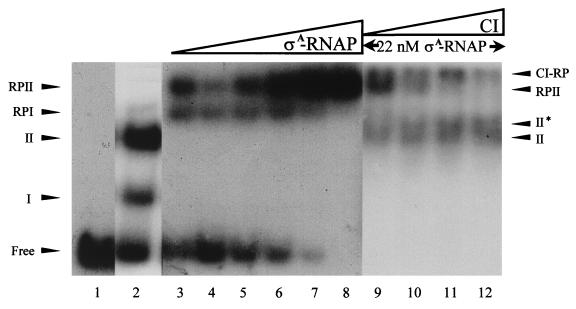
Since the −35 hexamer of PR is embedded in O2 and O1 is located immediately after its transcription start (see Fig. 8), it might be possible that CI repressed transcription from PR, either by excluding the RNA polymerase (steric hindrance) or by holding it at the promoter in such a way that it could not start transcription. To analyze these two hypotheses EMSA experiments were performed (Fig. 6). When ςA-RNAP (13 to 34 nM) was incubated with the 153-bp A2 DNA segment (81 pM) two complexes (RPI and RPII) were readily detected, but at a high protein concentration (44 nM) only the RPII complex was observed. The Kapp of the ςA-RNAP–DNA complex, which was estimated to be at a concentration of 20 nM at pH 7.5 and 30°C, is about threefold higher than the Kapp values obtained for the CI-DNA complexes (Fig. 3C). When the ςA-RNAP concentration was limiting (22 nM), the rate of protein-DNA complex formation was enhanced by the addition of CI at concentrations as low as 2.7 nM (Fig. 6, lanes 2, 5, and 9), with the subsequent formation of complex II (CI-DNA), RPII, and a novel low-mobility complex termed CI-RP. At a CI concentration approaching the KD (11 nM) (Fig. 6, lane 11), diffuse complexes II (II + II*) and CI-RP complexes were observed. This result was obtained independently of the order of addition of the proteins; i.e., CI and ςA-RNAP could remain bound to the DNA substrate. It is likely, therefore, that (i) ςA-RNAP binds to two discrete, nonoverlapping sites in the DNA fragment, (ii) both CI and ςA-RNAP coexist on the intergenic 153-bp cI-cro DNA fragment, and (iii) CI and ςA-RNAP interact.
FIG. 6.
Binding of CI and ςA-RNAP to their cognate binding sites. The α-32P-labeled 183-bp DNA segment (81 pM) was incubated with CI (6 nM) (lane 2) and increasing concentrations of ςA-RNAP (13, 17.5, 22, 26.5, 34, and 44 nM) (lanes 3 to 8) or with 22 nM of ςA-RNAP and increasing CI concentrations (2.7, 5.6, 11, and 22 nM). The unbound probe (Free), the CI-DNA complexes (I and II), ςA-RNAP–DNA (RPI and RPII), and the ternary complex CI–ςA-RNAP–DNA (II* and CI-RP) are indicated. Lane 1, unbound DNA probe.
CI relocates the RNA polymerase to the cI-cro intergenic region.
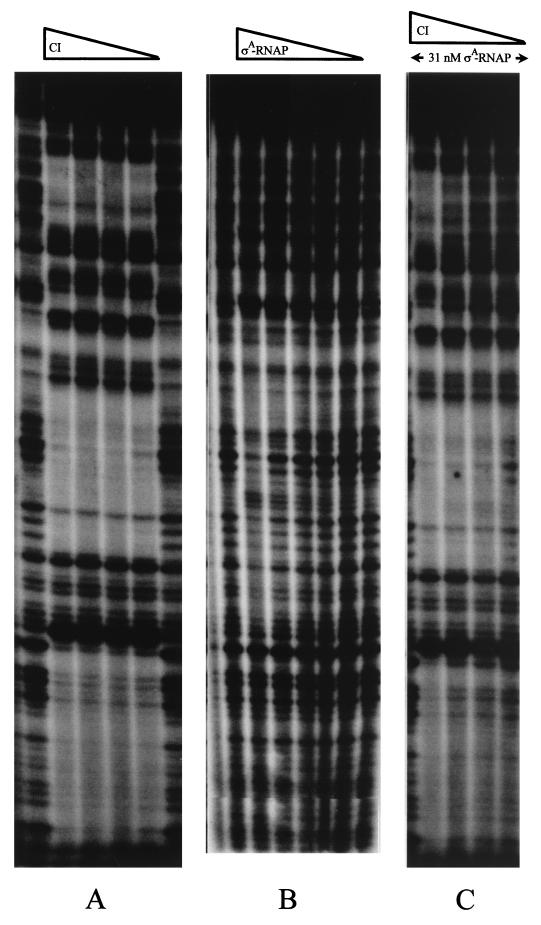
The PR and PL divergent promoters are 81 bp apart and thus are located on the same face of the DNA helix. To investigate the type of complexes formed by CI, ςA-RNAP, or both proteins on the intergenic 153-bp cI-cro DNA fragment, DNase I footprinting experiments were performed. The binding of CI to DNA gives a characteristic DNase I protection pattern already shown in Fig. 4 (Fig. 7A), while ςA-RNAP shows an extended protection (about 40 bp), in the region where O2 and the PR promoter overlap, at concentrations of 15 nM and up (Fig. 7B).
FIG. 7.
Effect of CI on ςA-RNAP binding to the intergenic cI-cro segment of A2, as seen through DNase I footprinting analysis. The 172-bp EcoRI-SphI DNA fragment (top strand) from plasmid pUO183 was end labeled at the EcoRI restriction site and incubated with 3.5, 7, 14, or 28 nM CI (A), with 3.9, 7.8, 15.5, 31, or 62 nM ςA-RNAP (B), or with 31 nM ςA-RNAP plus 3.5, 7, 14, or 28 nM CI (C). In this last case the RNAP was incubated with the DNA for 15 min prior to the addition of CI.
In the presence of a constant amount of ςA-RNAP (31 nM) and increasing concentrations of CI, a protection pattern is observed that differs from the picture obtained with each of the proteins (Fig. 7C). ςA-RNAP does not alter the CI footprint at the O1 and O2 sites; this means that the polymerase becomes displaced from its binding site at PR (which overlaps with O2) even at low concentrations of the repressor (3.5 nM). However, the polymerase competes with CI at the O3 site (which covers most of PL), as is indicated by the change in the pattern of CI protection in the presence of ςA-RNAP (a typical CI footprint at the O3 site requires that its concentration be about eightfold higher [28 nM] than when ςA-RNAP is not present in the reaction mixture [Fig. 7C and 8]). It is likely, therefore, that ςA-RNAP interacts with the PR promoter in the absence of CI but that in its presence, at a low concentration, the polymerase would become relocated to interact with the PL promoter.
The combined data of gel retardation and DNase I footprint experiments suggest that, in the absence of CI, ςA-RNAP interacts first with PR, forming the complex RPI (Fig. 6). As its concentration increases, the polymerase would bind both promoters (RPII). However, in the presence of CI at a low concentration (from 2.7 nM), ςA-RNAP would become displaced from PR, due to the higher affinity of the repressor for O1 and O2. As a consequence, transcription from the early PR promoter would be repressed. CI, in turn, would interact with ςA-RNAP to relocate it, by an as yet unidentified mechanism, on the PL promoter originating the complex CI-RP (Fig. 6) and presumably activating transcription from PL. Finally, when the CI concentration increases to cause occupancy of O3, transcription from PL would become prevented.
DISCUSSION
The deleterious effect of bacteriophages on industrial processes that rely on the activity of lactic acid bacteria is fuelling the interest in their biology as a first step towards devising rational interference systems that abolish phage development. Furthermore, phages may be a source of genetic tools for these bacteria. The utility of the CI product in strain defense (reference 20 and unpublished data) has moved us to undertake an in-depth study of the regulation of the early processes that lead to either the lytic or lysogenic cycle of phage A2.
Northern blots from the A2 immunity region made in vivo (20) and in vitro transcription experiments showed that it is centered around a 153-bp segment comprised of the structural portions of the divergently transcribed cro and cI genes (Fig. 1). In front of these genes there appeared the corresponding promoters, PR and PL, respectively. Interspersed with these two promoters are three discrete, nonoverlapping, operator sites (O1, O2, and O3) to which the CI protein was shown to bind specifically. Each of these operator sequences contains a 20-bp imperfect inverted repeated sequence with a dyad axis of symmetry. This organization suggests that CI, which is a monomer in solution, could dimerize on the DNA through recognition of each of the sides of the inverted repeats. The relative locations of promoters and operators are as follows: O1 is centered 13 bp downstream from the transcription start point of PR, while O2 and O3 have their axes of symmetry 33.5 and 86.5 bp upstream from that point and have embedded the −35 hexamers of PR and PL, respectively (Fig. 8). At low concentrations, CI formed two complexes with the intergenic cI-cro DNA segment, while only the most retarded one was observed at high CI concentrations (Fig. 3). The absence of a third intermediate complex suggests the strong cooperative binding of CI to two operator sequences, probably O1 and O2, based on its higher affinity to them than to O3 (Fig. 4 and 7). This cooperative binding of CI probably provokes bending of the DNA, as judged by the pattern of increased sensitivity to DNase I cleavage with a periodicity of about 10 bp that occurs between the O2 and O3 sites (Fig. 4). However, the O1 and O2 sites are separated by a nonintegral number of turns in the DNA helix (the center-to-center distance is 46.5 bp, which means 4.4 turns), so we have to assume that the helix undergoes an unfavorable twisting process upon CI binding. At present the energetic cost of looping between these two high-affinity operator sites is unknown. On the other hand, O2 and O3 lay on the same face of the DNA, thus favoring DNA looping (the center-to-center distance is about 52.5 bp, i.e., 5 helix turns).
The overall organization of the genetic switch region appears to be significantly similar to the functionally homologous stretches of other bacteriophages, although in most of these the operators are uniformly spaced (14, 18, 26). However, the lambdoid phages HK022 and φ80 also show asymmetric spacing (8, 25). Furthermore, A2 operators partially differ in their sequences, a feature previously thought to be important in phage λ for the lysis-lysogeny decision, since they seem to be involved in the different affinities of CI and Cro for these sites.
The phage A2 CI protein represses PR through binding to O1 and O2, which results in the displacement of the RNAP from its normal position, from nucleotide −2 to −50 upstream of the transcription start point of PR, to place it on the PL promoter, which presumably would result in the enhancement of cI transcription. However, at high concentrations of CI, even O3 becomes occupied, which in turn provokes displacement of the RNAP from PL, resulting in repression of cI.
The general arrangement of the operator sites relative to their promoters indicates that repression of the lytic cycle in phage A2 occurs by a principle similar to that proposed for the lambdoid phages (7, 27) but with clear mechanistic differences. First, the promoters of the lytic-lysogenic commitment of the A2 phage have four elements identified in bacterial promoters: the crucial −35 and −10 hexamers, the −14 to −15 TG dinucleotide which appears to be a basic third element found in a large portion of gram-positive bacterial promoters (15, 33), and a sequence rich in A+T called the UP element, located upstream from the −35 hexamer (6, 23, 28). The UP element, to which the C-terminal domain of the RNAP α subunit (α-CTD) binds, has been located at positions −59 to −38 relative to the transcription start and has the consensus sequence 5′-nnAAA(A/T)(A/T)T(A/T)TTTTnnAAAAnnn-3′ (10). A poor match with an UP element could be predicted in the −59 to −38 interval of PL (8 of 17 nucleotides), whereas an almost perfect match (15 of 17 nucleotides) was observed in the case of the PR promoter (Fig. 8). These last two elements are not present in the promoters of the genetic switch region of bacteriophage λ.
Second, in vitro transcription of the cI gene from the PL promoter of phage A2 takes place in the absence of CI, albeit about 10-fold less abundantly than cro expression which occurs from the PR promoter (Fig. 5). This contrasts with the fate of the repressor synthesis from the PRM promoter in phage λ (13), which requires the presence of the repressor itself.
Third, in the case of phage A2 the spacer regions have 26 bp between O1 and O2 and 32 bp between O2 and O3 (Fig. 8), while in λ these are reduced to 7 and 6 bp, respectively. The λ CI protein activates transcription of cI when bound at OR2 (which is centered at position −42 of promoter PRM) (19, 21, 27). It has been recently shown, by using artificial constructs, that the λ CI repressor bound to OR2 at position −62 upstream of the promoter transcription start point does not activate RNA synthesis, because λ CI cannot contact the ς subunit of RNAP (9). In the case of the A2 phage, we have shown that the CI repressor bound to the O1 and O2 sites (centered at positions −131 and −84.5 of promoter PL) helps in the binding of RNAP to the PL promoter. This might be effected through contact between the α subunit of the B. subtilis RNAP and CI (our unpublished data) which, in the end, would enhance the expression from PL. It is likely, therefore, that this situation is reproduced in vivo when an A2 genome enters a new host cell. As a result of early transcription, CI would bind the O1 and O2 sites, provoking repression of the transcription from the PR promoter by covering part of the surface that must be occupied by ςA-RNAP, leading the phage into a lysogenic cycle. The CI dimers bound to O1-O2 help to position ςA-RNAP at the PL promoter, further enhancing the synthesis of CI until its concentration allows the occupancy of O3, which would result in a halt of transcription from PL. In this way, as it occurs in λ, A2 CI would regulate its own synthesis and the maintenance of the lysogenic state of the cells.
ACKNOWLEDGMENTS
We thank Margarita Salas for the kind gift of B. subtilis ςA-RNAP holoenzyme. The help of Aranzazu Gual and Silvia Fernández during part of this work is very much appreciated.
These studies were partially supported by grants BIOT CT96-0402 of the BIOTECH Programme (European Union) and BIO94-189 from CICYT (Spanish Ministry of Education) to J.E.S. and PB 96-0817 from CICYT and 06G/004/96 from Comunidad Autónoma de Madrid to J.C.A. V.L. was the recipient of an FPI fellowship associated with grant BIO94-189.
REFERENCES
- 1.Alvarez M A, Herrero M, Suárez J E. Site-specific integration of bacteriophage A2 and construction of integrative vectors for lactic acid bacteria. Virology. 1998;250:185–193. doi: 10.1006/viro.1998.9353. [DOI] [PubMed] [Google Scholar]
- 2.Belikov S, Wieslander L. Express protocol for generating G+A sequencing ladders. Nucleic Acids Res. 1995;23:310. doi: 10.1093/nar/23.2.310. [DOI] [PMC free article] [PubMed] [Google Scholar]
- 3.Birnboim H C, Doly J. A rapid alkaline extraction procedure for screening recombinant plasmid DNA. Nucleic Acids Res. 1979;7:1513–1523. doi: 10.1093/nar/7.6.1513. [DOI] [PMC free article] [PubMed] [Google Scholar]
- 4.Boyce J D, Davidson B E, Hillier A J. Identification of prophage genes expressed in lysogens of the Lactococcus lactis bacteriophage BK5-T. Appl Environ Microbiol. 1995;61:4099–4104. doi: 10.1128/aem.61.11.4099-4104.1995. [DOI] [PMC free article] [PubMed] [Google Scholar]
- 5.Bullock W O, Fernández J M, Short J M. XL1-Blue: a high efficiency plasmid transforming recA Escherichia coli strains with beta-galactosidase selection. BioTechniques. 1987;5:376–378. [Google Scholar]
- 6.Busby S, Ebright R H. Promoter structure, promoter recognition, and transcription activation in prokaryotes. Cell. 1994;79:743–746. doi: 10.1016/0092-8674(94)90063-9. [DOI] [PubMed] [Google Scholar]
- 7.Cam K, Oberto J, Weisberg R A. The early promoters of bacteriophage HK022: contrasts and similarities to other lambdoid phages. J Bacteriol. 1991;173:734–740. doi: 10.1128/jb.173.2.734-740.1991. [DOI] [PMC free article] [PubMed] [Google Scholar]
- 8.Carlson P L, Little J W. Highly cooperative DNA binding by the coliphage HK022 repressor. J Mol Biol. 1993;230:1108–1130. doi: 10.1006/jmbi.1993.1229. [DOI] [PubMed] [Google Scholar]
- 9.Dove S L, Joung J K, Hoschild A. Activation of prokaryotic transcription through arbitrary protein-protein contacts. Nature. 1997;386:627–630. doi: 10.1038/386627a0. [DOI] [PubMed] [Google Scholar]
- 10.Estrem S T, Gaal T, Ross W, Gourse R L. Identification of an UP element consensus sequence for bacterial promoters. Proc Natl Acad Sci USA. 1998;95:9761–9766. doi: 10.1073/pnas.95.17.9761. [DOI] [PMC free article] [PubMed] [Google Scholar]
- 11.García P, Alonso J C, Suárez J E. Molecular characterization of the cos region of the Lactobacillus casei bacteriophage A2. Gene product 3, gp3, specifically binds to its downstream cos region. Mol Microbiol. 1997;23:505–514. doi: 10.1046/j.1365-2958.1997.d01-1863.x. [DOI] [PubMed] [Google Scholar]
- 12.Gross C A, Lonetto M, Losick R. Bacterial sigma factors. In: Yamamoto K, McKnight S, editors. Transcriptional regulation. Cold Spring Harbor, N.Y: Cold Spring Harbor Laboratory Press; 1992. pp. 129–176. [Google Scholar]
- 13.Guarente L, Nye J S, Hochschild A, Ptashne M. Mutant lambda phage repressor with a specific defect in its positive control function. Proc Natl Acad Sci USA. 1982;79:2236–2239. doi: 10.1073/pnas.79.7.2236. [DOI] [PMC free article] [PubMed] [Google Scholar]
- 14.Gussin G, Johnson A, Pabo C, Sauer R. Repressor and Cro protein: structure, function, and role in lysogenization. In: Hendrix R W, Roberts J W, Stahl F W, Weisberg R A, editors. Lambda II. Cold Spring Harbor, N.Y: Cold Spring Harbor Laboratory Press; 1983. pp. 93–121. [Google Scholar]
- 15.Helmann J D. Compilation and analysis of Bacillus subtilis ςA-dependent promoter sequences: evidence for extended contact between RNA polymerase and upstream promoter DNA. Nucleic Acids Res. 1995;23:2351–2360. doi: 10.1093/nar/23.13.2351. [DOI] [PMC free article] [PubMed] [Google Scholar]
- 16.Herrero M, de los Reyes-Gavilán C G, Caso J L, Suárez J E. Characterization of 393-A2, a bacteriophage that infects Lactobacillus casei. Microbiology. 1994;140:2585–2590. [Google Scholar]
- 17.Hochschild A, Irwin N, Ptashne M. Repressor structure and the mechanism of positive control. Cell. 1983;32:319–325. doi: 10.1016/0092-8674(83)90451-8. [DOI] [PubMed] [Google Scholar]
- 18.Johnson A D, Poteete A R, Lauer G, Sauer R T, Ackers G K, Ptashne M. λ repressor and Cro components of an efficient molecular switch. Nature. 1981;294:217–223. doi: 10.1038/294217a0. [DOI] [PubMed] [Google Scholar]
- 19.Kuldell N, Hochschild A. Amino acid substitutions in the −35 recognition motif of ς70 that result in defects in phage λ repressor-stimulated transcription. J Bacteriol. 1994;176:2991–2998. doi: 10.1128/jb.176.10.2991-2998.1994. [DOI] [PMC free article] [PubMed] [Google Scholar]
- 20.Ladero V, García P, Bascarán V, Herrero M, Alvarez M, Suárez J E. Identification of the repressor-encoding gene of the Lactobacillus bacteriophage A2. J Bacteriol. 1998;180:3474–3476. doi: 10.1128/jb.180.13.3474-3476.1998. [DOI] [PMC free article] [PubMed] [Google Scholar]
- 21.Li M, Moyle H, Susskind M M. Target of the transcriptional activation function of λ cI protein. Science. 1994;263:75–77. doi: 10.1126/science.8272867. [DOI] [PubMed] [Google Scholar]
- 22.Maxam A M, Gilbert W. Sequencing end-labeled DNA with base-specific chemical cleavages. Methods Enzymol. 1980;65:499–560. doi: 10.1016/s0076-6879(80)65059-9. [DOI] [PubMed] [Google Scholar]
- 23.McAllister C F, Achberger E C. Effect of polyadenine-containing curved DNA affects promoter utilization in B. subtilis. J Biol Chem. 1988;263:11743–11749. [PubMed] [Google Scholar]
- 24.Nauta A, van Sideren D, Karsens M, Smit E, Venema G, Kok J. Inducible gene expression mediated by a repressor-operator system isolated from Lactococcus lactis bacteriophage rlt. Mol Microbiol. 1996;19:1331–1341. doi: 10.1111/j.1365-2958.1996.tb02477.x. [DOI] [PubMed] [Google Scholar]
- 25.Ogawa T, Ogawa H, Tomizawa J. Organization of the early region of bacteriophage φ80. Genes and proteins. J Mol Biol. 1988;202:537–550. doi: 10.1016/0022-2836(88)90284-7. [DOI] [PubMed] [Google Scholar]
- 26.Poteete A R, Ptashne M. Control of transcription by the bacteriophage P22 repressor. J Mol Biol. 1982;157:21–48. doi: 10.1016/0022-2836(82)90511-3. [DOI] [PubMed] [Google Scholar]
- 27.Ptashne M. A genetic switch. Cambridge, Mass: Cell Press and Blackwell Scientific Publications; 1992. [Google Scholar]
- 28.Ross W, Gosink K K, Salomon J, Igarashi K, Zou C, Ishihama A, Severinov K, Gourse R L. A third recognition element in bacterial promoters: DNA binding by the α subunit of RNA polymerase. Science. 1993;262:1407–1413. doi: 10.1126/science.8248780. [DOI] [PubMed] [Google Scholar]
- 29.Sambrook J, Fritsch E F, Maniatis T. Molecular cloning: a laboratory manual. 2nd ed. Cold Spring Harbor, N.Y: Cold Spring Harbor Laboratory Press; 1989. [Google Scholar]
- 30.Schleif R. DNA looping. Annu Rev Biochem. 1992;61:199–223. doi: 10.1146/annurev.bi.61.070192.001215. [DOI] [PubMed] [Google Scholar]
- 31.Studier F W, Rosenberg A H, Dunn J J, Dubendorff J W. Use of T7 RNA polymerase to direct expression of cloned genes. Methods Enzymol. 1990;185:60–89. doi: 10.1016/0076-6879(90)85008-c. [DOI] [PubMed] [Google Scholar]
- 32.van de Guchte M, Daly C, Fitzgerald G F, Arendt E K. Identification of the putative repressor-encoding gene cI of the temperate lactococcal bacteriophage Tuc2009. Gene. 1994;144:93–95. doi: 10.1016/0378-1119(94)90209-7. [DOI] [PubMed] [Google Scholar]
- 33.Voskuil M I, Chambliss G H. The −16 region of Bacillus subtilis and other gram-positive promoters. Nucleic Acids Res. 1998;26:3584–3590. doi: 10.1093/nar/26.15.3584. [DOI] [PMC free article] [PubMed] [Google Scholar]
- 34.Wilson D, Sheng G, Lecuit T, Dostatni N, Desplan C. Cooperative dimerization of paired class homeo domains on DNA. Genes Dev. 1993;7:2120–2134. doi: 10.1101/gad.7.11.2120. [DOI] [PubMed] [Google Scholar]
- 35.Yanisch-Perron C, Vieira J, Messing J. Improved M13 phage cloning vectors and host strains: nucleotide sequences of the M13mp18 and pUC19 vectors. Gene. 1985;33:103–119. doi: 10.1016/0378-1119(85)90120-9. [DOI] [PubMed] [Google Scholar]


